Article

Impact of Soil Compaction on Pore Characteristics and Hydraulic Properties by Using X-Ray CT and Soil Water Retention Curve in China’s Loess Plateau

by
Ahmed Ehab Talat
1,2,
Jian Wang
1,3,* and
Abdelbaset S. El-Sorogy
4,*
1
Institute of Soil and Water Conservation, Northwest A&F University, Yangling 712100, China
2
Soil Science Department, Faculty of Agriculture, Ain Shams University, Cairo 11241, Egypt
3
Institute of Soil and Water Conservation, Chinese Academy of Sciences and Ministry of Water Resources, Yangling 712100, China
4
Geology and Geophysics Department, College of Science, King Saud University, Riyadh 11451, Saudi Arabia
*
Authors to whom correspondence should be addressed.
Water 2025, 17(8), 1144; https://doi.org/10.3390/w17081144
Submission received: 28 February 2025 / Revised: 2 April 2025 / Accepted: 9 April 2025 / Published: 11 April 2025
(This article belongs to the Section Soil and Water)

Abstract

:
The Loess Plateau of China, a region highly vulnerable to erosion and climatic variability, faces significant soil degradation exacerbated by intensive agricultural practices and anthropogenic pressures. This study investigates the impacts of incremental soil compaction (P1–P5) on hydraulic properties, pore structure, and water retention across distinct soil textures (sandy loam, loam, clay loam) to address gaps in understanding texture-specific resilience and soil organic carbon (SOC) interactions. Utilizing X-ray computed tomography (CT), soil water retention curve (SWRC) analysis, and the van Genuchten (vG) model, we quantified compaction-induced changes in porosity, connectivity, and hydraulic conductivity, while comparing unsaturated hydraulic conductivity (Kun) predictions derived from mini disc infiltrometer (MDI) and SWRC parameters. Results revealed that fine-textured, SOC-rich soils had greater compaction, preserving macropore connectivity and saturated hydraulic conductivity (Ks), whereas sandy soils pronounced macropore collapse. Compaction homogenized pore distributions, steepened SWRC, and reduced plant-available water. Integration of CT and SWRC methodologies highlighted CT sensitivity to air-filled macropores versus SWRC’s focus on water-retentive micropores. Strong correlation (R2 = 0.94–0.99) between vG parameters from MDI and SWRC validated parameter robustness, though MDI slightly underestimated Kun in clay loam, while SWRC-based models aligned closely with observed data. Integrating CT and SWRC methodologies offers a framework for precision soil health monitoring. In addition to the critical role of SOC and texture in compaction mitigation, there is a need for organic amendments in sandy soil and reduced tillage.

1. Introduction

Soil structure, porosity, and water retention are fundamental determinants of agricultural productivity, particularly in regions prone to erosion and climatic variability [1,2,3]. The Loess Plateau of China, spanning approximately (64 × 104 km2), represents one of the most erosion-sensitive regions globally, shaped by millennia of aeolian deposition and, more recently, intensive human activities such as overgrazing and deforestation [4,5]. Characterized by a semi-arid to semi-humid climate, the region faces significant challenges from soil degradation, with annual precipitation ranging from 150 to 800 mm, often appearing as high-intensity storms that exacerbate surface runoff and erosion [6,7]. These environmental stressors, compounded by anthropogenic pressures, have led to widespread vegetation loss and reduced soil organic carbon (SOC), further destabilizing soil structure and diminishing hydraulic functionality [5,8].
Soil compaction, a critical consequence of mechanized agriculture and livestock trampling, disrupts pore architecture, reduces water infiltration, and restricts root penetration, thereby threatening agricultural sustainability [9,10]. Compaction collapses macropores (>30 µm), which are vital for hydraulic conductivity and gas exchange, while homogenizing pore size distribution, thereby altering water retention curves and reducing plant-available water [11,12]. Sandy soils, prevalent in northern parts of the Loess Plateau, are particularly vulnerable due to their low aggregate stability and SOC content, whereas clay-rich soils exhibit greater resilience through microporosity and organic–mineral interactions [1,13]. However, the interplay between soil texture, SOC, and compaction effects remains inadequately quantified, especially in transitional climatic zones like the Loess Plateau, where soil responses to mechanical stress are modulated by complex pedoclimatic interactions [14,15].
Recent advances in imaging technologies, such as X-ray computed tomography (CT), and modeling frameworks, including soil water retention curve (SWRC) and van Genuchten (vG) parameters, have developed the study of soil pore networks and hydraulic behavior [2,11]. CT scanning provides high-resolution, three-dimensional visualization of pore structures, enabling precise quantification of CT-based total porosity (φ-CT), connectivity porosity (CP), and pore size distribution under varying compaction levels [16,17]. Concurrently, SWRC offers insights into water retention dynamics, linking matric potential to pore functionality: transmission pores (TP) > 30 µm, storage pores (SP) between 0.5–30 µm, and residual pores (RP) < 0.5 µm, critical for plant-available water and hydraulic conductivity [18,19]. Despite these advancements, few studies have integrated CT-based pore metrics with SWRC-derived parameters to study the multifactorial impacts of compaction across diverse soil textures, leaving gaps in understanding how regional heterogeneity influences compaction resilience [2,20].
This study addresses these gaps by investigating the effects of incremental soil compaction (P1–P5: 1.00–1.40 g cm3) on hydraulic properties, pore characteristics, and water retention across five distinct soil textures in the Loess Plateau. Utilizing a combination of CT, SWRC analysis, and vG modeling, we aim to (1) quantify compaction-induced changes in pore characteristics, SWRC, and hydraulic conductivity; (2) evaluate the role of SOC and soil texture in mitigating structural degradation; (3) assess differences between CT- and SWRC-based porosity metrics; and (4) compare unsaturated hydraulic conductivity (Kun) predictions derived from van Genuchten parameters obtained via mini disc infiltrometer (MDI) measurements by Talat et al. [21] with those estimated from SWRC. We hypothesize that fine-textured, SOC-rich soils will exhibit greater resistance to compaction due to enhanced aggregate stability and microporosity, whereas sandy soils will experience pronounced macropore loss, impairing hydraulic function.
This study provides a framework for tailoring organic amendments, reduced tillage, and conservation practices for soil structure and hydraulic efficiency. Furthermore, the integration of CT and SWRC methodologies advances holistic soil characterization, offering novel insights into pore–water interactions under mechanical stress. As global agricultural intensification and climate variability escalate, such knowledge is critical for mitigating soil degradation and erosion.

2. Materials and Methods

2.1. Soil Description

The study is in the Loess Plateau region in North China. The Loess Plateau is characterized by a vast area of approximately (64 × 104 km2) and a warm or temperate continental climate with extensive monsoon influence. Approximately 60% of annual precipitation averages around 150–800 mm in this region from June to September in the form of high-intensity storms [6]. The annual mean temperature ranges from 3.6 °C in the northwest to 14.3 °C in the southeast. The region spans arid, semi-arid, and semi-humid zones and is considered a semi-arid to semi-humid transitional zone that is sensitive to climate change [7]. The area is encircled by mountains at elevations between 100–3000 m [4]. In addition, over the past decades, human activities, such as excessive land reclamation and overgrazing, have intensified soil erosion and led to significant vegetation loss, and much of the broadleaved deciduous forest and forest-steppe has been converted to grassland and shrubland [5].
The Loess Plateau was divided into five representative sampling sites spanning north to south, each situated within distinct climatic regions and soil categories. These locations—Shenmu (38.51° N, 110.25° E), Suide (37.32° N, 110.16° E), Fuxian (35.58° N, 109.21° E), Chunhua (34.51° N, 108.31° E), and Yangling (34.17° N, 108.03° E)—were analyzed according to the U.S. textural classification system. Shenmu, located in the steppe zone, is dominated by aeolian sandy soil, a composition that exacerbates soil erosion risks due to its climatic and topographical conditions. Suide is a forest-steppe zone that contains loessial soil, which, despite its high fertility, becomes erosion-prone without adequate vegetation cover. Fuxian also features loessial soil, though its enhanced water retention supports richer plant diversity. Similarly, Chunhua has loessial soil that interacts with regional climate patterns to sustain forest ecosystems. Yangling, positioned in a climatic transition zone, displays a mix of loessial and sandy soils, highlighting its ecological variability [15].

2.2. Soil Sampling, Analysis and Compaction

Seventy-five soil samples were collected (5 study sites × 5 treatments × 3 replicates). The samples were taken randomly from the surface layer (0–20 cm) and collected in both disturbed and undisturbed soil cores, each measuring 5 cm in height and diameter. The soil was excavated using a shovel, and the soil cylinder was inserted from both sides with a hammer and then extracted with a soil knife. Key characteristics of the surface layer, including texture, organic carbon content, and aggregate stability, provide vital information for assessing soil’s erodibility and vulnerability to rapid changes over time [22].
Undisturbed soil samples in the soil rings were used to measure initial bulk density by oven-drying [23], the average bulk density being (1.68 ± 0.05, 1.65 ± 0.16, 1.57 ± 0.02, 1.56 ± 0.03, and 1.49 ± 0.05 g cm−3) for each site (Shenmu, Suide, Fuxian, Chunhua, and Yangling) respectively. To determine the soil particle composition, the air-dried soil samples were passed through a 2.0 mm sieve and analyzed via laser diffraction (Mastersizer 2000, Malvern Instruments, Malvern, UK) [24]. Accordingly, the soil texture was determined using the USDA textural triangle with the percentages of sand, silt, and clay; there was soil loam (SL), loam (L), clay loam (CL), clay loam (CL), and clay loam (CL) for each site (Shenmu, Suide, Fuxian, Chunhua, and Yangling), respectively. Additionally, a 0.25 mm sieve was used to measure the SOC content via the dichromate oxidation method [25]. Table 1 shows the mean soil physical properties.
The disturbed soil samples were compacted by applying pressure and hammering on the soil cylinder (5 cm in height and 6.5 cm in diameter) [14]. This was done by artificially compacting the soil at five different levels (P1 = 1.00, P2 = 1.10, P3 = 1.20, P4 = 1.30, and P5 = 1.40 g cm−3), using a standard hammer dropped from a predetermined height onto the sample in its container; the compaction was repeated several times until the desired level was achieved [26]. Each compaction level was tested with three replicates. The selection of these compactions was based on multiple considerations. First, while undisturbed samples provide a realistic representation of in situ conditions, laboratory-prepared samples are essential to systematically evaluate compacted-dependent behaviors and validate their practical applicability. Second, the chosen compactions align with the typical bulk density range documented in the study region [27]. Furthermore, given the Loess Plateau’s susceptibility to erosion, these soil compaction ranges may critically influence soil stability and erosion dynamics, underscoring their ecological relevance.

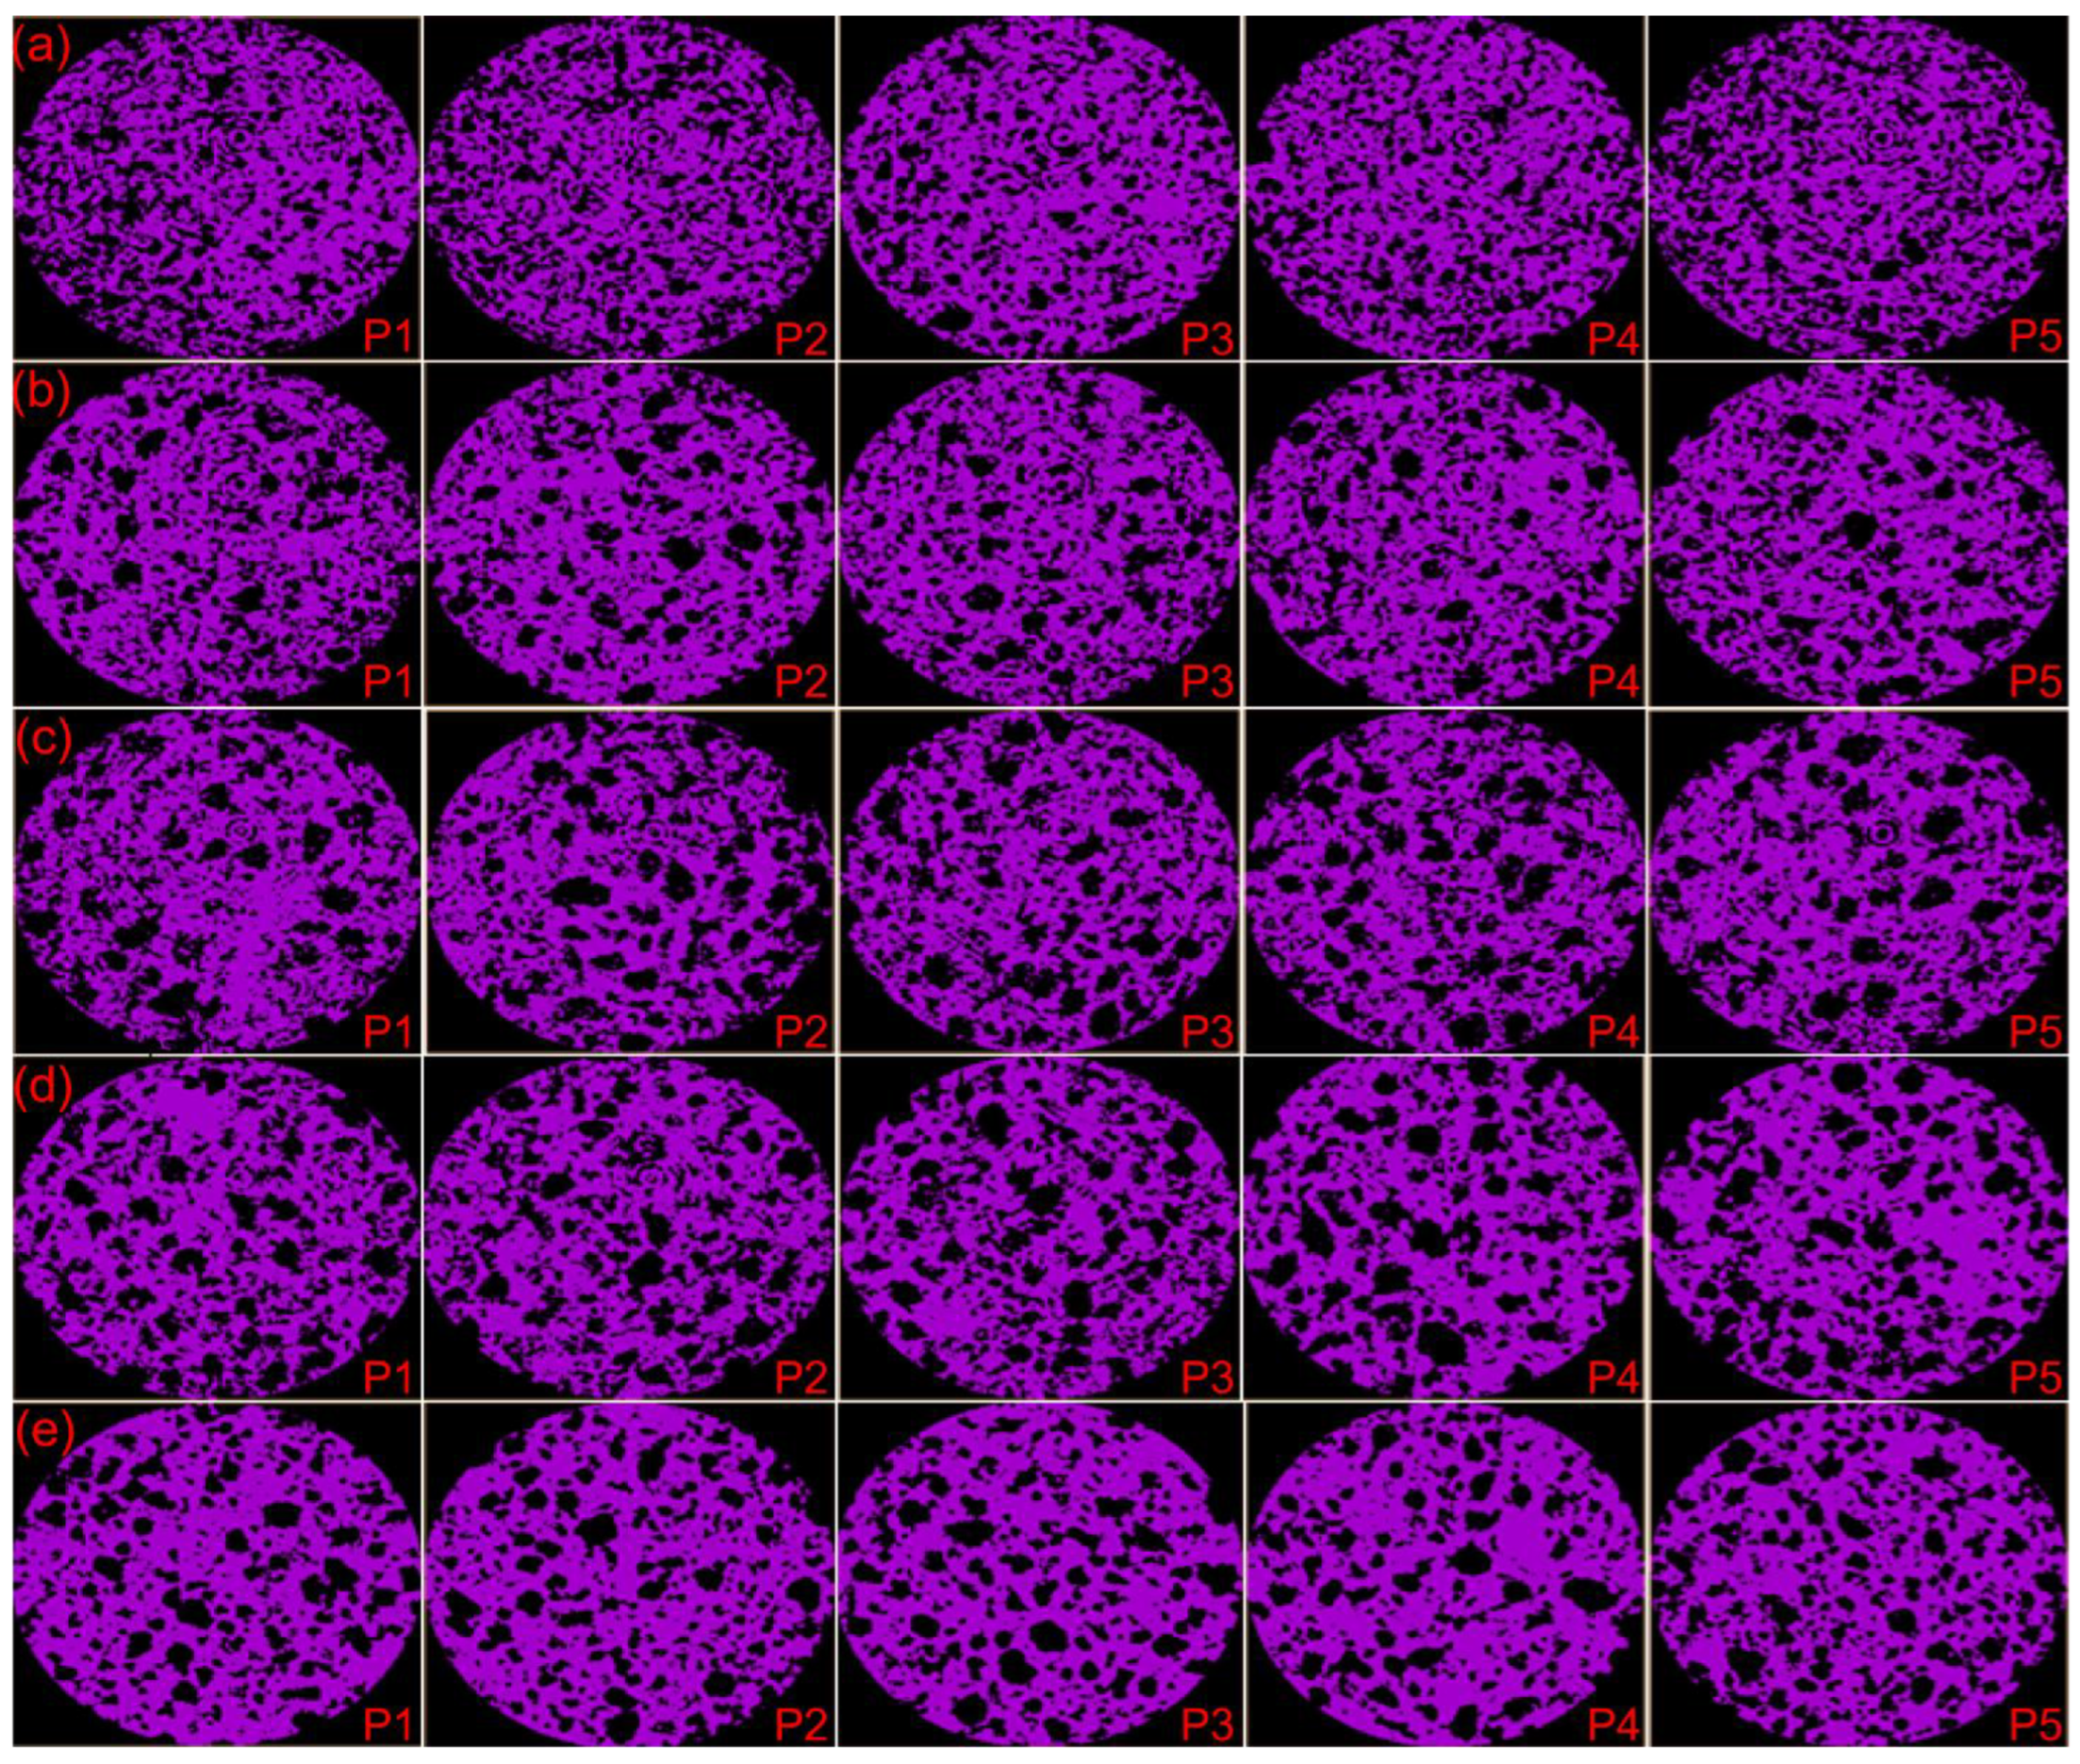
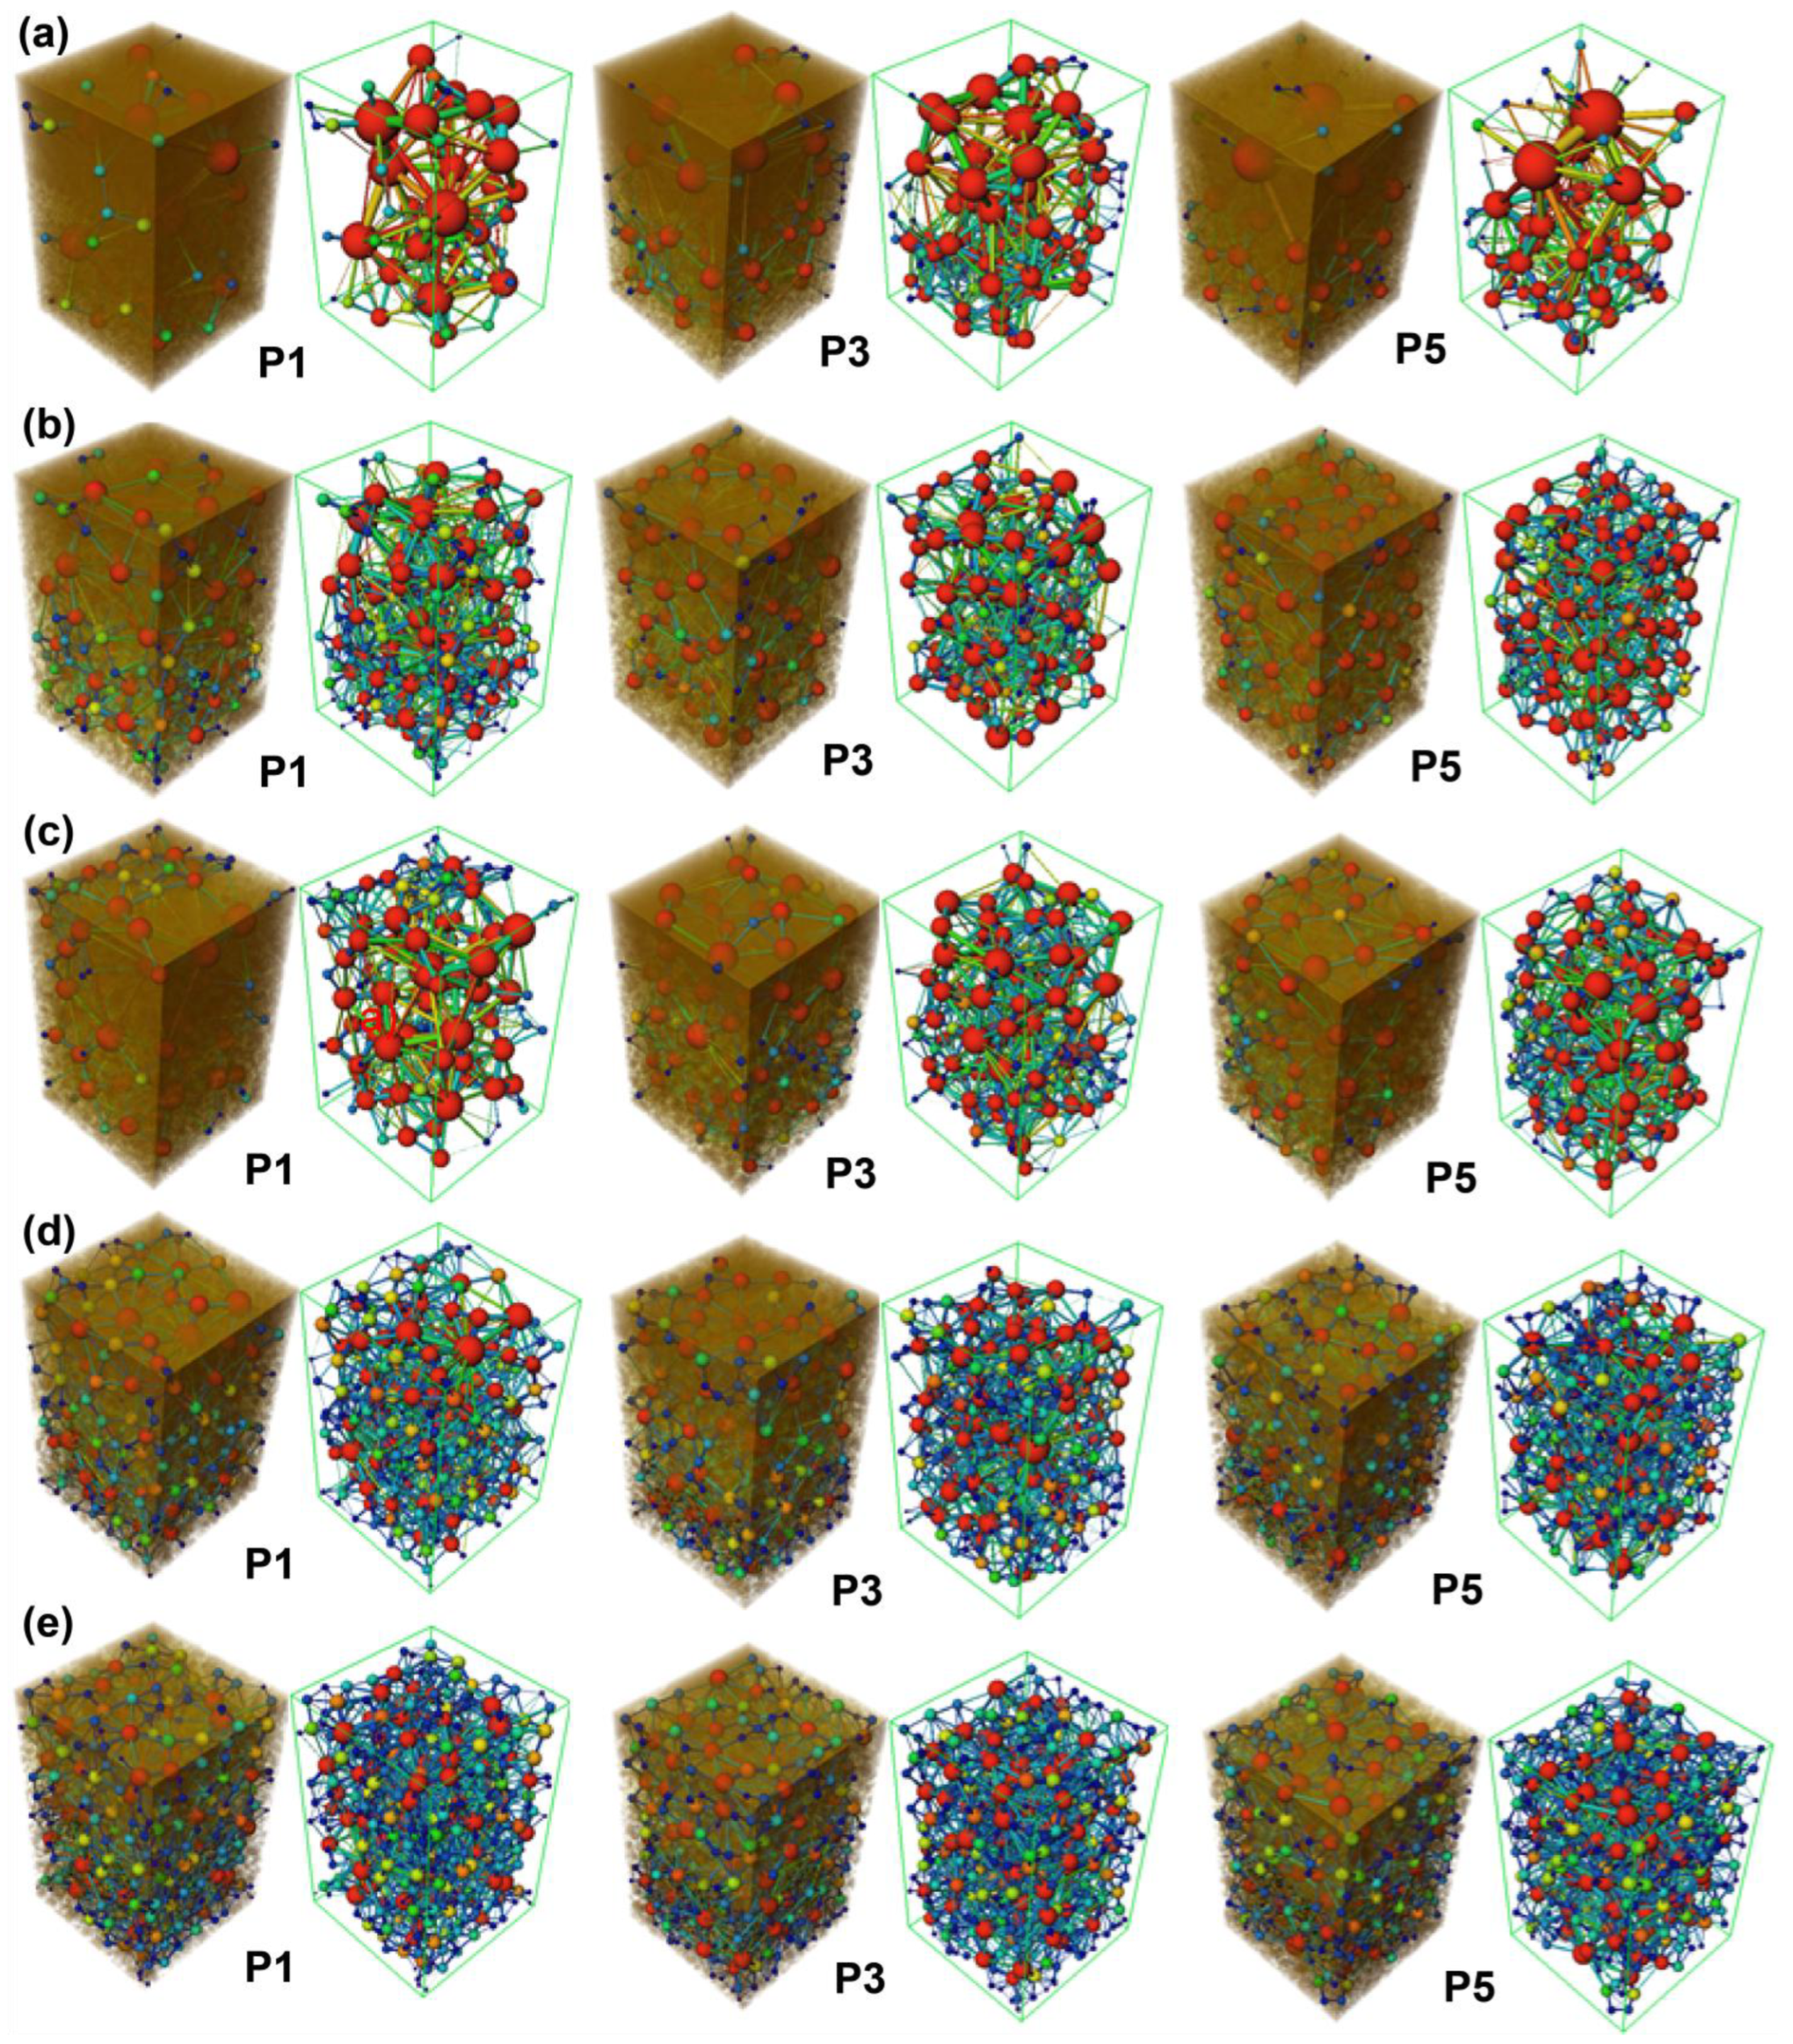
2.3. CT Scanning and Image Analysis

The compacting soil rings were CT tested using a nanoVoxel-1000 desktop CT system (Tianjin Sanying Precision Instruments Co., Ltd., Tianjin, China) at Northwest A&F University a Key Laboratory of the Internet of Things. Scanning parameters included a voltage of 80 kV and a frame rate of 720 Fps, producing 600 grayscale slices per sample at a resolution of 46.69 μm, with each slice containing 1280 × 1280 pixels [16]. Image processing was conducted using Avizo 9.1 software (Thermo Fisher Scientific, Waltham, MA, USA). Raw CT images (RAW) were normalized to minimize lighting and contrast inconsistencies. A standardized region of interest (ROI) measuring 250 × 250 × 400 voxels (13.25 mm × 13.25 mm × 21.2 mm) was selected from all samples to ensure uniform analysis. Two-dimensional purple scale images at varying compaction levels (P1–P5) revealed reduced pore size and connectivity as compaction increased (Figure 1).
Digital filters were applied to enhance pore structure visibility, followed by segmentation to distinguish pores from solid phases. Background Detection Correction addressed grayscale non-uniformity caused by irradiation distance and standardizing image brightness [28]. Pore network modeling (PNM) was performed through automated thresholding algorithm segmented pore spaces, which were then analyzed for size, shape, and connectivity (Axis Connectivity, Volume Fraction). Volume rendering techniques generated 3D visualizations of pore structures [29]. A PNM was generated (Generate Pore Network Model) to represent the interconnected structure of the soil pores. The outcomes of the segmentation process were subsequently integrated with the maximum ball algorithm to derive a three-dimensional topologically equivalent PNM that effectively encapsulates both pores and throats. This model allowed for the analysis of pore intersections (Pore Intersection) and the overall distribution of pore properties within the soil sample (Distribution Analysis). Spreadsheet-based analysis (Plot Spreadsheet) was conducted and extracted to quantify parameters such as pore volume, size, connectivity, pore diameter, pore number, and throats [17]. Mean pore network characteristics are shown in (Table 1).

2.4. Measurement of Soil Water Retention, Hydraulic Conductivity, and Soil Pore

To measure saturated hydraulic conductivity (Ks), the soil samples under soil compaction levels (P1–P5) were subjected to analysis, and Ks values were calculated via Darcy’s law and the fixed-head technique. Equation (1) used for the calculation is as follows:
Q A t = K s Δ H L
Here, Q is the amount of outflow water at the time the water flows through the column of soil (cm3), A is the cross-sectional area of the column of soil (cm2), ΔH/L is the hydraulic gradient, and Ks is the saturated hydraulic conductivity.
Soil samples were saturated with water for 24 h to calculate saturated water content (θs). The soil water retention curve (SWRC) was then determined using both a pressure cooker and a pressure membrane across ten matric potentials (100, 300, 600, 800, 1000, 3000, 6000, 8000, 10,000, and 15,000 hPa) according to [23]. To predict the van Genuchten (vG) new parameters (θr, α, and n) under soil compaction levels, the observed SWRC data were fitted to the vG model parameters using a non-linear optimization approach.
The objective function for the optimization was defined as the sum of squared differences between observed and predicted values of water content, allowing for the calculation of the best-fit parameters. Van Genuchten [30] parameters were fitted to the SWRC observed data with the Mualem constraint (m = 1 − 1/n) [31] in Equation (2) as follows:
θ ( h ) = θ r + θ s θ r 1 + α h n m   h 0 θ s   h     0
Here, θ(h) is volumetric water content (cm3 cm−3) at pressure head h cm; θr and θs are residual and saturated water contents, respectively (cm3 cm−3); α (>0, in cm−1) and n (>1) are curve-shape parameters, and m = 1 − 1/n.
Accordingly, to the predicted SWRC, the following soil physical quality was calculated: field capacity (FC), wilting point (WP), and available water (AW) as follows:
F C = θ 300 h P a
W P = θ 15,000 h P a
A W = F C W P
Relative field capacity (RFC), defined by Reynolds et al. [32] is in Equation (6):
R F C = F C θ s
Then, based on the parameters predicted from SWRC, the Kun was calculated using vG Equation (7):
K ( h ) = K s S 0.5 1 ( 1 S n / ( n 1 ) ) m 2
Here, K refers to the unsaturated soil hydraulic conductivity, and S refers to the degree of saturation for unsaturated soil. Equation (8) is as follows:
S = θ θ r θ s θ r
The vG parameters predicted from the mini disc infiltrometer (MDI) device according to [21] were used to predict Kun using the observed SWRC data and compared to Kun predicted with vG parameters from SWRC data.
Using the capillary equation provides a practical method to infer pore diameters, where the capillary equation links pore geometry to water retention by describing the balance between surface tension, gravitational forces, and adhesive interactions at the water–pore interface. Smaller pores (lower D) retain water at more negative h values due to stronger capillary forces, while larger pores drain at higher h. The equivalent diameter (D) of soil pores retaining water at a potential (h) of water in soil was calculated by the capillary equation as mentioned [19,33]:
D = 4 σ cos α h g ρ
Here, D is the soil pore diameter (cm), σ is the surface tension of water (72.86 dyne cm−1 or g s−2), α is the contact angle between water and pore wall, or the wetting angle (α is 0 and cos α is 1), h is soil water potential (cm), g is the acceleration due to gravity (980.7 cm s−2), and ρ is the density of water (0.998 g cm−3). By inserting these constant values, Equation (10) can be simplified as follows:
D   ( c m ) = 0.3 h   o r   D   ( μ m ) = 3000 h
Here, D is (cm or μm). Equation (10) can be used to calculate the diameter of the equivalent pore size for soils or porous media at any given soil water potential. So, according to the pore functional characteristics and the actual situation of the soil [18], the soil pores were divided into three grades: pores with (D > 30 μm, at |h| < 100 hPa) were TP, pores with (D between 0.5 and 30 μm, at |h| between 6000 and 100 hPa) were SP, and pores with (D < 0.5 μm, at |h| > 6000 hPa) were RP.

2.5. Statistical Analysis

The least significant difference (LSD) was used to assess significant differences in soil physical properties, and CT-based pore characteristics among the soil compaction levels for soil location are significant at p = 0.05. Pearson correlation was performed among soil physical properties and CT-based pore characteristics, with the significance level set at p = 0.05 and 0.01. The above analyses were performed with the statistical software SPSS Statistics version 25.0 (IBM Corp., Armonk, NY, USA). Fitted for SWRC data and the coefficient of determination (R2), values were calculated using Microsoft Excel (2016), and the plots were designed via Origin 2025.

3. Results and Discussion

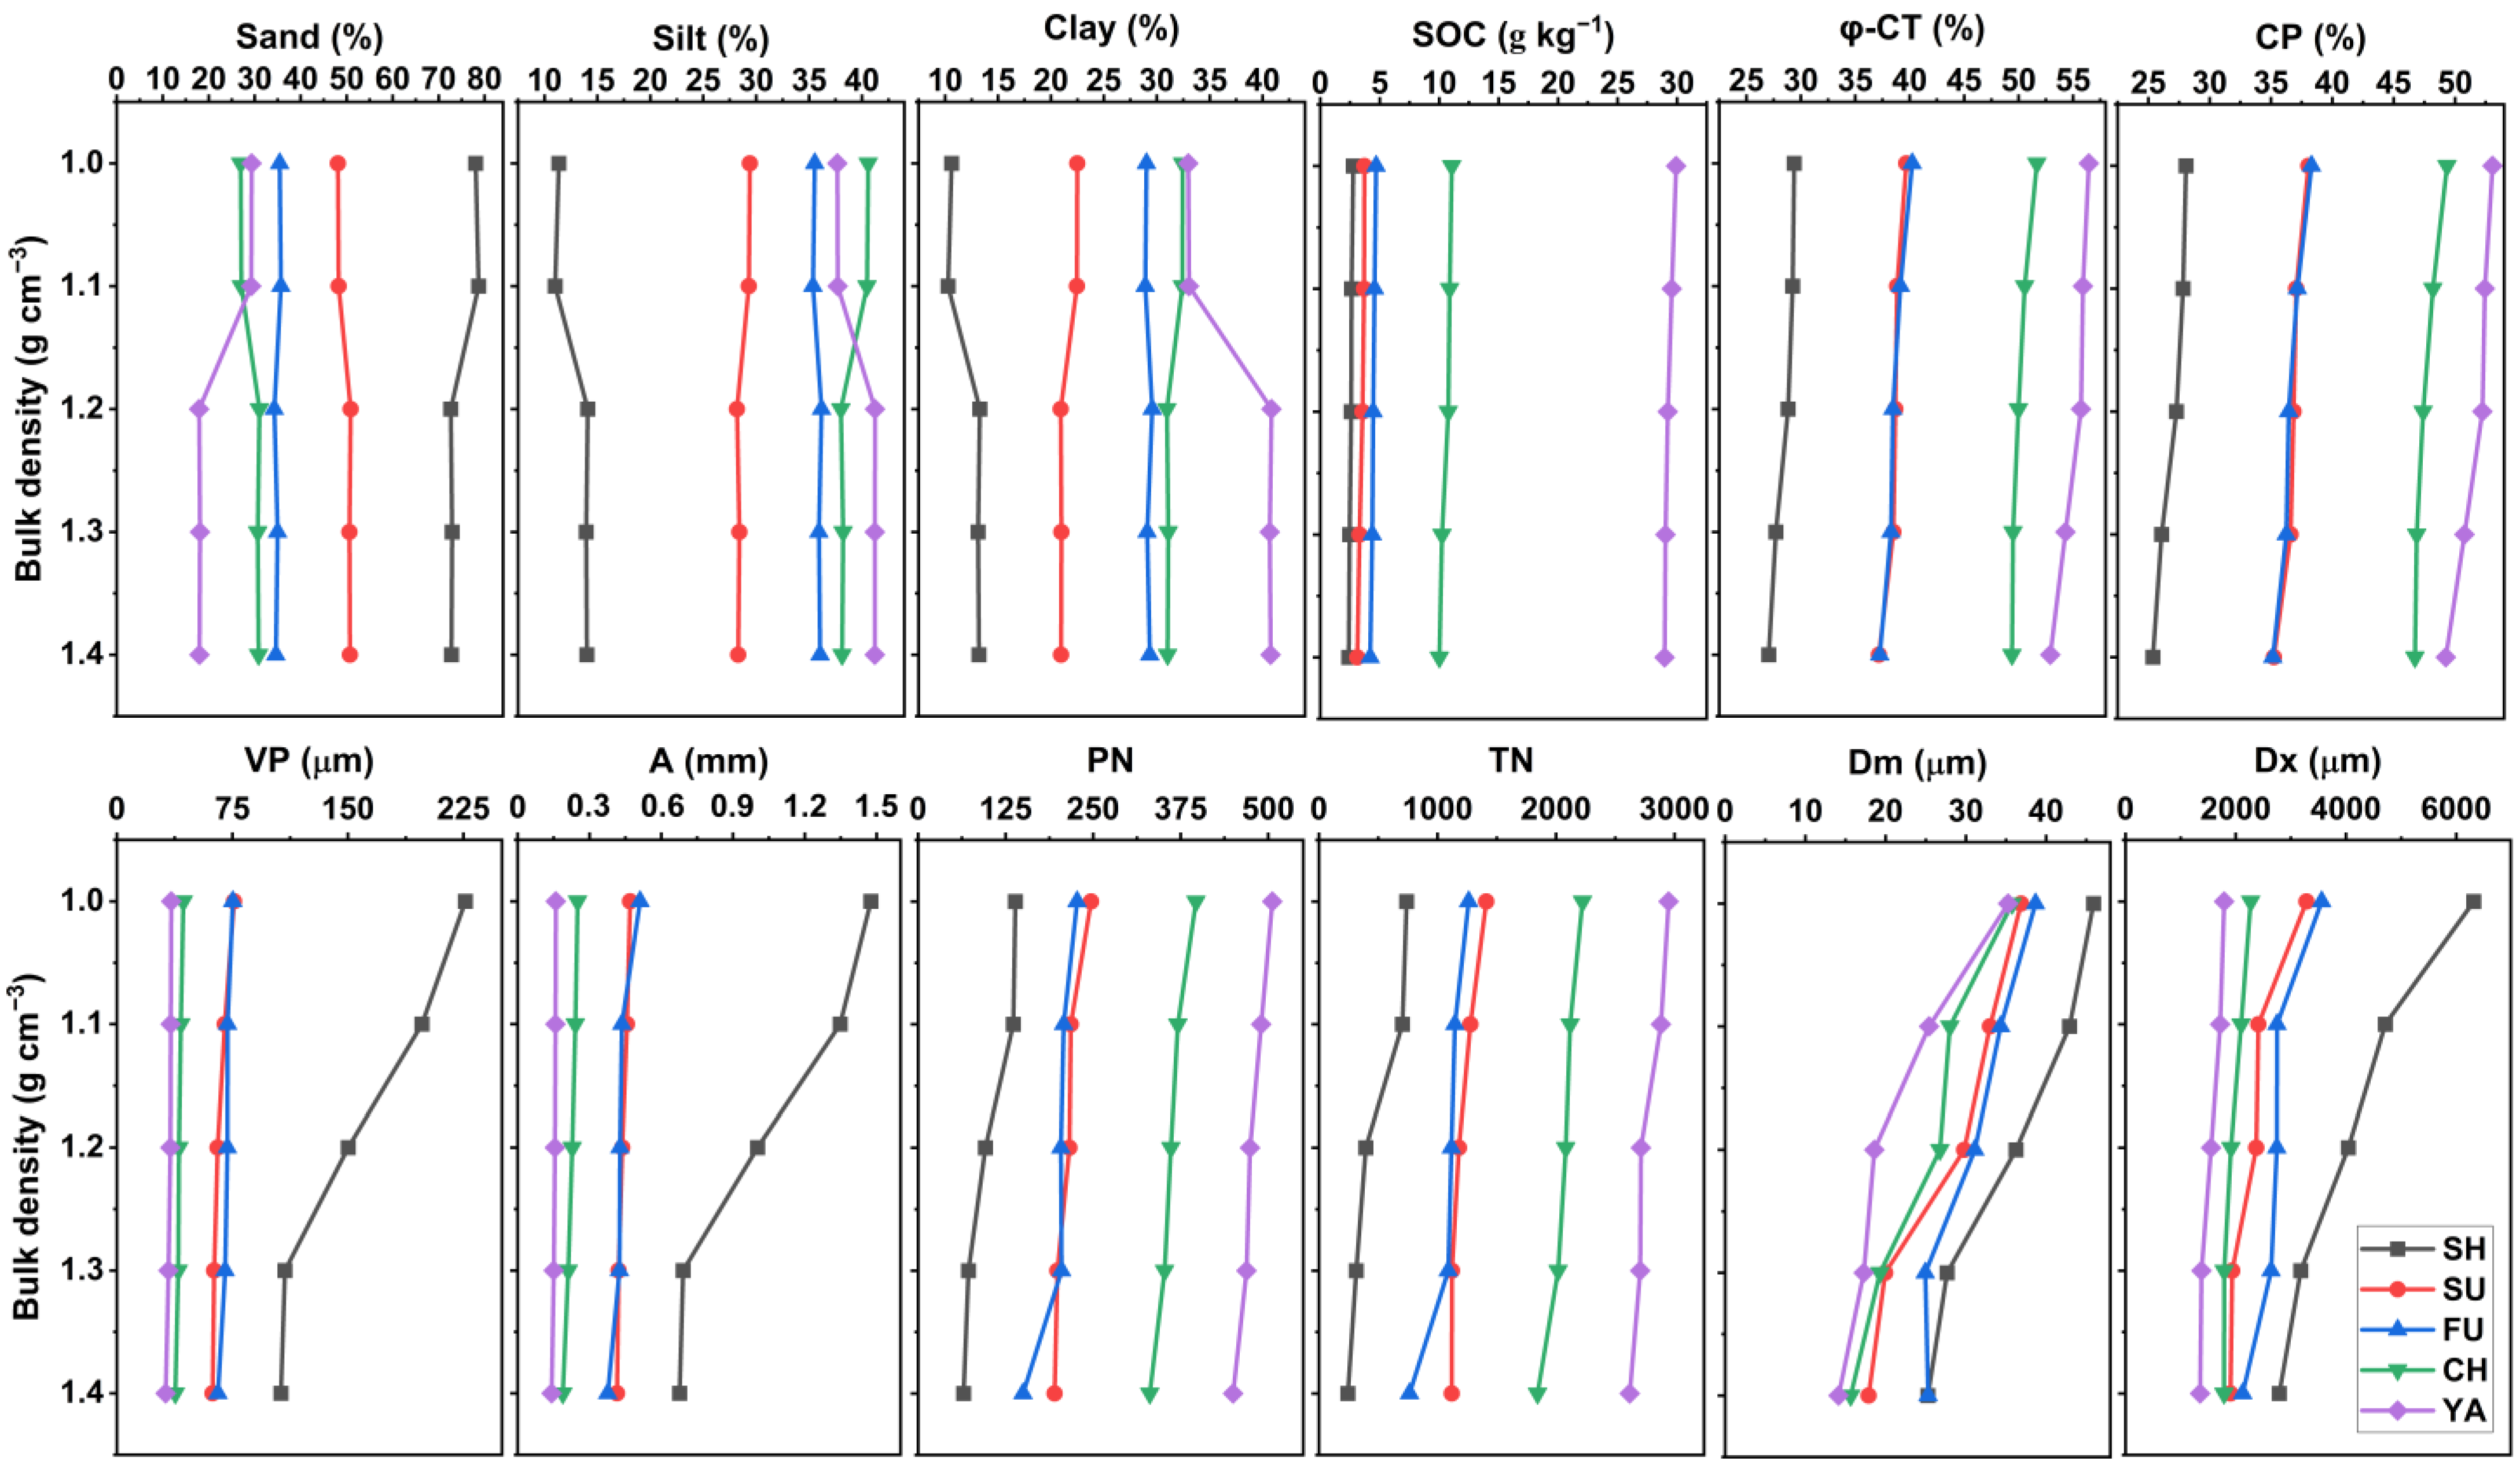
3.1. Soil Physical Properties and Ct-Based Pore Characteristics Under Compaction Levels for Varying Locations

Table 2 reveals Pearson correlations between soil physical properties and CT-based pore characteristics, where sand content exhibited strong negative correlations with total porosity (φ-CT: −0.899, p < 0.01) and connectivity porosity (CP: −0.899, p < 0.01). This means sandy soils, despite their coarse texture, often lack stable aggregates and organic binding agents, leading to reduced pore connectivity and structural collapse under stress [34]. In contrast, silt, clay, and SOC showed positive correlations with φ-CT (silt: 0.875; clay: 0.906; SOC: 0.841; p < 0.01) and CP (silt: 0.878; clay: 0.901; SOC: 0.825; p < 0.01). This indicates that finer particles and organic matter enhance pore stability through electrostatic interactions and organic–mineral complexes [35]. Notably, SOC demonstrated a strong positive association with pore number (PN: 0.902, p < 0.01) and throat number (TN: 0.899, p < 0.01), underscoring its role in fostering microporosity via microbial activity and polysaccharide secretion, which stabilize small, interconnected pores [36]. However, silt, clay, and SOC displayed negative correlations with pore volume (Vp: −0.545 to −0.889, p < 0.01) and surface area (A: −0.579 to −0.895, p < 0.01), suggesting that while these components enhance pore connectivity, they may reduce macropore dominance, favoring smaller pores that contribute to higher PN and TN. Organic-rich soils prioritize pore network complexity over total pore volume [37]. The negative correlations of sand with PN (−0.831) and TN (−0.828) further emphasize its limited capacity to sustain intricate pore networks, whereas clay’s strong positive relationship with PN (0.857) and TN (0.852) highlights its structural benefits. Differences indicated, such as SOC’s weaker correlation with minimum diameter (Dm: −0.410, p < 0.05) compared to other metrics suggest that site-specific factors like clay mineralogy or management practices may modulate these relationships [38].
Figure 2 illustrates the bulk density distribution (1.00–1.40 g cm3) of soil physical properties and pore characteristics across five locations. Lower bulk densities were observed in SOC-rich soils, particularly in Yangling, where organic matter enhances soil aggregation, reducing compaction by improving pore connectivity and structural resilience [1,39]. Conversely, locations with higher sand content, such as Shenmu, exhibited elevated bulk densities (closer to 1.40 g cm3), showing that coarse-textured soils lack cohesive organic–mineral complexes, leading to weaker pore networks and increased susceptibility to compaction [2]. Pore characteristics further reflected these trends; lower bulk density correlated with higher φ-CT and CP, as seen in Yangling, where SOC likely facilitated macropore preservation (>500 μm) despite mechanical stresses [40]. In contrast, compacted soils (e.g., Shenmu) showed diminished Vp and A, indicative of collapsed macropores and homogenized pore structures, a well-documented phenomenon in mechanically compressed soils [11]. Notably, Chunhua displayed intermediate bulk densities despite moderate SOC levels, suggesting additional influencing factors such as clay mineralogy or tillage practices, which can modulate compaction responses [38].
Figure 3 presents three-dimensional reconstructions of soil cores using Avizo software, depicting pore networks for some compaction levels (P1, P3, P5) across different locations. Higher compaction (P5) universally reduced macropore prevalence (red regions), particularly in sand-dominated soils like Shenmu, where mechanical compression collapsed larger pores, leaving homogenized structures dominated by smaller pores (blue). This shows that compaction preferentially degrades macropores, impairing hydraulic conductivity and aeration [10]. Conversely, Yangling, characterized by higher SOC, retained more interconnected macropores even under P5, reflecting SOC’s role in enhancing aggregate stability and pore resilience through organic binding agents and microbial activity [8]. Chunhua exhibited intermediate pore preservation despite moderate SOC, suggesting influences from clay mineralogy or reduced tillage intensity, which can buffer compaction impacts [38]. Notably, Suide and Fuxian showed progressive pore fragmentation with increasing compaction, highlighting the vulnerability of low-SOC soils to structural degradation. The persistence of smaller pores in compacted soils may sustain some microbial habitats but risks compromising water infiltration and root penetration, emphasizing the need for organic amendments and reduced mechanical disturbance in vulnerable regions [1].
Figure 4 illustrates the relationship between mean pore volume and pore diameter under soil compaction levels across different locations. As soil compaction increases, mean pore volume decreases, reducing pore diameters. In [41], they emphasized that soil compaction diminishes porosity, thereby altering essential soil physical properties, which are crucial for effective water retention and root penetration. Conversely, Shaheb et al. [9] highlight that moderate compaction can enhance soil strength and stability, potentially benefiting agricultural productivity by improving seedbed conditions. However, excessive compaction can produce detrimental effects, such as reduced aeration and impaired drainage, ultimately hindering plant growth and development [42]. The differences observed across varying locations can be attributed to several factors, including soil texture, organic matter content, and moisture levels, all of which significantly influence the compaction process and its resultant impacts [1]. For instance, finer-textured soils tend to exhibit greater vulnerability to compaction, resulting in a more pronounced decline in porosity compared to coarser-textured soils. Additionally, the presence of organic matter can mitigate the adverse effects of compaction by improving soil structure and promoting microbial activity, which enhances nutrient availability and water retention.

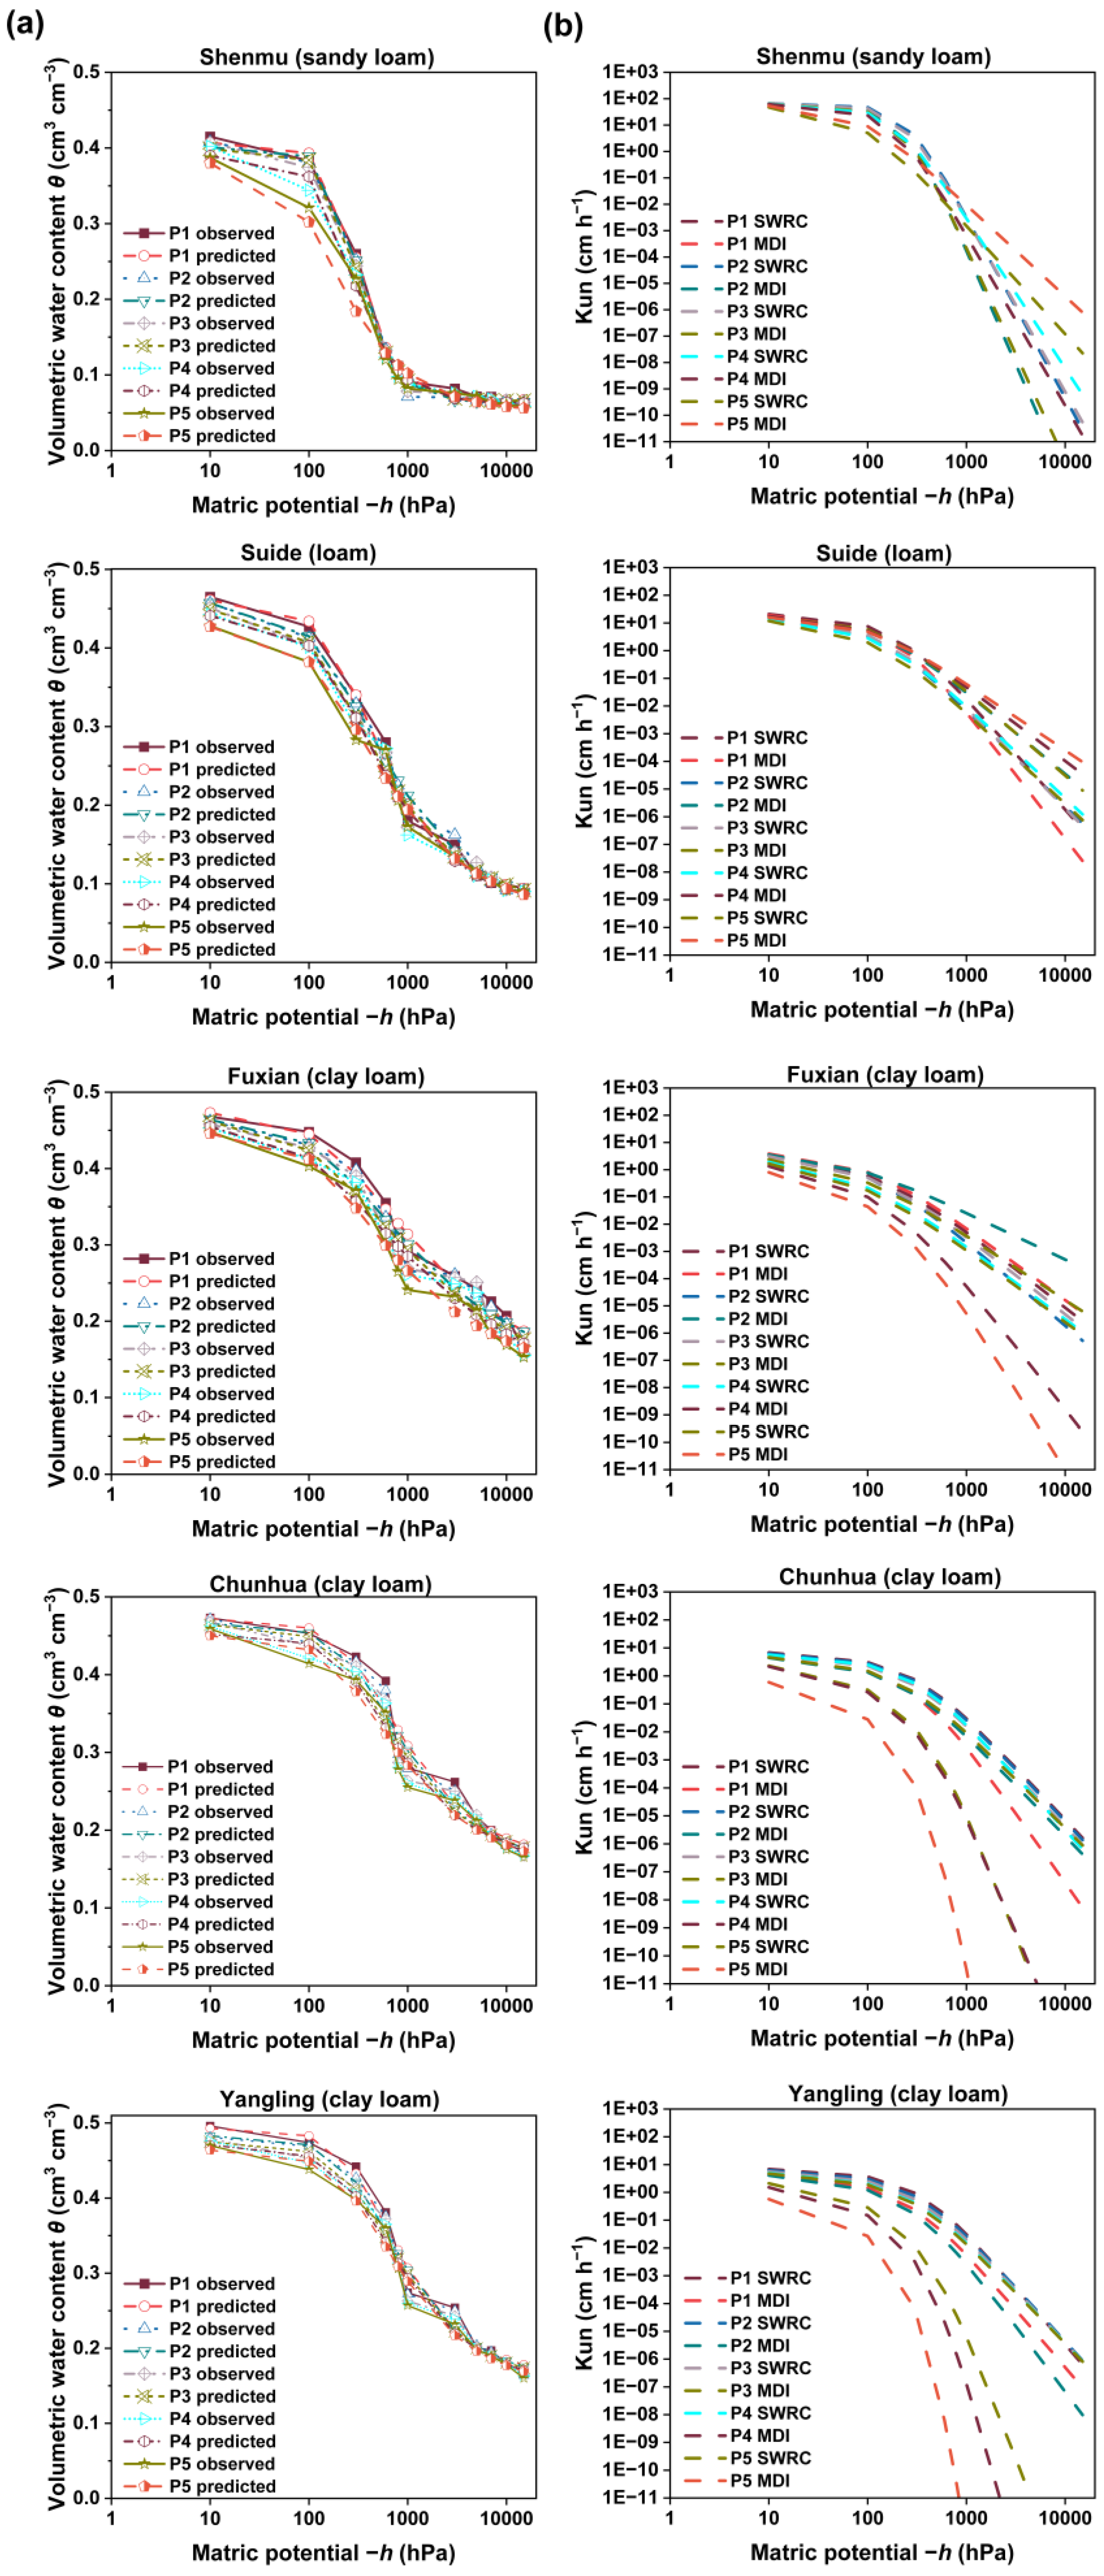
3.2. SWRC, Hydraulic Conductivity Based on SWRC and MDI Parameters

Table 3 presents the vG model parameters, soil physical quality metrics, and Ks under compaction levels across different locations and soil texture. As compaction intensified, θs declined consistently, with Shenmu (SL) exhibiting the largest reduction (P1: 0.415 cm3 cm3 to P5: 0.387 cm3 cm3), reflecting pore space loss due to mechanical compression in coarse-textured soils lacking cohesive structure [43]. Similarly, Ks decreased with compaction, most sharply in Shenmu (SL) (69.80 to 62.70 cm h1) and minimally in Yangling (CL) (7.53 to 5.78 cm h1), underscoring the vulnerability of sandy soils to macropore collapse and the resilience of clay-rich, SOC-dense soils in preserving pore functionality [44]. The van Genuchten parameter α, inversely related to air-entry suction, decreased with compaction (e.g., Shenmu: 0.075 to 0.019 cm1 at P3), indicating the greater suction required to drain water in compacted soils, while lower n values (e.g., Yangling: 1.31 at P3) appeared with steeper water release curves, showing that compaction homogenizes pore size distribution, reducing water retention efficiency [10]. AW declined across all locations under compaction (e.g., Suide (L): 0.245 to 0.193 cm3 cm3), threatening crop productivity in water-limited environments, as compacted soils retain less plant-accessible water [38]. Notably, clay loam soils (Fuxian, Chunhua, Yangling) maintained higher (FC: 0.371–0.442 cm3 cm3) and (RFC: 0.828–0.894) under P5 compared to sandy loam (Shenmu: FC 0.227, RFC 0.587), emphasizing the role of clay’s high surface area and microporosity in sustaining water retention despite compaction [12]. However, even clay loam soils experienced reduced Ks, highlighting differences between water retention and hydraulic conductivity under compaction and showing that compaction disproportionately affects macropores, critical for infiltration, while micropores dominate water storage [2]. The persistence of higher RFC in Yangling (CL) despite compaction suggests SOC’s indirect role in stabilizing aggregates and pore networks, as organic matter enhances soil elasticity and resistance to compression [45].
Table 4 further illustrates the vG model parameters under varying compaction levels. The high coefficients of determination (R2: 0.967–0.998) indicate a strong fit of the new parameters of the model from the observed data, suggesting strong predictions of SWRC. The α and n parameters, which influence the SWRC, show variability across compaction levels, highlighting the sensitivity of soil hydraulic properties to compaction. Specifically, when compaction increases, α tends to increase while n decreases, indicating a more abrupt transition between saturated and unsaturated conditions [30] and showing that changes in soil structure due to compaction can significantly alter these hydraulic parameters, affecting water availability for plants [46,47].
Table 5 presents predicted values of α and n derived from MDI measurements, demonstrating Kun varies with compaction levels. The results indicate that increased compaction leads to a reduction in α and an increase in n, further confirming the detrimental effects of compaction on soil hydraulic properties. The R2 values suggest a robust correlation between unsaturated hydraulic conductivity based on SWRC (Kun-SWRC) and unsaturated hydraulic conductivity based on MDI (Kun-MDI) predicted data, reinforcing the strength of the model parameters used. This is consistent with the findings by Talat et al. [21], who noted that accurately predicting unsaturated hydraulic conductivity is essential for understanding water movement in agricultural soils.
Figure 5 illustrates the SWRC and Kun as functions of matric potential (h) across different compaction levels. The observed and predicted data show that as compaction levels increase, the SWRC reduces, which is evident in the steepness of the retention curves. This steepness reflects a reduction in the ability of the soil to retain water at lower matric potentials, a critical factor for plant growth. Furthermore, the relationship between Kun and h indicates that higher compaction levels result in lower conductivity values. This relationship emphasizes the importance of maintaining adequate soil structure to facilitate water movement, which is vital for agricultural sustainability [1].

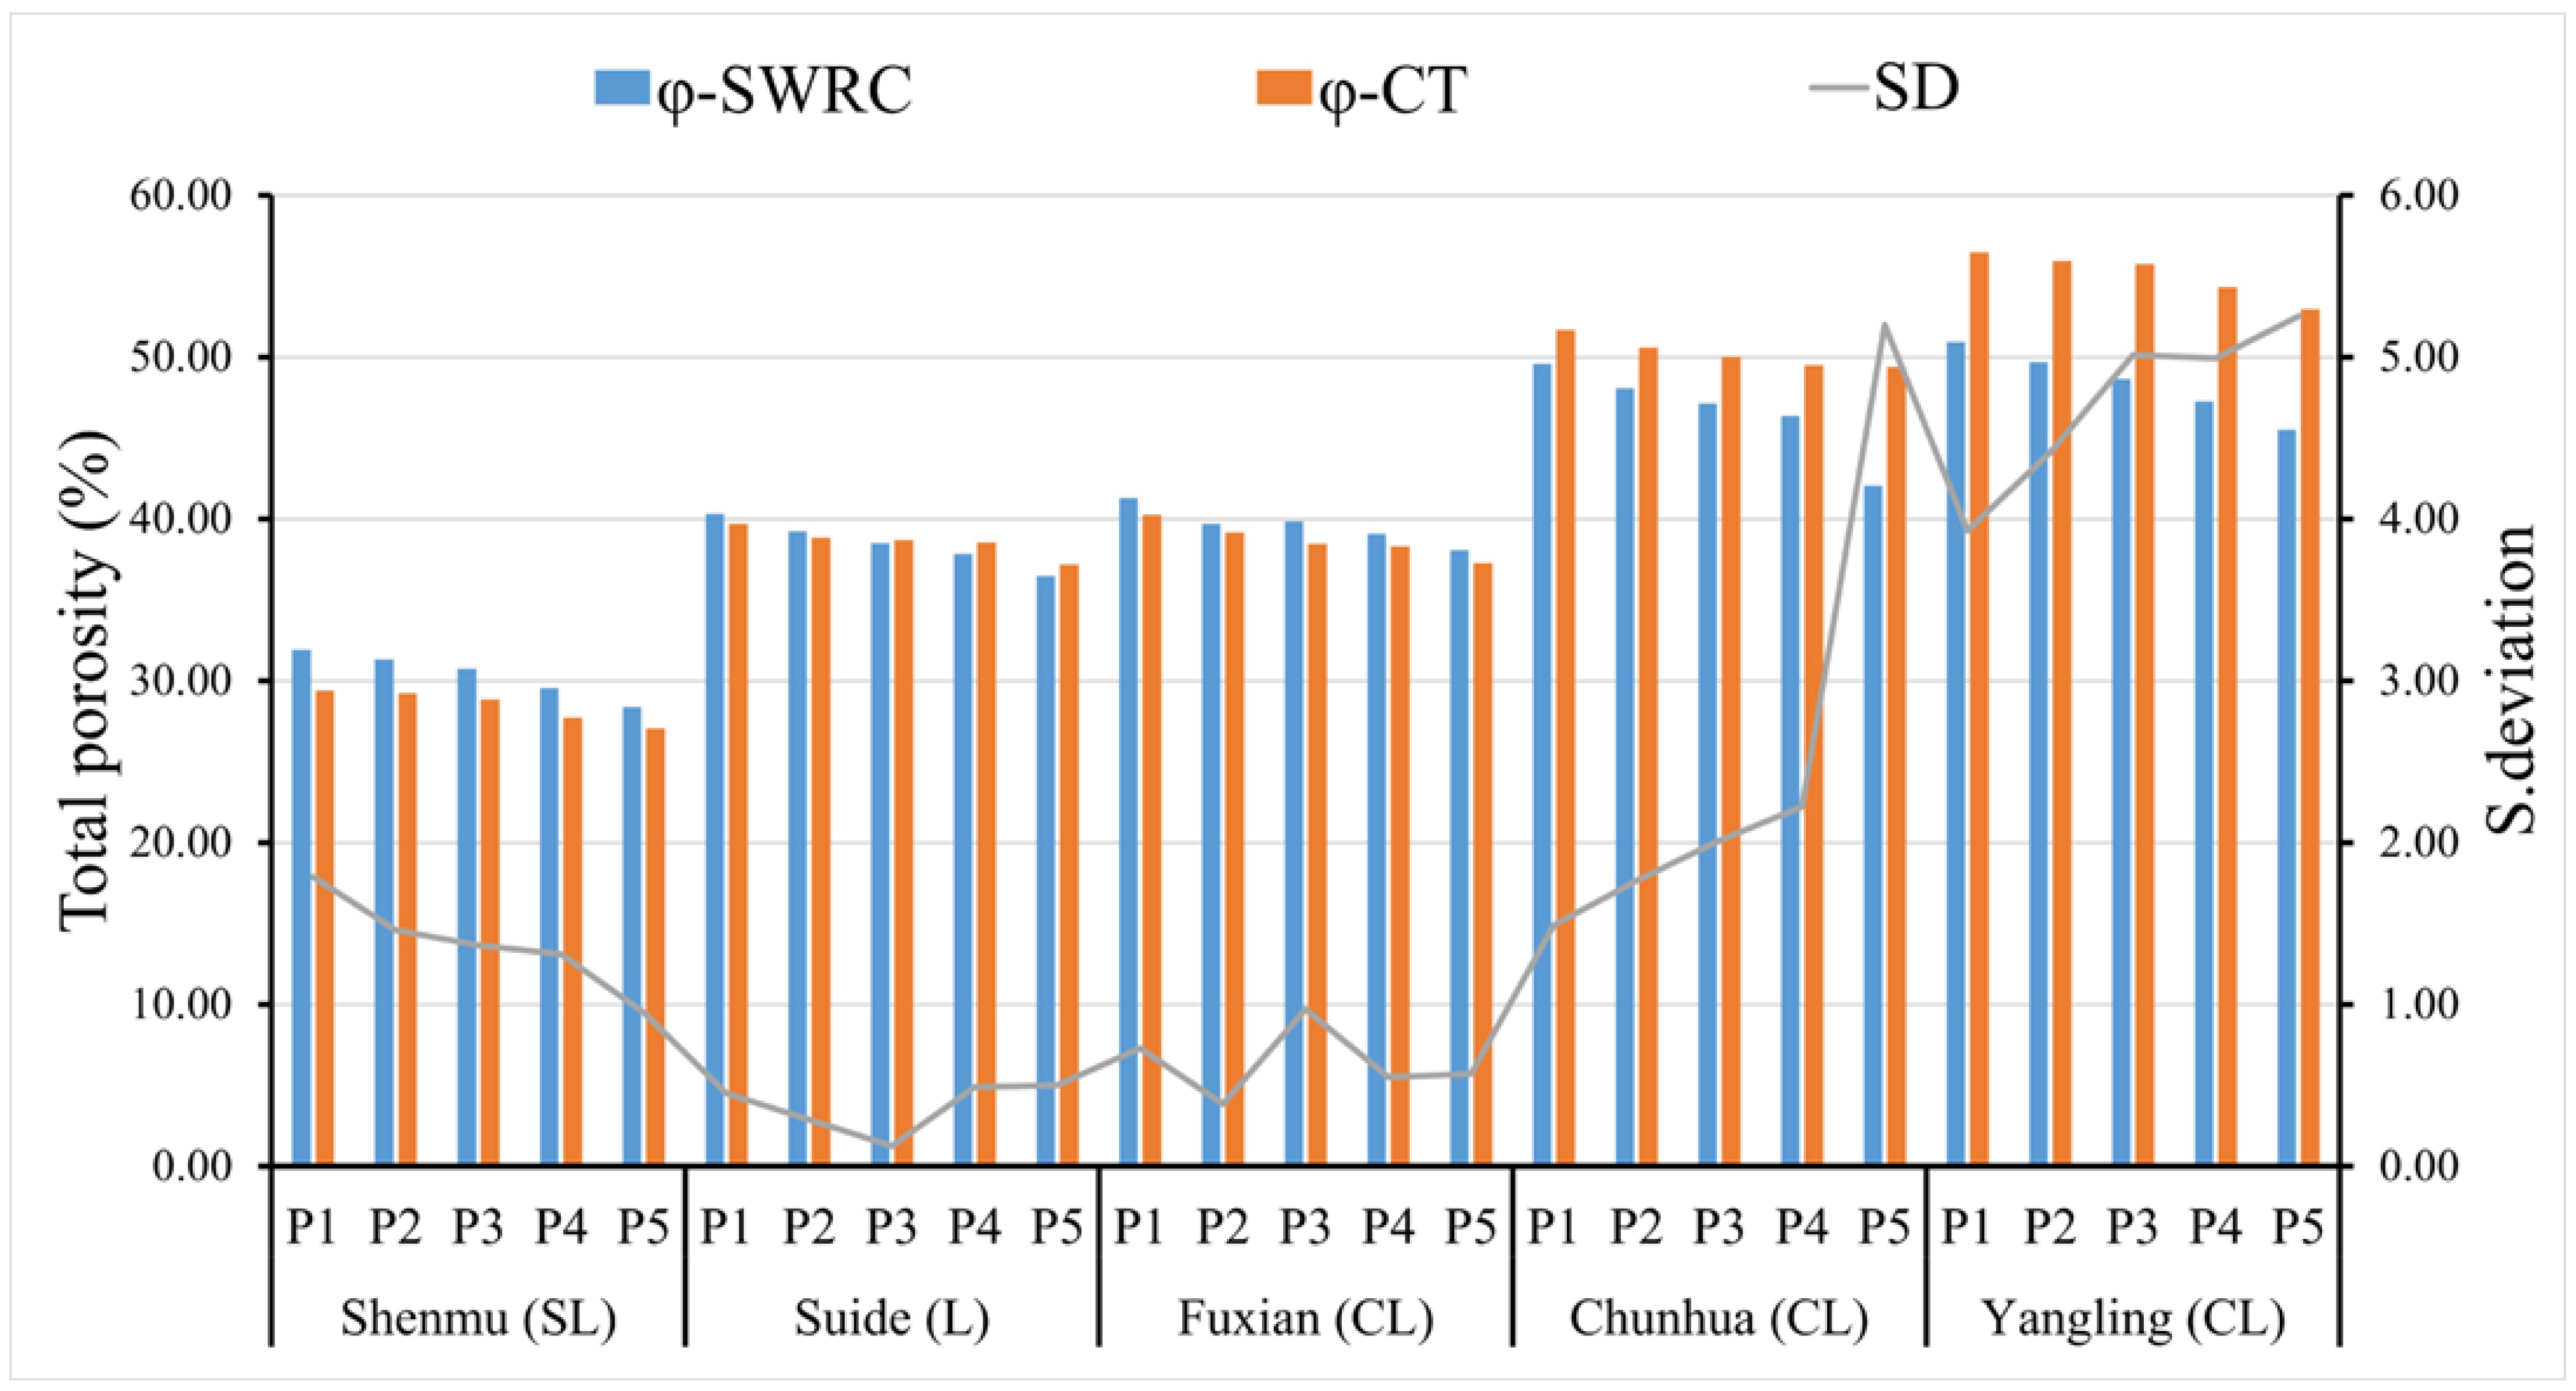
3.3. Estimation of Pore Size Distribution Based on SWRC and Comparison with CT

Table 6 presents the pore volume distributions of RP, SP, and TP across various soil locations and textures under compaction levels (P1 to P5). The results indicate a consistent decline in RP and SP volumes as compaction increases, while TP volumes remain relatively low across all compaction levels. For instance, in Shenmu (SL) soil, the RP volume decreases from 0.1158 cm3 at compaction level P1 to 0.1057 cm3 at P5, highlighting the negative impact of compaction on the soil’s ability to retain water. Similarly, SP volumes decrease from 0.1872 cm3 to 0.1629 cm3 under the same compaction levels, suggesting that compacted soils may resist holding sufficient water for plant use. That increased soil compaction leads to reduced porosity and impaired water retention capabilities, which can adversely affect agricultural productivity [42].
The TP volumes, while the lowest among the three categories, show minimal variation across compaction levels, indicating that the primary impact of compaction is on the SP and RP volumes. This is particularly evident in locations like Chunhua (CL) and Yangling (CL), where TP volumes remain below 0.005 cm3, emphasizing the limited capacity for water movement through these soils. The overall means for soil compaction levels reveal a gradual decline in both RP and SP volumes, indicating a systematic reduction in the soil’s water-holding capacity as compaction increased.
Figure 6 illustrates the total porosity across different compaction levels and soil types, comparing SWRC-based total porosity (φ-SWRC) and φ-CT. Total porosity decreases with increasing compaction levels, confirming that compacted soil exhibits reduced pore spaces, which restrict both water retention and movement. The φ-SWRC demonstrations went down a little in total porosity compared to φ-CT. This difference underscores the predictive power of the pore size distribution calculated from SWRC or CT data.
In addition, as shown in Figure 6, the φ-SWRC exceeded φ-CT in Shenmu, Suide, and Fuxian soil, whereas φ-SWRC was lower than φ-CT in Chunhua and Yangling, reflecting methodological disparities. The SWRC captures water-retentive macro/micropores, while CT visualizes 3D pore architecture, soil texture/aggregation. Where the SWRC emphasizes water-accessible pores, including isolated micropores retained at high tensions, the CT resolves air-filled macropores influenced by structural collapse during drying, with finer-textured soils amplifying SWRC estimates and aggregated or coarser soils favoring CT-derived porosity due to contrasting pore networks.
The φ-SWRC reflects how different pore sizes contribute to the overall water retention capacity of the soil, particularly in the context of smaller pores that are more affected by compaction. In contrast, φ-CT may provide a broader overview of soil compaction effects but might not capture the nuanced changes in pore dynamics as effectively as the SWRC [20,48].

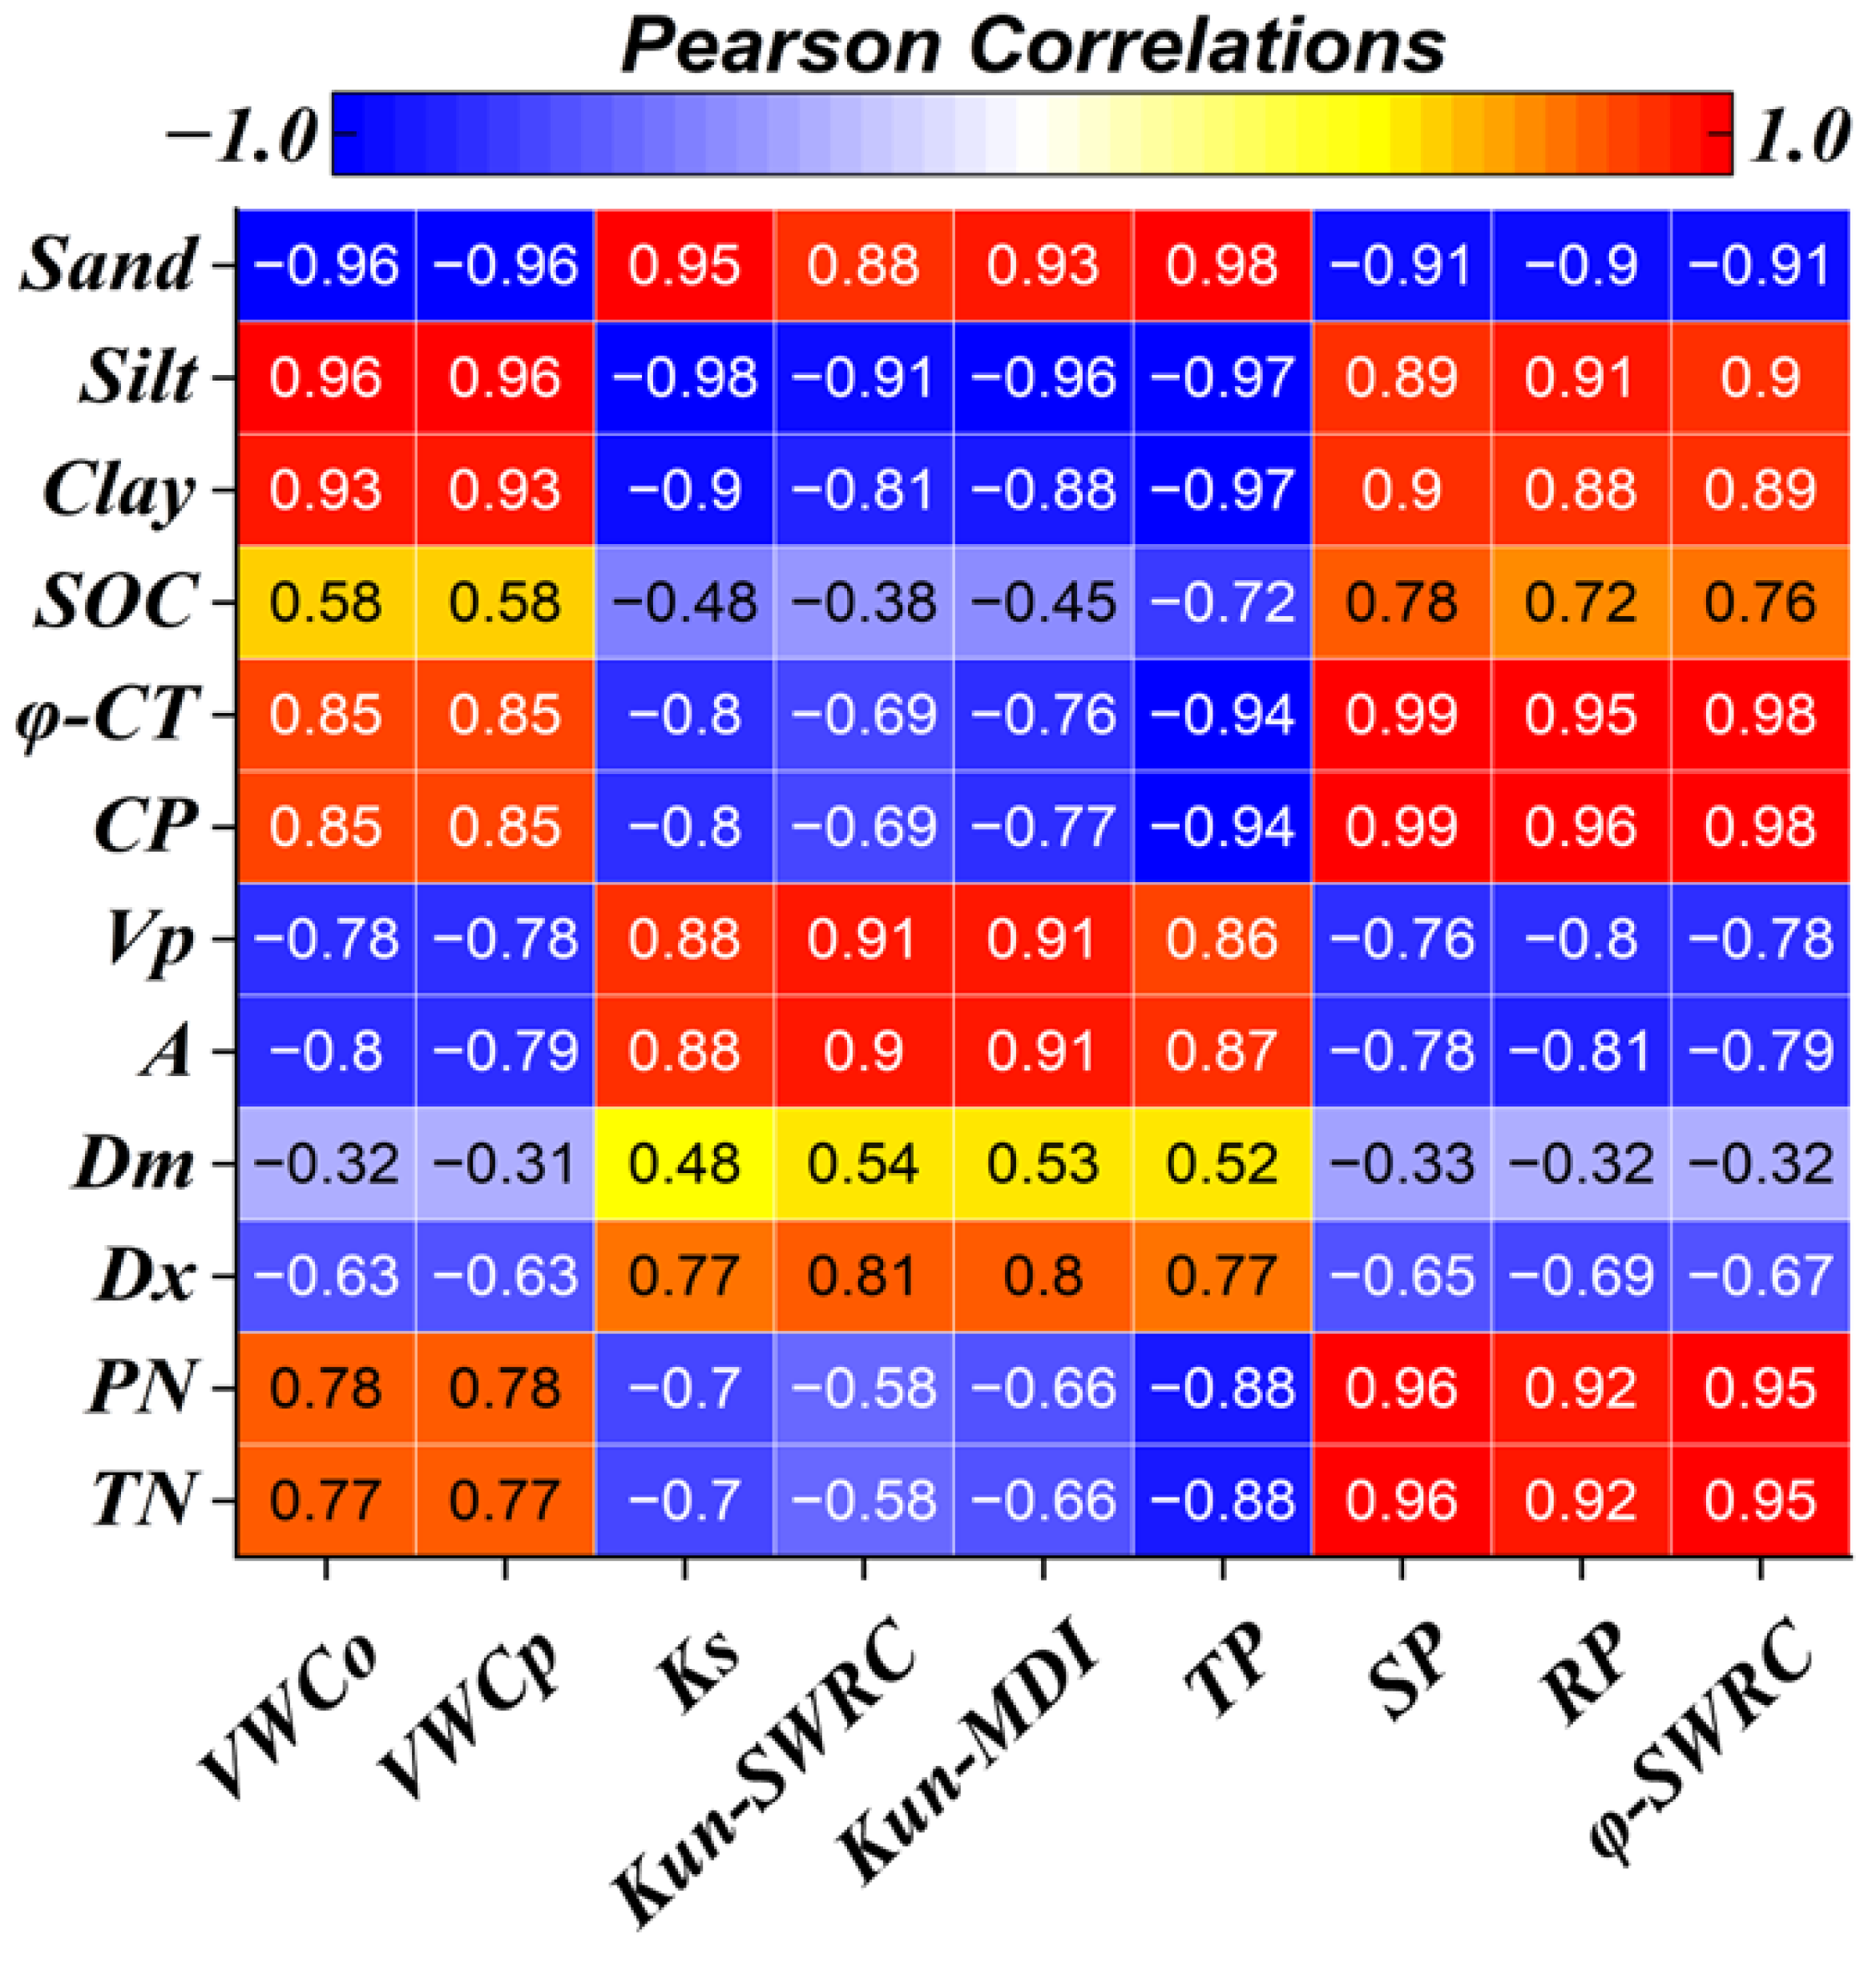
3.4. Relationships Between Soil Physical Properties, SWRC, Hydraulic Conductivity, and Pore Characteristics

Figure 7 presents a heatmap of Pearson correlations. Sand content exhibited strong negative correlations with volumetric water content observed (VWCo) and volumetric water content predicted (VWCp), reflecting its limited water retention capacity due to coarse texture and macropore dominance, highlighting sandy soil’s poor water-holding properties [49,50]. Conversely, silt and clay showed strong positive correlations with VWCo and VWCp, underscoring the role of fine particles in enhancing water retention through microporosity and surface interactions [51]. SOC correlated moderately with VWCo and VWCp, aligning with its capacity to stabilize aggregates and improve pore connectivity [8]. φ-CT and CP demonstrated strong positive correlations with VWCo and VWCp, indicating that higher porosity and pore connectivity enhance water retention, though Vp and A showed negative correlations with VWCo and VWCp, likely due to larger, less tortuous pores in sandy soils reducing effective water storage [2].
The Ks, Kun-SWRC, and Kun-MDI correlated positively with sand and negatively with silt and clay, confirming that macropore-dominated sandy soils facilitate faster water movement [10,12]. However, TP showed strong positive correlations with sand and negative correlations with silt and clay. This may arise from methodological differences in pore classification or site-specific compaction effects, homogenizing pore structures [52]. SP and RP correlated positively with silt, clay, and SOC, emphasizing their role in plant-available water retention, particularly in fine-textured and organic-rich soils [13]. φ-SWRC mirrored these trends, validating SWRC’s utility in capturing water-filled porosity.
In addition, differences between TP correlations and soil texture imply context-dependent factors, such as clay mineralogy (e.g., smectite’s swelling) or tillage history, may override typical texture–pore relationships [38]. The findings in (Figure 7) underscore the importance of integrating advanced imaging techniques like CT scanning and sophisticated modeling approaches such as SWRC analysis to enhance our understanding of soil behavior and its implications for various environmental processes and land management strategies [20,48].

4. Conclusions

This study systematically investigated the effects of incremental soil compaction (P1–P5) on hydraulic properties, pore architecture, and water retention across five soil textures in China’s Loess Plateau, integrating advanced methodologies such as CT, SWRC analysis, and the vG model. Key findings underscore the critical roles of soil texture and SOC in modulating compaction resilience and hydraulic functionality.
Fine-textured, SOC-rich soils, e.g., Yangling (CL), exhibited superior resistance to compaction due to enhanced aggregate stability and microporosity, preserving macropore connectivity and hydraulic conductivity even at high compaction. In contrast, sandy soils, e.g., Shenmu (SL), experienced significant macropore collapse (>30 µm), reducing φ-CT under maximum compaction.
Increasing compaction homogenized pore size distribution, shifting SWRC toward steeper slopes (lower vG parameter n), thereby reducing AW in all soils. While clay loams retained higher FC: 0.37–0.44 cm3 cm3, under compaction, their Ks declined, emphasizing that even resilient soils face differences between water retention and infiltration.
φ-CT consistently exceeded φ-SWRC, particularly in compacted soils, reflecting CT’s sensitivity to air-filled macropores versus SWRC’s focus on water-retentive pores. However, the integration of both methods provided a holistic understanding of pore–water dynamics, with SWRCs effectively capturing functional porosity (e.g., SP between 0.5 and 30 µm) critical for agricultural water management.
The Kun predictions using vG parameters from MDI and SWRC data showed strong agreement (R2 = 0.94–0.99), validating the robustness of vG parameters from SWRC data for assessing compaction impacts. Notably, MDI-derived predictions slightly underestimated Kun in clay loam, likely due to microporosity dominance, while SWRC-based models aligned closely with observed data.
Integrating CT and SWRC methodologies offers a framework for precision soil health monitoring, essential under escalating agricultural intensification and climate variability. Future research should explore long-term SOC dynamics and site-specific pedoclimatic feedback to refine predictive models and conservation strategies.

Author Contributions

Conceptualization, methodology, and writing—original draft preparation: A.E.T.; formal analysis, J.W.; writing—review and editing, J.W. and A.S.E.-S. All authors have read and agreed to the published version of the manuscript.

Funding

This work was supported by the National Natural Science Foundation of China (No. 42377332).

Data Availability Statement

Data can be made available on request. For any data inquiries, please contact the corresponding author, Wang Jian, at wangjian@nwafu.edu.cn.

Acknowledgments

The authors extend their appreciation to Researchers Supporting Project number (RSPD2025R1044), King Saud University, Riyadh, Saudi Arabia.

Conflicts of Interest

The authors declare no conflicts of interest.

Abbreviations

The following abbreviations are used in this manuscript:
CTX-ray Computed Tomography
SOCSoil Organic Carbon
φ-CTCT-based total porosity
CPConnectivity Porosity
VpPore Volume
ASurface area
DmMinimum diameter
DxMaximum diameter
PNPore Number
TNThroats Number
VWCoVolumetric Water Content observe
VWCpVolumetric Water Content predict
KsSaturated hydraulic conductivity
SWRCSoil Water Retention Curve
KunUnsaturated hydraulic conductivity
Kun-SWRCUnsaturated hydraulic conductivity based on SWRC
MDIMini Disc Infiltrometer
Kun-MDIUnsaturated hydraulic conductivity based on MDI
θsSaturated water content
θrResidual water content
α, nvan Genuchten model parameters
FCField Capacity
WPWilting Point
AWAvailable Water
RFCRelative Field Capacity
RPResidual Pores
SPStorage Pores
TPTransmission Pores
φ-SWRCSWRC-based total porosity

Appendix A

Table A1. Soil physical properties and CT-based soil pore network characteristics for different location and soil texture under different soil compaction levels from P1 to P5. Interpretation of suffixes for each column.
ParameterSuffix PatternInterpretation
Sand (%) a, b, c, d, e Each location has distinct sand content (e.g., Shenmu [e] > Yangling [a])
Silt (%) a, b, c, d Shenmu (a) has the lowest silt; Chunhua/Yangling (d) share the highest
Clay (%) a, b, c, d Clay increases sequentially: Shenmu (a) < Suide (b) < Fuxian/Chunhua (c) < Yangling (d)
SOC (g kg1) a, b, c, d, e SOC increases strictly from Shenmu (a) to Yangling (e); no overlaps
φ-CT (%) a, b, c, d Total porosity: Shenmu (a) < Suide/Fuxian (b) < Chunhua (c) < Yangling (d)
CP (%) a, b, c Connectivity porosity: Shenmu (a) < Suide/Fuxian (b) < Chunhua/Yangling (c)
Vp (µm) a, ab, b, c Pore volume decreases from Shenmu (c) to Yangling (a); Chunhua (ab) overlaps
A (mm) a, ab, b, c Surface area trends mirror Vp; Chunhua (ab) bridges “a” and “b” groups
Dm (µm) a, ab, b Minimum pore diameter: Yangling (a) < Suide/Fuxian/Chunhua (ab) < Shenmu (b)
Dx (µm) a, ab, b, c Maximum pore diameter decreases from Shenmu (c) to Yangling (a); overlaps in mid-groups (ab, b)
PNa, b, c, d Pore number increases sequentially; all groups are distinct
TNa, b, c, d Throat number follows the same trend as PN; Yangling (d) has the highest TN
Notes: 1—Lowercase letters (a, b, c, d, e): Different lowercase letters following the mean value indicate significant differences (p < 0.05). Values sharing the same letter within a column are not significantly different. 2—Joint suffixes (e.g., ab) indicate overlapping significance groups. A value labeled “ab” is not significantly different from values labeled “a” or “b” in the same column.

References

  1. Blanco-Canqui, H.; Lal, R. Principles of Soil Conservation and Management; Springer: Dordrecht, The Netherland, 2010; pp. 1–617. [Google Scholar] [CrossRef]
  2. Rabot, E.; Wiesmeier, M.; Schlüter, S.; Vogel, H.J. Soil Structure as an Indicator of Soil Functions: A Review. Geoderma 2018, 314, 122–137. [Google Scholar] [CrossRef]
  3. Wolf, M.K.; Wiesmeier, M.; Macholdt, J. Importance of Soil Fertility for Climate-Resilient Cropping Systems: The Farmer’s Perspective. Soil Secur. 2023, 13, 100119. [Google Scholar] [CrossRef]
  4. Shi, H.; Shao, M. Soil and Water Loss from the Loess Plateau in China. J. Arid Environ. 2000, 45, 9–20. [Google Scholar] [CrossRef]
  5. Wang, L.; Shao, M.; Wang, Q.; Gale, W.J. Historical Changes in the Environment of the Chinese Loess Plateau. Environ. Sci. Policy 2006, 9, 675–684. [Google Scholar] [CrossRef]
  6. Wang, Q.X.; Fan, X.H.; Qin, Z.D.; Wang, M.B. Change Trends of Temperature and Precipitation in the Loess Plateau Region of China, 1961–2010. Glob. Planet Change 2012, 92–93, 138–147. [Google Scholar] [CrossRef]
  7. Liu, W.; Sang, T. Potential Productivity of the Miscanthus Energy Crop in the Loess Plateau of China under Climate Change. Environ. Res. Lett. 2013, 8, 044003. [Google Scholar] [CrossRef]
  8. Lehmann, J.; Bossio, D.A.; Kögel-Knabner, I.; Rillig, M.C. The Concept and Future Prospects of Soil Health. Nat. Rev. Earth Environ. 2020, 1, 544–553. [Google Scholar] [CrossRef]
  9. Shaheb, M.R.; Venkatesh, R.; Shearer, S.A. A Review on the Effect of Soil Compaction and Its Management for Sustainable Crop Production. J. Biosyst. Eng. 2021, 46, 417–439. [Google Scholar] [CrossRef]
  10. Lipiec, J.; Horn, R.; Pietrusiewicz, J.; Siczek, A. Effects of Soil Compaction on Root Elongation and Anatomy of Different Cereal Plant Species. Soil Tillage Res. 2012, 121, 74–81. [Google Scholar] [CrossRef]
  11. Alaoui, A.; Lipiec, J.; Gerke, H.H. A Review of the Changes in the Soil Pore System Due to Soil Deformation: A Hydrodynamic Perspective. Soil Tillage Res. 2011, 115–116, 1–15. [Google Scholar] [CrossRef]
  12. Reynolds, W.D.; Drury, C.F.; Tan, C.S.; Fox, C.A.; Yang, X.M. Use of Indicators and Pore Volume-Function Characteristics to Quantify Soil Physical Quality. Geoderma 2009, 152, 252–263. [Google Scholar] [CrossRef]
  13. Six, J.; Bossuyt, H.; Degryze, S.; Denef, K. A History of Research on the Link between (Micro)Aggregates, Soil Biota, and Soil Organic Matter Dynamics. Soil Tillage Res. 2004, 79, 7–31. [Google Scholar] [CrossRef]
  14. Zhang, S.; Grip, H.; Lövdahl, L. Effect of Soil Compaction on Hydraulic Properties of Two Loess Soils in China. Soil Tillage Res. 2006, 90, 117–125. [Google Scholar] [CrossRef]
  15. Tian, Z.; Chen, J.; Cai, C.; Gao, W.; Ren, T.; Heitman, J.L.; Horton, R. New Pedotransfer Functions for Soil Water Retention Curves That Better Account for Bulk Density Effects. Soil Tillage Res. 2021, 205, 104812. [Google Scholar] [CrossRef]
  16. Feng, R.; Zhang, Y.; Wang, J.; Wang, Y.; Zhang, N.; She, D. Effects of Rainfall-Induced Physical Crusts on Soil Carbon Distribution and Mineralization through Surface Pore Structure. Soil Tillage Res. 2025, 247, 106373. [Google Scholar] [CrossRef]
  17. Jiang, Z.; Pan, Y.; Fu, C.; Li, W.; Wang, Y.; Long, W.J. Three-Dimensional Pore Structure Characterization of Cement Paste by X-Ray Computed Tomography (XCT) and Focused Ion Beam/Scanning Electron Microscopy (FIB/SEM). Constr. Build. Mater. 2023, 383, 131379. [Google Scholar] [CrossRef]
  18. Lal, R.; Shukla, M.K. Principles of Soil Physics; CRC Press: Boca Raton, FL, USA, 2004. [Google Scholar] [CrossRef]
  19. Dlapa, P.; Hriník, D.; Hrabovský, A.; Šimkovic, I.; Žarnovican, H.; Sekucia, F.; Kollár, J. The Impact of Land-Use on the Hierarchical Pore Size Distribution and Water Retention Properties in Loamy Soils. Water 2020, 12, 339. [Google Scholar] [CrossRef]
  20. Mady, A.Y.; Shein, E.V.; Abrosimov, K.N.; Skvortsova, E.B. X-Ray Computed Tomography: Validation of the Effect of Pore Size and Its Connectivity on Saturated Hydraulic Conductivity. Soil Environ. 2021, 40, 1–8. [Google Scholar] [CrossRef]
  21. Talat, A.E.; Feng, R.; Liu, G.; Xie, J.; Cai, Z.; Wang, J. Simulated Experimental Effect of Bulk Density on Infiltration Rate of China’s Loess Plateau. Egypt. J. Soil Sci. 2025, 65, 239–252. [Google Scholar] [CrossRef]
  22. Graefe, U.; Baritz, R.; Broll, G.; Kolb, E.; Milbert, G.; Wachendorf, C. Adapting humus form classification to WRB principles. In Proceedings of the 4th International Congress of the European Soil Science Societies—Eurosoil, Bari, Italy, 2–6 July 2012; p. 954. [Google Scholar]
  23. Klute, A. Water Retention: Laboratory Methods. In Methods of Soil Analysis; Part 1—Physical and Mineralogical Methods, 2nd ed.; Klute, A., Ed.; ASA & SSSA: Madison, WI, USA, 1986; pp. 635–662. [Google Scholar] [CrossRef]
  24. Houghton, J.I.; Burgess, J.E.; Stephenson, T. Off-line particle size analysis of digested sludge. Water Res. 2002, 36, 4643–4647. [Google Scholar] [CrossRef]
  25. Nelson, D.W.; Sommers, L.E. Total carbon, organic carbon, and organic matter. Methods Soil Anal. Part 3-Chem. Methods 1996, 5, 961–1010. [Google Scholar] [CrossRef]
  26. Mbarki, Y.; Gumiere, S.J.; Celicourt, P.; Brédy, J. Study of the Effect of the Compaction Level on the Hydrodynamic Properties of Loamy Sand Soil in an Agricultural Context. Front. Water 2023, 5, 1255495. [Google Scholar] [CrossRef]
  27. Li, Z.; Wu, P.; Feng, H.; Zhao, X.; Huang, J.; Zhuang, W. Simulated Experiment on Effect of Soil Bulk Density on Soil Infiltration Capacity. Nongye Gongcheng Xuebao/Trans. Chin. Soc. Agric. Eng. 2009, 25, 40–45. [Google Scholar] [CrossRef]
  28. Feng, R.; Liu, G.; Chen, Y.; Wang, C.; Zhang, Q.; Wang, J. Impacts of Rainfall-Induced Physical Crust on near-Surface Soil Pore Structure after Drying. Catena 2024, 238, 107800. [Google Scholar] [CrossRef]
  29. Thomson, P.R.; Aituar-Zhakupova, A.; Hier-Majumder, S. Image Segmentation and Analysis of Pore Network Geometry in Two Natural Sandstones. Front. Earth Sci. 2018, 6, 58. [Google Scholar] [CrossRef]
  30. van Genuchten, M.T. A closed form equation for predicting the hydraulic conductivity of unsaturated soils. Soil Sci. Soc. Am. J. 1980, 44, 892–898. [Google Scholar] [CrossRef]
  31. Mualem, Y. Hydraulic Conductivity of Unsaturated Soils: Prediction and Formulas. In Methods of Soil Analysis; John and Wiley and Sons: Hoboken, NJ, USA; Wiley: Hoboken, NJ, USA, 1986; pp. 799–823. [Google Scholar] [CrossRef]
  32. Reynolds, W.D.; Drury, C.F.; Yang, X.M.; Tan, C.S. Optimal Soil Physical Quality Inferred through Structural Regression and Parameter Interactions. Geoderma 2008, 146, 466–474. [Google Scholar] [CrossRef]
  33. Antinoro, C.; Arnone, E.; Noto, L.V. The Use of Soil Water Retention Curve Models in Analyzing Slope Stability in Differently Structured Soils. Catena 2017, 150, 133–145. [Google Scholar] [CrossRef]
  34. Wu, X.; Wei, Y.; Wang, J.; Wang, D.; She, L.; Wang, J.; Cai, C. Effects of Soil Physicochemical Properties on Aggregate Stability along a Weathering Gradient. Catena 2017, 156, 205–215. [Google Scholar] [CrossRef]
  35. Zhou, Y.; Cheng, T. Influence of Natural Organic Matter in Porous Media on Fine Particle Transport. Sci. Total Environ. 2018, 627, 176–188. [Google Scholar] [CrossRef]
  36. Yom-Tov, O.; Neufeld, L.; Seliktar, D.; Bianco-Peled, H. A Novel Design of Injectable Porous Hydrogels with in Situ Pore Formation. Acta Biomater. 2014, 10, 4236–4246. [Google Scholar] [CrossRef] [PubMed]
  37. Kan, X.; Zheng, W.; Cheng, J.; Zhangzhong, L.; Li, J.; Liu, B.; Zhang, X. Investigating Soil Pore Network Connectivity in Varied Vegetation Types Using X-Ray Tomography. Water 2023, 15, 3823. [Google Scholar] [CrossRef]
  38. Weil, R.; Brady, N.C. Chapter 12: Soil Organic Matter. In Nature and Properties of Soils, 15th ed.; Pearson Education: London, UK, 2017; pp. 526–582. [Google Scholar]
  39. Arthur, E.; Schjønning, P.; Moldrup, P.; Tuller, M.; de Jonge, L.W. Density and Permeability of a Loess Soil: Long-Term Organic Matter Effect and the Response to Compressive Stress. Geoderma 2013, 193–194, 236–245. [Google Scholar] [CrossRef]
  40. Kay, B.D.; VandenBygaart, A.J. Conservation Tillage and Depth Stratification of Porosity and Soil Organic Matter. Soil Tillage Res. 2002, 66, 107–118. [Google Scholar] [CrossRef]
  41. Fu, Y.; Tian, Z.; Amoozegar, A.; Heitman, J. Measuring Dynamic Changes of Soil Porosity during Compaction. Soil Tillage Res. 2019, 193, 114–121. [Google Scholar] [CrossRef]
  42. Hamza, M.A.; Anderson, W.K. Soil Compaction in Cropping Systems: A Review of the Nature, Causes and Possible Solutions. Soil Tillage Res. 2005, 82, 121–145. [Google Scholar] [CrossRef]
  43. Hu, W.; Cichota, R.; Beare, M.; Müller, K.; Drewry, J.; Eger, A. Soil Structural Vulnerability: Critical Review and Conceptual Development. Geoderma 2023, 430, 116346. [Google Scholar] [CrossRef]
  44. Mady, A.Y.; Abdelhamid, M.A.; Shalaby, L.A.; Saeed, M.A. Evaluation of Pedotransfer Functions to Estimate Saturated Hydraulic Conductivity Using Machine Learning with Random Forest and Gradient Boosting Algorithms. Soil Environ. 2024, 43, 268–277. [Google Scholar] [CrossRef]
  45. Xiao, Z.; Yu, N.; An, J.; Zou, H.; Zhang, Y. Soil Compressibility and Resilience Based on Uniaxial Compression Loading Test in Response to Soil Water Suction and Soil Organic Matter Content in Northeast China. Sustainability 2022, 14, 2620. [Google Scholar] [CrossRef]
  46. Lipiec, J.; Medvedev, V.V.; Birkas, M.; Dumitru, E.; Lyndina, T.E.; Rousseva, S.; Fulajtar, E. Effect of Soil Compaction on Root Growth and Crop Yield in Central and Eastern Europe. Int. Agrophys. 2003, 17, 2. [Google Scholar]
  47. Talat, A.E.; Galal, M.E.; Yeser, A.; Saad El-Dein, A.A. Quantifying the Hydraulic Properties of Some Egyptian Soils Using RETC Code. Arab. Univ. J. Agric. Sci. 2020, 28, 685–694. [Google Scholar] [CrossRef]
  48. Luo, S.; Zhou, B.; Likos, W.J.; Lu, N. Determining Capillary Pore–Size Distribution of Soil from Soil–Water Retention Curve. J. Geotech. Geoenvironmental Eng. 2023, 150, 04023138. [Google Scholar] [CrossRef]
  49. Xu, Y.; Jimenez, M.A.; Parent, S.É.; Leblanc, M.; Ziadi, N.; Parent, L.E. Compaction of Coarse-Textured Soils: Balance Models across Mineral and Organic Compositions. Front. Ecol. Evol. 2017, 5, 83. [Google Scholar] [CrossRef]
  50. Ni, S.; Zhang, D.; Wen, H.; Cai, C.; Wilson, G.V.; Wang, J. Erosion Processes and Features for a Coarse-Textured Soil with Different Horizons: A Laboratory Simulation. J. Soils Sediments 2020, 20, 2997–3012. [Google Scholar] [CrossRef]
  51. Matus, F.J. Fine Silt and Clay Content Is the Main Factor Defining Maximal C and N Accumulations in Soils: A Meta-Analysis. Sci. Rep. 2021, 11, 6438. [Google Scholar] [CrossRef]
  52. Mahmoodlu, M.G.; Raoof, A.; Sweijen, T.; van Genuchten, M.T. Effects of Sand Compaction and Mixing on Pore Structure and the Unsaturated Soil Hydraulic Properties. Vadose Zone J. 2016, 15, 1–11. [Google Scholar] [CrossRef]
Figure 1. Two-dimensional images were obtained; purple regions represent the pore spaces within the soil matrix, while the dark background represents solid soil particles at soil compaction levels of P1, P2, P3, P4, and P5 for (a) Shenmu, (b) Suide, (c) Fuxian, (d) Chunhua, and (e) Yangling.
Water 17 01144 g001
Figure 2. Bulk density distribution (1.00–1.40 g cm−3) of soil physical properties (sand; silt; clay; SOC) and pore characteristics (φ-CT, CP, Vp, A, PN, TN, Dm, and Dx) for Shenmu (SH), Suide (SU), Fuxian (FU), Chunhua (CH), and Yangling (YA).
Water 17 01144 g002
Figure 3. Three-dimensional images of the soil core using Avizo software at soil compaction levels P1, P3, and P5 for (a) Shenmu, (b) Suide, (c) Fuxian, (d) Chunhua, and (e) Yangling; brown regions represent the soil matrix, and other colors represent the pore network model; each pore within the pore network model was color-coded based on diameter, ranging from deep blue for sizes below 500 μm to red for sizes exceeding 500 μm.
Water 17 01144 g003
Figure 4. Relationship between mean pore volume and pore diameter under soil compaction levels for different locations.
Water 17 01144 g004
Figure 5. (a) Soil water retention curve between observed and predicted data under compaction levels for different soil locations and textures. (b) Unsaturated hydraulic conductivity as a function of matric potential based on predicted Kun-SWRC and Kun-MDI data under compaction levels for different soil locations and textures.
Water 17 01144 g005
Figure 6. Total porosity for φ-SWRC and φ-CT under compaction levels for different soil locations and textures.
Water 17 01144 g006
Figure 7. Heatmap of Pearson correlations among soil physical properties, pore characteristics based on CT, SWRC, and hydraulic conductivity parameters, and pore characteristics based on SWRC.
Water 17 01144 g007
Table 1. Soil physical properties and CT-based soil pore network characteristics for different locations and soil textures under different soil compaction levels from P1 to P5.
Location and Soil TextureSoil Physical PropertiesPore Characteristics Using X-Ray CT
SandSiltClaySOCφ-CTCPVpADmDxPNTN
(%)(%)(%)(g kg−1)(%)(%)(μm)(mm)(μm)(μm)
Shenmu (SL)75.0 e12.9 a12.1 a2.57 a28.4 a26.9 a158 c1.04 c35.6 b4209.1 c102 a479 a
Suide
(L)
49.7 d28.7 b21.6 b3.47 b38.6 b36.7 b71.0 b0.44 b30.9 ab2764.2 b199 b1077 b
Fuxian
(CL)
35.0 c35.8 c29.2 c4.45 c38.7 b36.8 b67.4 b0.43 b27.5 ab2381.3 ab215 b1223 b
Chunhua (CL)29.3 b39.1 d31.6 c10.6 d50.2 c47.7 c40.5 ab0.22 ab25.1 ab1972.2 ab362 c2057 c
Yangling (CL)22.5 a39.8 d37.7 d29.3 e55.1 d51.6 c34.1 a0.15 a22.1 a1559.2 a478 d2776 d
Notes: SL, sandy loam; L, loam; CL, clay loam; φ-CT, CT-based total porosity; CP, connectivity porosity; Vp, pore volume; A, surface area; Dm, minimum diameter; Dx, maximum diameter; PN, pore number; and TN, throats number. Different lowercase letters following the mean value indicate significant differences (p < 0.05) among the soil compaction levels for soil location. All interpretations of suffixes for each column are mentioned in the “Appendix A”.
Table 2. Pearson correlation between soil physical properties and pore characteristics using X-ray CT.
Soil Physical
Properties
Pore Characteristics Using X-Ray CT
φ-CTCPVpADmDxPNTN
Sand−0.899 **−0.899 **0.873 **0.885 **0.519 **0.774 **−0.831 **−0.828 **
Silt0.875 **0.878 **−0.889 **−0.895 **−0.492 **−0.774 **0.791 **0.789 **
Clay0.906 **0.901 **−0.837 **−0.855 **−0.537 **−0.757 **0.857 **0.852 **
SOC0.841 **0.825 **−0.545 **−0.579 **−0.410 *−0.562 **0.902 **0.899 **
Note: “*” and “**” represent significant correlations at the 0.05 and 0.01 levels, respectively.
Table 3. The van Genuchten model parameters, soil physical quality parameters, and hydraulic conductivity of the soil location and texture under different compaction levels.
Location and Soil
Texture
Compaction LevelsθsθrαnFCWPAWRFCKs
(cm3 cm−3)(cm−1) (cm3 cm−3) cm h−1
Shenmu (SL)P10.415 0.2600.0600.2000.62769.80
P20.408 0.2520.0640.1880.61866.20
P30.4070.0650.0751.890.2440.0640.1800.60065.10
P40.402 0.2320.0590.1740.57864.30
P50.387 0.2270.0580.1690.58762.70
Suide (L)P10.465 0.3390.0940.2450.72924.20
P20.457 0.3290.0910.2380.72022.85
P30.4510.0780.0361.560.3110.0900.2210.69021.90
P40.443 0.3000.0900.2100.67720.40
P50.428 0.2830.0900.1930.66119.80
Fuxian (CL)P10.468 0.4080.1620.2460.8728.22
P20.462 0.3980.1600.2380.8617.55
P30.4580.0950.0191.310.3900.1570.2330.8527.15
P40.453 0.3820.1550.2270.8436.78
P50.448 0.3710.1530.2180.8286.26
Chunhua (CL)P10.473 0.4230.1730.2500.8948.05
P20.472 0.4170.1700.2470.8837.38
P30.4680.0950.0191.310.4110.1670.2440.8786.90
P40.462 0.4040.1670.2370.8746.49
P50.459 0.3930.1650.2280.8566.14
Yangling (CL)P10.496 0.4420.1680.2740.8917.53
P20.481 0.4270.1640.2630.8887.10
P30.4790.0950.0191.310.4140.1650.2490.8636.43
P40.476 0.4060.1630.2430.8535.94
P50.470 0.3980.1600.2380.8475.78
Means for soil compaction levelsP10.463 0.3740.1310.2430.80323.56
P20.456 0.3650.1300.2350.79422.22
P30.4530.0860.0341.480.3540.1290.2250.77621.50
P40.447 0.3450.1270.2180.76520.78
P50.438 0.3340.1250.2090.75620.14
Means for location and soil textureShenmu (SL)0.4040.0650.0751.890.2430.0610.1820.60265.62
Suide (L)0.4490.0780.0361.560.3120.0910.2210.69521.83
Fuxian (CL)0.4580.0950.0191.310.3900.1570.2320.8517.19
Chunhua (CL)0.4670.0950.0191.310.4100.1680.2410.8776.99
Yangling (CL)0.4800.0950.0191.310.4170.1640.2530.8686.56
Note: parameter values (θr, α, and n) of the van Genuchten model [30].
Table 4. Parameter values (θs, θr, α, and n) of the van Genuchten model predicted under soil compaction levels (P1, P2, P3, P4, P5) for the location and soil texture.
Location and Soil TextureCompaction LevelsθsθrαnR2
(cm3 cm−3)(cm−1)
Shenmu (SL)P10.4070.0670.00382.830.997
P20.4010.0630.00382.940.997
P30.3990.0660.00402.830.998
P40.3900.0630.00482.480.994
P50.3820.0510.00901.840.973
Suide (L)P10.4610.0800.00391.820.991
P20.4580.0500.00531.540.993
P30.4500.0660.00541.610.991
P40.4420.0660.00501.660.986
P50.4290.0500.00611.520.986
Fuxian (CL)P10.4740.0960.00491.330.978
P20.4660.1120.00551.350.969
P30.4650.0670.00731.280.961
P40.4580.0610.00801.270.968
P50.4480.1200.00591.440.974
Chunhua (CL)P10.4730.1570.00261.690.967
P20.4660.1530.00261.700.975
P30.4640.1550.00301.680.967
P40.4530.1590.00281.740.966
P50.4510.1440.00351.600.969
Yangling (CL)P10.4940.1620.00241.840.982
P20.4830.1550.00251.760.983
P30.4750.1520.00271.730.981
P40.4710.1470.00291.680.982
P50.4640.1440.00301.670.982
Note: R2, coefficient of determination between observed and predicted θ (h) data for estimation of α and n.
Table 5. Parameter values (α and n) of the van Genuchten model for unsaturated hydraulic conductivity predicted from a mini disc infiltrometer under soil compaction levels (P1, P2, P3, P4, P5) for the location and soil texture.
Location and Soil TextureCompaction Levelsα (cm−1)nR2
Shenmu (SL)P10.16391.970.989
P20.16792.030.991
P30.16862.040.992
P40.17852.070.997
P50.19842.250.998
Suide (L)P10.15051.640.998
P20.15401.800.997
P30.15801.860.996
P40.15961.950.996
P50.16191.960.991
Fuxian (CL)P10.03521.130.999
P20.04441.190.998
P30.07391.330.999
P40.13481.530.999
P50.14791.570.999
Chunhua (CL)P10.03511.080.991
P20.03851.190.990
P30.05471.200.966
P40.07831.470.949
P50.14191.550.962
Yangling (CL)P10.02941.070.982
P20.03851.140.983
P30.04671.190.951
P40.07421.450.952
P50.14131.540.940
Note(s): Parameter values (α and n) of the van Genuchten model predicted by Talat et al. [21]; R2, coefficient of determination between Kun-SWRC and Kun-MDI predicted data.
Table 6. Soil pore volume of transmission, storage, and residual pore classes under soil compaction levels (P1, P2, P3, P4, P5) for the location and soil texture.
Location and
Soil Texture
Compaction
Levels
Residual PoresStorage PoresTransmission Pores
>6000 hPa6000–100 hPa
(cm3 cm−3)
<100 hPa
Shenmu (SL)P10.11580.18720.0161
P20.11180.18520.0160
P30.10900.18270.0158
P40.10770.17230.0156
P50.10570.16290.0154
Suide (L)P10.16410.22820.0110
P20.16340.21830.0107
P30.16020.21400.0107
P40.15530.21220.0106
P50.15330.20110.0104
Fuxian (CL)P10.17070.23430.0077
P20.16100.22810.0078
P30.16840.22290.0070
P40.16610.21780.0067
P50.15680.21660.0072
Chunhua (CL)P10.22060.27090.0043
P20.20930.26720.0042
P30.20290.26430.0043
P40.20060.25890.0041
P50.16220.25430.0040
Yangling (CL)P10.22170.28410.0034
P20.21650.27720.0032
P30.21140.27180.0033
P40.20080.26840.0032
P50.18800.26400.0031
Means for soil compaction levelsP10.17860.24090.0085
P20.17240.23520.0084
P30.17040.23110.0082
P40.16610.22590.0080
P50.15320.21980.0080
Means for location and soil textureShenmu (SL)0.11000.17810.1578
Suide (L)0.15930.21480.1068
Fuxian (CL)0.16460.22390.0073
Chunhua (CL)0.19910.26310.0042
Yangling (CL)0.20680.27310.0032
Notes: Transmission pore volume was estimated as the difference between volumetric water contents at matric suctions between saturation and <100 hPa; storage pore volume was estimated as the difference between volumetric water contents at matric suctions between 6000 and 100 hPa; and residual pore volume was estimated as the difference between total porosity (saturation) and volumes of transmission pores and storage pores.
Disclaimer/Publisher’s Note: The statements, opinions and data contained in all publications are solely those of the individual author(s) and contributor(s) and not of MDPI and/or the editor(s). MDPI and/or the editor(s) disclaim responsibility for any injury to people or property resulting from any ideas, methods, instructions or products referred to in the content.

