Article

Coupling Coordination Relationships Between Water Resource–Water Environment–Social Economy Resilience and Ecosystem Services in Five Provinces of Northwest China

1
College of Geographic Science and Tourism, Xinjiang Normal University, Urumqi 830054, China
2
Xinjiang Laboratory of Lake Environment and Resources in Arid Zone, Urumqi 830054, China
*
Author to whom correspondence should be addressed.
Water 2025, 17(8), 1172; https://doi.org/10.3390/w17081172
Submission received: 20 March 2025 / Revised: 1 April 2025 / Accepted: 10 April 2025 / Published: 14 April 2025
(This article belongs to the Section Water Resources Management, Policy and Governance)

Abstract

:
In the context of global climate change and intensified anthropogenic pressures, the coordinated development of a social-ecological system (SES) faces unprecedented challenges, necessitating an enhanced understanding of complex system interactions to achieve SES sustainability. This study quantified water resource–water environment–social economy resilience (WR-WE-SEr) and four ecosystem services (ESs)—water yield (WY), habitat quality (HQ), soil retention (SR), and carbon storage (CS)—in Northwest China from 2010 to 2020. Intersystem interactions were analyzed using resilience theory, the InVEST model, and the coupling coordination degree (CCD) model. The key findings include the following: (1) Spatiotemporal evolution patterns (RQ1): WR-WE-SEr exhibited sustained growth with significant regional disparities (Qinghai > Xinjiang > Gansu > Shaanxi > Ningxia), predominantly driven by resistance-dominated dynamics. ESs showed spatial heterogeneity: WY was concentrated in humid areas but declined temporally, while HQ and CS aligned with vegetation/land cover. All ESs followed a “V”-shaped trajectory of initial decline and recovery, with localized fluctuations but regional stability. (2) Coordinated coupling relationships (RQ2): The CCD between WR-WE-SEr and ESs maintained temporal stability but mirrored ESs’ spatial patterns, characterized by a southeast–northwest diminishing gradient. Coordination hierarchy (CS > HQ > WY > SR) and regional performance (Shaanxi > Ningxia > Qinghai > Gansu > Xinjiang) revealed synergies between system resilience and ES provisioning capacity. Transitional coordination (dissonance to coordination) at the integrated ES level highlighted gradual optimization of human–nature interactions. These findings underscore the need for multidimensional strategies to enhance WR-WE-SE-ES synergies in Northwest China.

1. Introduction

Natural ecosystems and human social systems are interdependently coupled, forming social-ecological systems (SES) [1,2]. During the Anthropocene epoch, global climate change has escalated risks of ecosystem imbalance, with water ecological systems exhibiting marked instability driven by natural-ecological and social ecological risk coevolution [3,4]. Coordinating human–water conflicts through integrated water resource–water environment–water ecology governance, while synergistically enhancing ecosystem services (ESs), has become pivotal for regional ecological security, high-quality development, and territorial spatial governance [5,6].
As fundamental natural assets and strategic economic resources, water resources possess dual natural-social attributes, constituting a water resource-water environment-social economy (WR-WE-SE) coupled subsystem within an SES centered on water resources that possesses dual natural-social attributes [7]. The water resources, water environment, social economy, and ecosystem (WR-WE-SE-ES) complex system operates through multiscale interactions that profoundly influence regional ecological security, social economic development, and human well-being [8].
Under intensified global climate change and anthropogenic pressures, the coordinated development of the WR-WE-SE-ES faces unprecedented challenges [9]. Escalating conflicts among water scarcity, pollution, and ecological degradation directly threaten regional ecological security and sustainable social economic development [10,11]. Specifically, climate-induced spatiotemporal water resource disparities and extreme weather events exacerbate supply-demand imbalances [12,13]. Rapid urbanization/industrialization drive resource overexploitation and water ecosystem degradation [12,14]. Social economic overdependence on water resources amplifies ecological vulnerability [15]. Thus, clarifying WR-WE-SE-ES coupling coordination mechanisms is imperative for reconciling water management, social economic growth, and ecological conservation [16].
Current limitations include quantification challenges in SES complexity and fragmented analyses of subsystem elements [17]. Resilience theory has emerged as a critical framework for assessing complex system stability and adaptive capacity [18]. Applications span single-factor analyses—water resource resilience evaluation [19], urban water environment planning under climate change [20], regional economic resilience [21], and ecological quality assessment [22]—and multi-factor analyses: system resilience across meteorological, hydrological, ecological, and social economic dimensions [23]. Quantifying SES resilience provides novel insights into system states and interaction dynamics, enabling spatiotemporal analysis of WR-WE-SE complex systems.
Northwest China, which is located in arid/semiarid zones, represents a water-scarce region with extreme ecological fragility [24]. This region has long suffered from acute human–water conflicts rooted in the structural imbalance between natural water resource endowment and anthropogenic demands [25], manifested as water resource overexploitation [26,27] and ecological water appropriation [28], consequently triggering chain-reaction ES degradation [29]. Water-driven ESs in this region critically sustain social economic activities and ecosystem stability, underpinning complex system resilience [30]. Quantifying WR-WE-SE resilience (WR-WE-SEr) and ESs synergistically reveals system responses to external perturbations, informing water management and social economic planning [31].
This study analyzes Northwest China (2010–2020) via remote sensing and social economic data. Through resilience theory, the InVEST model, and the coupling coordination degree (CCD) model, we establish a WR-WE-SE-ES evaluation framework with ESs as the nexus and attempt to answer the following research questions, aiming to provide a reference for the coordinated development of water resources, the social economy, and ecological environment in Northwest China, and to support the construction of a beautiful China.
RQ1: What spatiotemporal evolution patterns characterize WR-WE-SEr and ESs in the study area?
RQ2: Does coordinated coupling exist between WR-WE-SEr and ESs during evolutionary development?

2. Materials and Methods

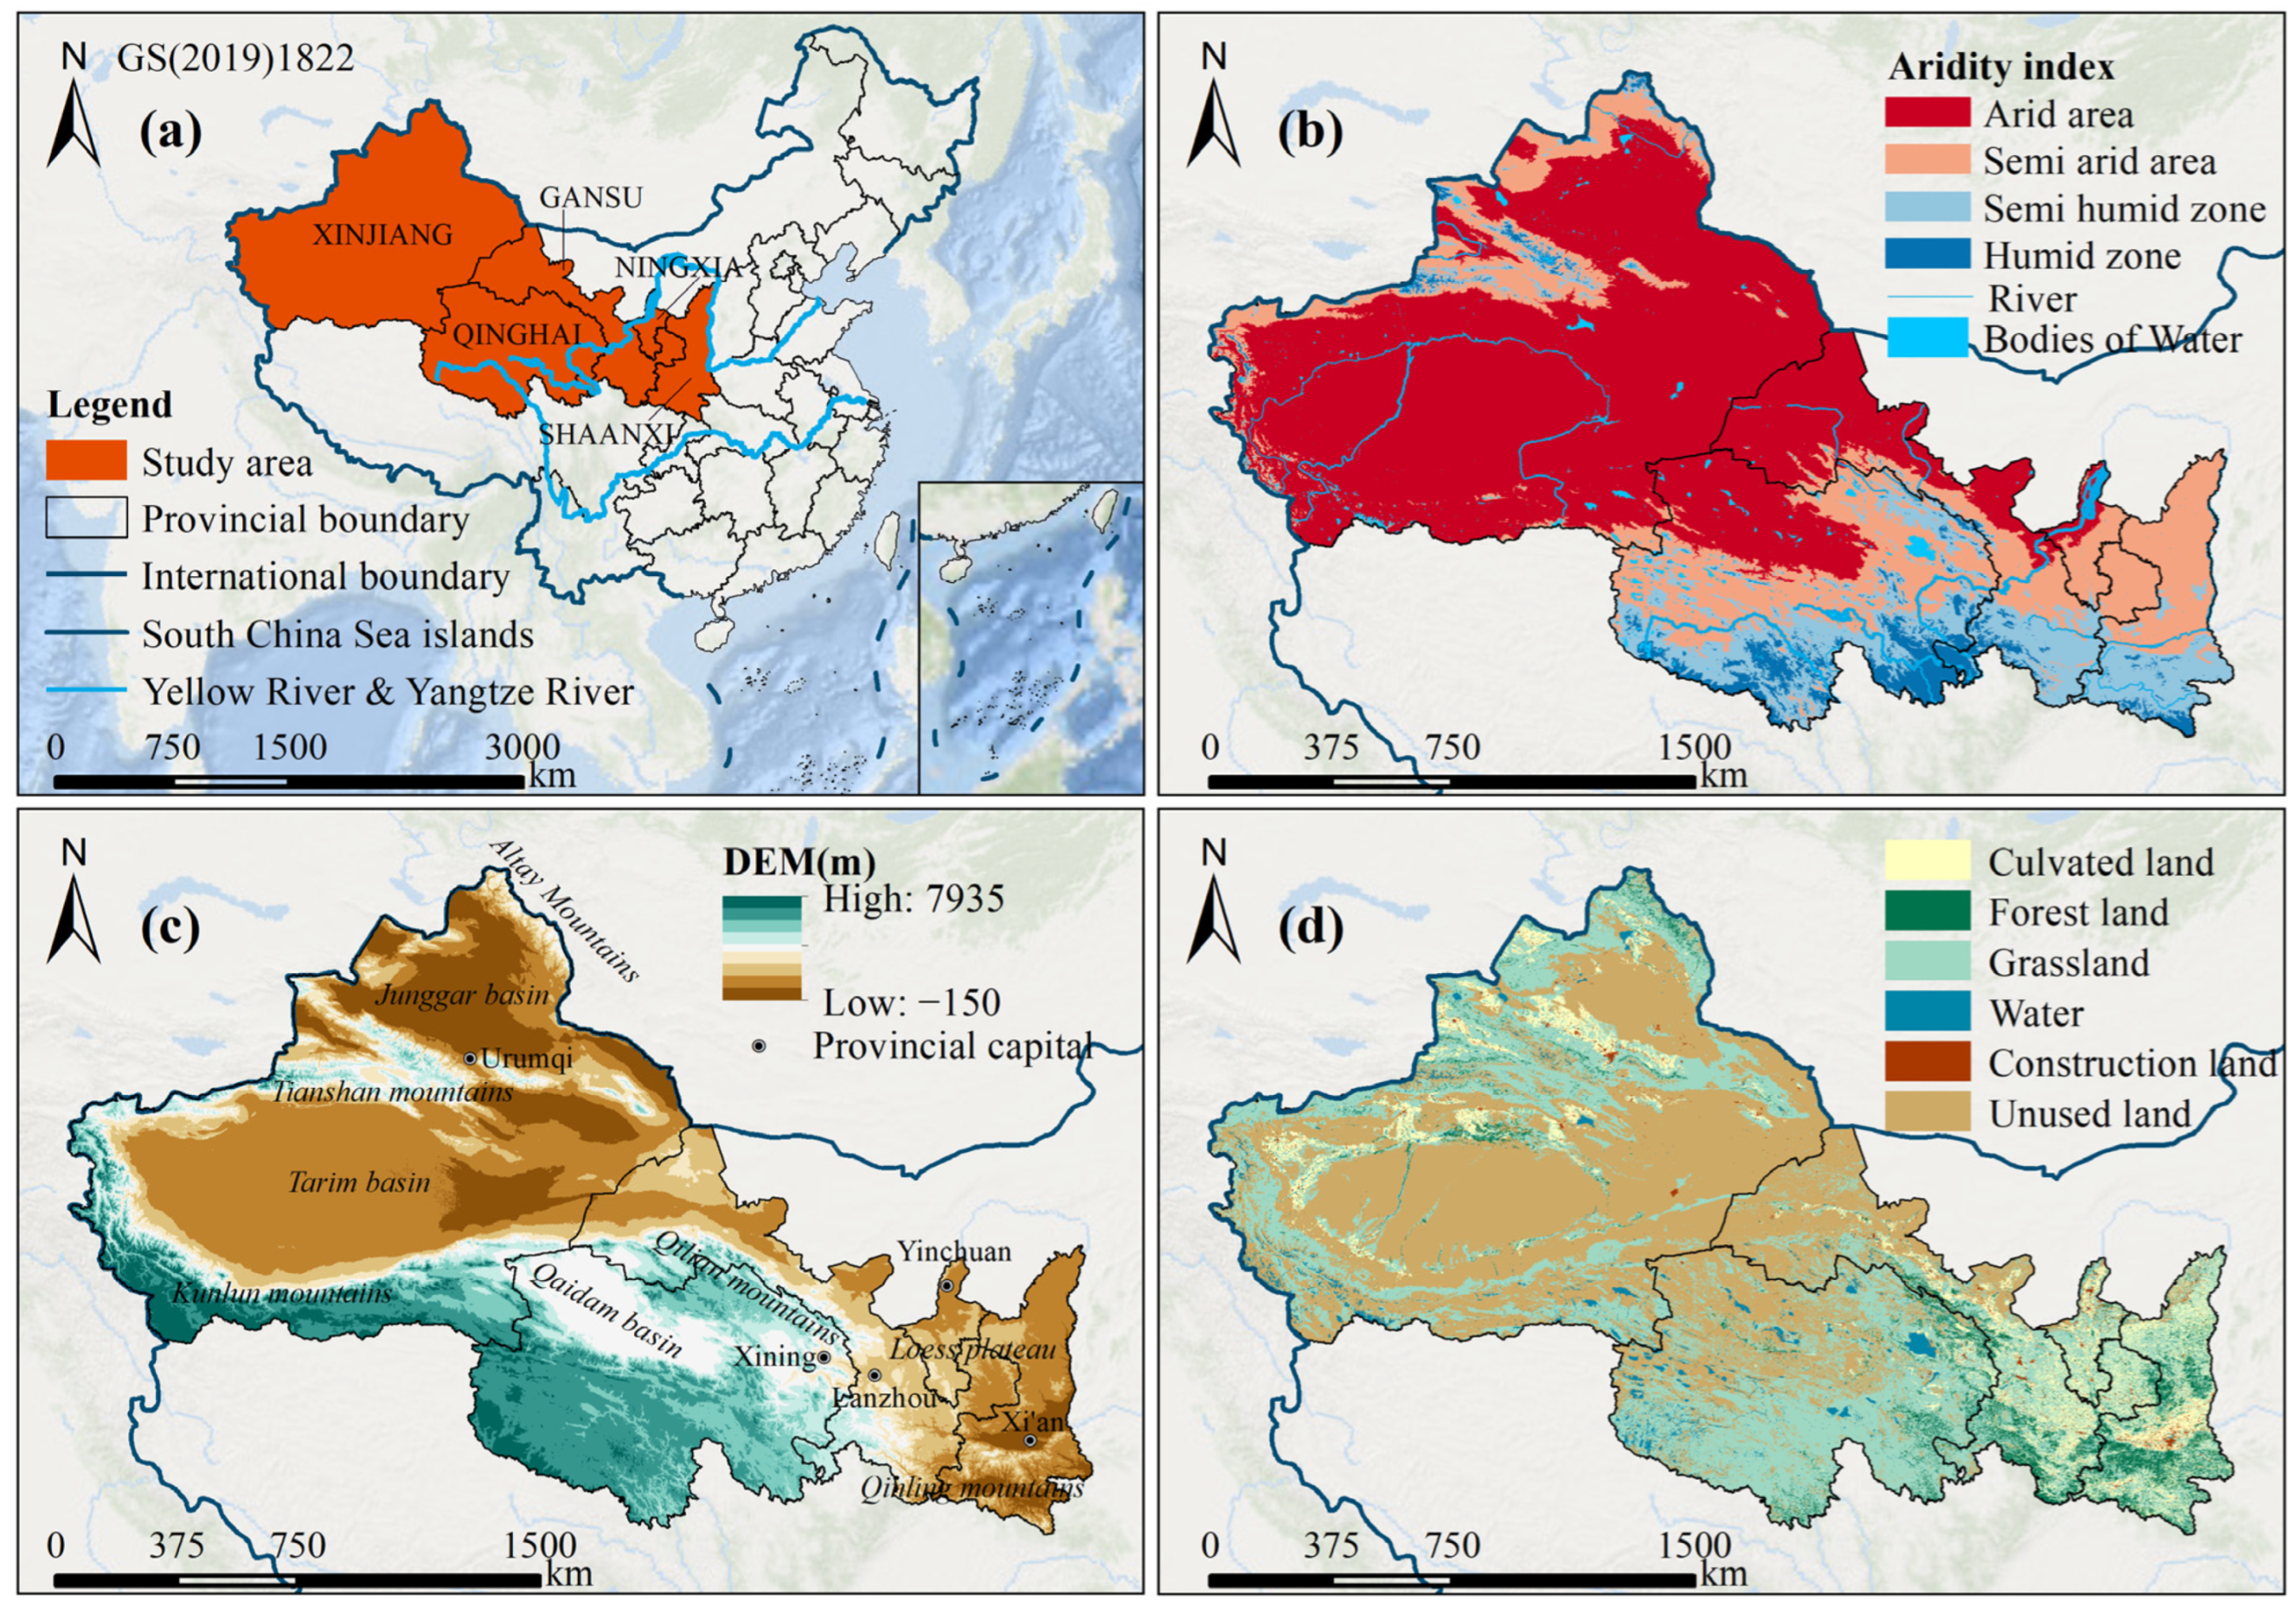
2.1. Study Area and Data Sources

Northwest China is geographically situated in the interior of the Eurasian continent (31°35′–49°15′ N, 73°25′–110°55′ E), administratively encompassing Shaanxi, Gansu, Qinghai, Ningxia, and Xinjiang Provinces. As the strategic core of the Silk Road Economic Belt, it spans 3.04 million km², accounting for approximately 32% of China’s total territory (Figure 1a). The region has three defining characteristics: (1) Climatic aridity gradient: dominated by arid and semi-arid zones, the region exhibits marked contrasts in water availability (Figure 1b) [24]. (2) Ecological vulnerability: complex terrain and fragile environmental endowments create systemic ecological risks (Figure 1c) [32]. (3) Ecosystem diversity: dominant landscapes include deserts, such as the Gobi desert, grasslands, forests, and oases (Figure 1d) [33]. Rapid population growth and economic development have exacerbated water supply–demand imbalances, environmental degradation, and ecological fragility, posing critical threats to ecosystem stability and societal well-being: this necessitates the urgent exploration of WR-WE-SE-ES coupling coordination mechanisms [34].
The datasets incorporate multisource spatial-temporal information (Table 1): geospatial data: land use/cover, digital elevation model, soil (2009), precipitation, potential evapotranspiration for 2010, 2015, and 2020, and aridity index (2020). Social economy data: These data were derived from authoritative sources, including the China Statistical Yearbook and China Environmental Statistical Yearbook. All the data were preprocessed to ensure temporal consistency and were spatially resampled to a unified 30-meter resolution.

2.2. Coupling Analysis Framework for WR-WE-SE and ES

The analytical framework for coupling WR-WE-SE systems with ES comprises five components (Figure 2): data collection (Figure 2a); coupling framework development (Figure 2b); the quantification of the WR-WE-SEr (Figure 2c); the quantification of the ESs (Figure 2d); the CCD model (Figure 2e).
In the coupled framework of water WR-WE-SE and ES (Figure 2b), the Earth system serves as the highest-level framework encompassing both social and ecological systems, reflecting the integral relationship between human activities and natural environments [35]. SES emphasizes the dynamic equilibrium between social and ecological systems [36]. Accordingly, this framework further subdivides the Earth system into three subsystems: natural resources, social economic development, and the ecological environment [37]. Given that water resources possess dual natural and social attributes, their essence in SES manifests as a coupled system centered on human–water interactions, integrating WR-WE-SE [7]. Owing to the intensive interactions among subsystems, this study employs resilience theory to establish WR-WE-SE as an integrated research system for quantifying resilience components (including resistance, adaptability, and restoration) [7]. Simultaneously, through the lens of ESs, quantitative assessments of key ES indicators (such as water yield, habitat quality, soil retention, and carbon storage) can be conducted [38].

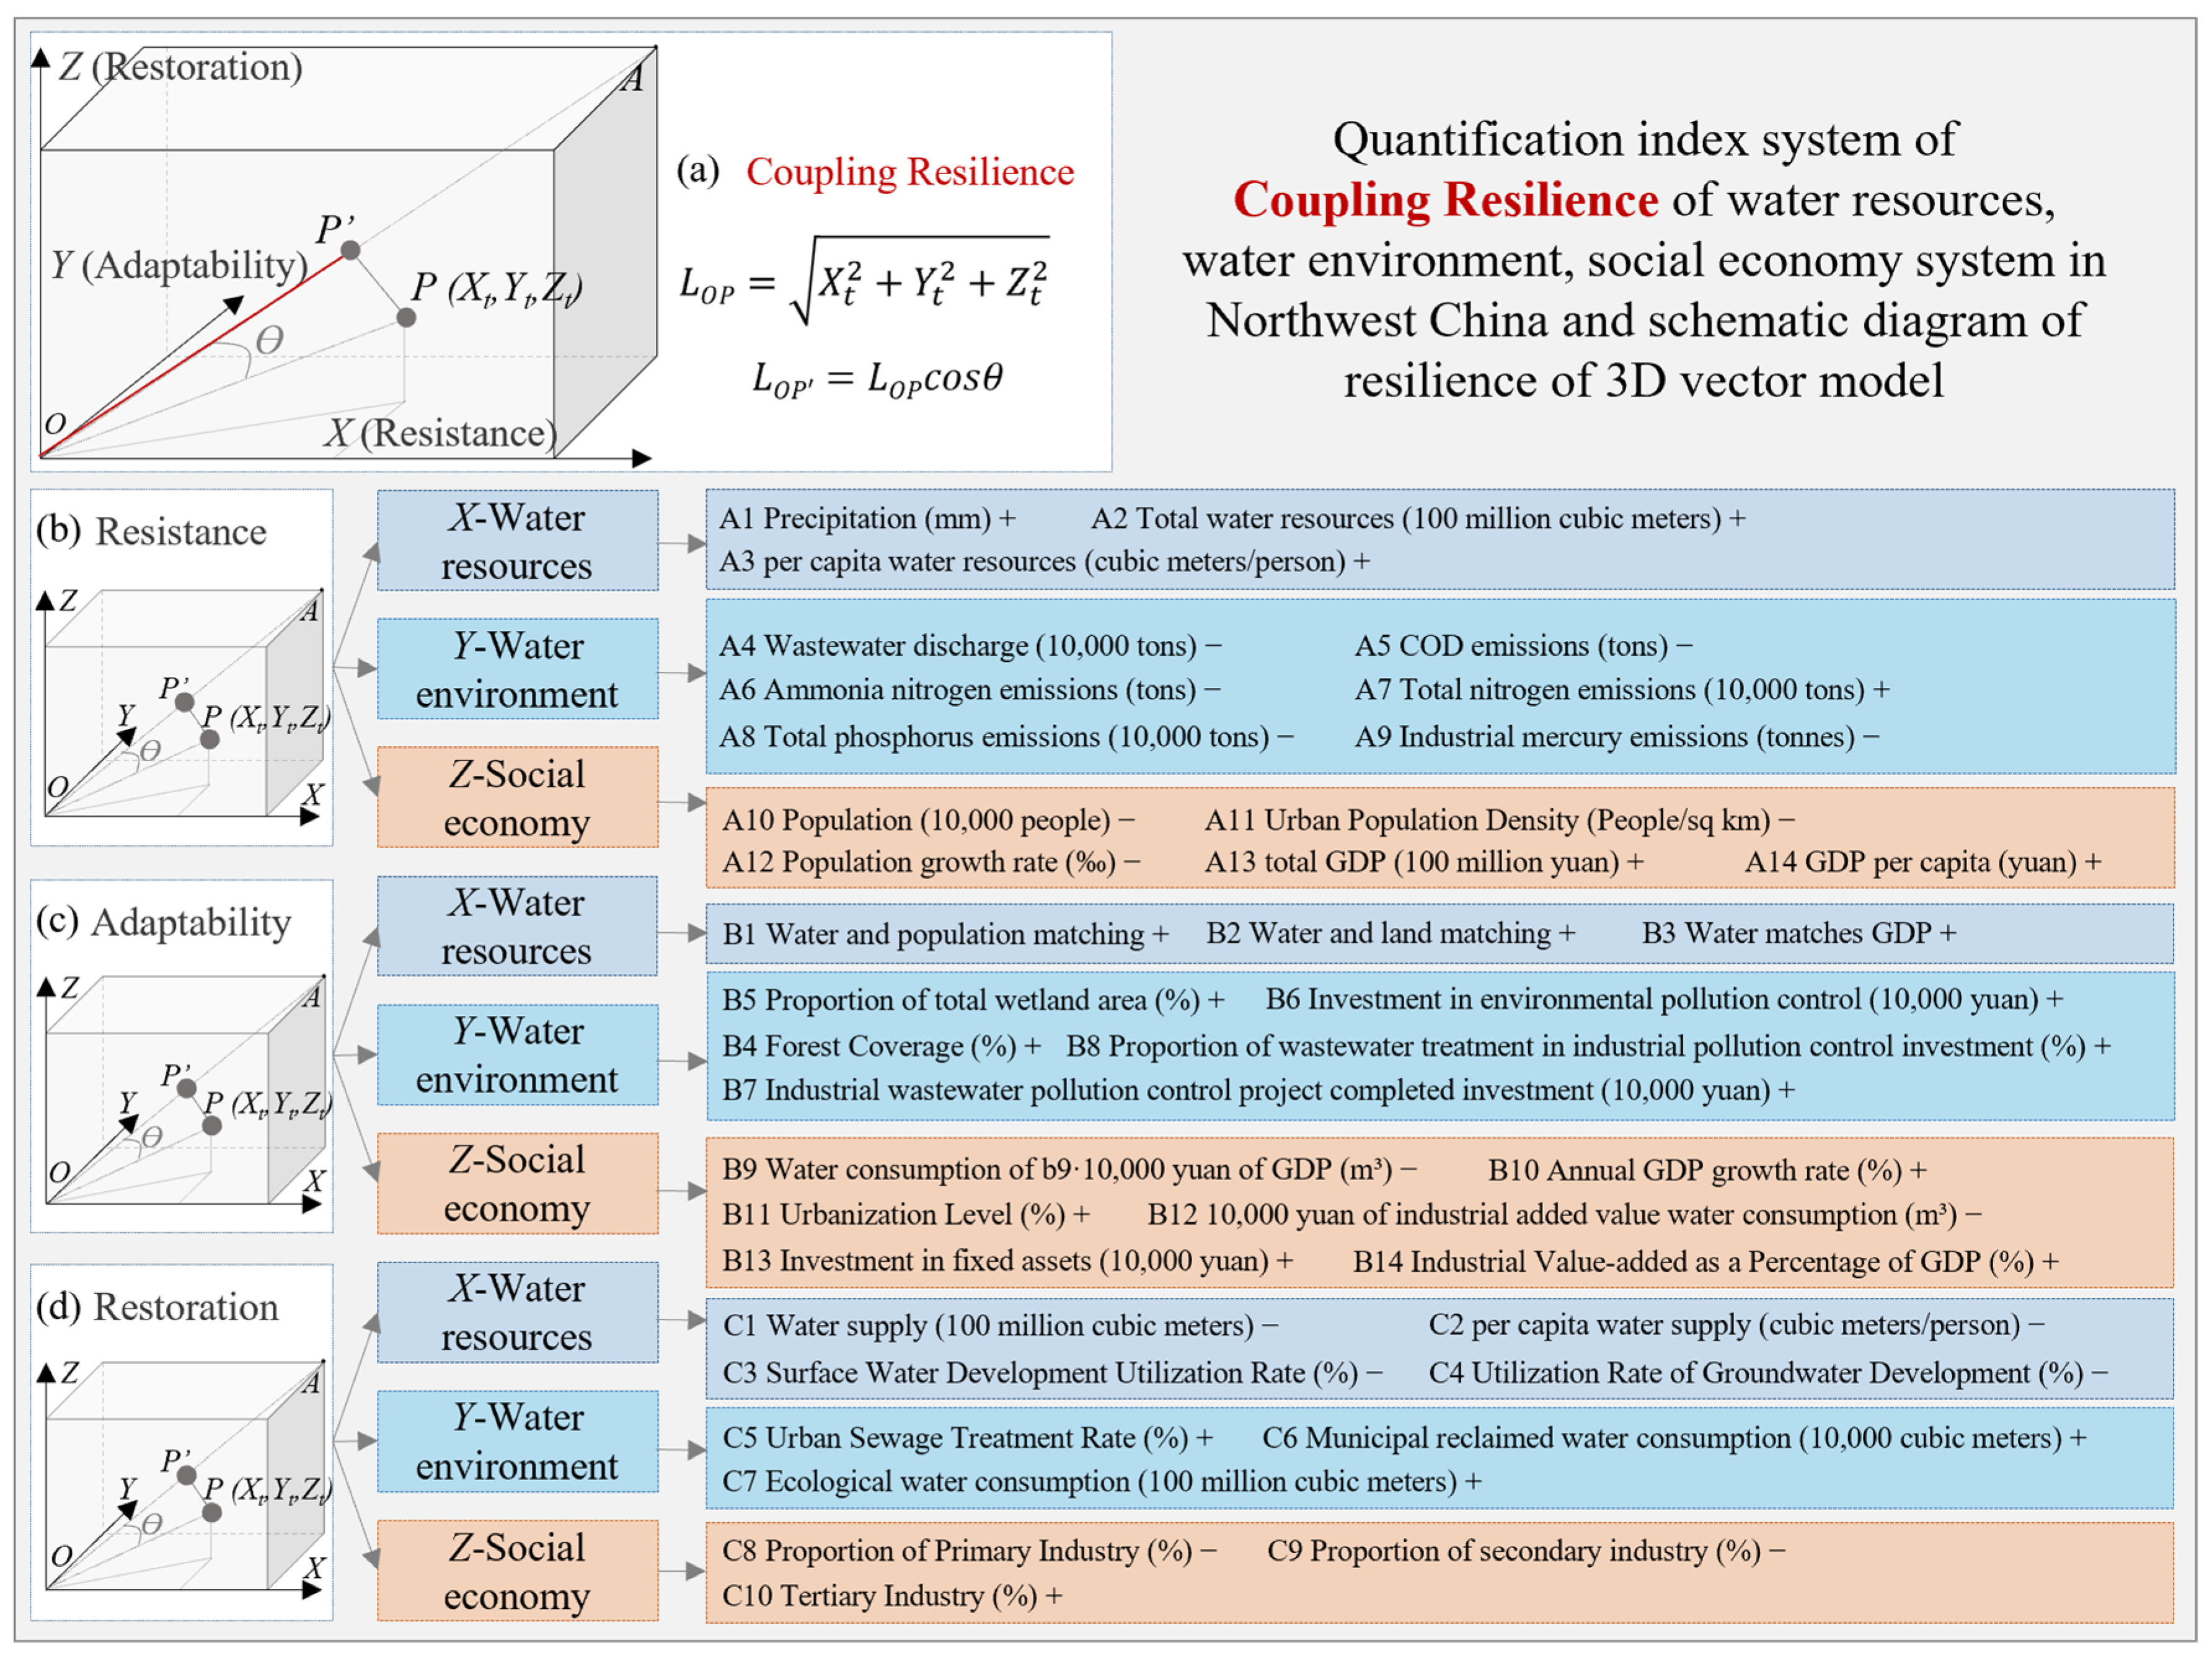
2.3. Quantification of WR-WE-SEr

Resilience describes a system’s capacity to recover to equilibrium after disturbance through integrated resistance, adaptability, and restoration mechanisms [39]. Building on this theoretical foundation, we developed a WR-WE-SEr assessment framework for Northwest China (Figure 3), incorporating standardized indicator preprocessing and dimensionality reduction to ensure methodological rigor [7]. The 3D vector model quantifies WR-WE-SEr through orthogonal axis mapping: the X-axis (resistance capacity) reflects water resource pressure resistance (precipitation, COD emissions), Y-axis (adaptability potential) measures socioeconomic adjustments (water-population matching efficiency), and the Z-axis (restoration capability) characterizes ecological governance (ecological water consumption).
As illustrated in Figure 3a, point O represents the minimum resilience state, and point A denotes the optimal resilience state. Vector OA defines the ideal resilience enhancement trajectory, while vector OP represents the observed state at time t. The resilience index LOP is derived from the orthogonal projection of OP onto OA [7]:
L O P = X t 2 + Y t 2 + Z t 2
L O P = L O P C O S θ
where LOP quantifies total resilience, and θ reflects divergence between actual (OP) and optimal (OA) trajectories. Higher LOP values indicate stronger alignment with resilience optimization. Subsystem-specific quantification (Figure 3b–d) follows identical principles, with standardized indicators weighted by their contributions to each axis (precipitation for X-axis, wastewater discharge for Y-axis, and population growth rate for Z-axis). This model spatially visualizes multidimensional trade-offs—for instance, X-axis dominance signals robust resistance but insufficient adaptability or restoration—guiding targeted resource management [7].

2.4. Quantification of ESs

Four critical ESs were assessed via the InVEST model with the following evaluation formulas [40,41,42,43].
Water yield (WY) [44]. This indicator reflects the natural water provisioning capacity, which is crucial for arid Northwest China’s agricultural, industrial, and domestic water security.
Y x j = ( 1 A E T x j P x ) × P x
where Yxj represents the annual water yield (mm) in grid cell x of land type j, Px represents the annual precipitation (mm), and AETx represents the actual evapotranspiration derived from 1 km monthly potential evapotranspiration data.
Habitat quality (HQ) [44]. This indicator indicates biodiversity maintenance capacity, which is vital for assessing ecological stability and planning restoration.
Q x = H x × ( 1 D x z D x z + K z )
where Qx is the habitat quality index (0–1), Dx is the degree of habitat degradation, z is the normalization constant, and K is the half-saturation constant (50% of the maximum Dx).
Soil retention (SR) [44]. Erosion control capacity is measured via the sediment delivery ratio module with a modified RUSLE.
S R = R × K × L S × ( 1 C × P )
where the following hold: R: rainfall erosivity; K: soil erodibility; LS: topographic factor; C: vegetation cover factor; and P: conservation practice factor.
Carbon storage (CS) [45]. The climate regulation capacity is quantified via the carbon storage module.
C t o t , x = C a b o v e , x + C b e l o w , x + C s o i l , x + C d e a d , x
where Ctot, x represents the total carbon stock in grid cell x, comprising aboveground, belowground, soil, and dead organic carbon pools.

2.5. CCD Model

Resilience theory elucidates the dynamic equilibrium of systems under external perturbations, while ESs quantification reflects their functional outputs. Their integration reveals how system resilience (resistance, adaptability, restoration) sustains ES provisioning, providing a dual lens to assess WR-WE-SEr and ESs synergies. Synergies between WR-WE-SE resilience and ESs were evaluated through the CCD model, using the following formulas [46,47,48].
C = 2 × 1 ( U 2 U 1 ) × U 1 U 2
T = α × U 1 + β × U 2
D = C × T
U1 and U2 are the assessment measures of WR-WE-SEr and ESs, respectively, with U2 being the greater of the two. C: Coupling degree (0–1). T: Comprehensive development index (α = β = 0.5) [47]. D: CCDs are classified into six levels (Figure 2e): extreme dissonance (0 ≤ D < 0.2), moderate dissonance (0.2 ≤ D < 0.4), mild dissonance (0.4 ≤ D < 0.5), primary coordination (0.5 ≤ D < 0.6), moderate coordination (0.6 ≤ D < 0.8), and high coordination (0.8 ≤ D < 1) [48,49].

3. Results

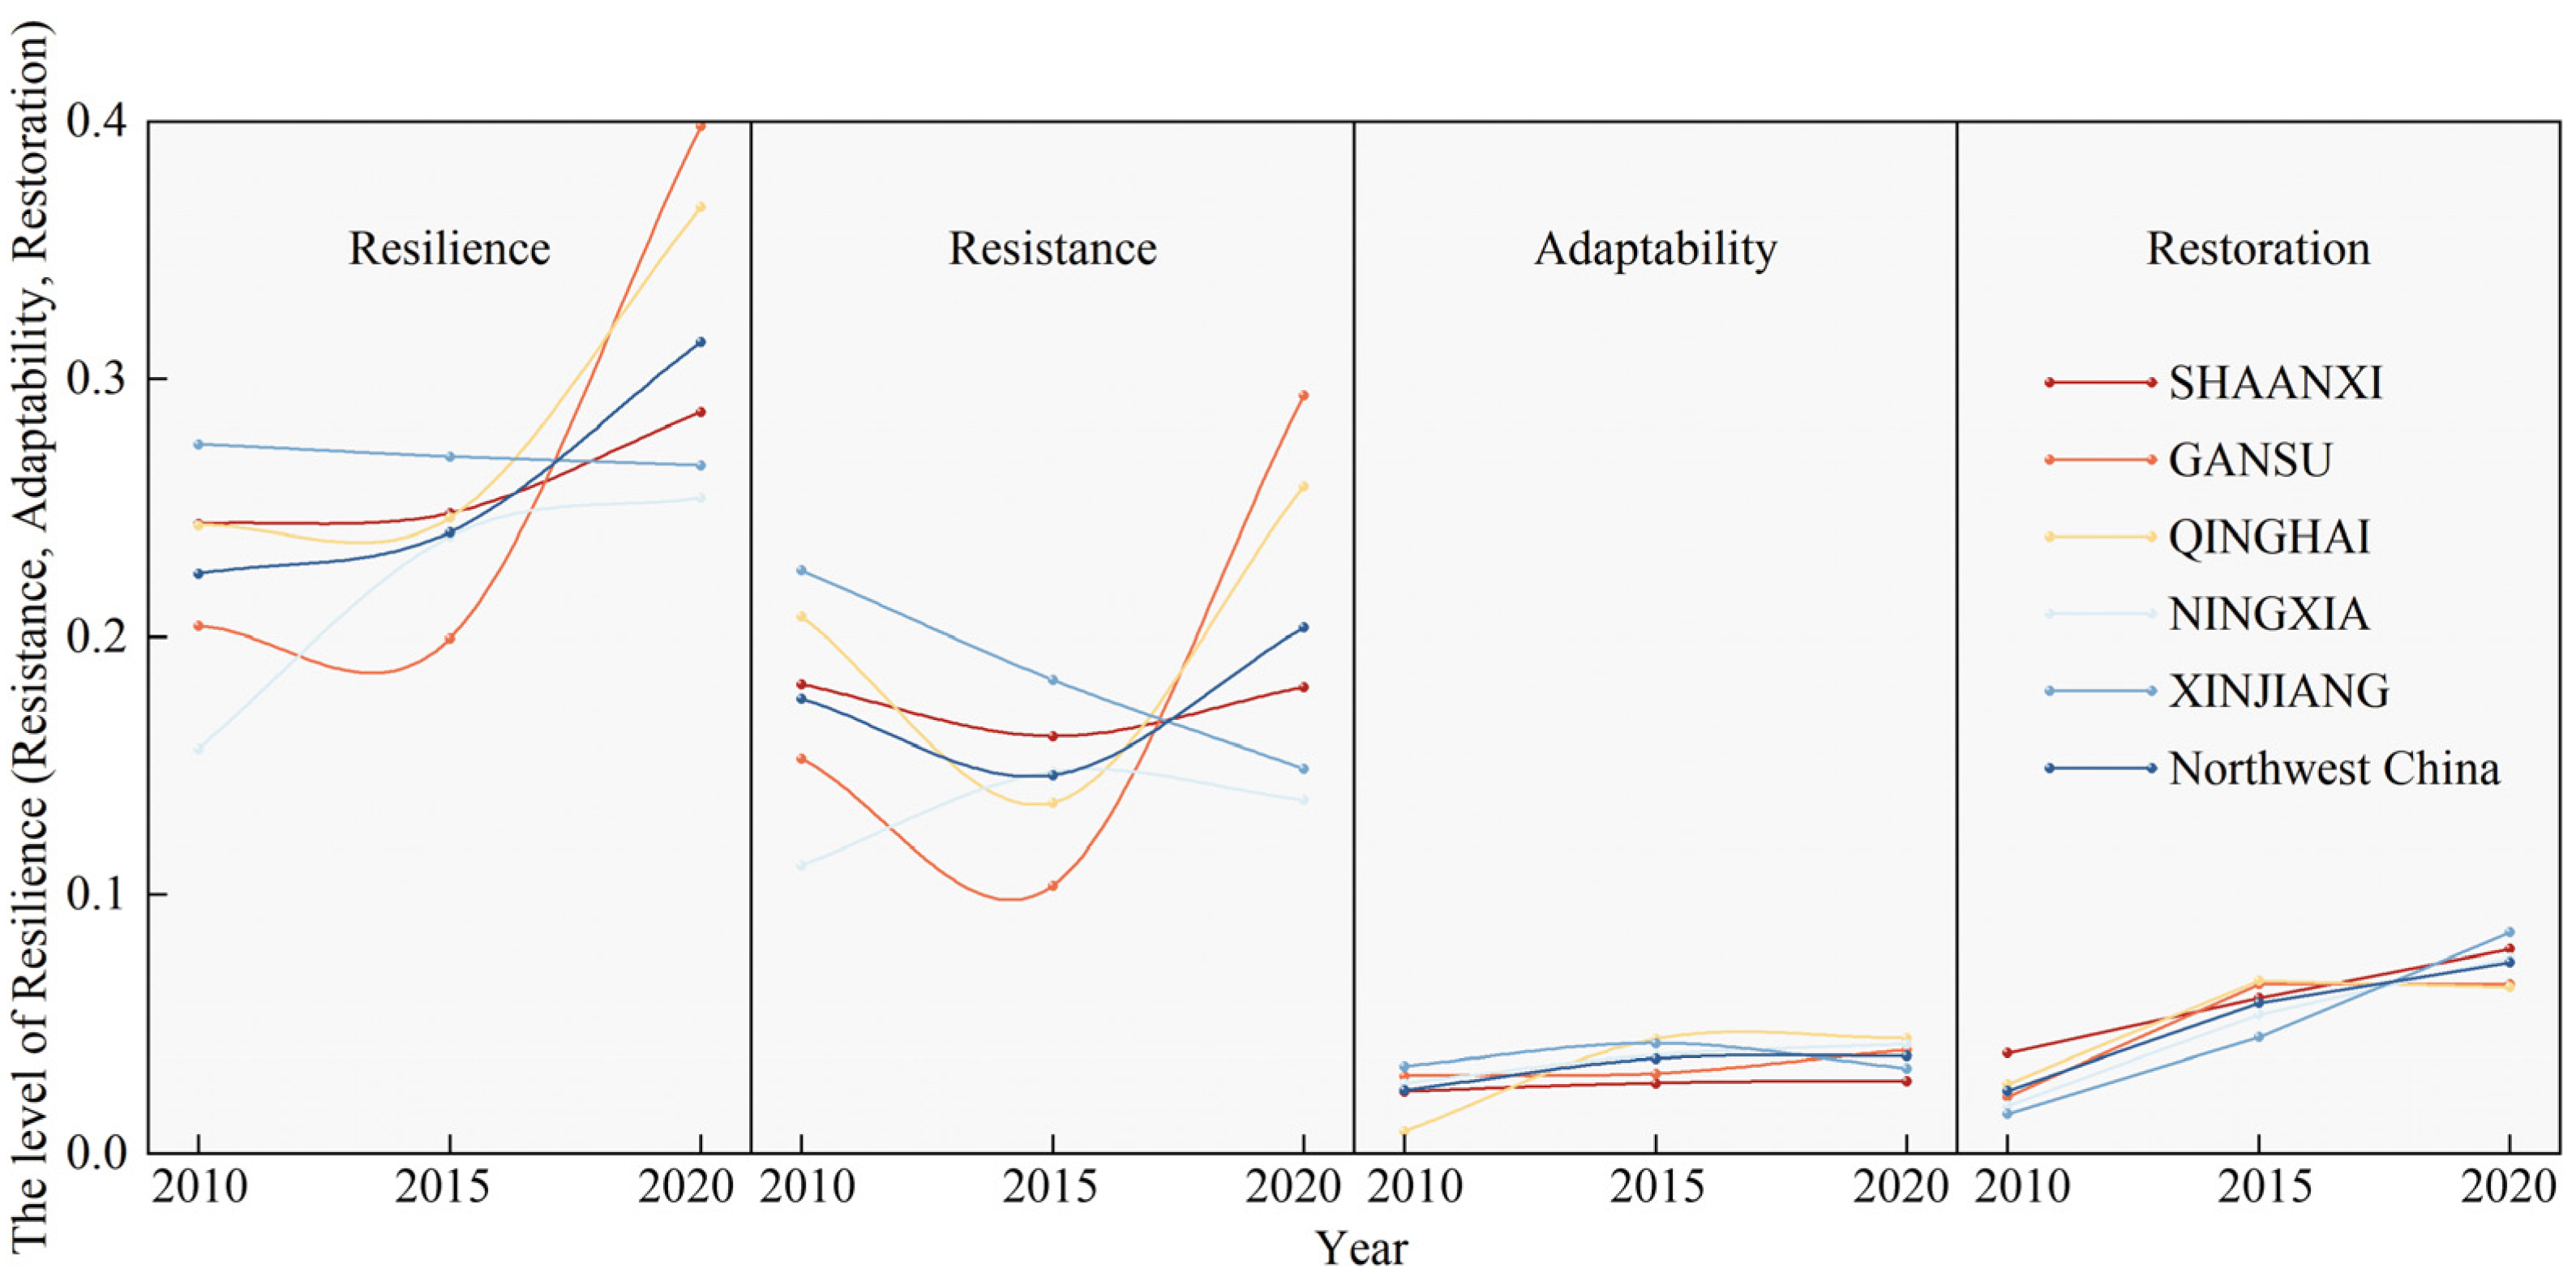
3.1. The Trend of WR-WE-SEr

The WR-WE-SEr in Northwest China demonstrated distinct spatiotemporal evolution patterns from 2010 to 2020 (Figure 4). Temporally, the regional WR-WE-SEr exhibited an overall upward trajectory, with Gansu experiencing the most significant increase (+0.2) from 2015 to 2020. Notably, Xinjiang exhibited a decline in marginal resilience, whereas Ningxia remained the lowest-performing province (0.15 in 2010). By 2020, the resilience values exceeded 0.35 in both Gansu and Qinghai.
Spatially, the triennial average resilience followed a descending order: Qinghai > Xinjiang > Gansu > Shaanxi > Ningxia. Mechanistic analysis revealed three key characteristics: (1) resilience trajectories strongly synchronized with resistance variations; (2) both adaptability and restoration exhibited minimal amplitude fluctuations; and (3) restoration demonstrated more pronounced growth than adaptability did, suggesting differential contributions of resilience components.

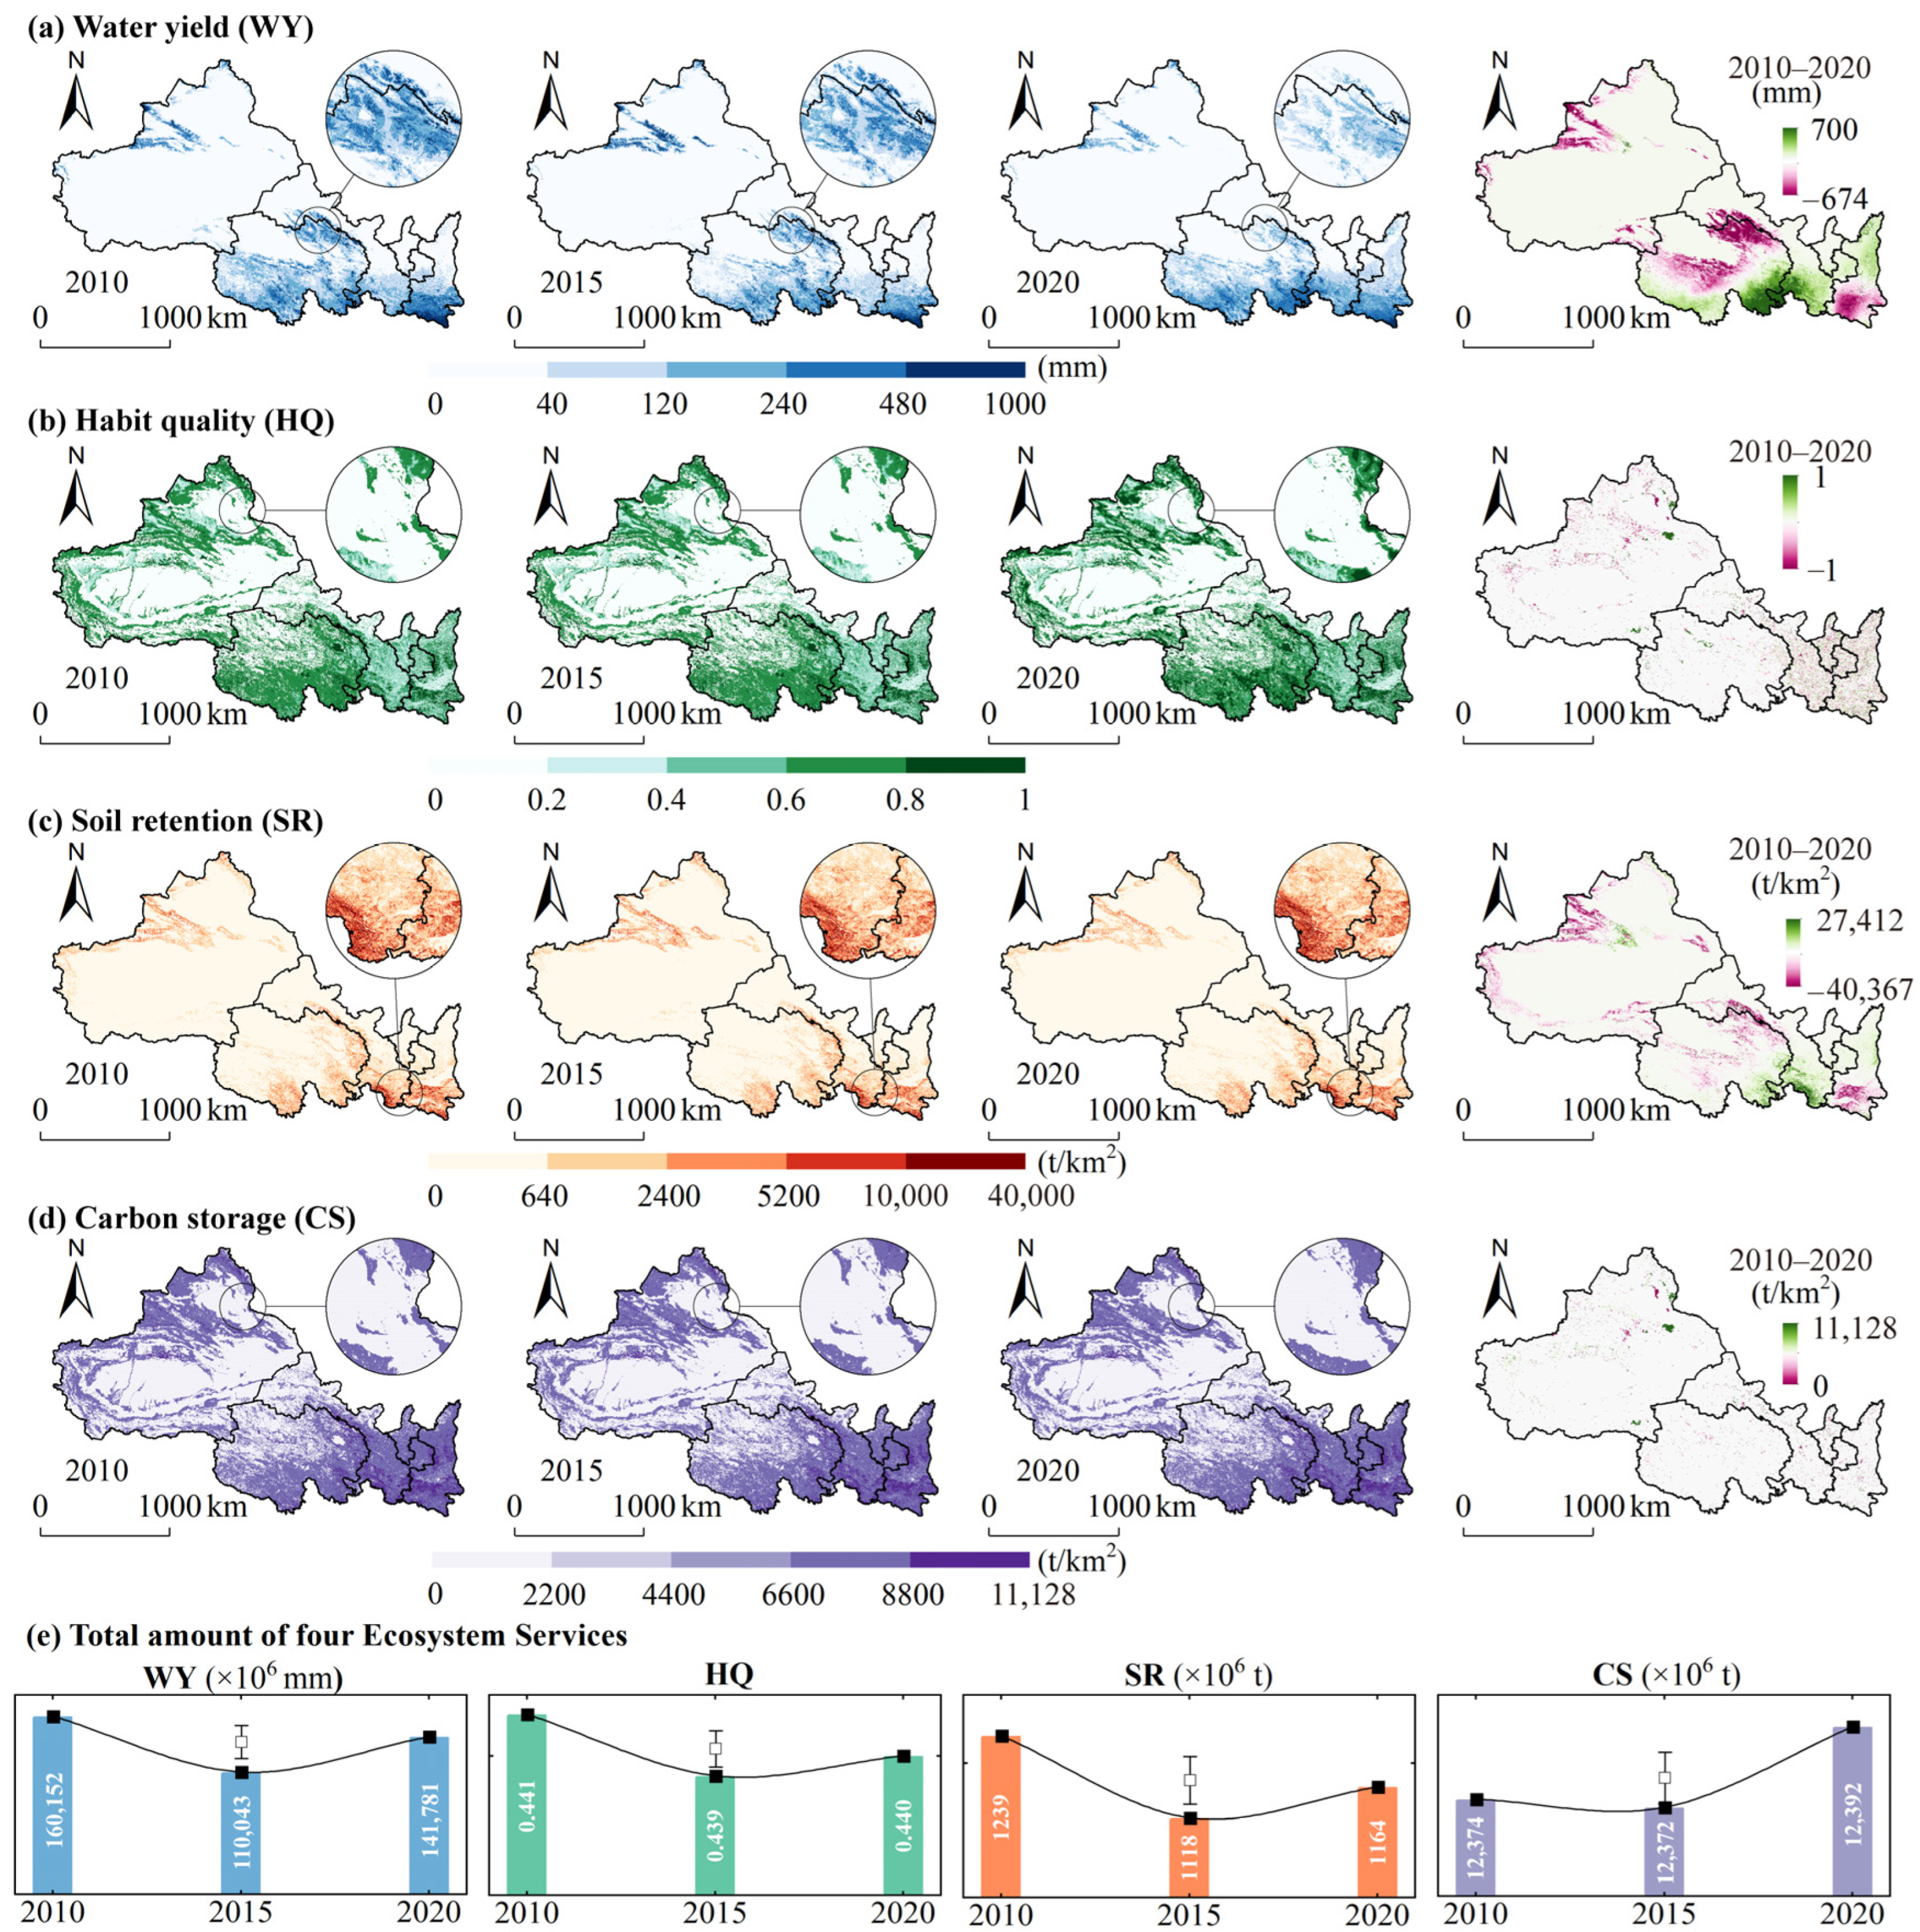
3.2. Spatial and Temporal Characterization of ESs

The four ESs—WY, HQ, SR, and CS—exhibited stable spatial patterns with marked heterogeneity across Northwest China from 2010 to 2020 (Figure 5), all following a characteristic “V-shaped” trajectory of initial decline followed by subsequent recovery.
WY showed distinct spatial stratification (Figure 5a), with low values concentrated in Xinjiang, northwestern Gansu, northern Qinghai, and Ningxia, and high values clustered in southern Qinghai, southern Gansu, and southern Shaanxi—patterns delineated by the Tianshan-Qilian-Qinling mountain systems influenced by glacial meltwater and precipitation gradients. Temporally, WY decreased from 160,151.50 × 10⁶ mm (2010) to 141,781.25 × 10⁶ mm (2020), representing an 18,370.25 × 10⁶ mm reduction (−0.11% annual rate). Spatially, increases occurred in southwestern/southeastern Qinghai and southeastern Gansu, whereas decreases dominated the Tianshan-Qilian ranges, central Qinghai, and southern Shaanxi.
HQ displayed basin-mountain contrasts (Figure 5b), with degraded areas in the Junggar-Tarim Basins (Xinjiang) and northwestern Gansu, contrasting with high-quality zones along the Altai-Tianshan-Kunlun-Qilian Mountains and Qinling ranges. These patterns remained stable, with localized fluctuations linked to land use/cover changes.
The SR spatially mirrored WY distributions (Figure 5c) while declining from 1238.86 × 10⁶ t (2010) to 1164.40 × 10⁶ t (2020), a 74.46 × 10⁶ t decrease. CS maintained spatial congruence with HQ (Figure 5d), showing minor local variations but regional stability.

3.3. Coupling Coordination Degree Between WR-WE-SEr and ESs

The CCD between WR-WE-SEr and ESs in Northwest China exhibited spatially heterogeneous yet temporally stable patterns from 2010 to 2020 (Figure 6). Temporally, the CCD showed minimal interannual fluctuations: declines occurred in WY (0.19 to 0.17) and SR, whereas improvements were observed in HQ (0.33 to 0.38), CS (0.5 to 0.55), and total ESs (0.48 to 0.53). The coordination hierarchy followed the order of CS > HQ > WY > SR, with total ESs achieving moderate coordination. Spatially, a dominant “southeast-high-northwest-low” gradient prevailed, where the CCD progressively diminished northwestward, with most areas maintaining stable states.
The WY-CCD (Figure 6a) displayed severe dissonance (0.19 to 0.17) concentrated in the vast majority of Xinjiang, northwestern Qinghai, Gansu, Ningxia, and northern Shaanxi, contrasting with coordinated zones along the Tianshan-Altai-Qilian Mountains and southern Qinghai-Gansu-Shaanxi, which are constrained by the water resource distribution. The HQ-CCD (Figure 6b) transitioned from a moderate (0.33) to primary coordination (0.38), although severe dissonance persisted in the Junggar–Tarim–Qaidam Basins. Enhanced coordination in the Qinghai–Gansu–Ningxia–Shaanxi region was correlated with optimized water governance.
The SR-CCD (Figure 6c) remained chronically dysfunctional (≈0.1), with minimal spatial changes except minor coordination in southern Gansu/Shaanxi, reflecting SR-dominated dynamics. The CS-CCD and total ES-CCD (Figure 6d,e) transitioned from dissonance to coordination (CS: 0.5 to 0.55; total: 0.48 to 0.53), sharing spatial improvement patterns with the HQ-CCD.
Regionally, Shaanxi achieved the optimal CCD due to advanced social economic conditions and water ecological management, outperforming Ningxia, Qinghai, and Gansu. The northwest provinces faced constraints from water scarcity, environmental remediation challenges, and fragile ecosystems, yet the overall CCD demonstrated progressive improvement driven by water management policies and ecological conservation efforts.

4. Discussion

4.1. Interactions of WR-WE-SEr and ESs

This study established a WR-WE-SE-ES coupling framework (Figure 2a) from a SES perspective, utilizing ESs as the nexus and water resources as the core element. The results demonstrate that WR-WE-SEr in Northwest China exhibited an overall increasing trend from 2010 to 2020 (Figure 4), driven predominantly by resistance mechanisms (rigid water constraints), whereas adaptability and restoration played limited roles; this reveals the unique SES dynamics of arid/semiarid regions, where passive pressure mitigation dominates over proactive regulatory strategies such as dynamic resource allocation [50].
Spatiotemporal analysis of ESs (WY, HQ, SR, and CS) highlighted water-dependent heterogeneity (Figure 5). High ES performance clustered in water-abundant zones (southern Qinghai, Qinling Mountains), whereas arid basins (Tarim Basin, Qaidam Basin) faced significant ecological degradation risks, emphasizing the pivotal role of water availability in system coordination [51]. Severe coupling coordination dissonance (CCD < 0.2) between WR-WE-SEr and WY/SR (Figure 6a,c) revealed tension between water exploitation and ecological conservation. However, policy interventions—including farmland-to-forest conversion and ecological water supplementation—improved ES provisioning (Figure 5) and CCD trajectories (Figure 6), underscoring the value of targeted governance [52,53].
Regional disparities further illustrate the interplay of natural and anthropogenic factors: Shaanxi achieved optimal coordination (the highest average agricultural water use efficiency value of 0.84 among the five northwestern provinces) due to advanced social economic conditions and refined water management [54]. Xinjiang exhibited the lowest degree of coordination (ecologically fragile areas >70%; Figure 6e), which was constrained by ecological fragility and limited adaptive capacity [55]. The persistent “southeast-high-northwest-low” CCD gradient (Figure 6) reflects systemic challenges rooted in uneven water endowments, economic disparities, and fragmented policy implementation, suggesting that holistic SES coordination requires both natural endowment optimization and human activity refinement [56].

4.2. Synergistic Pathways for Systemic Governance and Key Element Management

The SES framework necessitates synergistic governance across three pillars: natural resource optimization, social economic green transition, and eco-environmental restoration [57,58]. To enhance resilience and coordination, we propose a tripartite pathway.
Multidimensional resilience enhancement involves a shift from resistance-dominated strategies to adaptive management via interbasin water transfers and water-saving technology adoption, balancing supply-demand dynamics while strengthening adaptability and restoration [59,60]. Spatially differentiated policy design involves the alignment of ecological compensation and land use policies with ES supply-demand spatial patterns, prioritizing water-abundant regions for conservation and arid zones for targeted restoration [61,62]. Cross-scale monitoring and dynamic assessment involves constructing cross-scale coupled models by integrating multisource heterogeneous data to achieve real-time dynamic diagnostics of ecosystem health, thereby enabling adaptive management strategies for dynamic optimization [63,64,65].
Limitations and future directions include the following: expanding ES indicators (water purification, biodiversity conservation) to capture multifunctional ecosystem impacts [66]; addressing scale mismatches between macrolevel social economic data and high-resolution ecological assessments through spatial data fusion techniques [41,67,68]. Cross-regional comparative studies should be conducted to generalize SES coupling mechanisms across diverse ecological and developmental contexts [40].

5. Conclusions

This study analyzes the WR-WE-SEr and ESs (WY, HQ, SR, and CS) from an SES perspective. It also investigates the coupled and coordinated relationships between these elements, utilizing resilience theory, the InVEST model, and the coupling coordination degree model in Northwest China from 2010 to 2020. The following findings were obtained:
(1)
For RQ1 (spatiotemporal evolution patterns), the WR-WE-SEr system exhibited a sustained upward trajectory in resilience over the decade, with significant regional disparities: Qinghai consistently outperformed Xinjiang, Gansu, Shaanxi, and Ningxia. Resistance—the system’s capacity to buffer disturbances—dominated resilience dynamics, while adaptability showed limited variability. Meanwhile, ESs displayed pronounced spatial heterogeneity. WY increased in water-rich regions but declined overall, whereas HQ and CS spatially aligned with vegetation and land cover. Temporally, all ESs followed a distinct “V-shaped” trajectory, marked by an initial decline followed by recovery, with localized fluctuations but regional-scale stability.
(2)
Regarding RQ2 (coordinated coupling relationships), the CCD between WR-WE-SEr and ESs revealed hierarchical and spatial patterns. Coordination levels ranked as CS > HQ > WY > SR, reflecting stronger synergies between system resilience and carbon sequestration. Spatially, CCD decreased along a southeast-to-northwest gradient, mirroring ESs’ distribution. Regionally, Shaanxi achieved the highest coordination, followed by Ningxia, Qinghai, Gansu, and Xinjiang. Notably, coordination varied across ES types: extreme misalignment with WY contrasted with improving HQ coordination, moderate SR alignment, and primary CS synergies. While total ESs achieved moderate coordination (0.48 to 0.53), SR-CCD remained chronically dysfunctional (≈0.1) due to persistent soil erosion pressures and limited restoration capacity in arid zones, highlighting the need for targeted soil conservation strategies despite overall system improvements. At the integrated ES level, the system transitioned from dissonance to coordination, indicating gradual optimization of human–nature interactions.
Policy recommendations, to reconcile contradictions (moderate total ES coordination vs. chronically low SR-CCD) and enhance water-driven ecosystem services, region-specific strategies should prioritize, are as follows: (1) In Xinjiang, optimize water allocation through interbasin transfers and groundwater recharge programs to sustain critical ecosystems (Tarim River riparian zones), while enforcing strict pollution controls to improve habitat quality (HQ) [28,53]. (2) In arid regions (Gansu, Ningxia), integrate water-saving irrigation technologies with soil retention measures (terracing, afforestation) to reduce agricultural water demand and mitigate SR-CCD dissonance caused by soil erosion [52,54]. (3) Establish cross-provincial water ecological compensation mechanisms, linking water-abundant areas (southern Qinghai) with water-stressed regions, to ensure equitable ES provisioning (WY from upstream reservoirs supporting downstream carbon sequestration in Shaanxi) [62].

Author Contributions

Methodology, S.W. and J.H.; investigation, S.W.; formal analysis, S.W., Y.Z. and X.L.; resources, S.W.; writing—original draft, S.W.; writing—review and editing, S.W. and J.H. All authors have read and agreed to the published version of the manuscript.

Funding

This research was funded by the Natural Science Foundation of Xinjiang Uygur Autonomous Region (grant number 2022D01B109); Higher Education Research Program of Xinjiang Uygur Autonomous Region (grant number XJEDU2023P072); and Tianchi Doctoral Program of Xinjiang Uygur Autonomous Region (grant number BS2021007).

Data Availability Statement

All data generated or analyzed are included in this published article.

Conflicts of Interest

The authors declare no conflicts of interest.

References

  1. Liu, J.; Dietz, T.; Carpenter, S.R.; Alberti, M.; Folke, C.; Moran, E.; Pell, A.N.; Deadman, P.; Kratz, T.; Lubchenco, J.; et al. Complexity of Coupled Human and Natural Systems. Science 2007, 317, 1513–1516. [Google Scholar] [CrossRef]
  2. Ostrom, E. A General Framework for Analyzing Sustainability of Social-Ecological Systems. Science 2009, 325, 419–422. [Google Scholar] [CrossRef] [PubMed]
  3. Conradi, T.; Eggli, U.; Kreft, H.; Schweiger, A.H.; Weigelt, P.; Higgins, S.I. Reassessment of the risks of climate change for terrestrial ecosystems. Nat. Ecol. Evol. 2024, 8, 888–900. [Google Scholar] [CrossRef]
  4. Huggins, X.; Gleeson, T.; Kummu, M.; Zipper, S.C.; Wada, Y.; Troy, T.J.; Famiglietti, J.S. Hotspots for social and ecological impacts from freshwater stress and storage loss. Nat. Commun. 2022, 13, 439. [Google Scholar] [CrossRef] [PubMed]
  5. Liao, Y.; Hou, X.-S.; Ren, X.-H. Analysis of the Urban Water Eco-environment Protection Strategy in the Beijing-Tianjin-Hebei Region from “Three Waters” Overall Planning. Huan Jing Ke Xue = Huanjing Kexue 2022, 43, 1853–1862. [Google Scholar] [CrossRef] [PubMed]
  6. Sun, G.; Hallema, D.; Asbjornsen, H. Ecohydrological processes and ecosystem services in the Anthropocene: A review. Ecol. Process. 2017, 6, 35. [Google Scholar] [CrossRef]
  7. Zhao, Z.; Wang, H.; Zhang, L.; Liu, X.; Zhao, Y. Construction and application of resilience evaluation model of water resources-water environment-social economy complex system in the Yangtze River Economic Belt. Adv. Water Sci. 2022, 33, 705–717. (In Chinese) [Google Scholar]
  8. Wang, T.; Jian, S.; Wang, J.; Yan, D. Dynamic interaction of water–economic–social–ecological environment complex system under the framework of water resources carrying capacity. J. Clean. Prod. 2022, 368, 133132. [Google Scholar] [CrossRef]
  9. Omer, A.; Elagib, N.A.; Zhuguo, M.; Saleem, F.; Mohammed, A. Water scarcity in the Yellow River Basin under future climate change and human activities. Sci. Total Environ. 2020, 749, 141446. [Google Scholar] [CrossRef]
  10. Dai, D.; Alamanos, A.; Cai, W.; Sun, Q.; Ren, L. Assessing Water Sustainability in Northwest China: Analysis of Water Quantity, Water Quality, Socio-Economic Development and Policy Impacts. Sustainability 2023, 15, 11017. [Google Scholar] [CrossRef]
  11. Deng, Q.; Sharretts, T.; Ali, T.; Ao, Y.Z.; Chiarelli, D.D.; Demeke, B.; Marston, L.; Mehta, P.; Mekonnen, M.; Rulli, M.C.; et al. Deepening water scarcity in breadbasket nations. Nat. Commun. 2025, 16, 1110. [Google Scholar] [CrossRef] [PubMed]
  12. Rosa, L.; Sangiorgio, M. Global water gaps under future warming levels. Nat. Commun. 2025, 16, 1192. [Google Scholar] [CrossRef] [PubMed]
  13. Konapala, G.; Mishra, A.K.; Wada, Y.; Mann, M.E. Climate change will affect global water availability through compounding changes in seasonal precipitation and evaporation. Nat. Commun. 2020, 11, 3044. [Google Scholar] [CrossRef]
  14. Tzampoglou, P.; Ilia, I.; Karalis, K.; Tsangaratos, P.; Zhao, X.; Chen, W. Selected Worldwide Cases of Land Subsidence Due to Groundwater Withdrawal. Water 2023, 15, 1094. [Google Scholar] [CrossRef]
  15. Zhang, W.; Ma, L.; Li, H.; Wang, X. Trends in the future evolution of rural settlements in oasis-desert areas under water use simulation scenarios: Take the Hexi Corridor region of China as an example. Landsc. Urban Plan. 2024, 248, 105110. [Google Scholar] [CrossRef]
  16. Zhang, K.; Dong, Z.; Guo, L.; Boyer, E.W.; Liu, J.; Chen, J.; Fan, B. Coupled coordination spatiotemporal analyses inform sustainable development and environmental protection for the Yellow River Basin of China. Ecol. Indic. 2023, 151, 110283. [Google Scholar] [CrossRef]
  17. Wang, Y.; Gong, J.; Yang, Z.; Zhu, Y. Social-ecological system research in a changing world: State of the art and future challenges. J. Clean. Prod. 2025, 489, 144725. [Google Scholar] [CrossRef]
  18. Shi, Y.; Zhai, G.; Xu, L.; Zhou, S.; Lu, Y.; Liu, H.; Huang, W. Assessment methods of urban system resilience: From the perspective of complex adaptive system theory. Cities 2021, 112, 103141. [Google Scholar] [CrossRef]
  19. Wang, Y.; Wan, F.; Peng, S.; Zheng, X.; Han, W.; Yan, D.; Wang, W.; Zhang, D. Resilience level assessment of regional water resources system based on multi-link. Ecol. Indic. 2024, 160, 111943. [Google Scholar] [CrossRef]
  20. Hurlimann, A.; Wilson, E. Sustainable Urban Water Management under a Changing Climate: The Role of Spatial Planning. Water 2018, 10, 546. [Google Scholar] [CrossRef]
  21. Zhang, X.; Tian, C. Measurement and Influencing Factors of Regional Economic Resilience in China. Sustainability 2024, 16, 3338. [Google Scholar] [CrossRef]
  22. Zhang, L.; Fang, C.; Zhao, R.; Zhu, C.; Guan, J. Spatial–temporal evolution and driving force analysis of eco-quality in urban agglomerations in China. Sci. Total Environ. 2023, 866, 161465. [Google Scholar] [CrossRef]
  23. Zhu, S.; Li, D.; Feng, H.; Zhang, N. The influencing factors and mechanisms for urban flood resilience in China: From the perspective of social-economic-natural complex ecosystem. Ecol. Indic. 2023, 147, 109959. [Google Scholar] [CrossRef]
  24. Ma, Y.; Ren, J.; Kang, S.; Niu, J.; Tong, L. Spatial-temporal dynamics of meteorological and agricultural drought in Northwest China: Propagation, drivers and prediction. J. Hydrol. 2025, 650, 132492. [Google Scholar] [CrossRef]
  25. Ding, J.; Bai, Y.; Yang, X.; Gao, Z. Spatiotemporal Evolution of Water Resource Utilization and Economic Development in the Arid Region of China: A “Matching-Constraint” Perspective. Sustainability 2022, 14, 8724. [Google Scholar] [CrossRef]
  26. Cui, H.; Zhang, G.; Wang, Q.; Wang, J.; Liu, M.; Yan, M. Study on Index of Groundwater Ecological Function Crisis Classification and Early Warning in Northwest China. Water 2022, 14, 1911. [Google Scholar] [CrossRef]
  27. Cui, H.; Yan, M.; Wang, Q.; Zhang, G.; Feng, H.; Lang, X. Influencing Factors and Evaluation of Groundwater Ecological Function in Arid/Semiarid Regions of China: A Review. Sustainability 2024, 16, 1631. [Google Scholar] [CrossRef]
  28. Zhen, N.; Rutherfurd, I.; Webber, M. Ecological water, a new focus of China’s water management. Sci. Total Environ. 2023, 879, 163001. [Google Scholar] [CrossRef]
  29. He, J.; Pan, Z.; Liu, D.; Guo, X. Exploring the regional differences of ecosystem health and its driving factors in China. Sci. Total Environ. 2019, 673, 553–564. [Google Scholar] [CrossRef]
  30. Huang, F.; Chunyu, X.; Zhang, D.; Chen, X.; Ochoa, C.G. A framework to assess the impact of ecological water conveyance on groundwater-dependent terrestrial ecosystems in arid inland river basins. Sci. Total Environ. 2020, 709, 136155. [Google Scholar] [CrossRef]
  31. Shifaw, E.; Sha, J.; Li, X.; Bao, Z.; Ji, J.; Ji, Z.; Kassaye, A.Y.; Lai, S.; Yang, Y. Ecosystem services dynamics and their influencing factors: Synergies/ tradeoffs interactions and implications, the case of upper Blue Nile basin, Ethiopia. Sci. Total Environ. 2024, 938, 173524. [Google Scholar] [CrossRef]
  32. Shen, W.; Zhang, J.; Wang, K.; Zhang, Z. Identifying the spatio-temporal dynamics of regional ecological risk based on Google Earth Engine: A case study from Loess Plateau, China. Sci. Total Environ. 2023, 873, 162346. [Google Scholar] [CrossRef] [PubMed]
  33. Liu, J.; Kuang, W.; Zhang, Z.; Xu, X.; Qin, Y.; Ning, J.; Zhou, W.; Zhang, S.; Li, R.; Yan, C.; et al. Spatiotemporal characteristics, patterns, and causes of land-use changes in China since the late 1980s. J. Geogr. Sci. 2014, 24, 195–210. [Google Scholar] [CrossRef]
  34. Pan, X.; Zhu, L.; Chan, K.T.; Qin, Z.; Guo, E.; Bao, Y.; Qing, S.; Cui, T. Human-induced water loss potentially threatens sustainable development of sandy regions in China. Commun. Earth Environ. 2025, 6, 68. [Google Scholar] [CrossRef]
  35. Fu, B.; Wu, X.; Wang, Z.; Wu, X.; Wang, S. Coupling human and natural systems for sustainability: Experience from China’s Loess Plateau. Earth Syst. Dyn. 2022, 13, 795–808. [Google Scholar] [CrossRef]
  36. Cao, M.; Lu, X.; Qin, Z.; Liu, X.; Li, F. Social-ecological system changes in China from 1990 to 2018. Ecol. Indic. 2022, 139, 108926. [Google Scholar]
  37. Wang, J.; Sun, Y.; Zhao, C.; Yang, Z.; Peng, J. Understanding the evolution of relationships among natural resource, social economy, and eco-environment. Geol. Bull. China 2024, 43, 1289–1296. (In Chinese) [Google Scholar]
  38. Wang, Z.; Fu, B.; Wu, X.; Wang, S.; Li, Y.; Zhang, L.; Chen, N.; Wu, X. Exploring the interdependencies of ecosystem services and social-ecological factors on the Loess Plateau through network analysis. Sci. Total Environ. 2025, 960, 178362. [Google Scholar] [CrossRef]
  39. Carpenter, S.; Walker, B.; Abel, A.N. From Metaphor to Measurement: Resilience of What to What? Ecosystems 2001, 4, 765–781. [Google Scholar] [CrossRef]
  40. Zhang, K.; Fang, B.; Zhang, Z.; Liu, T.; Liu, K. Exploring future ecosystem service changes and key contributing factors from a “past-future-action” perspective: A case study of the Yellow River Basin. Sci. Total Environ. 2024, 926, 171630. [Google Scholar] [CrossRef]
  41. You, C.; Qu, H.; Guo, L. A framework of composite factors for assessing ecosystem service supply drivers: A sustainable socio-ecological perspective. Ecol. Indic. 2024, 169, 112811. [Google Scholar] [CrossRef]
  42. Gomes, E.; Inácio, M.; Bogdzevič, K.; Kalinauskas, M.; Karnauskaitė, D.; Pereira, P. Future land-use changes and its impacts on terrestrial ecosystem services: A review. Sci. Total Environ. 2021, 781, 146716. [Google Scholar] [CrossRef]
  43. Agudelo, C.A.R.; Bustos, S.L.H.; Moreno, C.A.P. Modeling interactions among multiple ecosystem services. A critical review. Ecol. Model. 2020, 429, 109103. [Google Scholar] [CrossRef]
  44. Liu, H.; Tang, D. Ecological zoning and ecosystem management based on landscape ecological risk and ecosystem services: A case study in the Wuling Mountain Area. Ecol. Indic. 2024, 166, 112421. [Google Scholar] [CrossRef]
  45. Li, C.; Xu, H.; Du, P.; Tang, F. Predicting land cover changes and carbon stock fluctuations in Fuzhou, China: A deep learning and InVEST approach. Ecol. Indic. 2024, 167, 112658. [Google Scholar] [CrossRef]
  46. Liang, L.; Zhang, F.; Wu, F.; Chen, Y.; Qin, K. Coupling coordination degree spatial analysis and driving factor between socio-economic and eco-environment in northern China. Ecol. Indic. 2022, 135, 108555. [Google Scholar] [CrossRef]
  47. Wang, S.-J.; Kong, W.; Ren, L.; Zhi, D.-D.; Dai, B.-T. Research on misuses and modification of coupling coordination degree model in China. J. Nat. Resour. 2021, 36, 793–810. [Google Scholar] [CrossRef]
  48. Ma, M.; Tang, J. Interactive coercive relationship and spatio-temporal coupling coordination degree between tourism urbanization and eco-environment: A case study in Western China. Ecol. Indic. 2022, 142, 109149. [Google Scholar] [CrossRef]
  49. Shi, Y.; Feng, C.-C.; Yu, Q.; Han, R.; Guo, L. Contradiction or coordination? The spatiotemporal relationship between landscape ecological risks and urbanization from coupling perspectives in China. J. Clean. Prod. 2022, 363, 132557. [Google Scholar] [CrossRef]
  50. Rubio-Martin, A.; Pulido-Velazquez, M.; Macian-Sorribes, H.; Garcia-Prats, A. System Dynamics Modeling for Supporting Drought-Oriented Management of the Jucar River System, Spain. Water 2020, 12, 1407. [Google Scholar] [CrossRef]
  51. Chen, L.; Yu, W.; Zhang, X. Spatio-temporal patterns of High-Quality urbanization development under water resource constraints and their key Drivers: A case study in the Yellow River Basin, China. Ecol. Indic. 2024, 166, 112441. [Google Scholar] [CrossRef]
  52. Wei, X.; Jones, J.; Hou, Y.; Liu, S.; Asbjornsen, H.; Zhang, Z.; Shah, N.; Wang, Y.; Zhang, M.; Creed, I.; et al. Local considerations are the key to managing global forests for water. Sci. Bull. 2025, 70, 448–451. [Google Scholar] [CrossRef] [PubMed]
  53. Qian, K.; Ma, X.; Yan, W.; Li, J.; Xu, S.; Liu, Y.; Luo, C.; Yu, W.; Yu, X.; Wang, Y.; et al. Trade-offs and synergies among ecosystem services in Inland River Basins under the influence of ecological water transfer project: A case study on the Tarim River basin. Sci. Total Environ. 2024, 908, 168248. [Google Scholar] [CrossRef] [PubMed]
  54. Zhang, F.; Xiao, Y.; Gao, L.; Ma, D.; Su, R.; Yang, Q. How agricultural water use efficiency varies in China—A spatial-temporal analysis considering unexpected outputs. Agric. Water Manag. 2022, 260, 107297. [Google Scholar] [CrossRef]
  55. Lu, J.; Zheng, J.; Jian, P.; Xiao, X.; Li, G.; Liu, L.; Wang, R.; Zhang, J. Spatial and temporal evolution of ecological vulnerability and its response to drought in Xinjiang. Remote Sens. Nat. Resour. 2024, 1–12. (In Chinese) [Google Scholar]
  56. Gao, M.; Hu, Y.; Liu, X.; Liang, M. Revealing multi-scale characteristics of ecosystem services supply and demand imbalance to enhance refined ecosystem management in China. Ecol. Indic. 2025, 170, 112971. [Google Scholar] [CrossRef]
  57. O’donnell, M.; Collier, M.; Pineda-Pinto, M.; Cooper, C.; Nulty, F.; Castañeda, N.R. Redefining co-design for social-ecological research and practice: A systematic literature review. Environ. Sci. Policy 2025, 164, 103998. [Google Scholar] [CrossRef]
  58. Gorobets, A. Eco-centric policy for sustainable development. J. Clean. Prod. 2014, 64, 654–655. [Google Scholar] [CrossRef]
  59. Wu, B.; Ma, Z.; Feng, X.; Zeng, H.; Gou, S.; Li, H.; Huang, J.; Fu, B. Coordinating red line policies with water consumption caps in China’s drylands. Sci. Bull. 2025; in press. [Google Scholar] [CrossRef]
  60. Yan, H.; Lin, Y.; Chen, Q.; Zhang, J.; He, S.; Feng, T.; Wang, Z.; Chen, C.; Ding, J. A Review of the Eco-Environmental Impacts of the South-to-North Water Diversion: Implications for Interbasin Water Transfers. Engineering 2023, 30, 161–169. [Google Scholar] [CrossRef]
  61. Zhang, J.; Wang, M.; Liu, K.; Chen, S.; Zhao, Z. Social-ecological system sustainability in China from the perspective of supply-demand balance for ecosystem services. J. Clean. Prod. 2025, 497, 145039. [Google Scholar] [CrossRef]
  62. Hu, M.M.; Li, Z.T.; Yuan, M.J.; Fan, C.; Xia, B.C. Spatial differentiation of ecological security and differentiated management of ecological conservation in the Pearl River Delta, China. Ecol. Indic. 2019, 104, 439–448. [Google Scholar] [CrossRef]
  63. Shen, W.; Li, Y.; Qin, Y. Research on the influencing factors and multi-scale regulatory pathway of ecosystem health: A case study in the Middle Reaches of the Yellow River, China. J. Clean. Prod. 2023, 406, 137038. [Google Scholar] [CrossRef]
  64. Yang, L.; Liu, Y.; Liu, Y.; Liu, R. Spatial-temporal dynamics and drivers of ecosystem service interactions along the Yellow River area in Shaanxi Province. J. Clean. Prod. 2025, 496, 145095. [Google Scholar] [CrossRef]
  65. Fu, B.; Liu, Y.; Zhao, W.; Wu, J. The emerging “pattern-process-service-sustainability” paradigm in landscape ecology. Landsc. Ecol. 2025, 40, 54. [Google Scholar] [CrossRef]
  66. Chen, W.; Chi, G. Urbanization and ecosystem services: The multi-scale spatial spillover effects and spatial variations. Land Use Policy 2022, 114, 105964. [Google Scholar] [CrossRef]
  67. Li, Y.; Sang, S.; Mote, S.; Rivas, J.; Kalnay, E. Challenges and opportunities for modeling coupled human and natural systems. Natl. Sci. Rev. 2023, 10, nwad054. [Google Scholar] [CrossRef]
  68. Schirpke, U.; Ghermandi, A.; Sinclair, M.; Van Berkel, D.; Fox, N.; Vargas, L.; Willemen, L. Emerging technologies for assessing ecosystem services: A synthesis of opportunities and challenges. Ecosyst. Serv. 2023, 63, 101558. [Google Scholar] [CrossRef]
Figure 1. Study area. (a) Locations of the five provinces in Northwest China.; (b) aridity index in 2020; (c) elevation; (d) land use types in 2020.
Water 17 01172 g001
Figure 2. Coupling analysis framework for WR-WE-SE-ES. (a) Data collection; (b) coupling framework development; (c) quantification of WR-WE-SEr; (d) quantification of ESs; (e) CCD model.
Water 17 01172 g002
Figure 3. Quantification index system of the coupling WR-WE-SEr in Northwest China and schematic diagram of the resilience of the 3D vector model. (a) Coupling resilience; (b) resistance; (c) adaptability; (d) restoration.
Water 17 01172 g003
Figure 4. The trend of WR-WE-SEr in Northwest China from 2010 to 2020.
Water 17 01172 g004
Figure 5. Spatial and temporal distributions, changes, and total amounts of the four ESs in Northwest China from 2010 to 2020. (a) WY; (b) HQ; (c) SR; (d) CS; (e) total amount of the four ESs.
Water 17 01172 g005
Figure 6. The spatial distribution and mean value of the degree of coupling coordination of WR-WE-SEr and ESs in Northwest China from 2010 to 2020. (a) WY; (b) HQ; (c) SR; (d) CS; (e) four ESs.
Water 17 01172 g006
Table 1. The main data sources.
TypesYearResolutionSource
Land use/cover (LULC)2010, 2015, 202030 mhttps://www.resdc.cn (accessed on 15 October 2024)
Digital elevation model (DEM)202030 mhttps://www.gscloud.cn (accessed on 16 October 2024)
Soil20091 kmhttp://www.geodata.cn/main (accessed on 23 October 2024)
Precipitation (PRE)2010, 2015, 20201 kmhttp://www.geodata.cn/main (accessed on 24 October 2024)
Potential evapotranspiration (PET)2010, 2015, 20201 kmhttps://data.tpdc.ac.cn (accessed on 2 November 2024)
Aridity index (AI)20201 kmhttps://www.geodata.cn/main (accessed on 30 March 2025)
Social economy data2011, 2016, 2021-https://data.stats.gov.cn/english/easyquery.htm?cn=E0103 (accessed on 8 October 2024)
https://app.gjzwfw.gov.cn/jmopen/webapp/html5/szygbxxcx/index.html (accessed on 2 October 2024)
Disclaimer/Publisher’s Note: The statements, opinions and data contained in all publications are solely those of the individual author(s) and contributor(s) and not of MDPI and/or the editor(s). MDPI and/or the editor(s) disclaim responsibility for any injury to people or property resulting from any ideas, methods, instructions or products referred to in the content.

