Review

Drinking Water Network as a Potential Pathway for Micro- and Nanoplastics Exposure to Human: A Mini Review

1
James Watt School of Engineering, University of Glasgow, Glasgow G12 8LT, UK
2
College of Oceanography and Ecological Science, Shanghai Ocean University, Shanghai 201306, China
3
State Key Laboratory of Estuarine and Coastal Research, East China Normal University, Shanghai 200241, China
4
Key Laboratory of Marine Ecological Monitoring and Restoration Technology, Ministry of Natural Resources, Shanghai 201206, China
*
Author to whom correspondence should be addressed.
Water 2025, 17(8), 1188; https://doi.org/10.3390/w17081188
Submission received: 14 March 2025 / Revised: 9 April 2025 / Accepted: 11 April 2025 / Published: 15 April 2025
(This article belongs to the Special Issue Aquatic Microplastic Pollution: Occurrence and Removal)

Abstract

:
The risk of human exposure to micro- and nanoplastics (MNPs) has received increasing attention in recent years. Consumption of drinking water is a significant route of exposure to MNPs. While previous studies focus on MNPs in treated wastewater or final effluent, research addressing drinking water networks (DWNs) as potential secondary sources of MNPs remains sparse. However, how DWN, a critical component transporting water from treatment plants to consumers, contributes to secondary contamination remains underexplored in existing studies. We extracted keywords from reviewed literature using bibliometric methods and conducted correlation analyses, revealing four research clusters: baseline detection, health assessments, nanoplastic, and treatment. The abundance of MNPs in DWN ranged from 0.01 to 1.4 items/L. The abundance varied between 679.5 and 4.5 × 10⁷ items/kg when calculated based on sample mass (in scales or debris). Based on the shape and polymer composition of MNPs, the DWN is strongly suspected to contribute to the secondary contamination of MNPs in tap water. We also reviewed the main mechanisms for the formation and release of MNPs in pipelines, including mechanical forces, water hammer effects, and chemical aging. Our review highlighted the current gaps in the research on potential MNP contamination in the DWN. It will contribute to understanding the contribution of the DWN to MNP contamination and provide a framework for future monitoring and research efforts.

1. Introduction

Since the concept of micro- and nanoplastics (MNPs) was introduced, their presence has been detected in various environmental media beyond the oceans [1,2]. In recent years, many studies have reported the detection of MNPs in human tissues and organs, including blood, lung tissue, and reproductive organs [3,4,5]. Alarmingly, the long-term exposure risks of MNPs have been confirmed through studies on model organisms [6]. Some meta-analyses of clinical data have even identified associations between MNP exposure and cardiovascular diseases [7]. To effectively assess the human exposure risks to microplastics, several studies have begun to focus on evaluating the abundance and contamination characteristics of MNPs across different exposure pathways. This indicates that the research on MNPs is shifting from ecological toxicology to human health risk assessment [8]. Meanwhile, the monitoring of MNPs is also transitioning from natural environments to places more closely related to human activities.
One of the primary routes of human exposure to MNPs is through the ingestion of food and drinking water. Research on the contamination characteristics and baseline abundance of MNPs in drinking water began relatively early. As early as 2014, Free et al. conducted studies on MNPs in remote lakes [9]. At that time, the focus of concern regarding MNP pollution was primarily on the open ocean and coastal environments. However, the higher abundance of MNPs in freshwater ecosystems soon raised concerns about the potential health risks associated with these particles. In recent years, MNPs have been detected in drinking water sources, water distribution systems, and bottled water worldwide [10]. Studies have prioritized monitoring MNPs in water sources such as the Great Lakes and major rivers [11,12,13]. The concentration of MNPs in these natural freshwater bodies can reach up to 25.8 particles/L [14]. By comparison, the abundance of MNPs in drinking water sources can even be similar at the top end of measures for natural water bodies. For instance, the average concentration of MNPs in groundwater used for drinking water purposes along the Bay of Bengal, Bangladesh reaches 24.6 particles/L, surpassing concentrations found in some polluted lakes and rivers [15]. Similarly, the concentration of MNPs in karst aquifers (drinking water sources) in Illinois, USA also exceeds 10 particles/L [16]. Overall, controlling MNPs in drinking water has long focused on water sources.
It is important to note that artificial pipe networks, particularly drinking water networks (DWN), are currently the primary means of transporting drinking water from the source to water treatment plants (WTPs) and, ultimately, to consumers worldwide [17,18,19]. According to estimates by the U.S. Environmental Protection Agency, DWN serves 90% of the population. The most common pipe materials include metals, such as iron and copper, as well as non-metals, particularly synthetic polymers like polypropylene and polyvinyl chloride [19]. Since the 1950s, in response to issues such as rusting and the short lifespan of metal materials, polymer pipelines have gradually replaced metal pipelines worldwide, with nearly complete replacement occurring in household water supply systems [20]. Although polymer materials offer advantages over metals in terms of durability and lightweight properties, aging remains a persistent challenge for engineers. For example, after 20 years of use, both metal and non-metal pipelines exhibit significant scaling on their surfaces [21,22]. Due to biofilm formation and liquid corrosion, the inner walls of the pipes may suffer damage, leading to the release of pipeline materials into the drinking water [23,24]. Taking the UK as an example, between 1960 and 2001, the total length of failed PVC drinking water pipelines reached 6126 km, while the failure length of polyethylene pipelines was almost twice this value [23]. Pipeline failure typically results in complete rupture or continuous crack propagation, both of which are closely linked to the release of secondary MNPs [25]. Previously, the authors reported the presence of more than 60 surface cracks per square mm of naturally aged polypropylene pipes [26]. If we assume that one MNP is released per crack, then at least 60 secondary MNPs would be released per square mm of pipe into the drinking water supply over time. These facts indicate that the release of MNPs from plastic pipelines is an inevitable consequence of long-term usage.
Despite growing evidence of MNPs in tap water, critical questions remain unanswered: How do drinking water networks (DWN)—from distribution systems to household pipes—contribute to secondary MNP contamination? Current research predominantly focuses on source water and treatment plants, leaving infrastructure-mediated pollution pathways underexplored. While reviews consolidate tap water MNP data, they largely overlook contamination mechanisms tied to pipe materials, hydraulic stress, and aging infrastructure. For example, studies frequently terminate MNP assessments at treatment plant outlets, ignoring post-treatment release risks. This oversight distorts evaluations of water treatment efficacy: in the Yangtze River basin, WTPs achieved only 65.8% removal of 10–20 μm MNPs [27]. If MNPs are re-released internally via pipelines, actual removal rates may be even lower—a discrepancy unaddressed by current guidelines. Alarmingly, existing pipeline lifespan standards disregard their role as continuous MNP emission sources, allowing aging or pressurized pipes to release particles within “safe” operational periods. Reliance solely on tap water data thus risks underestimating consumer exposure. Can we accurately assess health risks without quantifying infrastructure-derived MNPs? This review tackles these gaps by critically analyzing pipeline networks as underrecognized contamination pathways. Generally, we aim to outline the key research trends on MNPs in DWNs, describe the methodologies used in studies, and assess the abundance and particle characteristics of MNPs in DWNs. Our review will contribute to understanding the role of DWNs in MNP contamination and provide a framework for future monitoring and research efforts.

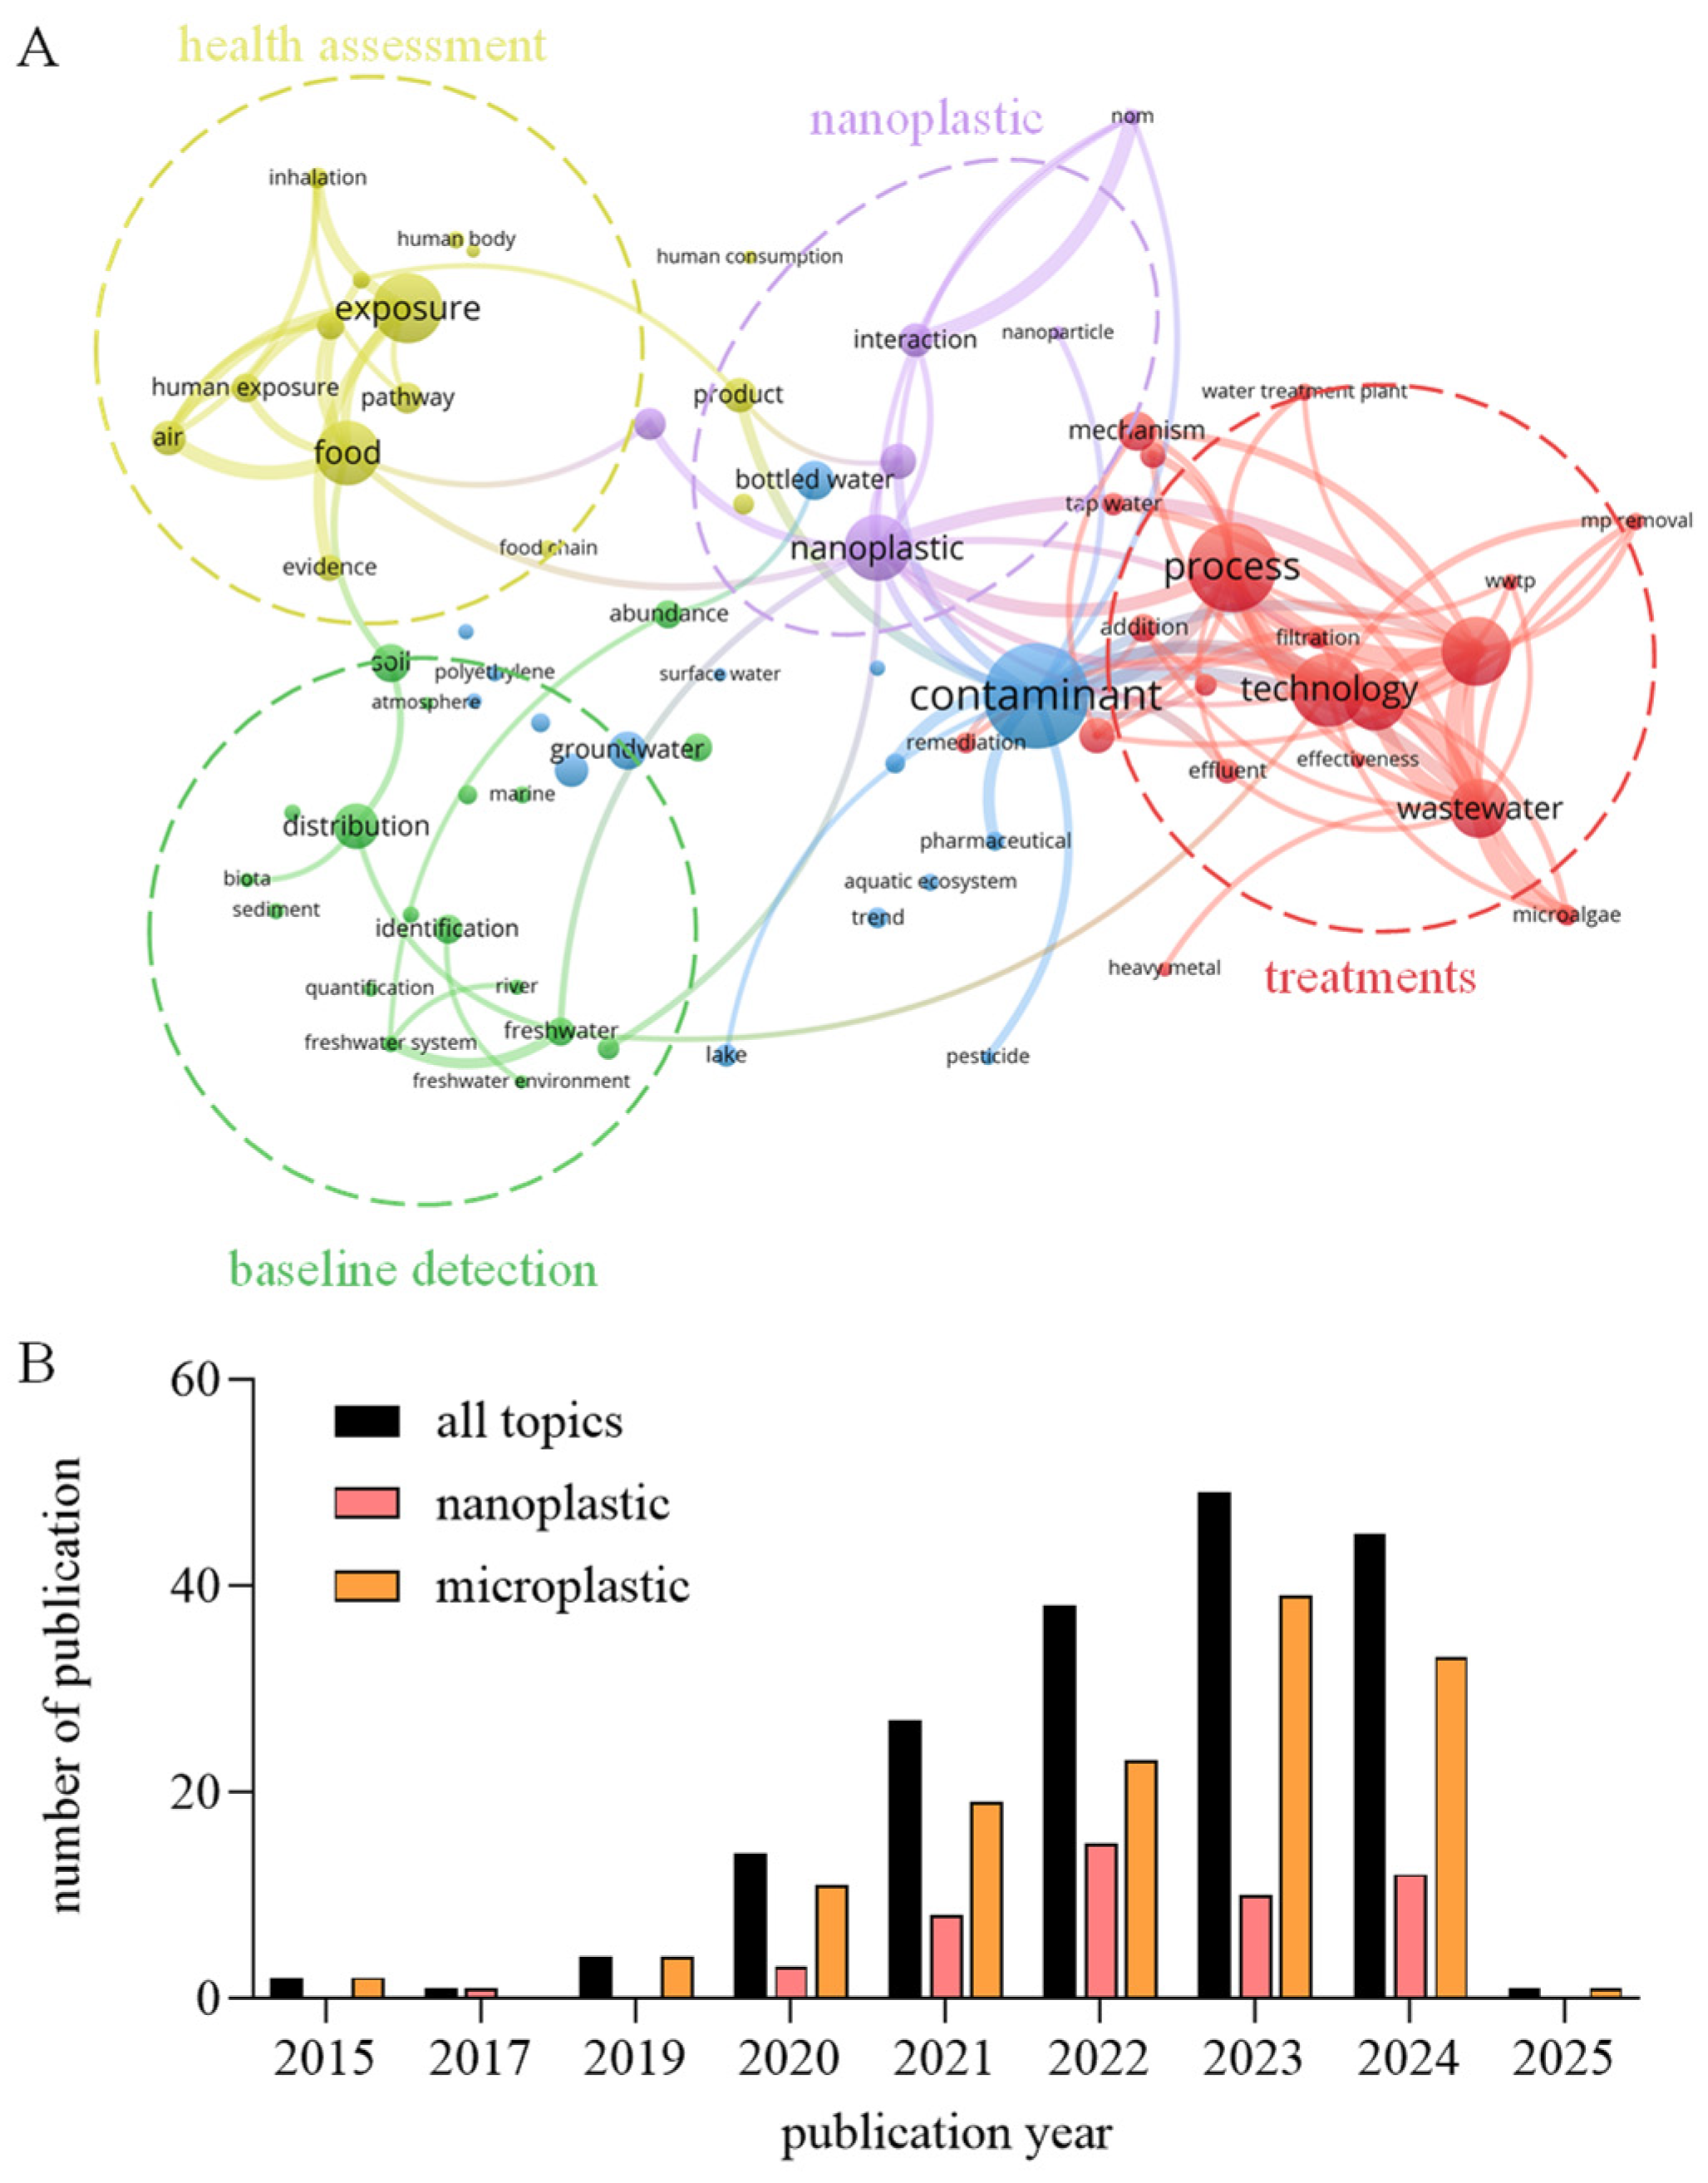
2. Bibliometric Analysis Based on Published Reviews

To clarify current research trends regarding MNP contamination in drinking water, we first conducted a bibliometric analysis. Although research has long focused on the health risks associated with drinking water contamination, including biofouling, pathogens, and heavy metal exposure [19], the presence of MNPs has only gained significant attention since the early 21st century. As a result, the pollution status and characteristics of MNPs in drinking water remain unclear. In fact, current literature extensively documents polymer types and concentrations in raw or treated water [28,29,30], yet few studies systematically investigate how pipe materials, jointing methods, or operational practices (e.g., pressure fluctuations, maintenance activities) contribute to MNP loads. We conducted a topic search in the Web of Science database. The search algorithm used was: TS = ((“microplastic*” OR “nanoplastic*”) AND (“drinking water*”)). It yielded an initial corpus of over 1000 publications. We identified 181 review articles and they were subsequently subjected to correlation analysis. The results indicate that current research themes can be divided into four clusters: health assessment, nanoplastics, baseline detection, and treatments (Figure 1A).
The core keyword in cluster 1 is “exposure”, which emphasizes that scientists are increasingly aware of the risks of MNPs being transmitted to the human body through drinking water. The core keyword in cluster 2 is “distribution”, which pertains to the spatial variation of MNPs in water sources. Clusters 3 and 4 focus on the removal of pollutants, as reflected in their core keywords. Together, these four clusters represent the central research directions and knowledge hubs concerning MNPs in drinking water. However, we found that within each cluster, keywords such as “pipe” or “pipeline”, which are related to DWNs, were absent. This suggests that current research frameworks give little attention to the impact of DWNs or pipeline materials on MNPs. Among the 43 studies related to MNPs in drinking water, only 18.6% considered MNPs in DWNs.
Furthermore, the number of review articles on MNPs in drinking water has increased since 2015 (Figure 1B). Given the delayed nature of review publications, the actual number of experimental studies may be even higher. Interestingly, the increase in literature on nanoplastics has slowed down between 2021 and 2024, compared to microplastics. This could be attributed to the challenges involved in detecting nanoplastics. Although techniques such as pyrolysis -GC/MS have enabled scientists to detect and quantify nanoplastics in the environment, significant breakthroughs in directly detecting nanoplastics in environmental media only occur by 2024 [31]. Consequently, large-scale detection of nanoplastics in DWNs remains a difficult task in the short term.
The bibliometric analysis highlights that DWNs have been largely overlooked in research on MNPs in drinking water. MNPs in pipelines have not been considered in health assessments or baseline detection, creating a knowledge gap that limits our understanding of the primary pathways through which humans are exposed to MNPs via drinking water.

3. Descriptions of Monitoring Frame and Methodologies

3.1. Spatial Distribution of DWN Monitoring

Geographically, MNPs have been detected in DWNs across several countries, including those in Asia, Europe, and Africa. Most of these pipeline systems are located in urban inland or coastal areas. In addition to regional studies, Gbotemi et al. also sampled various sections of water treatment plants across several towns in the UK [28]. From a regional perspective, most studies have been conducted in developed countries or regions where DWNs are well-established and have a long operational history. For example, some metal pipelines in North America and Europe have been in use for over 100 years, while plastic pipelines have been in service for 20–30 years [17,18]. The extended service life has led to increased attention to the current pollution status within pipelines, including the presence of MNPs [20]. It is important to note that some developing countries are currently promoting the installation of new pipeline systems and upgrading old metal pipelines. Simultaneously, the use of plastic pipelines is common in newly constructed communities, particularly for indoor water purification and hot water systems. Monitoring MNPs in pipelines should be initiated early in the use of plastic pipes, as this is critical for assessing MNP release over the lifecycle of these pipelines. Unfortunately, current assessments of pipeline lifespan and safety risks do not include testing for MNP release.

3.2. Monitoring Sections and Methodologies Used in DWN Monitoring

In the literature on MNP contamination in pipeline transportation, more than 50% of studies have examined the entire process—from source water to the WTP and then to the consumer (Figure 2). In this process, the WTP is a critical monitoring point. On the one hand, the effluent from the WTP reflects the effectiveness of various treatment processes in removing MNPs from source water; on the other hand, it provides a baseline for assessing changes in MNP concentrations during subsequent transportation. Although the effectiveness of different WTPs in treating MNPs varies significantly, conventional methods generally remove between 50% and 90% of MNPs [32,33,34]. Therefore, MNPs in the WTP effluent, especially larger ones, are typically used as the starting concentration for MNP contamination in pipelines. Human exposure to MNPs in DWNs primarily occurs through two principal pathways: ingestion of beverages/packaged water and domestic water usage. However, current research rarely addresses the contribution of internal pipeline networks within WTPs to MNP contamination, particularly regarding how they affect the purification efficiency of different treatment processes. As pipelines and valve nodes increase in complexity, additional MNP contamination may arise from these system components.
In addition to WTPs, monitoring MNPs at the consumer level is also common. The concentration of MNPs in tap water is often used to directly assess human exposure risks or to compare WTP effluent, to estimate the amount of MNPs introduced during the transportation process [10,34]. However, a significant gap in the existing literature is the lack of monitoring MNP contamination in temporary storage sections, such as water tanks, water towers, and other facilities. These sections may serve as important pathways for MNP contamination during the water transportation process. For instance, atmospheric deposition can contaminate open water tanks, which may occur both within WTPs and at the consumer level [35]. This also partially explains the presence of non-pipeline materials, including common MNPs found in atmospheric deposition, such as polyester fibers and rayon [36,37]. Overall, while the current MNP monitoring framework in DWN covers much of the water supply system, there are notable gaps in monitoring MNPs within WTPs and internal pipelines at the consumer end.
All studies employed at least one chemical identification method, such as FTIR or Raman spectroscopy, to confirm the polymer composition of the plastics in the samples. Most studies used direct filtration methods, similar to those employed in natural water bodies [38,39]. Due to the lower levels of organic matter in drinking water, some methods do not use oxidative agents, such as hydrogen peroxide or sodium hydroxide. However, research on pipes rarely applies specialized nanoplastic extraction methods, such as gradient concentration, which hinders the accurate estimation of nanoplastic pollution characteristics in pipes. Notably, Raman spectroscopy emerges as a feasible analytical technique for the identification of small micron-scale MNPs, offering a viable approach to address methodological challenges in characterizing such particles. However, this technique is expensive but non-destructive [40]. Compared to the more complex composition of natural water, drinking water contains fewer particulates, resulting in lower interference with nanoplastic detection. As there is no need for complex concentration and purification processes, future direct detection of nanoplastics in drinking water pipelines will be significantly less costly than in natural water or wastewater.
In addition to these quantitative methods, some studies have used scanning electron microscopy (SEM) to qualitatively describe the particles present on pipe walls and attached materials. For example, Świetlik et al. examined PE and PVC pipe samples and observed pits or particles uniformly distributed on their surfaces [20,41]. In leakage tests of pipelines, researchers have also detected secondary particles in the failure zones using SEM [42,43]. For polymer or composite material pipes, these particles may include not only MNPs but also other nanoscale contaminants, such as fillers and additives. While current detection methods are effective for assessing microplastic contamination, there is a lack of quantitative analysis of nanoplastics and other pipe-related particulate pollutants in DWN.

4. The Abundance and Characteristics of MNPs

4.1. The Abundance of MNPs

The MNP abundance in DWN ranges from 0.01 to 1.4 items/L. However, significant variations exist across studies (Table 1). When the abundance is measured based on the mass per unit (items/kg), it ranges from 679.5 to 4.5 × 10⁷ items/kg (Table 1). It is noteworthy that the abundance data derived from scales and debris reflect accumulated MNP abundances within pipeline systems, with their absolute values potentially exceeding those measured through instantaneous sampling methods. Additionally, studies focusing on pipe surface area report MNP abundances of 0.67 items/cm2. In comparison, MNP abundance in DWN is lower than in polluted natural waters and effluents. The MNP concentrations in sewage can be up to three orders of magnitude higher, reaching values of 103 items/L, which is 1000 times greater than the abundance of MNPs in DWN [27,44]. In large lakes, MNP abundance can reach up to 10 items/L [45,46]. Thus, these data suggest that MNPs in DWN are typically found at low to moderate abundance levels.
It is noteworthy that MNP concentrations in drinking water correlate with source water typology, necessitating source-specific pipeline monitoring approaches [47,48]. Surface water-derived systems (rivers/reservoirs) showed higher MNP levels than groundwater sources, reflecting differential contamination pathways: surface water MNPs align with urban runoff inputs [49], while groundwater systems predominantly contain small MNPs (<0.1 mm), likely due to subsurface filtration retaining larger particles [12,50]. Bottled water (primarily groundwater-sourced) displayed comparable or higher MNP levels (1.9–5 × 10⁷ items/L), dominated by polypropylene and polyethylene fragments from packaging [51]. By comparison, the polymers in ground water were more diverse [50]. This highlights dual contamination routes in tap water (source + infrastructure) versus bottled water’s packaging-driven pollution. The study has already confirmed that even 10 MNPs can be released from bottled water due to cap friction during use, which is a hidden pathway for human exposure to MNPs [52]. Overall, the water source necessarily affects the concentration of MNPs in the effluent, but it is masked by the DWN and other packaging processes. Also, MNPs are removed from different water sources during wastewater treatment.
Water treatment plants remove MNPs. Additionally, pipe lifespan may significantly affect MNP abundance in the network. The large concentrations of MNPs accumulating in the scales and debris of severely corroded pipelines are one indication of the consequences of aging [53]. Given the limited data available for DWN, the actual abundance of MNPs in older pipes may be underestimated. Furthermore, studies on the abundance of nanoplastics are scarce. Nanoplastic concentrations in drinking water have been reported to reach as high as 108 items/mL [31,54], raising concerns about the potential contribution of DWN contamination to human exposure. It is estimated that humans may ingest up to 4.7 × 10³ MNPs annually [10]. However, the contribution of DWN to overall human exposure to MNPs requires further assessment with more comprehensive baseline data.
Table 1. The abundance and characteristics of MNPs in DWN.
Area (Type)Estimation Method aMean Abundance (Items/L)Primary Shape Composition (%)Primary Polymer Composition cReference
Chongqing (Rural), Chinaindirect1.4non-fiber (55.0)PET, PE[55]
fiber (45.0)
Tianjin (Urban), Chinadirect679.5 (scales) bnon-fiber (83.3)PVC, PE, PP[56]
Zahedan (Urban), Iranindirect0.17non-fiber (>50.0)PS, rubber, PA[57]
Poland (mutiple)direct4.5 × 107 (debris) bnon-fiber (no data)PE, PET, PA[53]
China (Urban)direct0.67 dfiber (28.0)PET, PA, PU[58]
South Africa (Rural)direct0.22not availablenot available[30]
Barcelona (Urban), Spaindirect0.01fiber (58.0)PET, PP, PA[59]
Britain (mutiple)direct0.02not availablePP, PET, PS[28]
Notes: a The direct method refers to direct measurement in pipes, the indirect method refers to the estimation of the difference between effluent and tap water. b The original data was mass-based (items/kg), which meant the MNPs were measured in scales or debris attached to the wall of pipelines. c They referred to the most three commonly detected polymers. polyethylene terephthalate (PET), polypropylene (PP), polyethylene (PE), polyvinyl chloride (PVC), polystyrene (PS), polyurethane (PU), polyamide (PA). d The original data was area-based (items/cm2).

4.2. Shape Size and Polymer Compositions

The non-fibrous particles of MNPs detected in DWN accounted for an average of 62.8%, significantly higher than the fibrous particles, which made up 37.2%. This composition differs from that typically observed in natural waters. According to the literature on freshwater ecosystems, the proportion of fibers generally ranges from 56.7% to 82.8% [60,61]. Similarly, fibers also typically dominate in wastewater and sediments [11,62,63,64]. Most WTPs do not specifically target fibers during purification, and therefore, the high proportion of non-fibrous MNPs in DWN may result from secondary contamination within the pipelines. For example, in the effluent of a WTP in central China, 100% of the MNPs were fibers, but the proportion of fibers in tap water decreased to less than 60% at the users’ end [55]. Likewise, in Paris, the effluent from the wastewater treatment plant had a higher proportion of fibers and smaller particle sizes compared to the water at the end of the pipe network [65].
In the morphological characterization of MNPs, existing studies have systematically documented variations in particle size, surface topography, and chromatic properties. Significant size variations (1–2× magnitude) were observed between MNPs in DWNs and source water, demonstrating pronounced source-dependent disparities. For instance, effluent MNPs from WTPs in China and Iran exhibited mean particle sizes predominantly below 100 μm. Notably, over 90% of pipeline-derived particles in select cases measured below 50 μm [55,57]. This size distribution not only reflects differential size exclusion efficiencies during wastewater treatment but also suggests the potential secondary release of submicron particles from pipeline systems. Specifically, fibrous particulates in DWN samples displayed both reduced dimensions (relative to source water) and elevated aspect ratios (>2), indicating distinct provenance pathways [58]. Scanning electron microscopy analyses revealed prevalent aging signatures on DWN-associated MNPs, including fissures, mechanical abrasion patterns, and surface chalking. These features substantiate that hydraulic transport through DWNs induces substantial physicochemical aging of MNPs. While chromatic profiles of DWN MNPs showed minimal divergence from source water counterparts, transparent particles constituted nearly 50% of all characterized specimens. This predominance aligns with the material degradation hypothesis, as MNP release from DWN infrastructure is mechanistically coupled with polymeric aging processes.
The polymers detected in DWN include polypropylene, polyethylene, polyvinyl chloride, and even rubber, all of which are common materials in pipelines. When MNPs in the effluent are effectively removed, the remaining polymers within the pipelines are likely sourced from the pipeline materials themselves. However, non-pipeline polymers, such as polyethylene terephthalate and polyamide, may also be found in DWN. These materials are common in atmospheric deposition and may enter DWN through open-water tanks [35]. Additionally, pipelines at the end of their lifespan may develop small defects, such as cavities or pockmarks, which could allow external contaminants to enter DWN during long-distance transport [66,67]. In addition to non-fibrous particles, the fibers detected in DWN may not all originate from the source water. Research on composite pipelines has shown that during the aging process, fibers can detach from the matrix and be released into the water [68]. While all pipeline materials reported in the current literature are pure polymers, further evidence is needed to confirm whether composite materials can also release fiber MNPs. In conclusion, the shape and polymer types of MNPs detected in DWN strongly suggest that pipeline pollution is a major source of contamination.

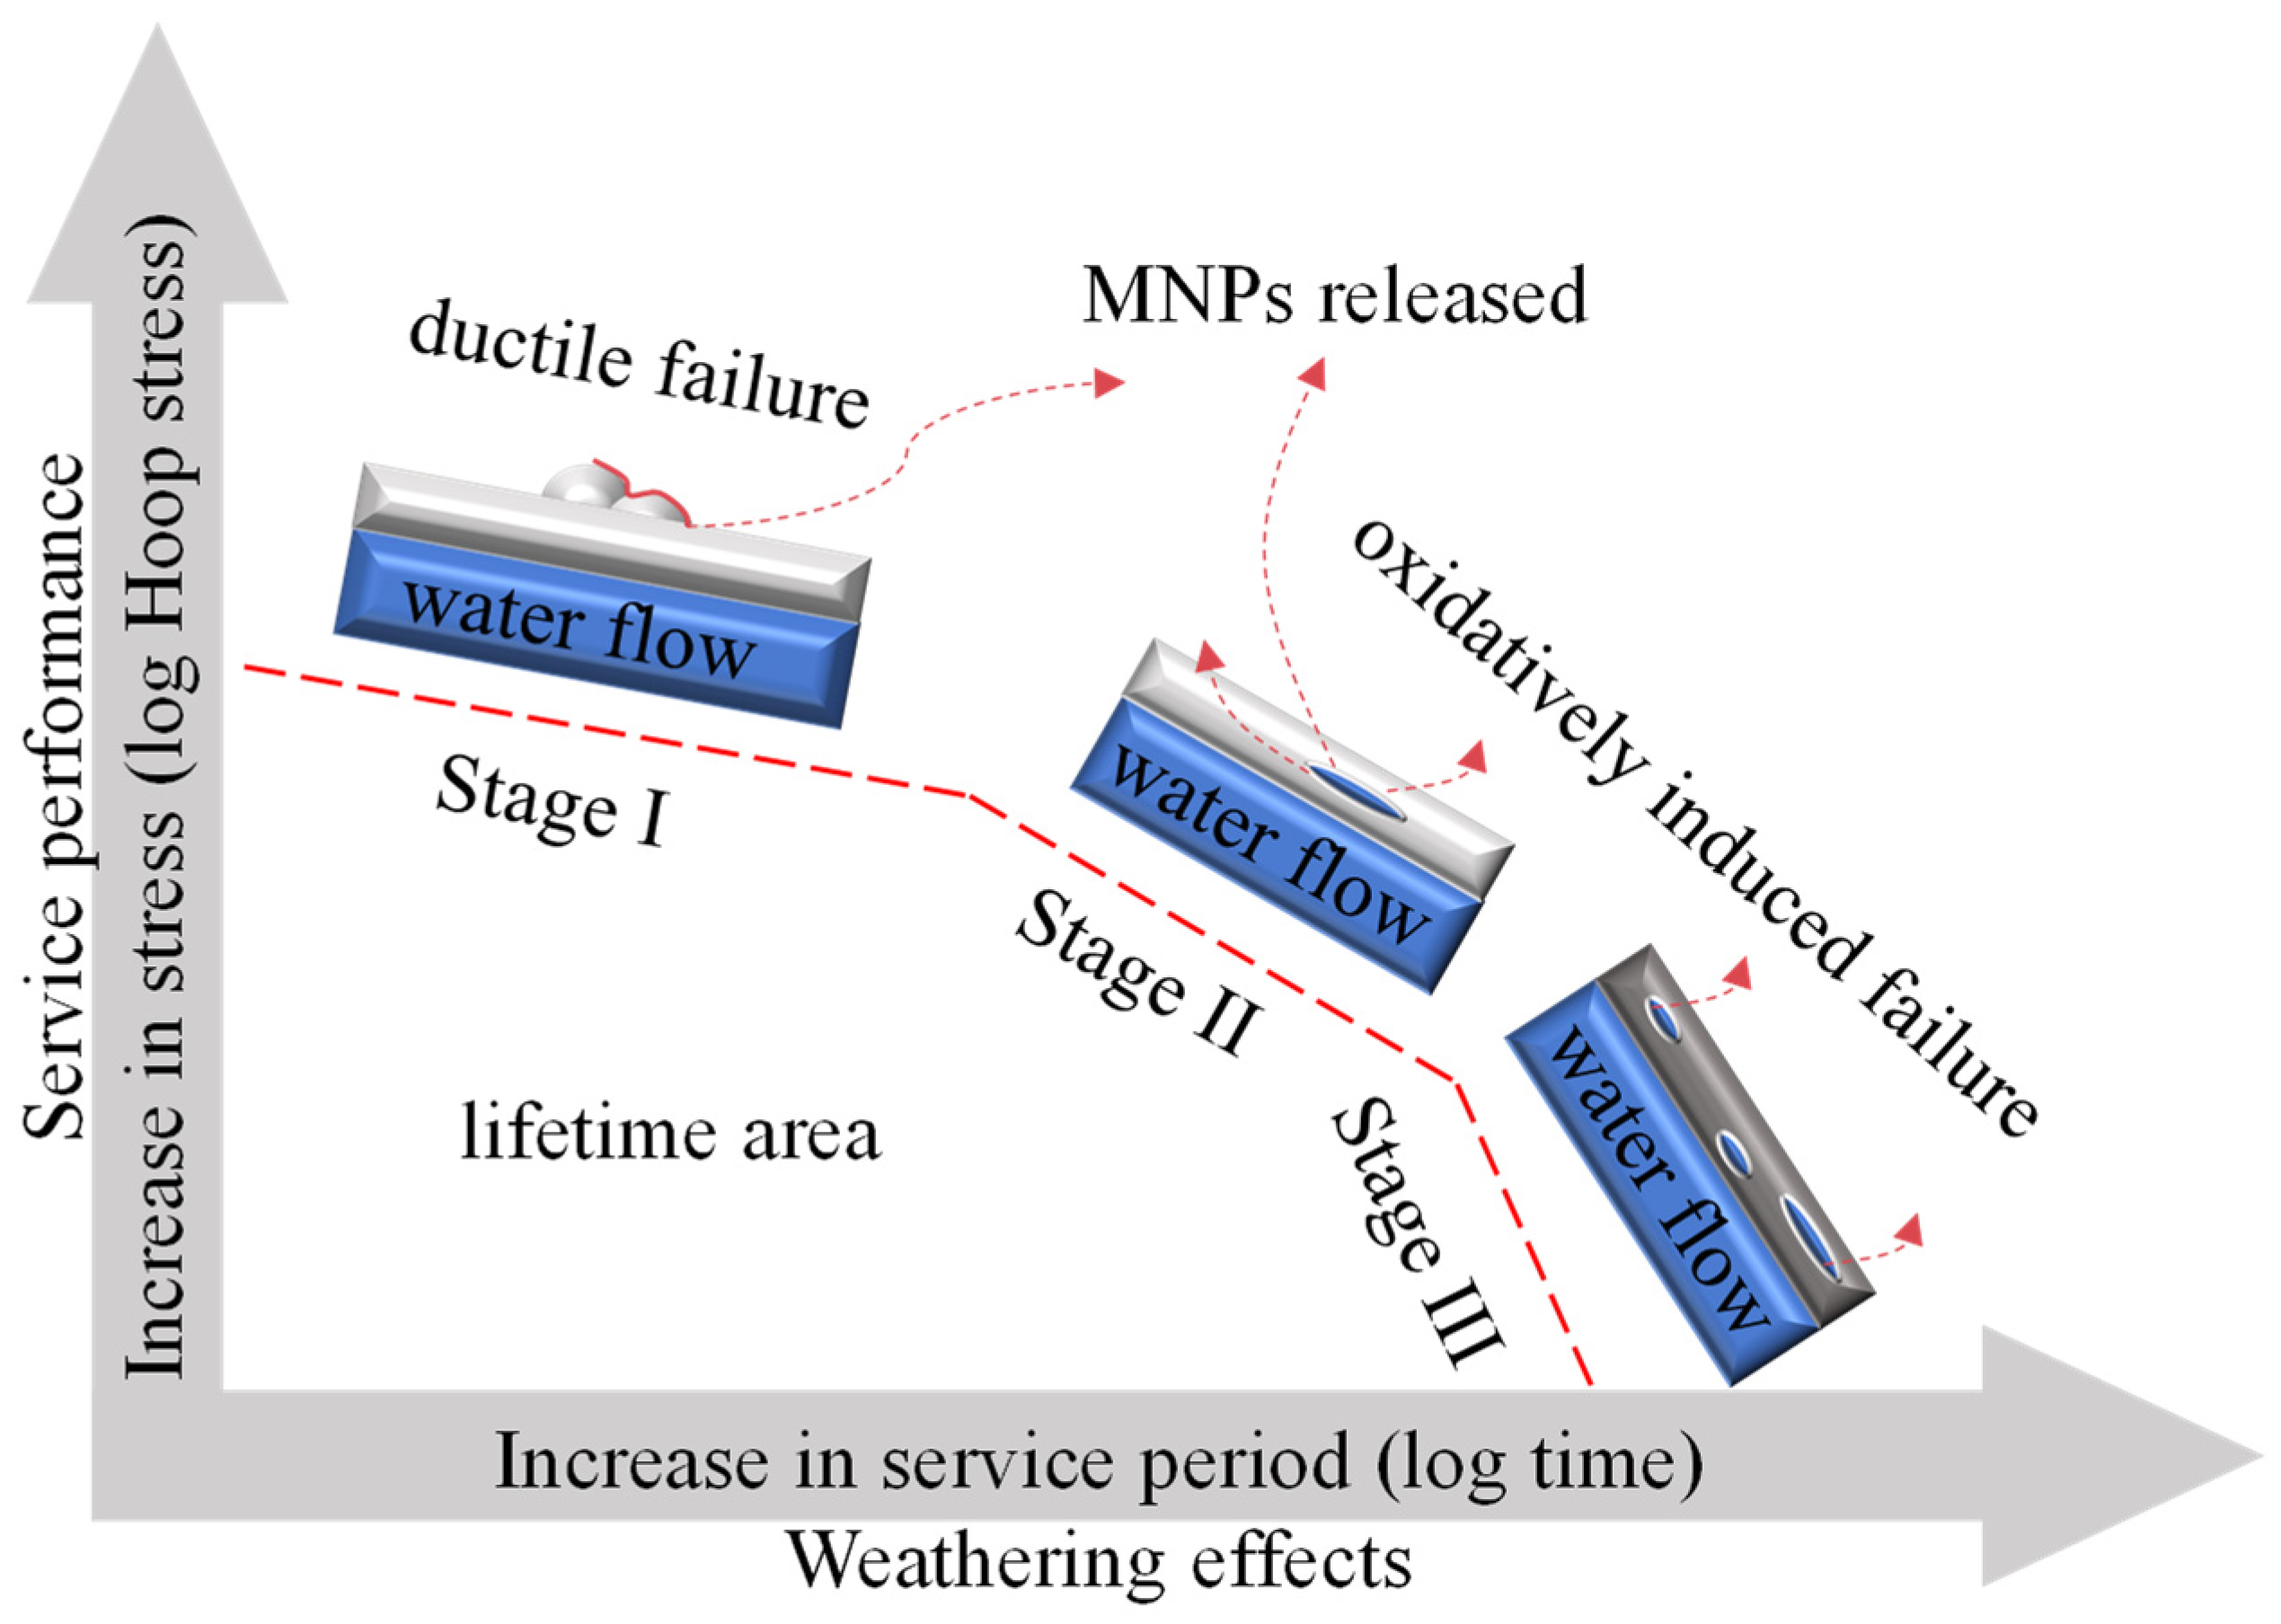
5. The Mechanisms Involved in the Release of MNPs from Pipes

5.1. Physical Mechanisms

In water pipelines, sustained fluid flow can induce local or overall pressure changes. Under prolonged hydraulic corrosion, these pressure variations can lead to fractures and breakage on the surface of plastic pipes, a phenomenon commonly referred to as material failure in materials science [23,24,69]. The mechanical forces responsible for plastic material failure serve as direct triggers for the release of MNPs. We hypothesize that the mechanisms of MNP formation differ at various stages of pipeline usage. During the early stages, the inner walls of the pipes are relatively smooth, and MNPs may originate from points of stress concentration (Figure 3A). For instance, during inspections of PVC pipes, researchers observed localized material loss, potentially linked to long-term uneven stress distribution [70,71]. Additionally, particle abrasion studies have identified long-term scouring marks on the inner walls of pipes [72,73,74]. Furthermore, the interface sections of plastic water pipes release MNPs due to prolonged friction. For example, polypropylene bottle caps can release MNPs in quantities up to 102 during friction. In the case of valves with fully plastic interfaces, the switching process is a primary cause of friction-induced MNP formation. Moreover, excessive particle content in drinking water can exacerbate friction fatigue due to particle impacts.
In the middle and later stages of pipeline usage, the accumulation of deposits inside the pipes increases significantly. For metal pipes, these deposits primarily consist of metal oxides, while in plastic pipes, they are mainly biofilms. These deposits create cavities and increase local resistance within the pipeline network. Some fibrous MNPs may become entangled or obstruct sections of the pipe, and when water pressure fluctuates, they are flushed into the drinking water. Consequently, drinking water from aging plastic pipes may remain contaminated with MNPs. In the later stages of the pipeline’s lifespan, detached particles may even scour the pipe walls as water flows through, resulting in the generation of additional MNPs. Such particle abrasion has been widely documented [73,74]. These mechanisms collectively contribute to the release of MNPs due to the fatigue and wear of plastic pipes (Figure 3).
Scaling and pipe adhesions block MNPs. They act as physical barriers or trap MNPs via adsorption, altering transport and distribution. However, studies on this aspect are still very limited and need to be confirmed by further experimental evidence. MNPs in scaling and pipe wall adhesions may be re-released into the water column under specific conditions. For example, these MNPs adhering to the pipe wall may be washed down when the water flow rate increases or the water temperature rises [75,76], resulting in a localized increase in the concentration of MNPs in the water column. The hardness of water is an important factor in pipe scaling, which may also alter the behavior of MNPs in DWNs. According to DLVO (Derjaguin-Landau-Verwey-Overbeek) theory, ionic concentration and water hardness affect the charge distribution and interactions on microplastic surfaces [77]. Small-sized MNPs, as colloidal particles, can adsorb heavy metals and organic pollutants from water. Water hardness may influence the adsorption capacity of MNPs for these contaminants. For example, in high-hardness water, calcium and magnesium ions may compete with MNPs for adsorption sites, thereby reducing their adsorption efficiency for other materials [78]. During water treatment, water hardness might impact MNP removal efficiency. For instance, high-hardness water could promote aggregation of MNPs with other particles, affecting the effectiveness of filtration and sedimentation removal techniques [29,78]. However, scale deposits in pipelines may temporarily aggregate MNPs, leading to reduced MNP levels in effluent.
As for biofilms, a critical knowledge gap persists in current research: literature analysis reveals no direct elucidation of biofilm-mediated active removal or retention mechanisms for MNPs in DWN. The significance of this gap lies in biofilm’s theoretical capacity to influence MNP transport through multiple interfacial mechanisms as ubiquitous microbial aggregates in water supply networks: (1) Biofilm-associated extracellular polymeric substances (EPS) may entrap hydrophobic polymeric particles via hydrophobic domains and hydrogen bonding networks [79,80]; (2) Their porous architecture could physically sieve MNPs within specific size ranges [81,82]; (3) Microbial metabolism might modify particle surface properties to enhance adhesion. However, these theoretical postulations require empirical validation against real-world pipe network complexities. As we mentioned, biofilm detachment caused by hydraulic disturbances may induce particle re-release, creating a dynamic equilibrium that obscures net biofilm effects on terminal effluent MNP concentrations. Therefore, the roles of biofilm on the abundance of MNPs in plastic pipes is of interest. This will help us to assess the risk of MNP release in factors other than pipe lifetime. We recommend considering biofilm thickness and EPS composition as quantitative parameters in future experimental designs to systematically evaluate their adsorptive effects on MNPs in DWNs.
In addition to the long-term effects of hydraulic transport, the water hammer effect in pipelines may serve as a specific cause for the release of MNPs, particularly in aging infrastructure where material degradation amplifies vulnerability to pressure surges. In areas where valves are frequently opened and closed, or near the terminal end of the water supply, the pressurized water flow generates a direct impact on the pipeline due to inertia (Figure 3B). Simulation experiments have shown that this effect can create pressures of up to 800 MPa, which disproportionately stress aged polypropylene and polyethylene materials, accelerating crack initiation [83]. Under the impact of a water hammer, cracks form on the inner surface of the pipeline, with aging pipes exhibiting heightened susceptibility to fracture propagation, and during crack propagation, MNPs are released from the crack tips. In DWN, the water hammer effect is most likely to occur at the outlet of the WTP and at the indoor pipeline exits [84]. Long-term hydraulic forces are particularly prone to induce fatigue failure at DWN bends or stress concentration zones, thereby accelerating surface material exfoliation [85]. Although controlling water pressure and optimizing valve operations can mitigate the damage, aging pipelines will inevitably release MNPs to varying extents over their service life due to the water hammer effect. In conclusion, mechanical wear is the primary cause of MNP release in DWN. The local pressure fluctuations induced by water flow, particles, and the water hammer effect increase the likelihood of MNP release during the long-term service of pipelines, especially in systems with aging infrastructure.
The widespread use of polymer-based filters in drinking water purification systems, while effective for contaminant removal, introduces critical concerns regarding secondary MNP pollution [86,87]. These polymer-based filters themselves may become a source of MNP pollution. Due to prolonged exposure to water flow and potential chemical substances, the filter materials may gradually age, degrade, or release microscopic plastic particles. In recent work, the observed MNP increase (5.9–88.1%) in effluent post-filtration may be attributed to the use of polymeric filtrations [86]. Also, research has identified lower removal efficiencies for polyester and polyamide during wastewater treatment processes, with the latter being a common filter cartridge material [88,89]. This indirectly demonstrates that polymer-based filtration materials may release MNPs into effluent during wastewater treatment.

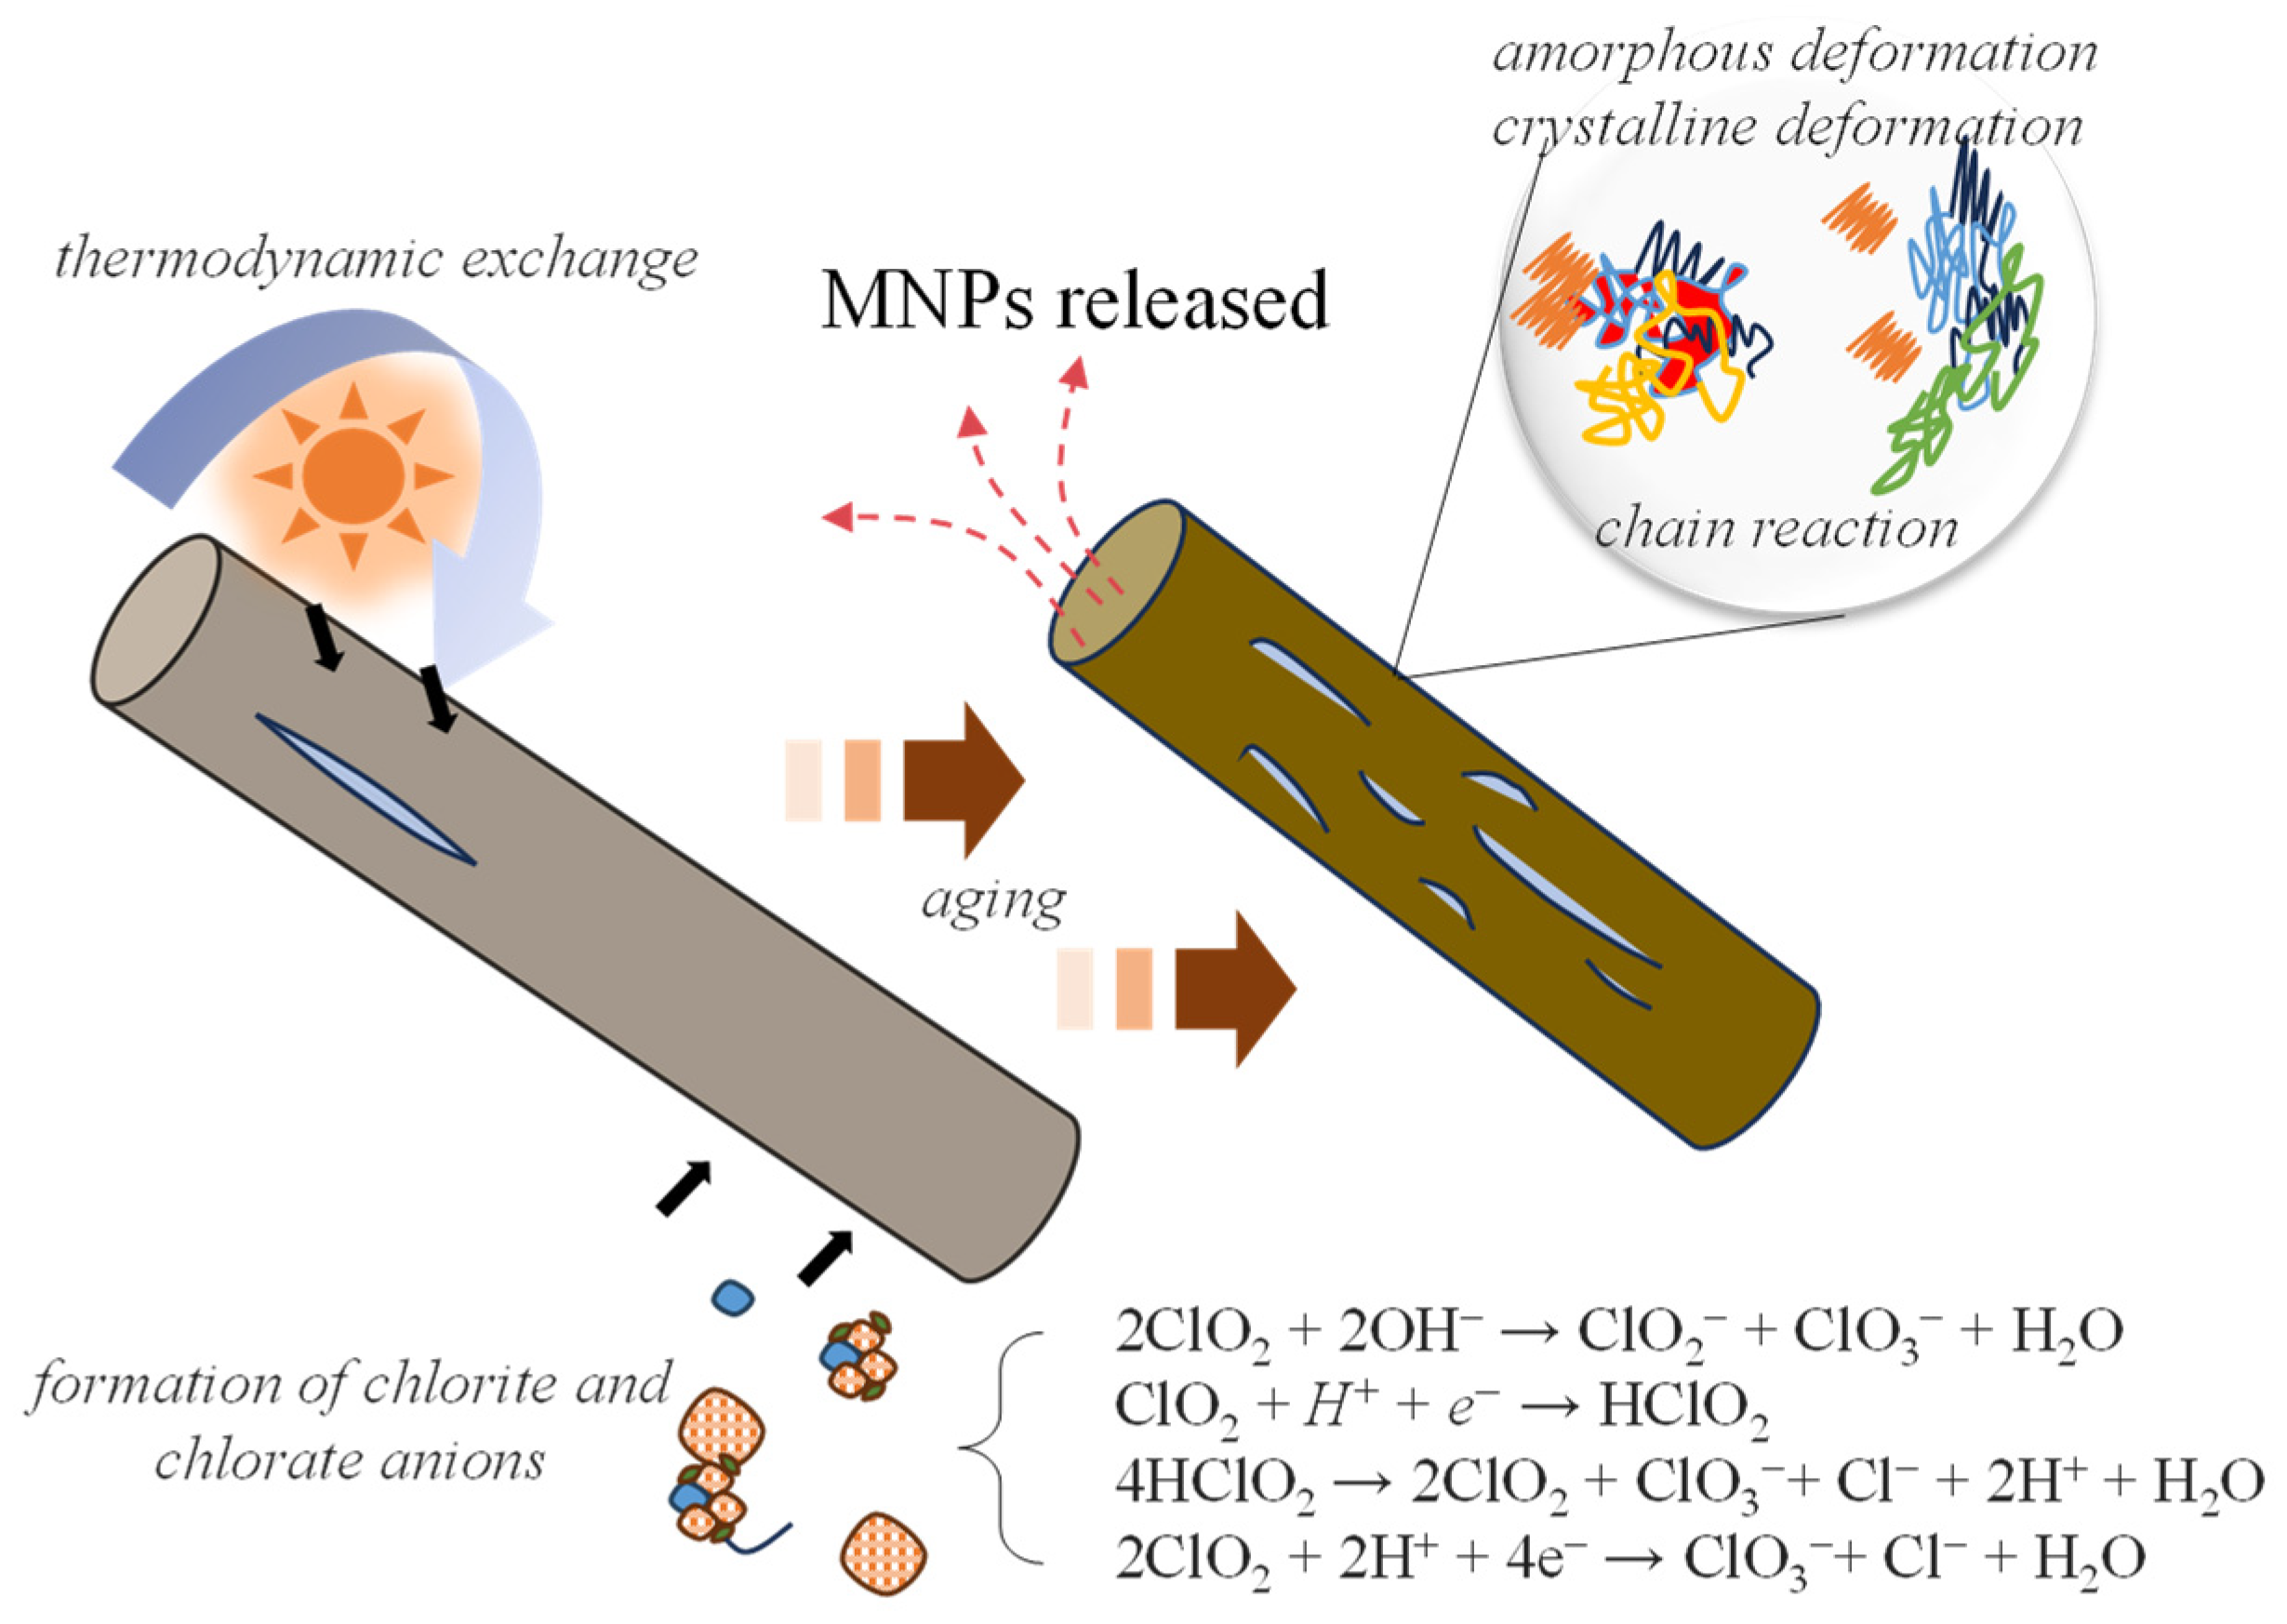
5.2. Chemical Aging and Weathering Effects

The aging and failure of drinking water pipelines can be divided into three stages: ductile failure (Stage I), oxidatively induced brittle failure (Stage II), and environmental or oxidative failure (Stage III) (Figure 4) [90]. Stage I is primarily associated with the direct physical effects of mechanical wear and hydrodynamic corrosion, as discussed in the previous section. Stages II and III are related to the aging of pipes during the later stages of service, leading to leaks and even fractures. These leaks and fractures are linked to the release of MNPs. To improve the service performance of pipelines, numerous studies have investigated the aging mechanisms of pipes [41,69,91,92]. In service, pipes are primarily affected by thermal aging and the presence of anions, both of which increase pipe embrittlement, internal wall fragmentation, and the subsequent release of MNPs.
Thermal aging primarily occurs in gas and steam transportation systems, but should not be overlooked in domestic hot water networks. In polymers, thermal aging is caused by several intricate chemical processes, including oxidation, chain scission, crosslinking, and free radical production [93,94]. In atmospheric environments, the formation of radicals plays a crucial role in thermal aging. A destructive cycle is sustained when these radicals react with oxygen to form peroxides, which then decompose to generate more radicals [95,96]. However, radical reactions are less pronounced in the anoxic environment inside a closed pipe; instead, fluid flow and loading can promote thermal aging [97]. Cyclic loading accelerates polyurethane pipe degradation during thermal aging. Similarly, chlorine disinfectants cause brittle deformation in polyethylene strips [98]. After just four years of service, the flow of hot liquid inside polyethylene pipes can cause swelling, making the pipe less crystalline and more brittle [99]. Characterization techniques, such as SEM, reveal that corrosion material and pits are commonly found in thermally aged plastic pipes [100,101], which are associated with the release of microplastic particles (MNPs).
Chlorine disinfectants and ozone residuals in drinking water are significant contributors to pipeline deterioration [90]. The anions ClO2 and ClO3 are produced by 68% and 9%, respectively, of disinfectants that contain chlorine [102]. Additionally, the ozone system has strong oxidizing properties and generates various free radicals, including O2 and •OH [103,104]. These ions play a crucial role in the aging of plastic pipes as they rapidly penetrate the internal voids of polymers, accelerating the breakage of molecular chains and reducing their length [105]. Furthermore, antioxidants present in the pipes can react with chlorine dioxide to form reactive chlorine species, which also contribute to the deterioration of plastic pipes [106]. For polypropylene and polyvinyl chloride pipes, exposure to ozone or chlorine dioxide can result in significant deterioration effects, such as surface damage and cracking within 75 days [107]. Research indicates that exposure of polymer materials to sodium hydroxide, sodium hypochlorite, and citric acid during disinfection processes may induce chemical degradation of filter cartridges, potentially leading to MNPs release [108]. Moreover, disinfectants can reduce the elasticity of plastic pipes. For example, polyethylene strips exposed to chlorine disinfectants exhibited more brittle deformation upon stretching, with chlorine dioxide having a more pronounced effect than sodium hypochlorite [109]. In conclusion, we argue that factors such as hot water, steam, and disinfectants within the pipe play a critical role in promoting the chemical deterioration of the pipe. As aging progresses, changes in pipe properties—such as embrittlement and crystallization—ultimately lead to the release of MNPs (Figure 5).
During the final stages of aging degradation, some polymer chains undergo complete scission, forming plastic monomers. For example, UV exposure triggers free radical reactions that break carbon-carbon bonds in polyethylene chains, generating low-molecular-weight alkanes and alkenes [110]. In pipeline systems, hot water and prolonged mechanical wear may serve as primary drivers of monomer generation [111]. Polyethylene’s low glass transition temperature results in less selective and efficient thermal degradation, implying monomer release risks primarily exist in long-term used pipelines. Chlorinated polymers like polyvinyl chloride release highly toxic monomers—vinyl chloride is a known carcinogen. Studies show vinyl chloride monomers can enter the human body via inhalation, ingestion, or dermal contact, causing liver damage, neurological harm, and cancer [112]. Consequently, safety service lifetimes for toxic polymer pipelines may require stricter limits to mitigate health risks. Beyond monomers, aging pipelines also release additives and plasticizers, whose hazards are well-documented [113]. These additives and plastic monomers may be released in a stack over an extended period of time, increasing the risk to human health. Overall, DWNs demand attention not only for MNP particle emissions but also for dissolved pollutants released during end-of-service degradation. While current DWNs in their early service stages likely contribute minimally to MNP contamination compared to source waters or treatment processes, aging infrastructure poses a latent exponential risk that demands proactive surveillance. Our evidence suggests that pristine pipes exhibit low to moderate MNP release, but material degradation follows nonlinear kinetics—corrosion-induced surface area expansion and chlorine-enhanced oxidation synergistically accelerate polymer breakdown. We hope our work can provide a comprehensive supplement to understanding the impacts of DWN on MPs release pathways. We must emphasize that DWN remains critically important for supporting healthy communities, and any future risk assessments must be grounded in long-term monitoring data.

6. Conclusions and Perspective

Our critical review highlights the current gaps in research regarding potential MNP contamination in DWN. Firstly, there is a lack of sufficient studies assessing MNP abundance, which hampers effective risk assessments as the demand for such evaluations increases. While MNP detection has been widely conducted at water sources and consumer points (e.g., household tap water), the absence of monitoring during water transportation prevents us from accurately identifying the primary causes of MNP contamination in the water supply. Secondly, the available evidence suggests that mechanical forces and chemical aging within the DWN may play a key role in the release of MNPs. However, the mechanisms by which DWNs produce MNPs during long-term use require further research and validation. Lastly, novel techniques should be employed to detect MNPs, especially nanoplastics, inside pipelines and throughout the entire DWN. The following provides a specific perspective.
  • Standardization of sampling protocol and pipe monitoring
The standardization of MNP monitoring requires a harmonized framework that prioritizes methodological consistency, analytical reliability, and contextual transparency across sampling, analysis, and reporting protocols. A critical gap exists: sampling conditions and infrastructure characteristics are poorly documented. These factors directly influence MNP detection and interpretation. For sampling consistency, protocols must mandate detailed documentation of sampling points relative to infrastructure features—such as proximity to consumer-end taps, storage tanks (noting open/closed designs), and pipeline materials alongside operational parameters like water flow regimes, stagnation periods, and pipe age. This contextualization is vital, as MNP release varies significantly between aging metal pipes (corrosion-driven fragmentation) and plastic pipes (weathering-induced leaching), while open storage tanks introduce atmospheric deposition biases. Analytical standardization should enforce unified workflows combining size-selective filtration, spectroscopic validation, and chemical characterization, supplemented by machine learning tools to correct inter-laboratory instrumental variances. Crucially, analytical reports must integrate infrastructure metadata—such as pipe manufacturer specifications, repair history, and nearby pollution sources (e.g., road runoff)—to disentangle MNP’s origins from background contamination. To enable global data comparability, we should establish minimum reporting standards. They included georeferenced sampling context, infrastructure aging metrics, and environmental confounder documentation (e.g., tank ventilation, and seasonal flow variations). A unified digital platform could archive these metadata alongside analytical results, allowing cross-study reconciliation of MNP data influenced by divergent pipe networks. Pilot initiatives could test metadata harmonization models. Ultimately, transitioning from isolated data collection to contextually grounded monitoring will transform MNPs research into actionable insights for pollution mitigation, infrastructure management, and regulatory policymaking.
  • Incorporating nanoplastics into DWN monitoring
Compared to microplastics, nanoplastics may pose a greater health risk. Due to their smaller size, nanoplastics can cross cellular membranes and accumulate within the body. Given that plastic particles in drinking water may further reduce in size due to abrasion or collisions during transportation, the presence of nanoplastics may not only be linked to the source water but also closely associated with the DWN. Future monitoring efforts should include nanoplastics within the framework. To balance cost with the precision of data required, a combination of quantitative, semi-quantitative, and qualitative techniques could be utilized. Incorporating nanoplastics into DWN monitoring is essential for a comprehensive assessment of the health risks posed by plastic pollution. It also represents a crucial component of the future “One Health” framework in environmental science. In the future, regulatory frameworks must integrate source-specific risks, enforce stricter nanoplastic controls in groundwater infrastructure, and coordinate source-to-tap management for surface water systems. By aligning pipeline monitoring with source typology, stakeholders can better address the compounded effects of environmental inputs and infrastructure degradation on MNP contamination.
  • Incorporating AI and big data into DWN monitoring
With the advancement of water quality sensors, real-time monitoring of specific contaminants in water pipelines has become possible. Leveraging extensive real-time databases, artificial intelligence technologies such as artificial neural networks, and decision trees can assist managers in providing rapid early warnings regarding pipeline health. Although the rapid detection of MNPs still faces technological challenges, certain indices closely related to MNP formation can be easily measured. As mentioned earlier, MNP concentration may surge during the long-term aging of pipelines. Therefore, increases in indices related to pipeline aging and local pressure can assist neural networks in identifying the risk of MNP formation. Additionally, periodic water outflow and water source sampling data can help evaluate the contribution of drinking water networks (DWN) to MNPs in water output, offering early warnings based on seasonal variations or usage scenarios. In addition to these indirect methods for predicting MNP formation, computer vision technologies can also directly identify MNPs and aging traces [114,115]. It is clear that in the future, we will have more advanced technologies to accurately quantify or assess the release and risks associated with DWNs contributing to MNPs.

Author Contributions

Conceptualization, Y.C. and L.S.; methodology, Y.W.; writing—original draft preparation, Y.C.; writing—review and editing, Y.C.; visualization, B.H.; project administration, L.S. All authors have read and agreed to the published version of the manuscript.

Funding

This work was supported by the Open Research Fund of State Key Laboratory of Estuarine and Coastal Research (SKLEC-KF202311) and program of opening ceremony to select the best candidates of the Key Laboratory of Marine Ecological Monitoring and Restoration Technology (MEMRT2024JBGS01).

Data Availability Statement

No new data were created or analyzed in this study. Data sharing is not applicable to this article.

Conflicts of Interest

The authors declare no conflict of interest.

References

  1. Eze, C.G.; Nwankwo, C.E.; Dey, S.; Sundaramurthy, S.; Okeke, E.S. Food chain microplastics contamination and impact on human health: A review. Environ. Chem. Lett. 2024, 22, 1889–1927. [Google Scholar] [CrossRef]
  2. Yu, R.-S.; Singh, S. Microplastic Pollution: Threats and Impacts on Global Marine Ecosystems. Sustainability 2023, 15, 13252. [Google Scholar] [CrossRef]
  3. Enyoh, C.E.; Devi, A.; Kadono, H.; Wang, Q.; Rabin, M.H. The Plastic Within: Microplastics Invading Human Organs and Bodily Fluids Systems. Environments 2023, 10, 194. [Google Scholar] [CrossRef]
  4. Krause, S.; Ouellet, V.; Allen, D.; Allen, S.; Moss, K.; Nel, H.A.; Manaseki-Holland, S.; Lynch, I. The potential of micro- and nanoplastics to exacerbate the health impacts and global burden of non-communicable diseases. Cell Rep. Med. 2024, 5, 101581. [Google Scholar] [CrossRef]
  5. Preda, O.-T.; Vlasceanu, A.-M.; Andreescu, C.V.; Tsatsakis, A.; Mezhuev, Y.; Negrei, C.; Baconi, D.L. Health Implications of Widespread Micro- and Nanoplastic Exposure: Environmental Prevalence, Mechanisms, and Biological Impact on Humans. Toxics 2024, 12, 730. [Google Scholar] [CrossRef]
  6. Luo, Y.; Xu, X.; Yin, Q.; Liu, S.; Xing, M.; Jin, X.; Shu, L.; Jiang, Z.; Cai, Y.; Ouyang, D.; et al. Mapping micro(nano)plastics in various organ systems: Their emerging links to human diseases? Trends Anal. Chem. 2025, 183, 118114. [Google Scholar] [CrossRef]
  7. Marfella, R.; Prattichizzo, F.; Sardu, C.; Fulgenzi, G.; Graciotti, L.; Spadoni, T.; D’Onofrio, N.; Scisciola, L.; La Grotta, R.; Frigé, C.; et al. Microplastics and Nanoplastics in Atheromas and Cardiovascular Events. N. Engl. J. Med. 2024, 390, 900–910. [Google Scholar] [CrossRef]
  8. Yu, Y.; Craig, N.; Su, L. A Hidden Pathway for Human Exposure to Micro- and Nanoplastics—The Mechanical Fragmentation of Plastic Products during Daily Use. Toxics 2023, 11, 774. [Google Scholar] [CrossRef] [PubMed]
  9. Free, C.M.; Jensen, O.P.; Mason, S.A.; Eriksen, M.; Williamson, N.J.; Boldgiv, B. High-levels of microplastic pollution in a large, remote, mountain lake. Mar. Pollut. Bull. 2014, 85, 156–163. [Google Scholar] [CrossRef]
  10. Zhang, Q.; Xu, E.G.; Li, J.; Chen, Q.; Ma, L.; Zeng, E.Y.; Shi, H. A Review of Microplastics in Table Salt, Drinking Water, and Air: Direct Human Exposure. Environ. Sci. Technol. 2020, 54, 3740–3751. [Google Scholar] [CrossRef]
  11. Hamid, F.S.; Bhatti, M.S.; Anuar, N.; Anuar, N.; Mohan, P.; Periathamby, A. Worldwide distribution and abundance of microplastic: How dire is the situation? Waste Manag. Res. 2018, 36, 873–897. [Google Scholar] [CrossRef] [PubMed]
  12. Xie, D.; Fang, H.; Zhao, X.; Lin, Y.; Su, Z. Identification of microplastics and nanoplastics in environmental water by AFM-IR. Anal. Chim. Acta. 2025, 1354, 343992. [Google Scholar] [CrossRef]
  13. Talbot, R.; Chang, H. Microplastics in freshwater: A global review of factors affecting spatial and temporal variations*. Environ. Pollut. 2022, 292, 118393. [Google Scholar] [CrossRef] [PubMed]
  14. Su, L.; Xue, Y.; Li, L.; Yang, D.; Kolandhasamy, P.; Li, D.; Shi, H. Microplastics in Taihu Lake, China. Environ. Pollut. 2016, 216, 711–719. [Google Scholar] [CrossRef]
  15. Paray, B.A.; Yu, J.; Sultana, S.; Banik, P.; Nur, A.-A.U.; Haque, M.R.; Rahman, M.M.; Arai, T.; Yan, L.; Hossain, M.B. Contamination, morphological and chemical characterization, and hazard risk analyses of microplastics in drinking water sourced from groundwater in a developing nation. Front. Environ. Sci. 2024, 12, 1379311. [Google Scholar] [CrossRef]
  16. Panno, S.V.; Kelly, W.R.; Scott, J.; Zheng, W.; McNeish, R.E.; Holm, N.; Hoellein, T.J.; Baranski, E.L. Microplastic Contamination in Karst Groundwater Systems. Groundwater 2019, 57, 189–196. [Google Scholar] [CrossRef]
  17. Guo, X.; Ji, X.; Liu, Z.; Feng, Z.; Zhang, Z.; Du, S.; Li, X.; Ma, J.; Sun, Z. Complex impact of metals on the fate of disinfection by-products in drinking water pipelines: A systematic review. Water Res. 2024, 261, 121991. [Google Scholar] [CrossRef]
  18. Lee, E.J.; Schwab, K.J. Deficiencies in drinking water distribution systems in developing countries. J. Water Health 2005, 3, 109–127. [Google Scholar] [CrossRef]
  19. Lehtola, M.J.; Miettinen, I.T.; Keinänen, M.M.; Kekki, T.K.; Laine, O.; Hirvonen, A.; Vartiainen, T.; Martikainen, P.J. Microbiology, chemistry and biofilm development in a pilot drinking water distribution system with copper and plastic pipes. Water Res. 2004, 38, 3769–3779. [Google Scholar] [CrossRef]
  20. Świetlik, J.; Magnucka, M. Aging of drinking water transmission pipes during long-term operation as a potential source of nano- and microplastics. Int. J. Hyg. Environ. Health 2025, 263, 114467. [Google Scholar] [CrossRef]
  21. Li, C.-G.; Liu, C.; Xu, W.-H.; Shan, M.-G.; Wu, H.-X. Formation mechanisms and supervisory prediction of scaling in water supply pipelines: A review. Water Res. 2022, 222, 118922. [Google Scholar] [CrossRef] [PubMed]
  22. Liu, G.; Zhang, Y.; Knibbe, W.-J.; Feng, C.; Liu, W.; Medema, G.; van der Meer, W. Potential impacts of changing supply-water quality on drinking water distribution: A review. Water Res. 2017, 116, 135–148. [Google Scholar] [CrossRef]
  23. Barton, N.A.; Farewell, T.S.; Hallett, S.H.; Acland, T.F. Improving pipe failure predictions: Factors affecting pipe failure in drinking water networks. Water Res. 2019, 164, 114926. [Google Scholar] [CrossRef] [PubMed]
  24. Li, Q.; Li, Z. Research on Failure Pressure Prediction of Water Supply Pipe Based on GA-BP Neural Network. Water 2024, 16, 2659. [Google Scholar] [CrossRef]
  25. Su, L.; Dong, X.; Peng, J.; Cheng, H.; Craig, N.J.; Hu, B.; Li, J.-Y. Segmentation of beach plastic fragments’ contours based on self-organizing map and multi-shape descriptors: A rapid indication of fragmentation and wearing types. J. Hazard. Mater. 2024, 478, 135564. [Google Scholar] [CrossRef]
  26. Deng, H.; Su, L.; Zheng, Y.; Du, F.; Liu, Q.-X.; Zheng, J.; Zhou, Z.; Shi, H. Crack Patterns of Environmental Plastic Fragments. Environ. Sci. Technol. 2022, 56, 6399–6414. [Google Scholar] [CrossRef] [PubMed]
  27. Wu, J.; Zhang, Y.; Tang, Y. Fragmentation of microplastics in the drinking water treatment process-A case study in Yangtze River region, China. Sci. Total Environ. 2022, 806, 150545. [Google Scholar] [CrossRef]
  28. Adediran, G.A.; Cox, R.; Jurgens, M.D.; Morel, E.; Cross, R.; Carter, H.; Pereira, M.G.; Read, D.S.; Johnson, A.C. Fate and behaviour of Microplastics (>25 μm) within the water distribution network, from water treatment works to service reservoirs and customer taps. Water Res. 2024, 255, 121508. [Google Scholar] [CrossRef]
  29. Sun, J.; Dai, X.; Wang, Q.; van Loosdrecht, M.C.M.; Ni, B.-J. Microplastics in wastewater treatment plants: Detection, occurrence and removal. Water Res. 2019, 152, 21–37. [Google Scholar] [CrossRef]
  30. Swanepoel, A.; du Preez, H.; Bouwman, H.; Verster, C. A baseline study on the prevalence of microplastics in South African drinking water: From source to distribution. Water SA 2023, 49, 320–326. [Google Scholar] [CrossRef]
  31. Qiana, N.; Gaoa, X.; Lang, X.; Deng, H.; Bratu, T.M.; Chen, Q.; Stapleton, P.; Yan, B.; Min, W. Rapid single-particle chemical imaging of nanoplastics by SRS microscopy. Proc. Natl. Acad. Sci. USA 2024, 121, e2300582121. [Google Scholar] [CrossRef] [PubMed]
  32. Carnevale Miino, M.; Galafassi, S.; Zullo, R.; Torretta, V.; Rada, E.C. Microplastics removal in wastewater treatment plants: A review of the different approaches to limit their release in the environment. Sci. Total Environ. 2024, 930, 172675. [Google Scholar] [CrossRef] [PubMed]
  33. Ta, A.T.; Promchan, N. Microplastics in wastewater from developing countries: A comprehensive review and methodology suggestions. TrAC Trends Anal. Chem. 2024, 171, 117537. [Google Scholar] [CrossRef]
  34. Han, Z.; Jiang, J.; Xia, J.; Yan, C.; Cui, C. Occurrence and fate of microplastics from a water source to two different drinking water treatment plants in a megacity in eastern China. Environ. Pollut. 2024, 346, 123546. [Google Scholar] [CrossRef]
  35. Foglia, A.; Pittura, L.; Vivani, V.; Sgroi, M.; De Simoni, L.; Eusebi, A.L.; Gorbi, S.; Regoli, F.; Fatone, F. Microplastics in urban water cycles: Looking for a more scientific approach for sampling and characterization in wastewater and drinking water treatment plants. Sci. Total Environ. 2024, 952, 175919. [Google Scholar] [CrossRef]
  36. Liu, Y.; Nie, Z.; Meng, Y.; Liu, G.; Chen, Y.; Chai, G. Influence of meteorological conditions on atmospheric microplastic transport and deposition. Environ. Res. 2025, 265, 120460. [Google Scholar] [CrossRef]
  37. Fox, S.; Stefánsson, H.; Peternell, M.; Zlotskiy, E.; Ásbjörnsson, E.J.; Sturkell, E.; Wanner, P.; Konrad-Schmolke, M. Physical characteristics of microplastic particles and potential for global atmospheric transport: A meta-analysis. Environ. Pollut. 2024, 342, 122938. [Google Scholar] [CrossRef]
  38. Fok, L.; Lam, T.W.L.; Li, H.-X.; Xu, X.-R. A meta-analysis of methodologies adopted by microplastic studies in China. Sci. Total Environ. 2020, 718, 135371. [Google Scholar] [CrossRef] [PubMed]
  39. He, D.; Luo, Y.; Lu, S.; Liu, M.; Song, Y.; Lei, L. Microplastics in soils: Analytical methods, pollution characteristics and ecological risks. Trends Anal. Chem. 2018, 109, 163–172. [Google Scholar] [CrossRef]
  40. Narwal, N.; Kakakhel, M.A. Assessing microplastics in aquatic ecosystem: Sources, effects, and nature-based solution. A review. Reg. Stud. Mar. Sci. 2025, 82, 104030. [Google Scholar] [CrossRef]
  41. Swietlik, J.; Magnucka, M. Chemical and microbiological safety of drinking water in distribution networks made of plastic pipes. Wiley Interdiscip. Rev. Water 2024, 11, e1704. [Google Scholar] [CrossRef]
  42. Liu, Q.; Yu, H.; Zhu, G.-C.; Wang, P.-B.; Song, S.-Y. Investigation on leakage cause of oil pipeline in the west oilfield of China. Eng. Fail. Anal. 2020, 113, 104552. [Google Scholar] [CrossRef]
  43. Piri, B.; Amini, R.; Asadinia, E.; Vardak, S.; Mehdilouee, R.; Mojarrad, A. Investigation of failure mechanisms and remaining life prediction of firewater pipelines used in industrial applications. Eng. Fail. Anal. 2021, 124, 105301. [Google Scholar] [CrossRef]
  44. Wang, Z.; Lin, T.; Chen, W. Occurrence and removal of microplastics in an advanced drinking water treatment plant (ADWTP). Sci. Total Environ. 2020, 700, 134520. [Google Scholar] [CrossRef]
  45. Chen, L.; Zhou, S.; Su, B.; Qiu, Y.; Li, Y. Microplastic pollution in Taihu Lake: Spatial distribution from the lake inlet to the lake centre and vertical stratification in the water column. Environ. Pollut. 2024, 363, 125102. [Google Scholar] [CrossRef]
  46. Koelmans, A.A.; Redondo-Hasselerharm, P.E.; Mohamed Nor, N.H.; Gouin, T. On the probability of ecological risks from microplastics in the Laurentian Great lakes. Environ. Pollut. 2023, 325, 121445. [Google Scholar] [CrossRef] [PubMed]
  47. Nirmala, K.; Rangasamy, G.; Ramya, M.; Shankar, V.U.; Rajesh, G. A critical review on recent research progress on microplastic pollutants in drinking water. Environ. Res. 2023, 222, 115312. [Google Scholar] [CrossRef]
  48. Ali, N.; Khan, M.H.; Ali, M.; Sidra; Ahmad, S.; Khan, A.; Nabi, G.; Ali, F.; Bououdina, M.; Kyzas, G.Z. Insight into microplastics in the aquatic ecosystem: Properties, sources, threats and mitigation strategies. Sci. Total Environ. 2024, 913, 169489. [Google Scholar] [CrossRef]
  49. He, L.; Ou, Z.; Fan, J.; Zeng, B.; Guan, W. Research on the non-point source pollution of microplastics. Front. Chem. 2022, 10, 956547. [Google Scholar] [CrossRef]
  50. He, Y.-Q.; McDonough, L.K.; Zainab, S.M.; Guo, Z.-F.; Chen, C.; Xu, Y.-Y. Microplastic accumulation in groundwater: Data-scaled insights and future research. Water Res. 2024, 258, 121808. [Google Scholar] [CrossRef]
  51. Muhib, M.I.; Uddin, M.K.; Rahman, M.M.; Malafaia, G. Occurrence of microplastics in tap and bottled water, and food packaging: A narrative review on current knowledge. Sci. Total Environ. 2023, 865, 161274. [Google Scholar] [CrossRef] [PubMed]
  52. Singh, T. Generation of microplastics from the opening and closing of disposable plastic water bottles. J. Water Health 2021, 19, 488–498. [Google Scholar] [CrossRef]
  53. Marta, M.; Joanna, Ś.; Agata, L.; Piotr, N.; Lilla, F. Occurrence and identification of microplastics retained in corrosion deposits of drinking water transmission pipes. Water Emerg. Contam. Nanoplastics 2024, 3, 17. [Google Scholar] [CrossRef]
  54. Zhang, J.; Peng, M.; Lian, E.; Xia, L.; Asimakopoulos, A.G.; Luo, S.; Wang, L. Identification of Poly(ethylene terephthalate) Nanoplastics in Commercially Bottled Drinking Water Using Surface-Enhanced Raman Spectroscopy. Environ. Sci. Technol. 2023, 57, 8365–8372. [Google Scholar] [CrossRef]
  55. Zhou, G.; Wu, Q.; Wei, X.-F.; Chen, C.; Ma, J.; Crittenden, J.C.; Liu, B. Tracing microplastics in rural drinking water in Chongqing, China: Their presence and pathways from source to tap. J. Hazard. Mater. 2023, 459, 132206. [Google Scholar] [CrossRef]
  56. Chu, X.; Zheng, B.; Li, Z.; Cai, C.; Peng, Z.; Zhao, P.; Tian, Y. Occurrence and distribution of microplastics in water supply systems: In water and pipe scales. Sci. Total Environ. 2022, 803, 150004. [Google Scholar] [CrossRef] [PubMed]
  57. Taghipour, H.; Ghayebzadeh, M.; Ganji, F.; Mousavi, S.; Azizi, N. Tracking microplastics contamination in drinking water in Zahedan, Iran: From source to consumption taps. Sci. Total Environ. 2023, 872, 162121. [Google Scholar] [CrossRef] [PubMed]
  58. Yang, X.; Xu, X.; Zhou, Y.; Yao, Y.; Shen, C.; Liu, J. Longitudinal and vertical distribution of microplastics in various pipe scales in an operating drinking water distribution system. J. Hazard. Mater. 2023, 459, 132108. [Google Scholar] [CrossRef]
  59. Dalmau-Soler, J.; Ballesteros-Cano, R.; Ferrer, N.; Boleda, M.R.; Lacorte, S. Microplastics throughout a tap water supply network. Water Environ. J. 2022, 36, 292–298. [Google Scholar] [CrossRef]
  60. Li, C.; Busquets, R.; Campos, L.C. Assessment of microplastics in freshwater systems: A review. Sci. Total Environ. 2020, 707, 135578. [Google Scholar] [CrossRef]
  61. Wu, F.; Ha, X.; Wang, S.; Li, J.; Gao, Y. Microplastic occurrences, transport, and quantification and associated effects on primary productivity and carbon cycling processes in freshwater ecosystems. Trends Anal. Chem. 2024, 172, 117611. [Google Scholar] [CrossRef]
  62. Akdogan, Z.; Guven, B. Microplastics in the environment: A critical review of current understanding and identification of future research needs. Environ. Pollut. 2019, 254, 113011. [Google Scholar] [CrossRef]
  63. Ivar do Sul, J.A.; Costa, M.F. The present and future of microplastic pollution in the marine environment. Environ. Pollut. 2014, 185, 352–364. [Google Scholar] [CrossRef] [PubMed]
  64. Jiang, Y.; Yang, F.; Kazmi, S.S.U.H.; Zhao, Y.; Chen, M.; Wang, J. A review of microplastic pollution in seawater, sediments and organisms of the Chinese coastal and marginal seas. Chemosphere 2022, 286, 131677. [Google Scholar] [CrossRef] [PubMed]
  65. Barbier, J.-S.; Dris, R.; Lecarpentier, C.; Raymond, V.; Delabre, K.; Thibert, S.; Tassin, B.; Gasperi, J. Microplastic occurrence after conventional and nanofiltration processes at drinking water treatment plants: Preliminary results. Front. Water 2022, 4, 886703. [Google Scholar] [CrossRef]
  66. Staroverov, O.; Mugatarov, A.; Kuchukov, A.; Strungar, E.; Chebotareva, E.; Sivtseva, A.; Wildemann, V. Influence of proportional multiaxial fatigue loading on the residual mechanical properties of glass-reinforced plastic pipes. Eng. Fail. Anal. 2024, 163, 108586. [Google Scholar] [CrossRef]
  67. Ghoochani, S.; Hadiuzzaman, M.; Mirza, N.; Brown, S.P.; Salehi, M. Effects of water chemistry and flow on lead release from plastic pipes versus copper pipes, implications for plumbing decontamination. Environ. Pollut. 2023, 337, 122520. [Google Scholar] [CrossRef]
  68. Mager, S.; Knopick, M.; Oddy, G. The concentration and prevalence of asbestos fibres in Christchurch, New Zealand’s drinking water supply. Water Supply 2022, 22, 4445–4456. [Google Scholar] [CrossRef]
  69. Della Rovere, C.A.; Silva, R.; Moretti, C.; Kuri, S.E. Corrosion failure analysis of galvanized steel pipes in a water irrigation system. Eng. Fail. Anal. 2013, 33, 381–386. [Google Scholar] [CrossRef]
  70. Espejo, E. Analysis of Premature Failure of a PVC Water Pipe. J. Fail. Anal. Prev. 2023, 23, 1491–1497. [Google Scholar] [CrossRef]
  71. Tang, P.; Hu, S.; Lu, C.; He, Z.; Shan, C. Burst failure analysis of PVC-UH pipes with axial surface crack based on multiple methodologies. Eng. Fail. Anal. 2024, 166, 108841. [Google Scholar] [CrossRef]
  72. El-Sayed, M.H. Flow enhanced corrosion of water injection pipelines. Eng. Fail. Anal. 2015, 50, 1–6. [Google Scholar] [CrossRef]
  73. He, B.; Han, P.; Lu, C.; Bai, X. Effect of soil particle size on the corrosion behavior of natural gas pipeline. Eng. Fail. Anal. 2015, 58, 19–30. [Google Scholar] [CrossRef]
  74. Singh, J.; Singh, S.; Singh, J.P. Investigation on wall thickness reduction of hydropower pipeline underwent to erosion-corrosion process. Eng. Fail. Anal. 2021, 127, 105504. [Google Scholar] [CrossRef]
  75. Akbulut, S.; Akman, P.K.; Tornuk, F.; Yetim, H. Microplastic Release from Single-Use Plastic Beverage Cups. Foods 2024, 13, 1564. [Google Scholar] [CrossRef] [PubMed]
  76. Chang, M.; Sun, P.; Zhang, L.; Liu, Y.; Chen, L.; Ren, H.; Wu, B. Changes in characteristics and risk of freshwater microplastics under global warming. Water Res. 2024, 260, 121960. [Google Scholar] [CrossRef]
  77. Rahman, A.M.N.A.A.; Rusli, A.; Abdullah, M.K.; Shuib, R.K.; Hamid, Z.A.A.; Ku Ishak, K.M.; Mohd Zaini Makhtar, M.; Jaafar, M.; Shafiq, M.D. A review of microplastic surface interactions in water and potential capturing methods. Water Sci. Eng. 2024, 17, 361–370. [Google Scholar] [CrossRef]
  78. Shen, M.; Li, Y.; Qin, L.; Chen, X.; Ao, T.; Liang, X.; Jin, K.; Dou, Y.; Li, J.; Duan, X. Distribution and risk assessment of microplastics in a source water reservoir, Central China. Sci. Rep. 2025, 15, 468. [Google Scholar] [CrossRef]
  79. Deng, H.; Fu, Q.; Li, D.; Zhang, Y.; He, J.; Feng, D.; Zhao, Y.; Du, G.; Yu, H.; Ge, C. Microplastic-associated biofilm in an intensive mariculture pond: Temporal dynamics of microbial communities, extracellular polymeric substances and impacts on microplastics properties. J. Clean. Prod. 2021, 319, 128774. [Google Scholar] [CrossRef]
  80. Saharan, B.S.; Beniwal, N.; Duhan, J.S. From formulation to function: A detailed review of microbial biofilms and their polymer-based extracellular substances. Microbe 2024, 5, 100194. [Google Scholar] [CrossRef]
  81. Huang, H.; Zeng, S.; Luo, C.; Long, T. Separate effect of turbulent pulsation on internal mass transfer in porous biofilms. Environ. Res. 2023, 217, 114972. [Google Scholar] [CrossRef]
  82. Zou, L.; Qiao, Y.; Wu, X.-S.; Li, C.M. Tailoring hierarchically porous graphene architecture by carbon nanotube to accelerate extracellular electron transfer of anodic biofilm in microbial fuel cells. J. Power Sources 2016, 328, 143–150. [Google Scholar] [CrossRef]
  83. Mou, Y.; Lian, Z.; Sang, P.; Yu, H.; Zhang, Q.; Li, R. Study on water hammer effect on defective tubing failure in high pressure deep gas well. Eng. Fail. Anal. 2019, 106, 104154. [Google Scholar] [CrossRef]
  84. Kandil, M.; El-Sayed, T.A.; Kamal, A.M. Unveiling the impact of pipe materials on water hammer in pressure pipelines: An experimental and numerical study. Sci. Rep. 2024, 14, 30599. [Google Scholar] [CrossRef] [PubMed]
  85. Cancemi, S.A.; Lo Frano, R. Preliminary Analysis of Long-Term Performance of a Piping: Aging and Creep Effects. Materials 2021, 14, 1703. [Google Scholar] [CrossRef] [PubMed]
  86. Maliwan, T.; Hu, J. Release of microplastics from polymeric ultrafiltration membrane system for drinking water treatment under different operating conditions. Water Res. 2025, 274, 123047. [Google Scholar] [CrossRef]
  87. Ding, H.; Zhang, J.; He, H.; Zhu, Y.; Dionysiou, D.D.; Liu, Z.; Zhao, C. Do membrane filtration systems in drinking water treatment plants release nano/microplastics? Sci. Total Environ. 2021, 755, 142658. [Google Scholar] [CrossRef]
  88. Sheraz, M.; Sun, X.-F.; Siddiqui, A.; Hu, S.; Song, Z. Research Advances in Natural Polymers for Environmental Remediation. Polymers 2025, 17, 559. [Google Scholar] [CrossRef]
  89. Zhu, Y.; Yang, S.; Gustavsson, M.; Huang, W.; Gao, S.; Wang, R. Investigation of Removal Efficiency of Microplastics at Different Process Stages of a Wastewater Treatment Plant in the Textile Industry in Southern China. Water 2025, 17, 574. [Google Scholar] [CrossRef]
  90. Lancioni, N.; Parlapiano, M.; Sgroi, M.; Giorgi, L.; Fusi, V.; Darvini, G.; Soldini, L.; Szeląg, B.; Eusebi, A.L.; Fatone, F. Polyethylene pipes exposed to chlorine dioxide in drinking water supply system: A critical review of degradation mechanisms and accelerated aging methods. Water Res. 2023, 238, 120030. [Google Scholar] [CrossRef]
  91. Makris, K.F.; Langeveld, J.; Clemens, F.H.L.R. A review on the durability of PVC sewer pipes: Research vs. practice. Struct. Infrastruct. Eng. 2020, 16, 880–897. [Google Scholar] [CrossRef]
  92. Tang, M.; Triantafyllidou, S.; Edwards, M. In situ remediation of leaks in potable water supply systems. Corros. Rev. 2013, 31, 105–122. [Google Scholar] [CrossRef]
  93. Colin, X. Humid and Thermal Oxidative Ageing of Radiation Cured Polymers-A Brief Overview. Front. Chem. 2022, 9, 797335. [Google Scholar] [CrossRef]
  94. Ge, J.; Wang, M.; Liu, P.; Zhang, Z.; Peng, J.; Guo, X. A systematic review on the aging of microplastics and the effects of typical factors in various environmental media. Trends Anal. Chem. 2023, 162, 117025. [Google Scholar] [CrossRef]
  95. Wang, H.; Gao, Z.; Zhu, Q.; Wang, C.; Cao, Y.; Chen, L.; Liu, J.; Zhu, J. Overview of the environmental risks of microplastics and their controlled degradation from the perspective of free radicals. Environ. Pollut. 2024, 355, 124227. [Google Scholar] [CrossRef] [PubMed]
  96. Li, H.; Jiang, Y.; Gu, Y.; Chen, C.; Yu, J.; Wang, C.; Shi, C.; Pan, R.; Chen, H. Environmentally persistent free radicals on photoaging microplastics shortens longevity via inducing oxidative stress in Caenorhabditis elegans. Chemosphere 2024, 361, 142560. [Google Scholar] [CrossRef]
  97. Chen, G.; Yang, Y.; Zhou, C.; Zhou, Z.; Yan, D. Thermal-oxidative aging performance and life prediction of polyethylene pipe under cyclic and constant internal pressure. J. Appl. Polym. Sci. 2019, 136, 47766. [Google Scholar] [CrossRef]
  98. Vega, A.; Yarahmadi, N.; Sällström, J.H.; Jakubowicz, I. Effects of cyclic mechanical loads and thermal ageing on district heating pipes. Polym. Degrad. Stab. 2020, 182, 109385. [Google Scholar] [CrossRef]
  99. Kong, L.; Qi, D.; Li, H.; Ding, N.; Ge, P.; Xu, Y.; Zhang, C.; Pan, C.; Fan, X. Aging of Polyethylene of Raised Temperature Resistance Pipe Liner After a Four-Year Service in a Crude Oil Gathering System. J. Fail. Anal. Prev. 2021, 21, 1323–1330. [Google Scholar] [CrossRef]
  100. Bachir-Bey, T.; Belhaneche-Bensemra, N. Investigation of Polyethylene Pipeline Behavior after 30 Years of Use in Gas Distribution Network. J. Mater. Eng. Perform. 2020, 29, 6652–6660. [Google Scholar] [CrossRef]
  101. Leuteritz, A.; Doering, K.-D.; Lampke, T.; Kuehnert, I. Accelerated ageing of plastic jacket pipes for district heating. Polym. Test. 2016, 51, 142–147. [Google Scholar] [CrossRef]
  102. Sorlini, S.; Biasibetti, M.; Gialdini, F.; Muraca, A. Modeling and analysis of chlorine dioxide, chlorite, and chlorate propagation in a drinking water distribution system. J. Water Supply Res. Technol. Aqua 2016, 65, 597–611. [Google Scholar] [CrossRef]
  103. Luo, H.; Zeng, Y.; Zhao, Y.; Xiang, Y.; Li, Y.; Pan, X. Effects of advanced oxidation processes on leachates and properties of microplastics. J. Hazard. Mater. 2021, 413, 125342. [Google Scholar] [CrossRef] [PubMed]
  104. Wang, L.; Wang, H.; Huang, Q.; Yang, C.; Wang, L.; Lou, Z.; Zhou, Q.; Wang, T.; Ning, C. Microplastics in Landfill Leachate: A Comprehensive Review on Characteristics, Detection, and Their Fates during Advanced Oxidation Processes. Water 2023, 15, 252. [Google Scholar] [CrossRef]
  105. Vertova, A.; Miani, A.; Lesma, G.; Rondinini, S.; Minguzzi, A.; Falciola, L.; Ortenzi, M.A. Chlorine Dioxide Degradation Issues on Metal and Plastic Water Pipes Tested in Parallel in a Semi-Closed System. Int. J. Environ. Res. Public Health 2019, 16, 4582. [Google Scholar] [CrossRef]
  106. Yu, W.; Azhdar, B.; Andersson, D.; Reitberger, T.; Hassinen, J.; Hjertberg, T.; Gedde, U.W. Deterioration of polyethylene pipes exposed to water containing chlorine dioxide. Polym. Degrad. Stab. 2011, 96, 790–797. [Google Scholar] [CrossRef]
  107. He, H.; Li, F.; Liu, K.; Zhan, J.; Wang, X.; Lai, C.; Yang, X.; Huang, B.; Pan, X. The disinfectant residues promote the leaching of water contaminants from plastic pipe particles. Environ. Pollut. 2023, 327, 121577. [Google Scholar] [CrossRef]
  108. Gan, X.; Lin, T.; Jiang, F.; Zhang, X. Impacts on characteristics and effluent safety of PVDF ultrafiltration membranes aged by different chemical cleaning types. J. Membr. Sci. 2021, 640, 119770. [Google Scholar] [CrossRef]
  109. Castagnetti, D.; Scirè Mammano, G.; Dragoni, E. Effect of chlorinated water on the oxidative resistance and the mechanical strength of polyethylene pipes. Polym. Test. 2011, 30, 277–285. [Google Scholar] [CrossRef]
  110. Lu, Q.; Tang, D.; Liang, Q.; Wang, S. Biotechnology for the degradation and upcycling of traditional plastics. Environ. Res. 2024, 263, 120140. [Google Scholar] [CrossRef]
  111. Aydonat, S.; Hergesell, A.H.; Seitzinger, C.L.; Lennarz, R.; Chang, G.; Sievers, C.; Meisner, J.; Vollmer, I.; Göstl, R. Leveraging mechanochemistry for sustainable polymer degradation. Polym. J. 2024, 56, 249–268. [Google Scholar] [CrossRef]
  112. Campisi, L.; La Motta, C.; Napierska, D. Polyvinyl chloride (PVC), its additives, microplastic and human health: Unresolved and emerging issues. Sci. Total Environ. 2025, 960, 178276. [Google Scholar] [CrossRef] [PubMed]
  113. Zhang, L.; He, Y.; Jiang, L.; Shi, Y.; Hao, L.; Huang, L.; Lyu, M.; Wang, S. Plastic additives as a new threat to the global environment: Research status, remediation strategies and perspectives. Environ. Res. 2024, 263, 120007. [Google Scholar] [CrossRef] [PubMed]
  114. Im, H.R.; Im, S.J.; Nguyen, D.V.; Jeong, S.P.; Jang, A. Real-time diagnosis and monitoring of biofilm and corrosion layer formation on different water pipe materials using non-invasive imaging methods. Chemosphere 2024, 361, 142577. [Google Scholar] [CrossRef]
  115. Mo, Y.; Bi, L. TR Self-Adaptive Cancellation Based Pipeline Leakage Localization Method Using Piezoceramic Transducers. Sensors 2022, 22, 696. [Google Scholar] [CrossRef]
Figure 1. An overview of the characteristics of published reviews on drinking water. The connection map was divided according to the keyword clusters in the original literature, and the labels summarized the main points within each cluster (A). The number of publications on nanoplastics, microplastics, and both, as a function of the publication year, is shown (B).
Water 17 01188 g001
Figure 2. The sections involved in the MNPs monitoring in the whole DWN. Dashed circular boxes indicate possible contamination links, the size of cycles indicated the approximated number and frequency of studies. The yellow arrow indicated two major exposure pathways.
Water 17 01188 g002
Figure 3. The release of MNPs from pipes in terms of different scenarios. The release of MNPs from the long-term and short-term services of pipes (A), and an illustration of the water hammer effect (B). The red arrows indicated the potential release of MNPs.
Water 17 01188 g003
Figure 4. An illustration of different stages of aging of drinking water pipes. The red arrow indicates the potential release of MNPs. The red dotted line indicated that the service performance of the pipeline decreases over time.
Water 17 01188 g004
Figure 5. The primary mechanisms involved in the chemical aging of pipes. The red arrow indicates the potential release of MNPs.
Water 17 01188 g005
Disclaimer/Publisher’s Note: The statements, opinions and data contained in all publications are solely those of the individual author(s) and contributor(s) and not of MDPI and/or the editor(s). MDPI and/or the editor(s) disclaim responsibility for any injury to people or property resulting from any ideas, methods, instructions or products referred to in the content.

