Article

Phytoplankton and Zooplankton Community Dynamics in an Alpine Reservoir: Environmental Drivers and Ecological Implications in Daqing Reservoir, China

1
Ecological Environment Management Company, CNPC Daqing Oilfield, Daqing 163411, China
2
Nanjing Institute of Environmental Sciences, Ministry of Ecology and Environment, Nanjing 210042, China
3
College of Environment, Hohai University, Nanjing 210098, China
*
Authors to whom correspondence should be addressed.
Water 2025, 17(8), 1202; https://doi.org/10.3390/w17081202
Submission received: 28 February 2025 / Revised: 26 March 2025 / Accepted: 3 April 2025 / Published: 17 April 2025
(This article belongs to the Section Biodiversity and Functionality of Aquatic Ecosystems)

Abstract

:
To elucidate the structural characteristics and environmental drivers of plankton communities in alpine reservoirs, we examined phytoplankton and zooplankton in the Daqing Reservoir (China) across 13 sampling sites. Redundancy analysis (RDA) and Pearson correlation analysis were employed to explore the relationships between plankton density and environmental factors, as well as between plankton diversity indices and environmental conditions. Key findings include: (1) A total of 80 phytoplankton species were identified, with Chlorophyta (37 species) as the dominant group, while 52 zooplankton species were primarily represented by Rotifera. (2) Phytoplankton diversity indices (Shannon: 3.07–4.21) suggested oligotrophic conditions, whereas zooplankton indices (Shannon: 1.40–3.08) indicated meso- to oligotrophic states. (3) RDA analysis revealed that phytoplankton distribution was influenced by chemical oxygen demand and total phosphorus, while zooplankton distribution was related to ammonia nitrogen. These results highlight the importance of targeted nutrient management strategies to protect water quality in alpine reservoirs.

1. Introduction

The reservoir ecosystem plays a crucial role in maintaining the ecological balance of the lake body and sustaining the plankton community. As primary producers, phytoplankton and zooplankton are essential components of aquatic ecosystems, significantly influencing their overall functioning. Phytoplankton serve as primary producers by converting sunlight into organic matter, thereby forming the base of the aquatic food web. They are responsible for producing much of the oxygen in water bodies through photosynthesis, which benefits other marine life. Zooplankton, as primary consumers, feed on phytoplankton and help control their populations, preventing excessive growth that could lead to imbalances. Additionally, zooplankton play a crucial role in nutrient cycling by transferring energy from lower to higher trophic levels. Together, these microscopic organisms maintain ecological balance, support biodiversity, and contribute to the health of aquatic environments [1,2,3,4]. Aquatic organisms are crucial components of urban lakes and reservoirs, playing a pivotal role in aquatic ecosystems by driving material cycling, energy flow, and information transfer. They are indispensable for maintaining ecosystem stability [1]. Because of their microscopic size, simple cellular structure, short lifespan, and rapid reproduction rate, plankton are highly sensitive to changes in water quality. As critical bioindicators in aquatic ecosystems, they serve as effective proxies for assessing ecosystem health and water quality variations [5,6,7,8,9,10]. Consequently, structural changes in plankton communities can alter the entire ecosystem framework and trophic pathways, impacting water ecology, environmental quality, and water security. Investigating the community structure characteristics of phytoplankton and zooplankton, along with their influencing factors, is essential for accurately assessing water quality dynamics, defining remediation goals, and guiding ecological monitoring and evaluation [11,12,13,14].
Currently, numerous studies have investigated phytoplankton and zooplankton in reservoirs, primarily focusing on the distribution patterns of plankton communities and water quality comparisons across different water bodies under monsoon climates. In contrast, this study emphasizes the composition of phytoplankton and zooplankton communities in alpine reservoirs. We aim to (1) identify key environmental factors influencing phytoplankton distribution and (2) elucidate their response relationships. The Daqing Reservoir (46° N, 125° E), located in the northern Sartu District of Daqing City, Heilongjiang Province, China, was constructed in 1976. With a catchment area of 60 km2 and a total storage capacity of 1.08 × 10⁸ m3, the reservoir has an average depth of 2.5 m. In 2021, the mean water temperature was 20.2 °C during the monitoring period, while the annual air temperature in Daqing City averaged 1.4 °C, reflecting its typical high-latitude cold-temperate climate. In winter, temperatures often drop below −20 °C, and sometimes even reach as low as −30 °C or lower. This extreme cold climate makes the winter in Daqing particularly severe and long-lasting. As one of Daqing’s critical drinking water sources, the reservoir operates under strict regulations concerning water supply, inflow, and quality control. However, in recent years, human activities such as fishing, sewage discharge, and aquaculture, along with the explosive growth of aquatic plants, have led to periodic declines in water quality and ecosystem instability. To address these issues, we conducted a systematic investigation of phytoplankton and zooplankton communities at 13 representative sampling sites in June 2024. By calculating the biodiversity indices, including the Shannon diversity index and evenness index, we comprehensively evaluated the reservoir’s ecological pollution status, analyzed the structural characteristics of the plankton communities, and identified key environmental drivers. This study aims to elucidate the relationships between plankton community structure and environmental factors, providing a scientific basis for safeguarding ecological security and enhancing the health management of water ecosystems in source-water reservoirs [15].

2. Materials and Methods

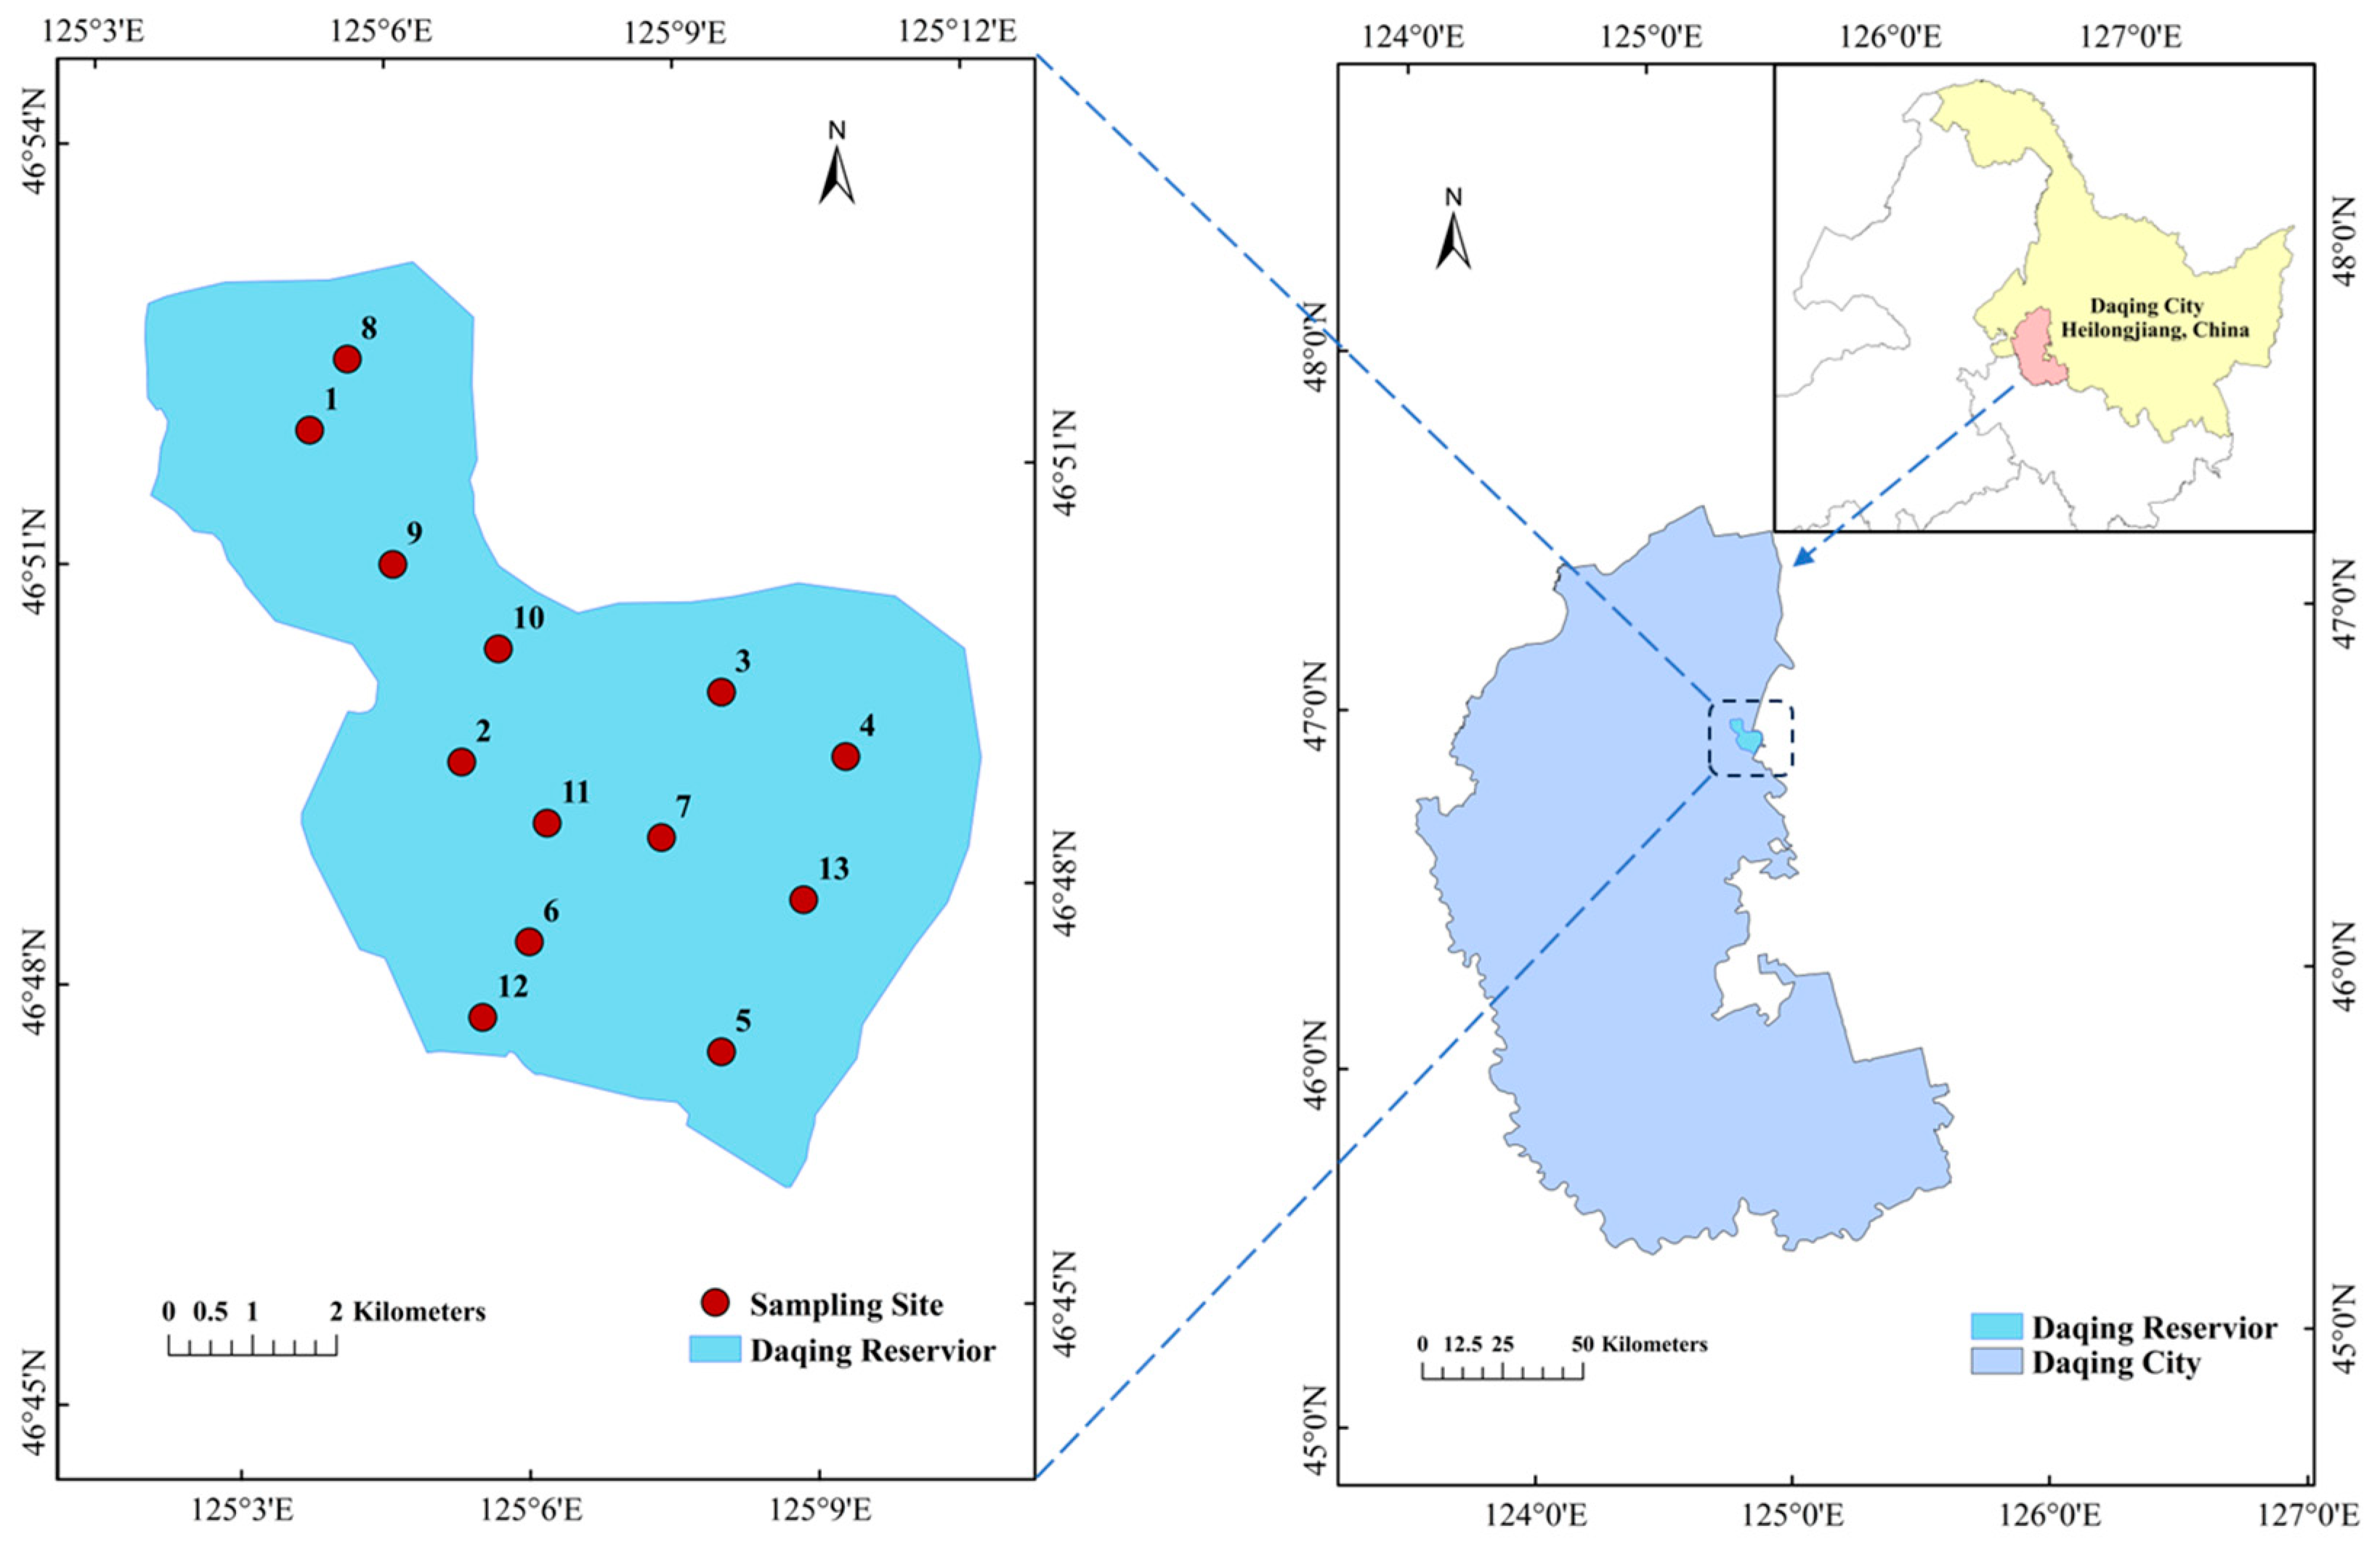
2.1. Sampling Point Setup

In accordance with the “Technical Guidelines for Investigation and Assessment of Lake Ecological Safety” and other pertinent technical documents, the number of sampling points was determined by considering the natural attributes of the lake, including surface area, morphology, and inflowing rivers. Existing conventional monitoring points may be appropriately increased. Based on the shape, water intake distribution, and bay area distribution of the Daqing Reservoir, the following formula was employed to calculate the number of sampling points:
N = INT(A1/2) + 2 + R
where A represents the surface area of the lake in km2. For complex water bodies characterized by riverine types, multiple bays, and inflows, R is defined as the sum of the number of river bends, the number of bays, and the number of inflowing rivers; for water bodies with regular shapes, R is 0. Based on the measured area of the Daqing Reservoir, which is 55.1 km2, a total of 13 sampling points were established for this ecological water survey, including 9 sampling points designated for fishery resource investigation, as illustrated in Figure 1.

2.2. Sample Collection and Analysis Methods

2.2.1. Water Sample Collection and Water Quality Indicator Measurement

Water samples were collected from each sampling point at a depth of 0.5 m, stored in glass bottles, and refrigerated at low temperatures. The samples were transported to the laboratory for analysis within 48 h. Previous studies have demonstrated that the concentrations of COD, nitrogen, and phosphorus in water bodies are critical environmental factors influencing zooplankton composition and density. Therefore, this study selected COD, TP, and NH3-N as key monitoring indicators. Following the methods described in reference [15], measurements of COD, NH3-N, and TP were conducted.

2.2.2. Phytoplankton Sample Collection

Quantitative sample preparation and identification of phytoplankton: At each sampling point, a composite water sample of 2 L was collected from both the surface (0.5 m) and bottom (0.5 m) layers, placed in a brown reagent bottle, and immediately fixed with 30 mL of Lugol’s solution. The samples were returned to the laboratory and allowed to settle for over 48 h. The supernatant was siphoned off until the volume of the phytoplankton sediment was approximately 20 mL. The sediment was transferred to a 30 mL graduated specimen bottle, rinsing the reagent bottle 1 to 3 times with some of the supernatant, which was then added to the specimen bottle to achieve a total volume of 30 mL. Labels were affixed to the specimen bottles for microscopy examination. During identification, the samples were thoroughly mixed, and 0.1 mL of the solution was pipetted into a counting chamber. A coverslip was placed over it, and under a microscope, the organisms were counted across the entire field of view, with each sample counted twice and averaging more than 30 fields of view for valid data [16,17].
Qualitative sample collection of phytoplankton: A 25 μm plankton net was utilized for qualitative sample collection of the phytoplankton. At the designated sampling points, the net was towed in a slow “∞” pattern at a depth of 0.5 m below the water surface, maintaining a speed of 20–30 cm per second for a minimum duration of 5 min. In larger water bodies, the plankton net was secured to the stern of a boat and towed slowly for at least 10 min. The identification method employed was consistent with the previously mentioned approach [18].
Quantitative sample preparation and identification of zooplankton at each sampling location: A composite water sample of 100 L was collected from both the surface (0.5 m) and bottom (0.5 m) layers using a Kemp plankton net. This sample was filtered through a 25 μm plankton net, and the concentrated sample was subsequently transferred to a 30 mL specimen bottle, fixed with 4% formalin. The samples were then transported to the laboratory for classification and enumeration under a microscope [19,20].
Qualitative Sample Collection of Zooplankton: For the qualitative collection of zooplankton, a 13 μm plankton net was employed, following the same methodology as that used for phytoplankton collection [21]. The identification method was consistent with the aforementioned approach.

2.3. Data Analysis

The species diversity index reflects the quantity of individuals of each species and their distribution. Commonly used species diversity indices include the Shannon−Wiener diversity index, Pielou evenness index, and Margalef species richness index.
H = i = 1 S p i log 2 p i
E = H H m a x
M = ( S 1 ) ln N
Y = n i / N × f i
where H represents the Shannon diversity index, S represents the total number of species in the sample, pi represents the ratio of the number of individuals of the i-th species (ni) or biomass (wi) to the total number of individuals (N) or total biomass (W), E represents the evenness index, Hmax represents the maximum value of the diversity index, and M represents the species richness index.
All statistical analyses and plotting of the data in this study were performed using Excel 2019 and Origin 2022. The sampling point distribution map was created using ArcGIS 10.2, and a correlation analysis of phytoplankton cell density and diversity indices with environmental factors was conducted using IBM SPSS Statistics 26. RDA analysis of the zooplankton community and environmental factors was performed using Origin 2022.

3. Results and Analysis

3.1. Reservoir Water Quality Characteristics

The primary water quality monitoring results of the Daqing Reservoir indicate that the concentrations of Chemical Oxygen Demand (COD), ammonia nitrogen, and total phosphorus (TP) ranged from 15.01 to 20.94 mg/L, 0.07 to 0.22 mg/L, and 0.02 to 0.03 mg/L, respectively (Table 1). Overall, the water quality of the Daqing Reservoir is relatively good, exhibiting minimal variations in water quality distribution across the various sampling points.

3.2. Phytoplankton Community Characteristics

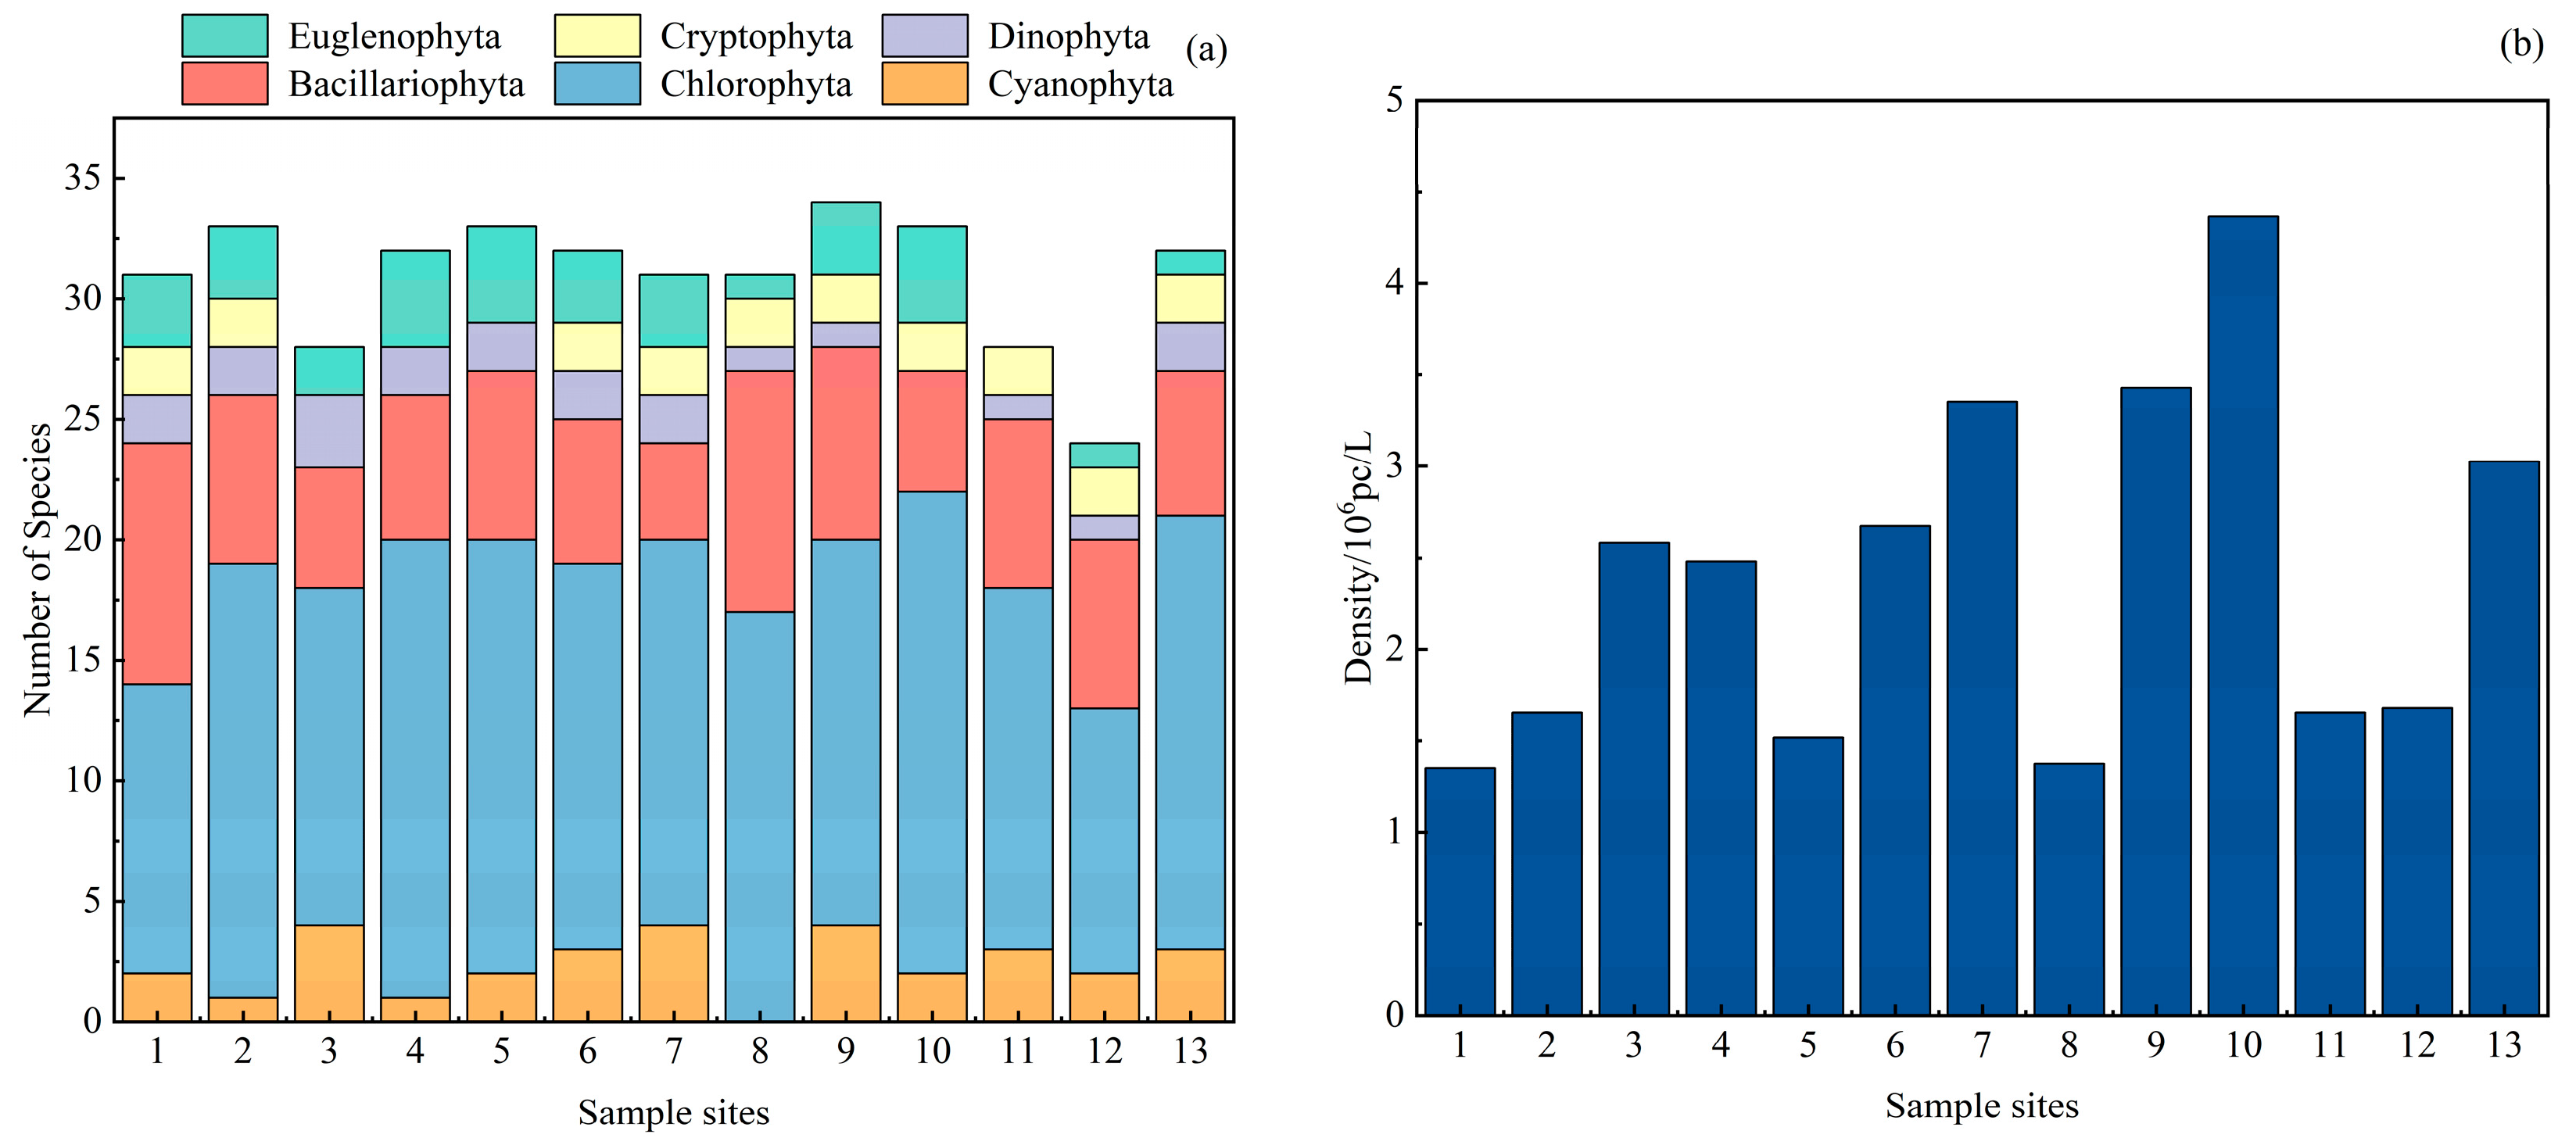
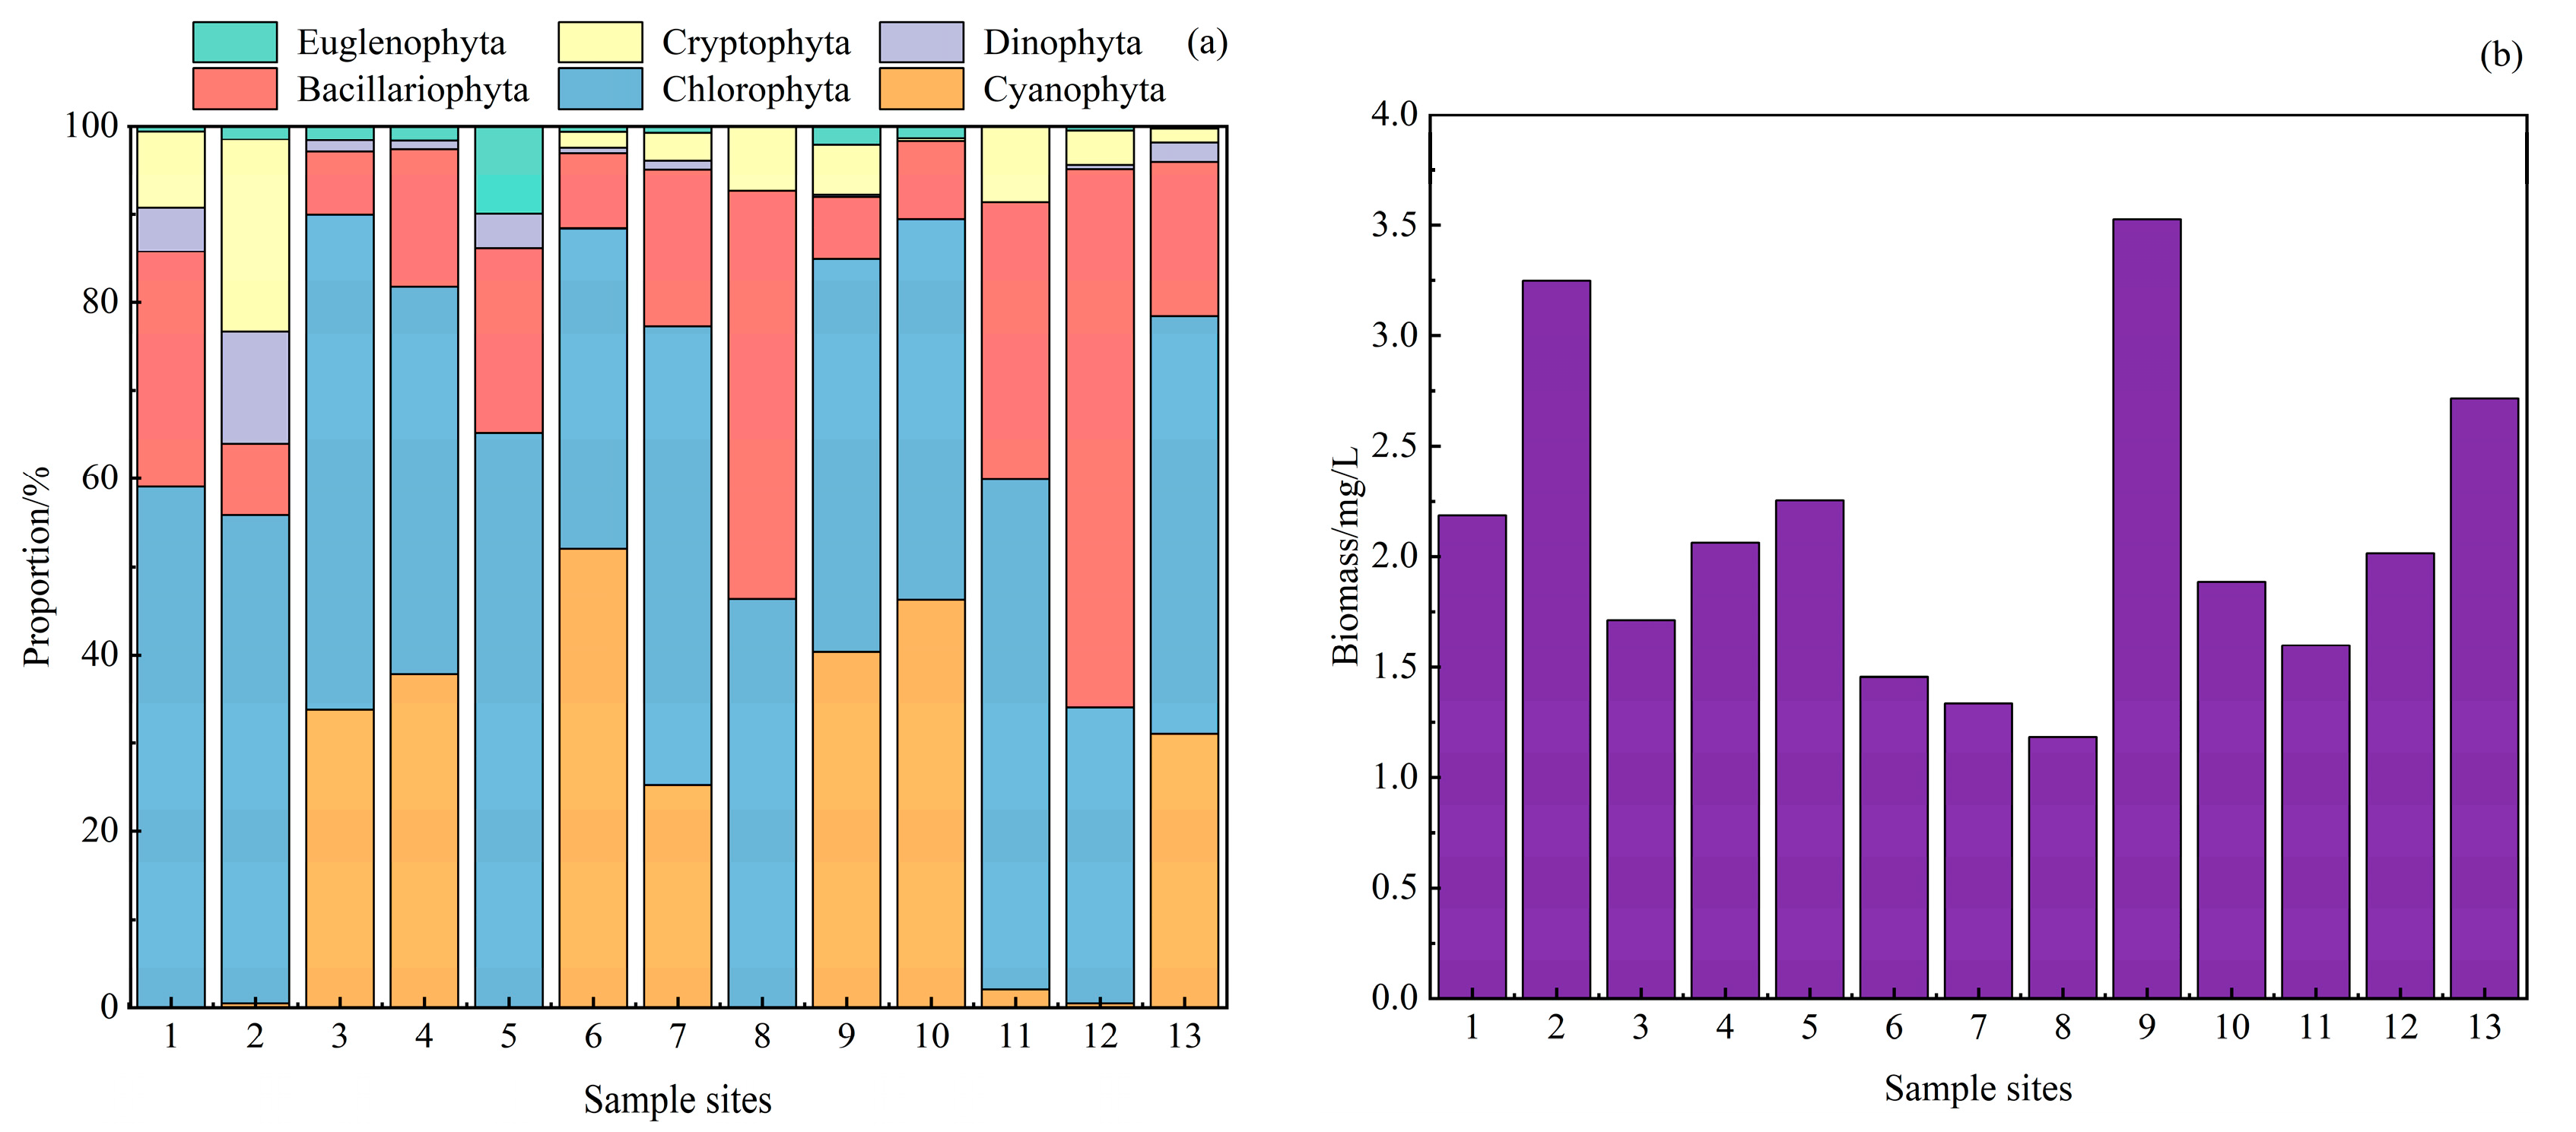
3.2.1. Phytoplankton Species Composition and Density

A total of 80 phytoplankton species from 6 phyla were identified at the sampling points (Table 2). Specifically, 8 species belonged to the phylum Cyanophyta, accounting for 10% of all species; 37 species were from Chlorophyta, making up 46.25%; 20 species were from Bacillariophyta, representing 25.00%; and 3 species each from Dinophyta and Cryptophyta, alongside 9 species from Euglenophyta, which accounted for 3.75%, 3.75%, and 11.25%, respectively.
Spatial heterogeneity in phytoplankton density was observed at various points in the Daqing Reservoir, as illustrated in Figure 2. Point 1 exhibited the lowest phytoplankton density at 1.35 × 10⁶ cells/L, while Point 10 recorded the highest density at 4.37 × 10⁶ cells/L. Overall, phytoplankton density in Daqing ranged from 1.35 × 10⁶ cells/L to 4.36 × 10⁶ cells/L, with an average density of 2.40 × 10⁶ cells/L. The density composition of various algal groups is depicted in Figure 3. The figure clearly indicates that Chlorophyta had the highest density, ranging from 33.51% to 65.19% of the total density across sampling points, with an average of 1.15 × 10⁶ cells/L. Cyanophyta accounted for 0–52.60% of the total density, with an average of 0.84 × 10⁶ cells/L. Other groups exhibited relatively low proportions. The range of phytoplankton biomass at various sampling points in the Daqing Reservoir was 1.184–3.529 mg/L, with an average of 2.09 mg/L. Point 9 had the highest biomass, while Point 8 recorded the lowest. The predominant contributor to phytoplankton biomass in the Daqing Reservoir was Bacillariophyta, accounting for 8.01–74.87% of the total biomass, with an average of 23.85%. Conversely, Cryptophyta constituted the smallest portion, accounting for 0–32.97%, with an average of 8.27%.

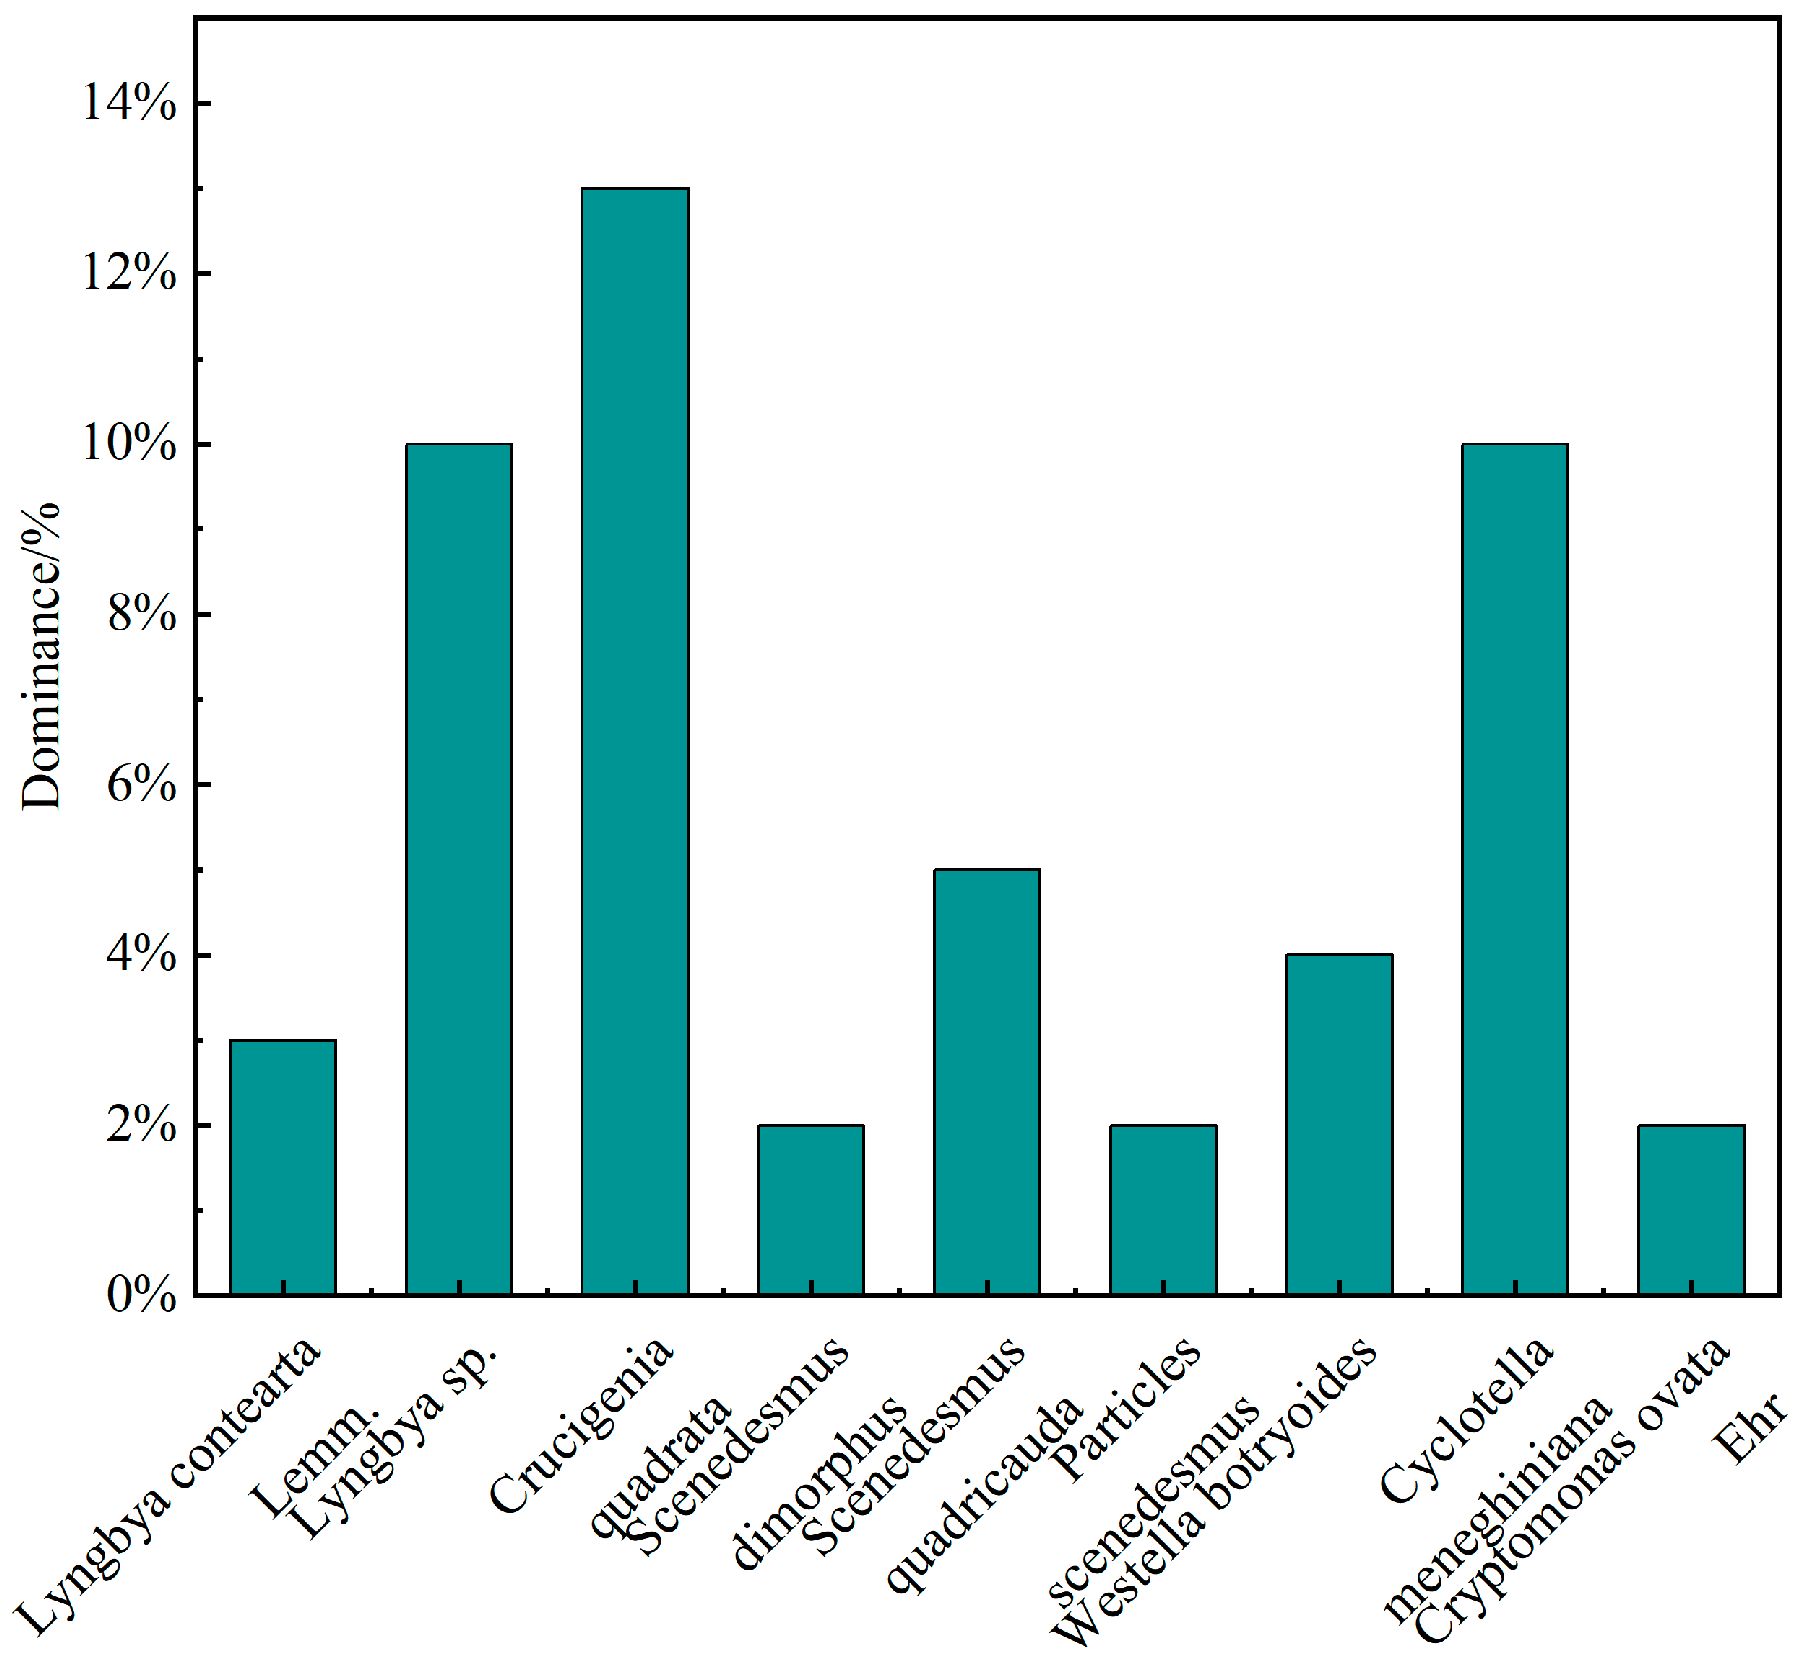
3.2.2. Phytoplankton Dominance and Diversity

Among the phytoplankton species in the Daqing Reservoir, Crucigenia quadrata exhibited the highest dominance at 13%, followed by Cyclotella meneghiniana and Lyngbya sp., both exhibiting a dominance of 10%. The dominance of other species was relatively low, as illustrated in Figure 4. The average number of species at various sampling points in the Daqing Reservoir was 31, with a maximum of 33 species and a minimum of 24 species observed. The average Shannon−Wiener diversity index was 3.68, with the highest recorded at Point 5 (4.21) and the lowest at Point 6 (3.07). The average richness index was 1.70, with the highest at Point 13 (2.01) and the lowest at Points 11 and 12 (1.47 each). The average evenness index was 0.79, with the highest at Point 1 (0.88) and the lowest at Point 6 (0.68). Details are shown in Table 2. The evaluation results of phytoplankton diversity indices suggest that both the Shannon−Wiener diversity index and evenness index generally indicate a low-pollution type, while the richness index typically suggests a moderate-pollution type.

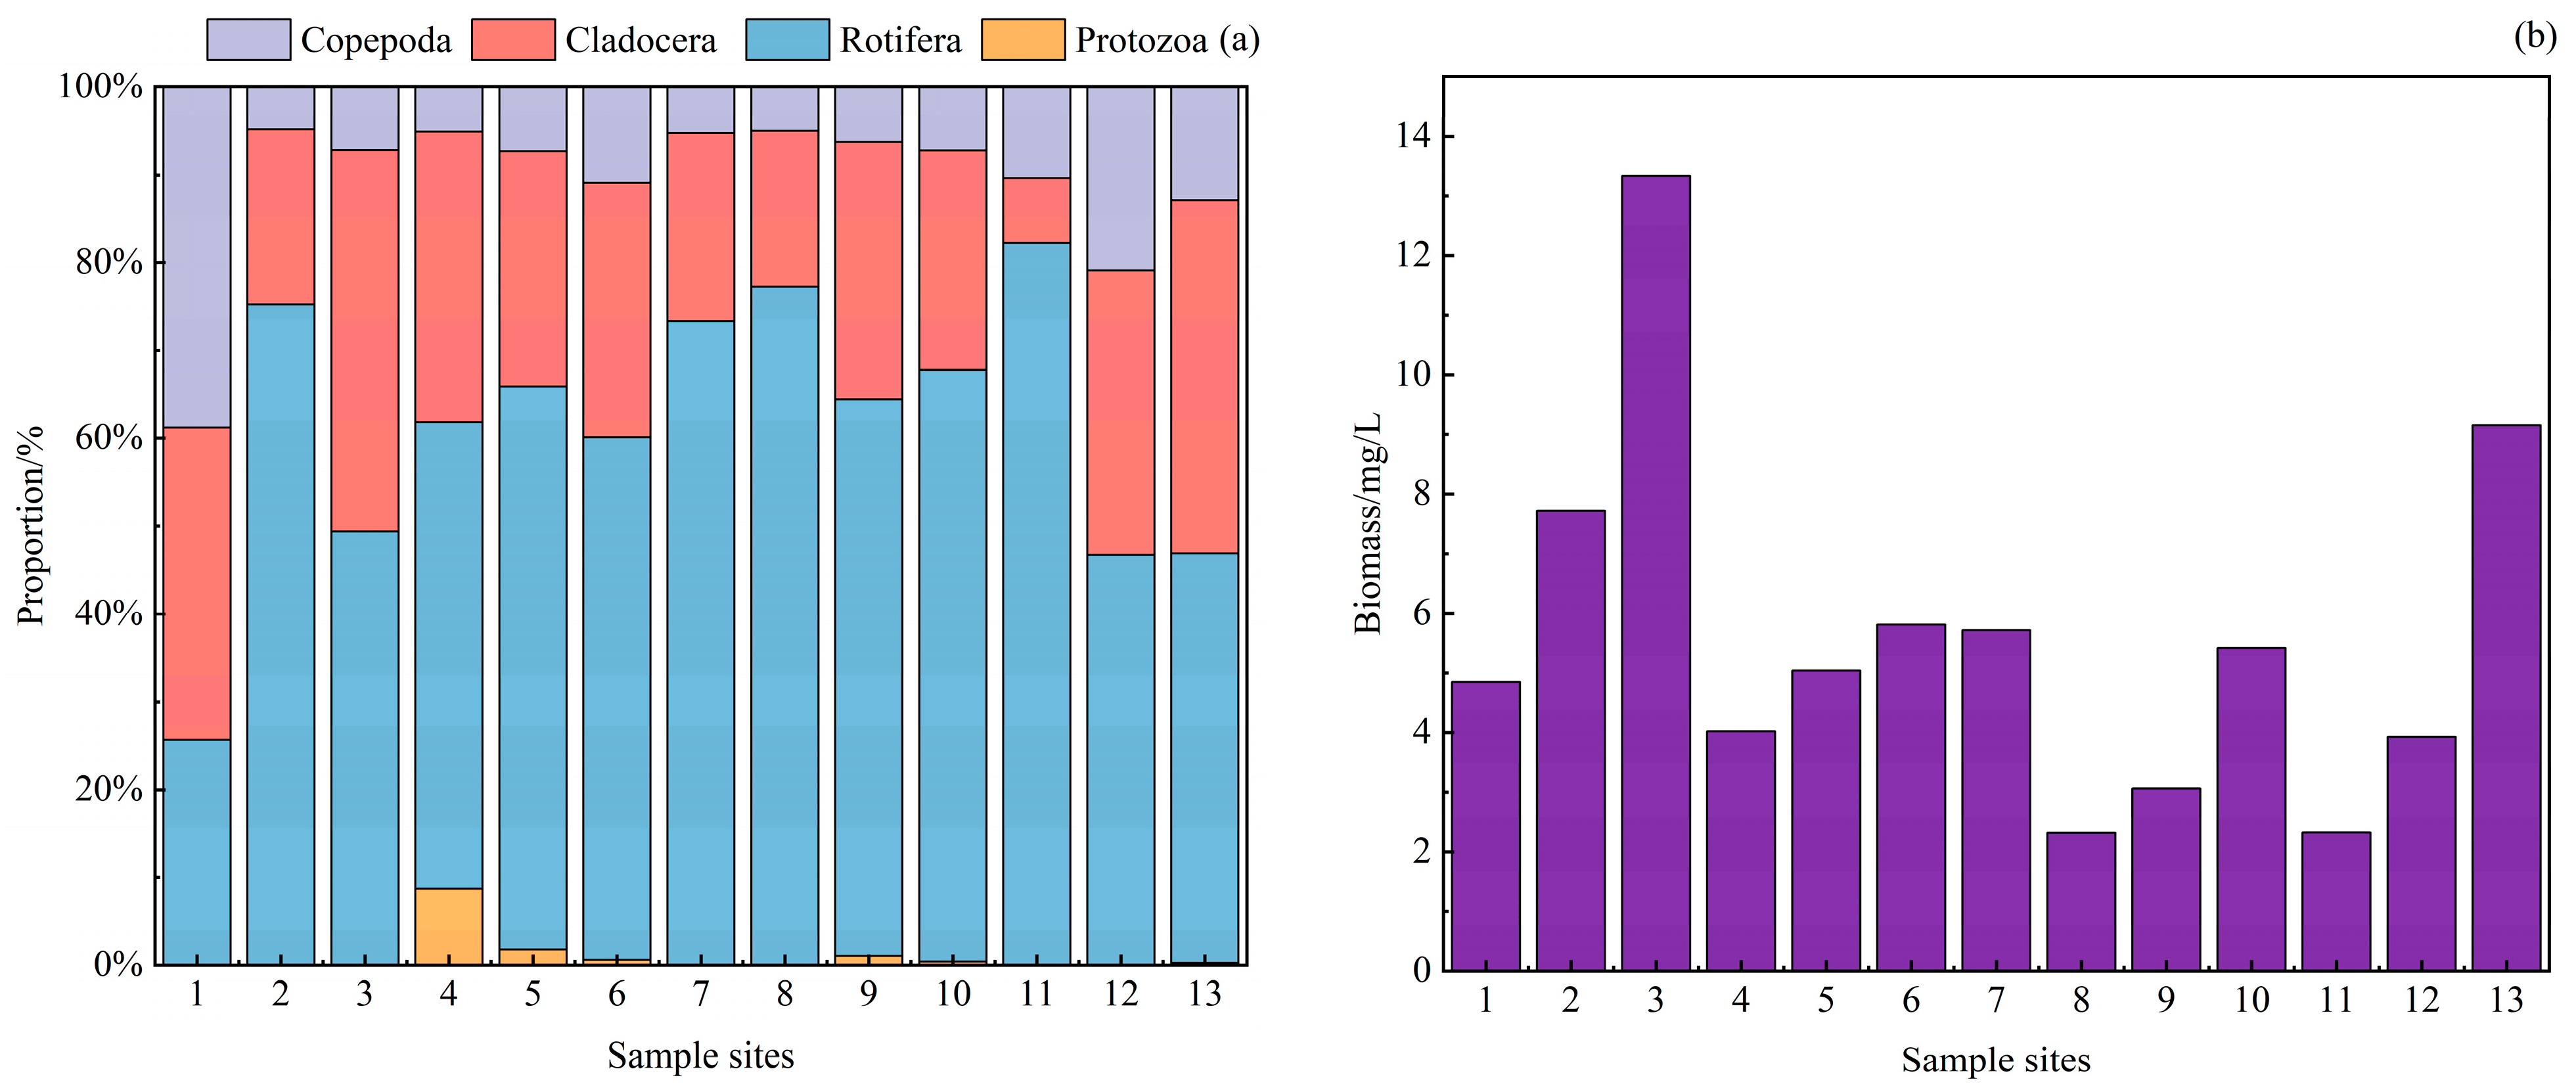
3.3. Zooplankton Community Characteristics

3.3.1. Zooplankton Species Composition and Density

Four distinct zooplankton groups were identified: Protozoa (6 species), Rotifera (28 species), Cladocera (5 species), and Copepoda (13 species). Notably, copepods and rotifers were the most abundant groups. Detailed results are presented in Table 3 and Figure 5. The zooplankton density varied between 101.33 and 344.00 ind./L, with an average of 232.87 ind./L. Rotifers dominated this density with a count of 1895.33 ind./L, while Protozoa exhibited the lowest density at 26 ind./L. Biomass also showed significant variation across sampling sites, peaking at Site 3 (13.34 mg/L) and reaching a minimum at Site 8 (2.32 mg/L). Among the zooplankton groups, Copepoda contributed the highest average biomass (2.51 mg/L), whereas Protozoa contributed the lowest (0.00018 mg/L), as shown in Figure 6.

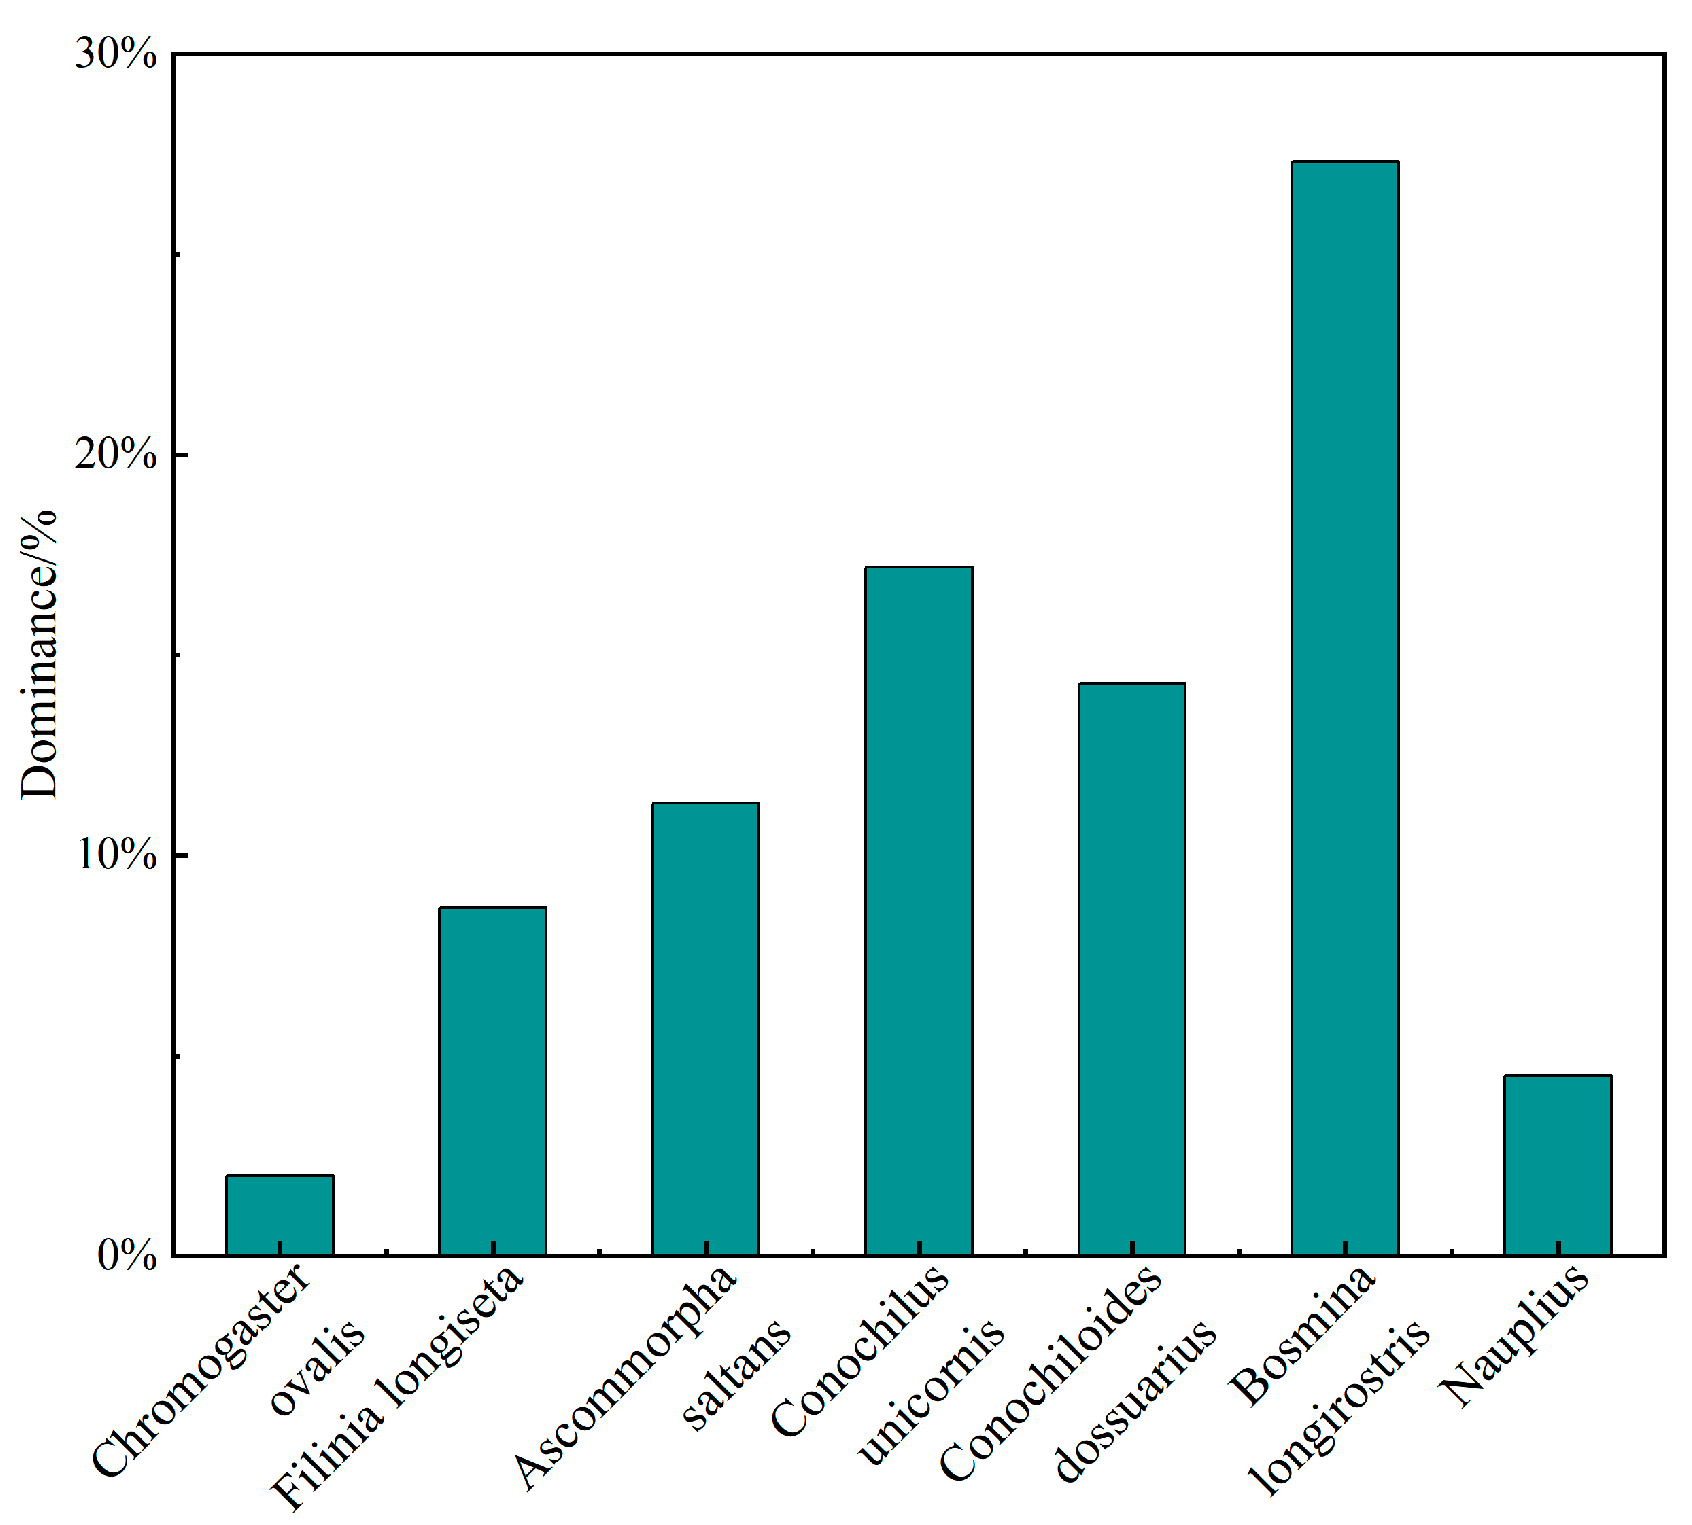
3.3.2. Zooplankton Dominance and Diversity

The species exhibiting the highest dominance was Bosmina longirostris, which constituted 27.3% of the total zooplankton density. Other notable species included Conochilus unicornis and Conochiloides dossuarius, with dominances of 17.2% and 14.3%, as shown in Figure 7. The average Shannon−Wiener diversity index for zooplankton was calculated to be 2.13, with Point 10 demonstrating the highest diversity index (2.67) and Point 1 the lowest (1.65). The average richness index was 0.75, with Point 10 again showing the highest value (1.12) and Point 1 the lowest (0.42). Furthermore, the average evenness index was recorded at 0.63, indicating a relatively even distribution of species across the sampling points.

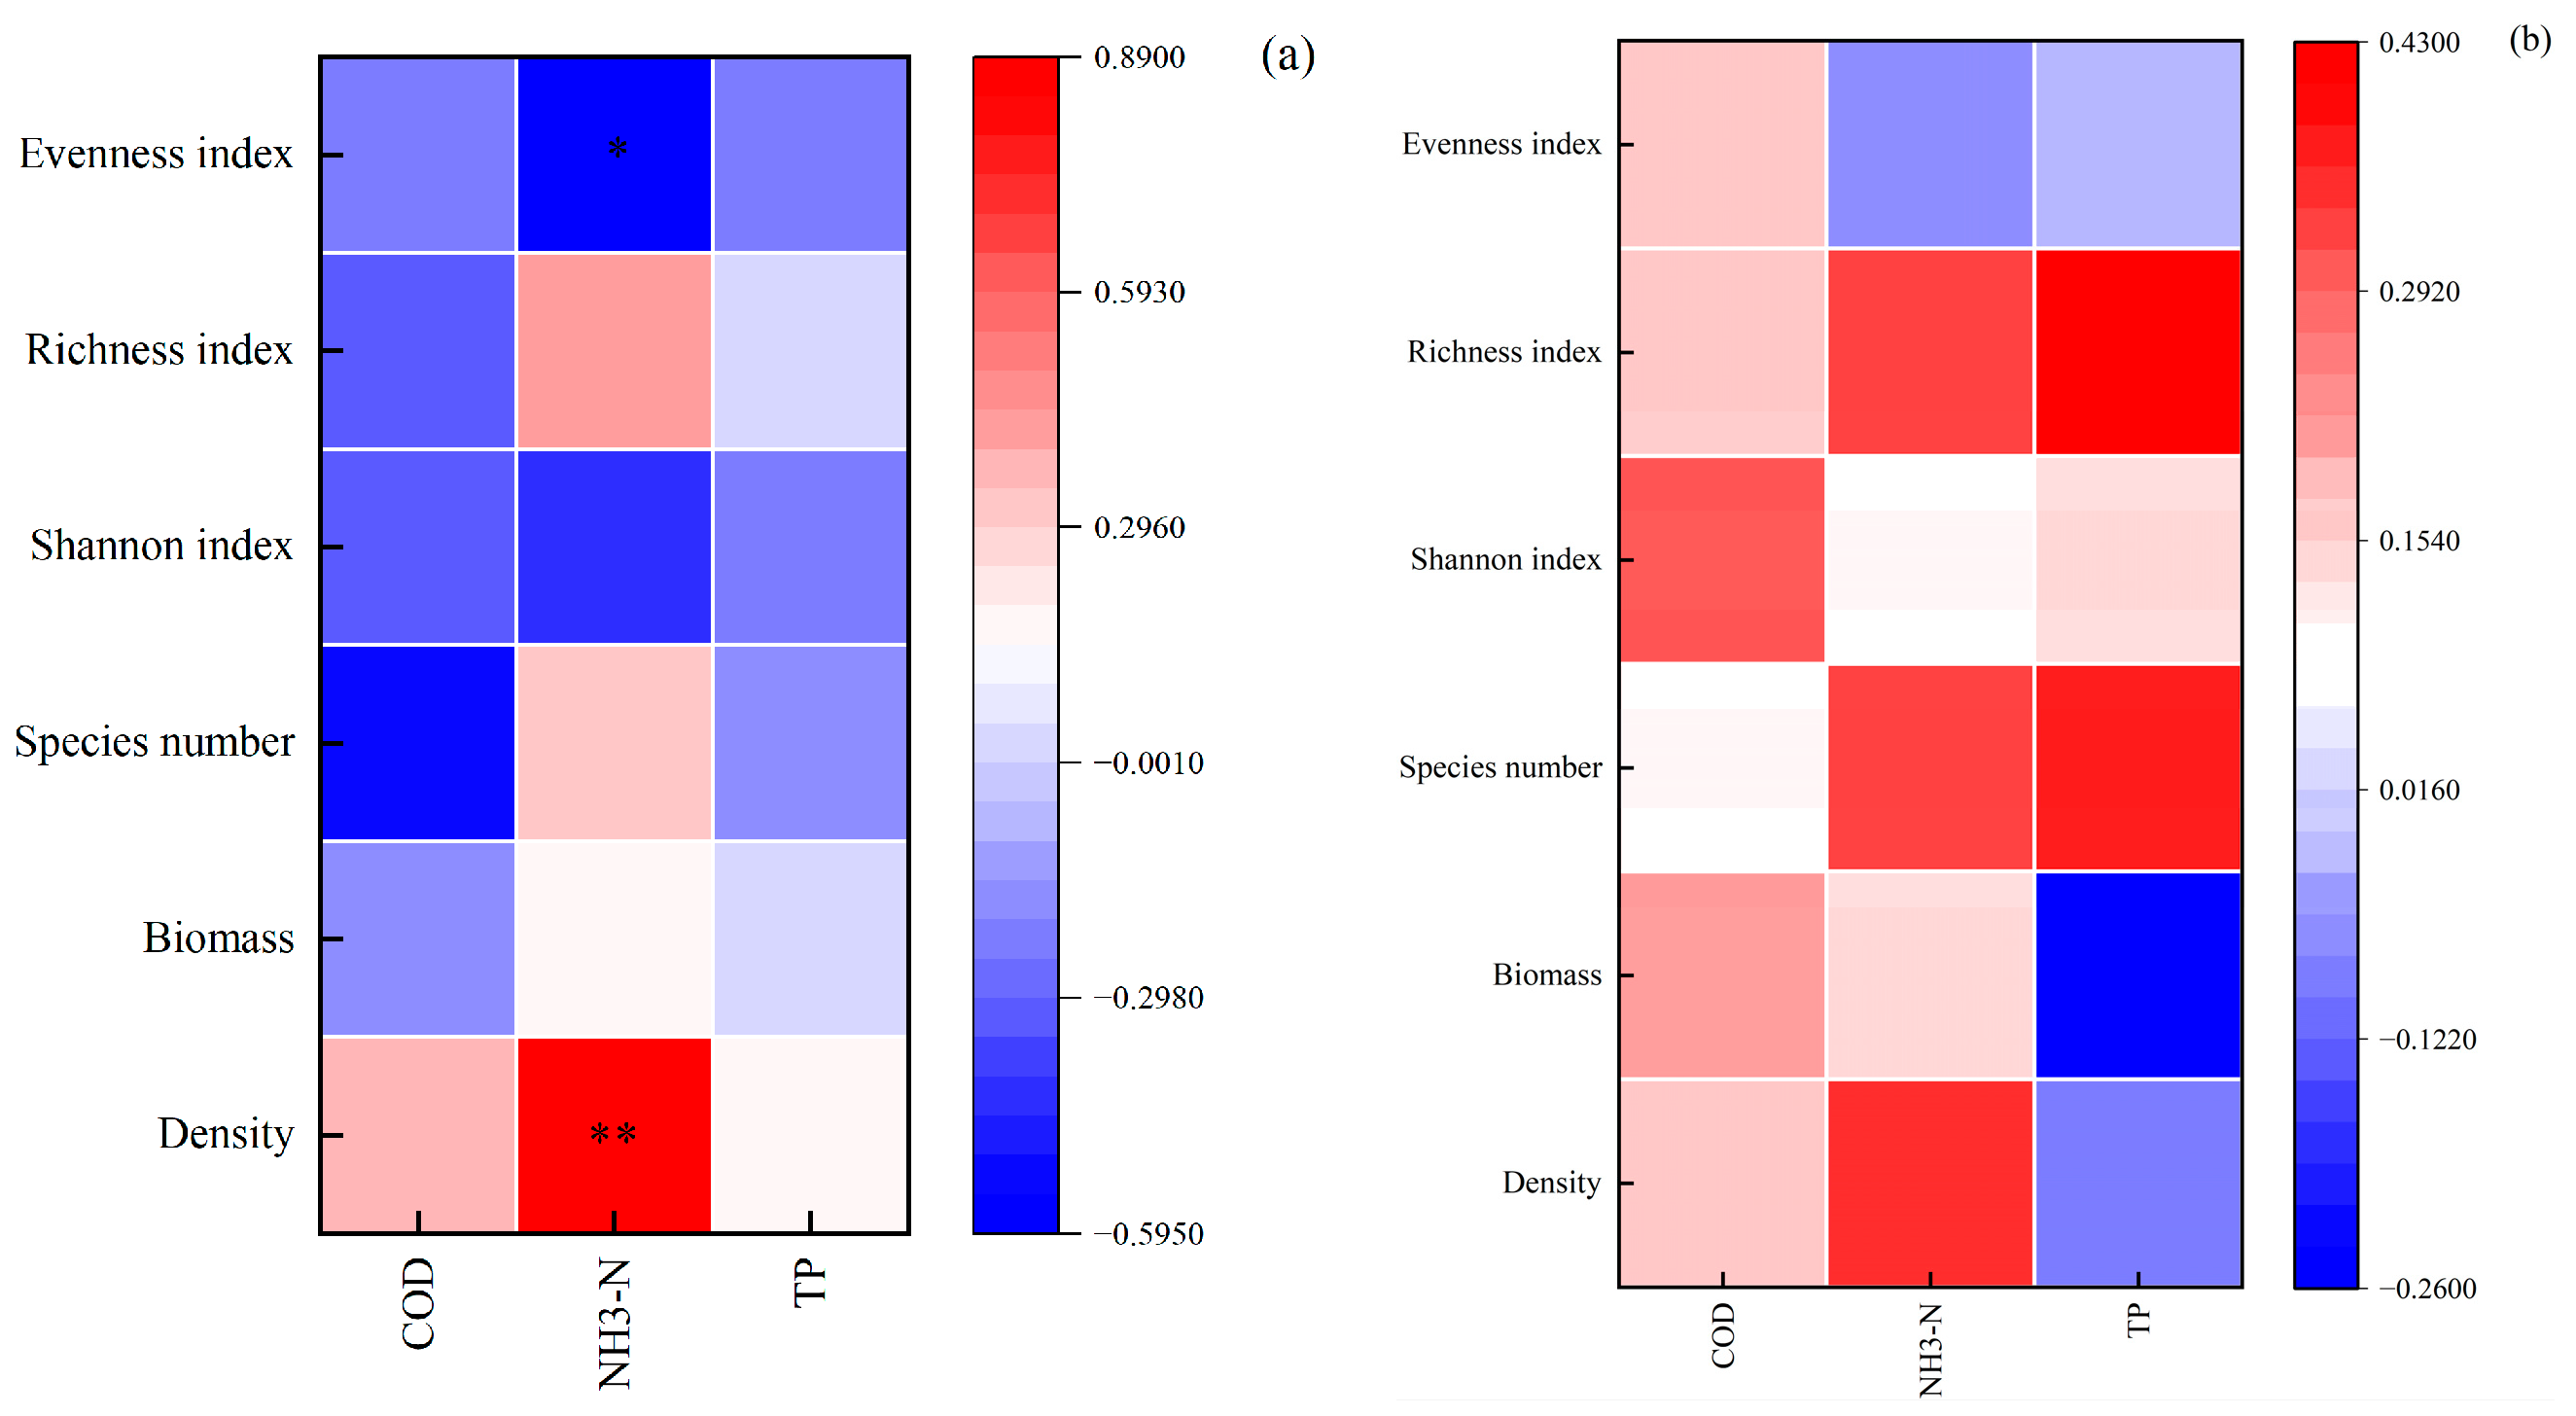
3.4. Relationship Between Plankton and Environmental Factors

Based on the results of RDA concerning phytoplankton density and physicochemical factors in the Daqing Reservoir, it is recommended that RDA be employed to investigate the relationship between phytoplankton community structure and environmental factors. The explanatory rates for axis 1 and axis 2 are 34.59% and 6.87%, respectively. The dominant species on the positive side of the first axis include Cyanophyta, Chlorophyta, Cryptophyta, and Euglenophyta, while the dominant species on the negative side comprise Bacillariophyta (diatoms) and Dinophyta (dinoflagellates). The COD exhibits a positive correlation with Cryptophyta, Cyanophyta, Bacillariophyta, and Chlorophyta. The NH3-N is positively correlated with Cyanophyta, Chlorophyta, Cryptophyta, and Euglenophyta, whereas TP shows a positive correlation with Bacillariophyta, Cryptophyta, and Cyanophyta.
Similarly, the redundancy analysis results for zooplankton density and physicochemical factors in the Daqing Reservoir suggest the use of RDA to explore the relationship between zooplankton community structure and environmental factors. The explanatory rates for axis 1 and axis 2 are 8.14% and 2.74%, respectively. As illustrated in Figure 8, the dominant species on the positive side of the first axis include Cladocera, Rotifera, and Copepoda, while the dominant species on the negative side consist of Protozoa. Rotifers and Cladocera in zooplankton exhibit a positive correlation with COD and NH3-N; conversely, Protozoa demonstrate a negative correlation with both COD and NH3-N.
Pearson correlation analysis was performed to assess the relationships between the diversity indices of phytoplankton and zooplankton and environmental factors, with the results presented in Figure 9. The analysis reveals that NH3-N has a highly significant positive correlation with phytoplankton density and a negative correlation with the evenness index of phytoplankton. However, the correlation between environmental factors and zooplankton remains less clear.

4. Discussion

4.1. Analysis of Plankton Community Structure Characteristics

The phytoplankton community composition in the Daqing Reservoir is predominantly characterized by Chlorophyta, Bacillariophyta, and Euglenophyta. This composition aligns with findings from eutrophic water bodies such as the Danjiangkou Reservoir and reflects typical eutrophication features observed in lakes and reservoirs [21,22]. During the survey conducted in June 2024, a total of 80 phytoplankton species were identified in the Daqing Reservoir, with an average density of 2.40 × 10⁶ cells/L. The dominant group was Bacillariophyta, accounting for 26% of the total, with Crucigenia quadrata exhibiting the highest dominance at 13%. Studies indicate that diatoms are predominant in oligotrophic waters, while Chlorophyta thrive in mesotrophic conditions, and Cyanobacteria prevail in eutrophic environments [23]. Consequently, the relatively low nutrient content in the Daqing Reservoir may elucidate the dominance of diatoms. Furthermore, different algal groups exhibit varying degrees of environmental adaptability. According to the PEG model, phytoplankton succession adheres to seasonal patterns: cryptophytes and diatoms dominate in winter and spring, Chlorophyta in summer, and Cyanobacteria in late summer to early autumn, with diatoms regaining dominance in autumn [24]. Given that Daqing is situated in the frigid southwestern region of Heilongjiang Province, it experiences prolonged winters and shorter spring, summer, and autumn seasons, which facilitates the sustained dominance of diatoms within the phytoplankton community.
In zooplankton density composition, rotifers and cladocerans were predominant, while protozoans were less abundant. These findings align with surveys conducted in other water bodies, such as Huizhou West Lake, Zhejiang drinking water sources, and Dianshan Lake [25,26,27]. This pattern may arise because rotifers, compared to cladocerans and copepods, possess smaller body sizes, undergo faster development, have shorter life cycles, and can rapidly occupy ecological niches, granting them competitive advantages [28]. Furthermore, fish predation contributes to the high density of small rotifers, as the size-efficiency hypothesis suggests that fish preferentially prey on larger, more visible zooplankton under similar predation pressures [29]. Although the Daqing Reservoir serves as a drinking water source, illegal fishing and the proliferation of Potamogeton crispus during the summer have recently degraded water quality, threatening the safety of the water supply. The zooplankton in the reservoir primarily consist of copepods and rotifers, with fewer protozoans and cladocerans. Environmental authorities should enhance the monitoring of zooplankton communities to safeguard aquatic ecological health.

4.2. Analysis of Environmental Influencing Factors on Plankton Communities

Previous studies [30,31] have identified temperature, nutrients, and pH as critical environmental factors affecting plankton, which is consistent with the findings of this research. RDA of phytoplankton density and Pearson correlation analysis of phytoplankton diversity revealed that COD, NH3-N, and TP significantly influence phytoplankton distribution. In reservoirs, nitrogen and phosphorus concentrations are key indicators of eutrophication and serve as essential substrates for phytoplankton growth. The dominance of diatoms in the Daqing Reservoir showed positive correlations with COD and TP, suggesting that these factors drive phytoplankton community dynamics. However, the negative correlation between NH3-N and diatoms aligns with findings from Qiandao Lake [32] and Dianchi Lake [20], potentially due to rapid nitrogen depletion caused by proliferating diatom populations [33].
The RDA results indicated that rotifers, the dominant zooplankton, correlated positively with COD and NH3-N, but exhibited a weak correlation with TP. This may reflect indirect effects: TP influences phytoplankton growth, which subsequently affects zooplankton, creating non-linear relationships between zooplankton density and TP. Additionally, rotifers demonstrate strong adaptability to NH3-N [34], and their small size and short life cycles enable them to dominate in both density and biomass [35]. The RDA and Pearson analyses suggest that environmental factors alone do not fully explain plankton distribution, implying the presence of additional influences such as Nenjiang River water diversion [36], fish predation, water temperature, pH, and precipitation. To unravel the mechanisms driving plankton community dynamics, future studies should adopt large-scale spatiotemporal approaches and investigate both intrinsic drivers and external environmental pressures [37,38].

5. Conclusions

(1) The June 2024 survey identified a total of 80 phytoplankton species across 6 phyla in the Daqing Reservoir. Chlorophyta exhibited the highest diversity, followed by Bacillariophyta, while Pyrrophyta, Cryptophyta, and Euglenophyta demonstrated lower species counts. The zooplankton community comprised 52 species from 4 phyla, with Rotifera being the most abundant, followed by Copepoda. Protozoa and Cladocera showed lower diversity. (2) The phytoplankton community exhibited a Shannon diversity index ranging from 3.07 to 4.21, a richness index of 1.47 to 2.01, and an evenness index of 0.68 to 0.89, collectively indicating oligosaprobic or clean water conditions. In contrast, the zooplankton community displayed a Shannon diversity index of 1.40 to 3.08, a richness index of 2.21 to 3.34, and an evenness index of 0.33 to 0.79, reflecting mesosaprobic to oligosaprobic conditions. (3) The RDA revealed that the distributions of phytoplankton and zooplankton were significantly influenced by COD, NH3-N, and TP. Bacillariophyta and Rotifera exhibited complex interactions with environmental factors.

Author Contributions

Conceptualization, J.M.; Methodology, L.Y.; Formal analysis, Z.L.; Investigation, M.B.; Writing—original draft, F.H.; Writing—review & editing, G.B.; Funding acquisition, W.L. All authors have read and agreed to the published version of the manuscript.

Funding

This work was supported by the Project of Ecological and Environmental Protection Integration Research Institute in Yangtze River Delta (no. ZX2022QT046) and the Special Basic Research Service for the Central Level Public Welfare Research Institute (no. GYZX240413).

Data Availability Statement

Data are contained within the article.

Conflicts of Interest

Authors Zheng Li and Minggang Bai are employed by the Ecological Environment Management Company. The remaining authors declare that the research was conducted in the absence of any commercial or financial relationships that could be construed as a potential conflict of interest.

References

  1. Amorim, C.A.; Moura, A.D.N. Ecological impacts of freshwater algal blooms on water quality, plankton biodiversity, structure, and ecosystem functioning. Sci. Total Environ. 2021, 758, 143605. [Google Scholar] [CrossRef] [PubMed]
  2. Wang, C.; Li, E.; Zhang, L.; Wei, H.; Zhang, L.; Wang, Z. Long-term succession characteristics and driving factors of zooplankton communities in a typical subtropical shallow lake, central China. Environ. Sci. Pollut. Res. 2023, 30, 49435–49449. [Google Scholar] [CrossRef] [PubMed]
  3. Yuan, Y.; Zeng, G.; Liang, J.; Huang, L.; Hua, S.; Li, F.; Zhu, Y.; Wu, H.; Liu, J.; He, X.; et al. Variation of water level in Dong-ting Lake over a 50-year period: Implications for the impacts of anthropogenic and climatic factors. J. Hydrol. 2015, 525, 450–456. [Google Scholar] [CrossRef]
  4. Yang, Y.X.; Du, C.Y.; Qian, Z.; Jiang, C.B.; Chen, H.; Yu, G.L.; Li, Y.J. Phytoplankton community structure and its influencing factors in Nanhan polder area of Dongting Lake. Res. Environ. Sci. 2020, 33, 147–154. [Google Scholar]
  5. Wang, R.; Wang, J.; Chen, W. The coordinated development of ecosystem services and farming household livelihood security: A case study of the dongting lake area in China. Sustainability 2023, 15, 11121. [Google Scholar] [CrossRef]
  6. Liu, X.; Qian, K.; Chen, Y.; Gao, J. A comparison of factors influencing the summer phytoplankton biomass in China’s three largest freshwater lakes: Poyang, Dongting, and Taihu. Hydrobiologia 2017, 792, 283–302. [Google Scholar] [CrossRef]
  7. Wang, C.M.; Wu, K.; Zhang, Y.; Huang, D.; Tian, Q. The analysis of spatial and temporal variations characteristics and driving factors of phytoplankton in Dongting Lake. Freshw. Fish. 2018, 48, 52–57. [Google Scholar]
  8. Wang, M.Q.; Wang, J.C.; Wang, Q.; Yang, C.Y.; Zou, Z.H.; Qian, B. Characteristics of plankton community structure and eutrophication status in Dongting Lake in the season with normal water level. Chin. J. Ecol. 2018, 37, 2418–2429. [Google Scholar]
  9. Tian, Y.; Jiang, Y.; Liu, Q.; Xu, D.; Liu, Y.; Song, J. The impacts of local and regional factors on the phytoplankton community dynamics in a temperate river, northern China. Ecol. Indic. 2018, 123, 107352. [Google Scholar] [CrossRef]
  10. Yan, G.; Yin, X.; Wang, X.; Wang, L.; Li, Y.; Li, H.; Chen, W. Effects of environmental factors on the composition of phytoplankton community in Sankou of the Yangtze River and the Western Dongting Lake. China Environ. Sci. 2019, 39, 2532–2540. [Google Scholar]
  11. Richter, D.J.; Watteaux, R.; Vannier, T.; Leconte, J.; Frémont, P.; Reygondeau, G.; Maillet, N.; Henry, N.; Benoit, G.; Da Silva, O.; et al. Genomic evidence for global ocean plankton biogeography shaped by large-scale current systems. eLife 2022, 11, e78129. [Google Scholar] [CrossRef] [PubMed]
  12. Yuan, H.; Xiao, Y.; Xie, Y.; Luo, H.; Liu, J.; Xu, J.; Wu, X.; Chen, D.; Niu, Y. Structural characteristics of plankton community in Dongting Lake and its relationship with water environmental factors. Sci. Rep. 2024, 14, 28189. [Google Scholar] [CrossRef] [PubMed]
  13. Shaikh, S.M.S.; Tagde, J.P.; Singh, P.R.; Dutta, S.; Sangolkar, L.N.; Kumar, M.S. Impact of Port and harbour activities on plankton distribution and dynamics: A multivariate approach. Mar. Pollut. Bull. 2021, 165, 112105. [Google Scholar] [CrossRef] [PubMed]
  14. Geng, Y.; Li, M.; Yu, R.; Sun, H.; Zhang, L.; Sun, L.; Lv, C.; Xu, J. Response of planktonic diversity and stability to environmental drivers in a shallow eutrophic lake. Ecol. Indic. 2022, 144, 109560. [Google Scholar] [CrossRef]
  15. Kim, H.; Kwak, I. Evaluating the necessity of geographical locality for patterning biological integrity and its responses to multiple stressors in river systems. Ecol. Indic. 2022, 142, 109285. [Google Scholar] [CrossRef]
  16. McQuatters-Gollop, A.; Stern, R.F.; Atkinson, A.; Best, M.; Bresnan, E.; Creach, V.; Devlin, M.; Holland, M.; Ostle, C.; Schmidt, K.; et al. The silent majority: Pico- and nanoplankton as ecosystem health indicators for marine policy. Ecol. Indic. 2024, 159, 111650. [Google Scholar] [CrossRef]
  17. Hering, D.; Borja, A.; Jones, J.; Pont, D.; Boets, P.; Bouchez, A.; Bruce, K.; Drakare, S.; Hänfling, B.; Kahlert, M.; et al. Implementation options for DNA-based identification into ecological status assessment under the European Water Framework Directive. Water Res. 2018, 138, 192–205. [Google Scholar] [CrossRef]
  18. Rock, L.A.; Collins, S.M.A. Broad-Scale Look at Nutrient Limitation and a Shift toward Co-limitation in United States Lakes. Environ. Sci. Technol. ES&T 2024, 58, 11482–11491. [Google Scholar]
  19. Zhao, W.; Dai, L.; Chen, X.; Wu, Y.; Sun, Y.; Zhu, L. Characteristics of zooplankton community structure and its relationship with environmental factors in the South Yellow Sea. Mar. Pollut. Bull. 2022, 176, 113471. [Google Scholar] [CrossRef]
  20. Wan, Y.; Huang, G.; Du, H.; Yang, S.; Yang, W.; Li, W. Effects of waterway regulation structures on the planktonic community in the upper Yangtze River. Ecol. Indic. 2023, 155, 111049. [Google Scholar] [CrossRef]
  21. Zhao, Z.; Li, H.; Sun, Y.; Yang, Q.; Fan, J. Contrasting the assembly of phytoplankton and zooplankton communities in a polluted semi-closed sea: Effects of marine compartments and environmental selection. Environ. Pollut. 2021, 285, 117256. [Google Scholar] [CrossRef] [PubMed]
  22. Ye, S.; Wen, L.; Gao, L.; Zhang, J.; Zhang, H.; Yang, S.; Hu, E.; Deng, J.; Xiao, M.; Zamyadi, A.; et al. Exploring intrinsic distribution of phytoplankton relative abundance and biomass in combination with continental-scale field investigation and microcosm experiment. Water Res. 2023, 248, 120853. [Google Scholar] [CrossRef]
  23. Wei, Q.; Xu, Y.; Ruan, A. Spatial and temporal patterns of phytoplankton community succession and characteristics of realized niches in Lake Taihu, China. Environ. Res. 2024, 243, 117896. [Google Scholar] [CrossRef]
  24. Park, H.; Shabarova, T.; Salcher, M.M.; Kosová, L.; Rychtecký, P.; Mukherjee, I.; Šimek, K.; Porcal, P.; Seďa, J.; Znachor, P.; et al. In the right place, at the right time: The integration of bacteria into the Plankton Ecology Group model. Microbiome 2023, 11, 112. [Google Scholar] [CrossRef] [PubMed]
  25. Lewis, C.L.; Granek, E.F. Drivers of zooplankton community composition in a novel ecosystem: Hawai’i mangroves as a case study. J. Appl. Ecol. 2021, 58, 3023–3035. [Google Scholar] [CrossRef]
  26. Li, Z.; Gao, Y.; Wang, S.; Lu, Y.; Sun, K.; Jia, J.; Wang, Y. Phytoplankton community response to nutrients along lake salinity and altitude gradients on the Qinghai-Tibet Plateau. Ecol. Indic. 2021, 128, 107848. [Google Scholar] [CrossRef]
  27. Hu, M.; Zhu, Y.; Hu, X.; Zhu, B.; Lyu, S.; Wang, G. Assembly mechanism and stability of zooplankton communities affected by China’s south-to-north water diversion project. J. Environ. Manag. 2024, 365, 121497. [Google Scholar] [CrossRef]
  28. Zhang, Q.; Cai, Y.; Yuan, Q.; Yang, J.; Dong, R.; Gong, Z.; Datry, T.; Qin, B. Hydrological conditions determine the assembly processes of zooplankton in the largest Yangtze River-connected Lake in China. J. Hydrol. 2024, 645, 132252. [Google Scholar] [CrossRef]
  29. Cicala, F.; Arteaga, M.C.; Herzka, S.Z.; Hereu, C.M.; Jimenez-Rosenberg, S.P.; Saavedra-Flores, A.; Robles-Flores, J.; Gomez, R.; Batta-Lona, P.G.; Galindo-Sánchez, C.E. Environmental conditions drive zooplankton community structure in the epipelagic oceanic water of the southern Gulf of Mexico: A molecular approach. Mol. Ecol. 2022, 31, 546–561. [Google Scholar] [CrossRef]
  30. Bergström, A.; Creed, I.F.; Paltsev, A.; De Wit, H.A.; Lau, D.C.P.; Drakare, S.; Vrede, T.; Isles, P.D.F.; Jonsson, A.; Geibrink, E.; et al. Declining calcium concentration drives shifts toward smaller and less nutritious zooplankton in northern lakes. Glob. Change Biol. 2024, 30, e17220. [Google Scholar] [CrossRef]
  31. Liu, Y.; Li, C.; Jian, S.; Miao, S.; Li, K.; Guan, H.; Mao, Y.; Wang, Z.; Li, C. Hydrodynamics regulate longitudinal plankton community structure in an alpine cascade reservoir system. Front. Microbiol. 2021, 12, 749888. [Google Scholar] [CrossRef] [PubMed]
  32. Goździejewska, A.M.; Cymes, I.; Glińska-Lewczuk, K. Zooplankton functional diversity as a bioindicator of freshwater ecosystem health across land use gradient. Sci. Rep. 2024, 14, 18456. [Google Scholar] [CrossRef] [PubMed]
  33. Wei, Y.; Ding, D.; Gu, T.; Jiang, T.; Qu, K.; Sun, J.; Cui, Z. Different responses of phytoplankton and zooplankton communities to current changing coastal environments. Environ. Res. 2022, 215, 114426. [Google Scholar] [CrossRef]
  34. Hao, L.; Zhang, Y.; Shen, Y.; Liu, Y.; Gao, H.; Guo, P. Driving mechanism of land use and landscape pattern to phytoplankton and zooplankton community and their trophic interactions in river ecosystems. J. Environ. Manag. 2024, 370, 122691. [Google Scholar] [CrossRef]
  35. Choo, S.; Kwak, M.T.; Cho, Y.K.; Yoon, Y.H.; Soh, H.Y. Effects of water masses on the zooplankton community structure in the northern East China Sea during the East Asian Summer Monsoon in 2020. Ecol. Indic. 2023, 154, 110847. [Google Scholar] [CrossRef]
  36. Xu, H.; Zhao, D.; Zeng, J.; Mao, Z.; Gu, X.; Wu, Q.L. Evaluating the effects of aquaculture on the freshwater lake from the perspective of plankton communities: The diversity, co-occurrence patterns and their underlying mechanisms. Environ. Pollut. 2022, 309, 119741. [Google Scholar] [CrossRef] [PubMed]
  37. Vezhnavets, V.V.; Kouraev, A.V.; Gukasyan, E.K.; Gabrielyan, B.K. Zooplankton Study of Lake Sevan as an Indicator of Ecosystem Stability in the Context of Global Climate Change. Inland Water Biol. 2024, 17, 48–58. [Google Scholar] [CrossRef]
  38. Shen, J.; Qin, G.; Gu, X.; Liu, Y.; An, S.; Liu, R.; Leng, X.; Wan, Y. Effects of seasonal hydrological regulation of cascade dams on the functional diversity of zooplankton: Implications for the management of massive reservoirs and dams. J. Hydrol. 2022, 610, 127825. [Google Scholar] [CrossRef]
Figure 1. Location of the Daqing Reservoir and the distribution of the sampling sites (The numbers 1–13 indicate sampling locations).
Water 17 01202 g001
Figure 2. Composition of phytoplankton at various points in the Daqing Reservoir (a); density of phytoplankton at various points in the Daqing Reservoir (b).
Water 17 01202 g002
Figure 3. Density composition of phytoplankton at various sampling points in the Daqing Reservoir (a); biomass of phytoplankton at various sampling points in the Daqing Reservoir (b).
Water 17 01202 g003
Figure 4. Dominance of each phytoplankton species at different sampling points in the Daqing Reservoir.
Water 17 01202 g004
Figure 5. Composition of Zooplankton at Various Sampling Points in Daqing Reservoir (a); Density of Zooplankton at Various Sampling Points in Daqing Reservoir (b).
Water 17 01202 g005
Figure 6. Density composition of zooplankton at various sampling points in the Daqing Reservoir (a); biomass of zooplankton at various sampling points in the Daqing Reservoir (b).
Water 17 01202 g006
Figure 7. Dominance of each zooplankton species at different sampling points in the Daqing Reservoir.
Water 17 01202 g007
Figure 8. Redundancy analysis (RDA) of phytoplankton and environmental factors (a); redundancy analysis (RDA) of zooplankton and environmental factors (b).
Water 17 01202 g008
Figure 9. Correlation analysis between phytoplankton diversity indices and environmental factors (a); correlation analysis between zooplankton diversity indices and environmental factors (b) (* p < 0.05, ** p < 0.01).
Water 17 01202 g009
Table 1. Water quality monitoring data for Daqing Reservoir in mg/L.
Sampling SitesCODNH3-NTP
113.220.340.01
213.350.370.02
320.390.400.01
414.560.380.03
515.660.220.02
616.200.410.03
716.540.530.02
817.110.200.02
918.220.540.03
1018.550.690.02
1119.340.450.05
1219.830.250.03
1319.590.470.05
Table 2. Phytoplankton diversity indices at each sampling point in the Daqing Reservoir.
Sample SitesNo. of Species/NumberShannon IndexRichness IndexEvenness
1314.121.770.88
2334.121.890.86
3283.511.490.78
4323.291.770.69
5334.211.760.89
6323.071.490.68
7313.731.800.78
8313.761.560.83
9343.331.860.69
10333.491.830.72
11283.681.470.83
12243.671.470.82
13323.832.010.77
Table 3. Zooplankton diversity indices at each sampling point in the Daqing Reservoir.
Sample SitesShannon IndexRichness IndexEvenness
12.992.810.79
21.403.080.33
32.492.420.64
42.862.880.72
52.612.330.68
62.913.340.69
72.772.210.75
82.892.400.76
93.053.430.72
102.993.270.69
112.613.690.59
123.083.330.75
132.572.680.64
Disclaimer/Publisher’s Note: The statements, opinions and data contained in all publications are solely those of the individual author(s) and contributor(s) and not of MDPI and/or the editor(s). MDPI and/or the editor(s) disclaim responsibility for any injury to people or property resulting from any ideas, methods, instructions or products referred to in the content.

