Article

Analysis of Response Surface and Artificial Neural Network for Cr(Ⅵ) Removal Column Experiment

Institute of Water Resources and Engineering, Beijing University of Technology, Beijing 100124, China
*
Author to whom correspondence should be addressed.
Water 2025, 17(8), 1211; https://doi.org/10.3390/w17081211
Submission received: 17 March 2025 / Revised: 10 April 2025 / Accepted: 16 April 2025 / Published: 18 April 2025
(This article belongs to the Section Wastewater Treatment and Reuse)

Abstract

:
In this study, inexpensive, environmentally friendly, and biodegradable cellulose filter paper was used to load nano zero-valent iron (nZVI), effectively improving the dispersibility of nZVI and successfully preparing the supported modified cellulose filter paper (FP-nZVI). Subsequently, the capacity of FP-nZVI to remove Cr(VI) in a flow system was explored. FP-nZVI was characterized by scanning electron microscopy (SEM), Fourier transform infrared spectroscopy (FTIR), and X-ray diffraction (XRD). Traditional single-factor experiments often require a large number of repeated experiments when analyzing the interactions among multiple variables, resulting in a long experimental cycle and high consumption of experimental materials. This research used the Response Surface Methodology (RSM) based on the Box-Behnken Design (BBD) and the Artificial Neural Network (ANN) to optimize and predict the removal process of Cr(VI). This RSM investigated the interactions between the response variable (Cr(VI) removal rate) and the independent variables (Cr(VI) concentration, pH value, and flow rate). A highly significant quadratic regression model was constructed, which was proven by a high F value (93.92), an extremely low p-value (<0.0001), and a high determination coefficient (R2 = 0.9918). An ANN model was established to forecast the correlation between independent variables and the removal rate of Cr(VI). Both models demonstrate remarkable consistency with the experimental data; however, from the perspective of statistical parameters, the ANN model has more significant advantages; the coefficient of determination R2 reaches 0.9937, which is higher than that of RSM (0.9918); the values of indicators such as MSE, RMSE, MAE, MAPE, AAD, and SEP are all smaller than those of RSM. The ANN exhibits greater excellence in prediction error, value fluctuation, and closeness to the actual value and has a more excellent prediction ability. The experiment for treating Cr(VI) with FP-nZVI was optimized, achieving good results. Meanwhile, it also provides a valuable reference for similar experimental studies.

1. Introduction

Groundwater is not only a vital source of drinking water but also a key factor in maintaining the stability of the ecosystem, playing a crucial role in ensuring human life and ecological balance. In recent years, with the accelerated global industrialization process, the problem of groundwater pollution has become increasingly severe. Among various pollutants, chromium pollution has become a major concern in the environmental field because of its high toxicity and wide distribution [1]. Cr(VI) has been leaked and discharged irrationally, leading to a large amount of chromium entering groundwater and surface water bodies, causing serious damage to the ecological environment [2,3]. The forms of chromium’s existence are usually Cr(III) and Cr(VI) [4,5,6,7]. Cr(VI) is more harmful, highly water-soluble and mobile, and is carcinogenic and teratogenic [8,9,10,11]. Therefore, the treatment of Cr(VI) pollution has become a crucial issue in the field of environmental protection.
In previous studies, scholars have put forward a variety of treatment methods (physical [12], chemical [13], and biological methods [14]) to remove Cr(VI). Physical methods include adsorption [15,16], ion exchange [17,18], and membrane separation [19]; chemical methods include coagulation-sedimentation [20], oxidation-reduction [21], electrochemical methods [22,23,24], and photocatalytic technology [25,26]. However, all these methods have certain limitations. Some physical and chemical methods are often costly [27,28] and generate secondary chemical sludge [29]. Biological methods have strict requirements for environmental conditions, and it is difficult to effectively translate laboratory results into practical applications [30,31]. Owing to its benefits like wide applicability, affordability, and environmental friendliness, the adsorption methodology ranks among the most effective approaches for heavy metal elimination [32].
nZVI is an environmentally friendly material characterized by a large specific surface area and strong reducibility [33]. In comparison with other nanomaterials, iron has the advantages of low cost and simplicity in preparation and modification [34]. nZVI also has the performance of removing heavy metals [35,36], and some studies have confirmed that nZVI can effectively remove Cr(VI) [37]. However, nZVI has problems such as easy agglomeration and easy oxidation in practical applications [38], resulting in a relatively low effective utilization rate of the material. In order to overcome the above problems, scholars have carried out a series of modification studies, mainly using technologies such as porous material loading [39], surfactant modification [40], and bimetallic modification [41,42,43]. However, these methods have certain defects. For example, bimetallic materials are costly, and heavy metals may be released during the process of introducing another metal [44], causing secondary pollution. Surfactant modification may block the reaction channels and electron transfer [45,46], weakening the ability to remove pollutants. The porous material loading technology can not only retain the advantages of bimetallic composite and surface modification but also further enhance the dispersion degree of nZVI and the adsorption and reduction ability of pollutants through the synergistic effect between the carrier and nZVI. Currently, in relevant studies, microspherical or powdery materials such as bentonite and biochar are often used as carriers for nZVI. However, this type of carrier material has the problem of difficult separation in practical applications, and some materials may also cause secondary pollution [47]. Therefore, developing a new type of insoluble, environmentally friendly carrier that will not block the flow system to fix nZVI is of great significance for the efficient application of nZVI.
Cellulose is a natural polymer compound with biodegradable properties and is an environmentally friendly material. Due to its low cost, good stability, abundant reserves, and renewability, it has been widely used in many fields. Cellulose filter paper (FP), as a cellulose product, is often used as an adsorbent or an adsorbent carrier and is applied in the sphere of water pollution control [48,49]. The FP material contains rich functional groups, such as -COOH, -OH, etc. These functional groups can serve as binding ligands to combine with metal ions, creating favorable conditions for the adsorption and modification of the material [50]. Therefore, cellulose filter paper can be considered a good carrier for nano zero-valent iron.
In terms of experimental design and optimization, traditional experiments adopted the single-factor variable control method, where only one parameter was changed while the remaining parameters were kept constant. This requires a large number of repeated experiments, consuming a great deal of time and chemical reagents, and it is difficult to analyze the interactions among multiple variables [51]. The RSM is a powerful predictive modeling technique that can optimize multiple independent variables simultaneously and evaluate the interactions among them, thus determining the optimal experimental conditions. It shortens the experimental cycle, reduces the consumption of experimental materials [52], and has been extensively applied in the realm of scientific inquiry [53,54,55,56,57]. The BBD is a frequently employed experimental design approach within response surface methodology. Compared with the central composite design [58], it can effectively explore the response surface with a relatively small number of experiments. In addition, due to its powerful modeling ability, the ANN can capture the highly complex relationships between variables, establish accurate connections between input and output parameters, have excellent self-learning ability, and can be widely applied in the field of scientific research [59,60,61,62,63]. In this study, the ANN model introduced increases the number of hidden layers. Compared with studies that use fewer hidden layers, the coefficient of determination has been improved, and key error indicators have decreased. More combinations of neurons can extract the deep-seated features of the data, bolstering the model’s capacity to simulate and forecast data.
In this study, An environmentally friendly cellulose filter paper with nZVI incorporated into it was fabricated, which effectively improved the dispersibility of nZVI. SEM, FTIR, and XRD were used to characterize FP-nZVI, and the microstructure, functional group composition, and crystal structure characteristics of FP-nZVI were analyzed. Subsequently, a column experiment was carried out to eliminate Cr(VI) from water using FP-nZVI, and Cr(VI) removal efficiency by FP-nZVI was calculated at varying concentrations (10, 20, 30 mg/L), flow rates (1, 3, 5 mL/min), and pH levels (3, 5, 7). In order to avoid conducting plenty of repetitive experiments, which are time-consuming and consume a lot of materials, and to explore the interactions among various variables, RSM and ANN were employed to optimize and forecast the removal efficiency. Through important indicators such as the goodness of fit, MSE, RMSE, MAE, MAPE, AAD, and SEP, the prediction performances of ANN and RSM were compared, and the prediction results of the two models were compared and analyzed with the experimental data. Finally, the advantages and disadvantages of the existing models were discussed, the deficiencies of this study were summarized, and suggestions for future research were put forward so as to provide guidance for the prediction, optimization, and large-scale application of FP-nZVI in water treatment.

2. Materials and Methods

2.1. Materials and Reagents

The ashless cellulose filter paper (FP) was sourced from Whatman in the UK. Key chemicals, including sodium hydroxide (NaOH) and hydrochloric acid (HCl), were procured from Beijing Chemical Works. Additional reagents—ferric chloride hexahydrate (FeCl3·6H2O), absolute ethanol (C2H5OH), sodium borohydride (NaBH4), and acetone (C3H6O)—were supplied by Fuchen Chemical Reagent Factory in Tianjin. All chemicals used were of analytical grade purity.

2.2. Material Preparation

First, dissolve 8.6495 g of FeCl3·6H2O into 40 mL of ethanol to make a 0.8 M iron solution. Then, dissolve 0.4 g of NaOH in 100 mL of deionized water. Immerse four pieces of ashless cellulose filter papers (FP, from Whatman, Maidstone, Kent, UK) in this solution. After 30 min, take out the filter papers and rinse them using deionized water until the rinse’s pH level approaches neutral. Submerge the cleaned filter papers in the iron bath for 40 min, then remove them and allow them to air-dry to yield yellow filter papers. Dissolve 1.9 g of Sodium Borohydride within 100 mL of distilled water to create a reducing reagent. Immerse the yellow filter papers directly into the NaBH4 solution for 45 min to synthesize black magnetic papers (FP-nZVI). Thoroughly wash the composite material (FP-nZVI) with absolute ethanol. Finally, transfer it to a freeze-drying oven for 600 min of vacuum drying.

2.3. Characterization

The material was characterized using a JEM-7001M produced by JEOL (Tokyo, Japan), an IRAffinity-1S manufactured by Shimadzu Corporation (Tokyo, Japan), and a D8 Advance made by Bruker (Karlsruhe, Germany).

2.4. Experiment Design

To evaluate the ability of the FP-nZVI composite material to remove Cr(VI), column experiments were carried out. An acrylic plexiglass column was used in the experiment, with dimensions of 18 cm in length, 3 cm in inner diameter, and 0.3 cm in wall thickness. The column was filled with FP-nZVI and quartz sand. Specifically, the base of the column featured 2-cm-tall glass beads, followed by quartz sand and FP-nZVI (placed in the central position), as shown in Figure 1. Finally, glass beads with a dimension of 2 cm in height were filled at the top of the column to stabilize the effluent. The glass beads have the property of making the adsorbate solution evenly distributed. During the whole operation, the consistency of the packing material in the column was guaranteed. A variable-speed peristaltic pump was employed to link the Cr(VI) solution at a known concentration to the glass column using latex tubing, enabling the quantitative injection of the solution into the glass column. The Cr(VI) liquid streams from the base to the summit of the column. All experimental procedures were executed at ambient temperature.
Studies were performed using the experimental configuration presented in Figure 1 under various conditions of pH values (3, 5, and 7), Cr(VI) concentrations (10, 20, and 30 mg/L), and flow rates (1, 3, and 5 mL/min). The column was rinsed with deionized water until it was saturated, and then the Cr(VI) solution was pumped in. Measure the concentration of the effluent at the same time intervals and then plot the breakthrough curve for subsequent analysis. In the experimental process, three parallel tests were conducted on the concentration of the collected effluent. The average value of the obtained data was taken as the measured value of this sampling point so as to reduce experimental errors and ensure the accuracy of the data.

2.5. Analysis of Experimental Data

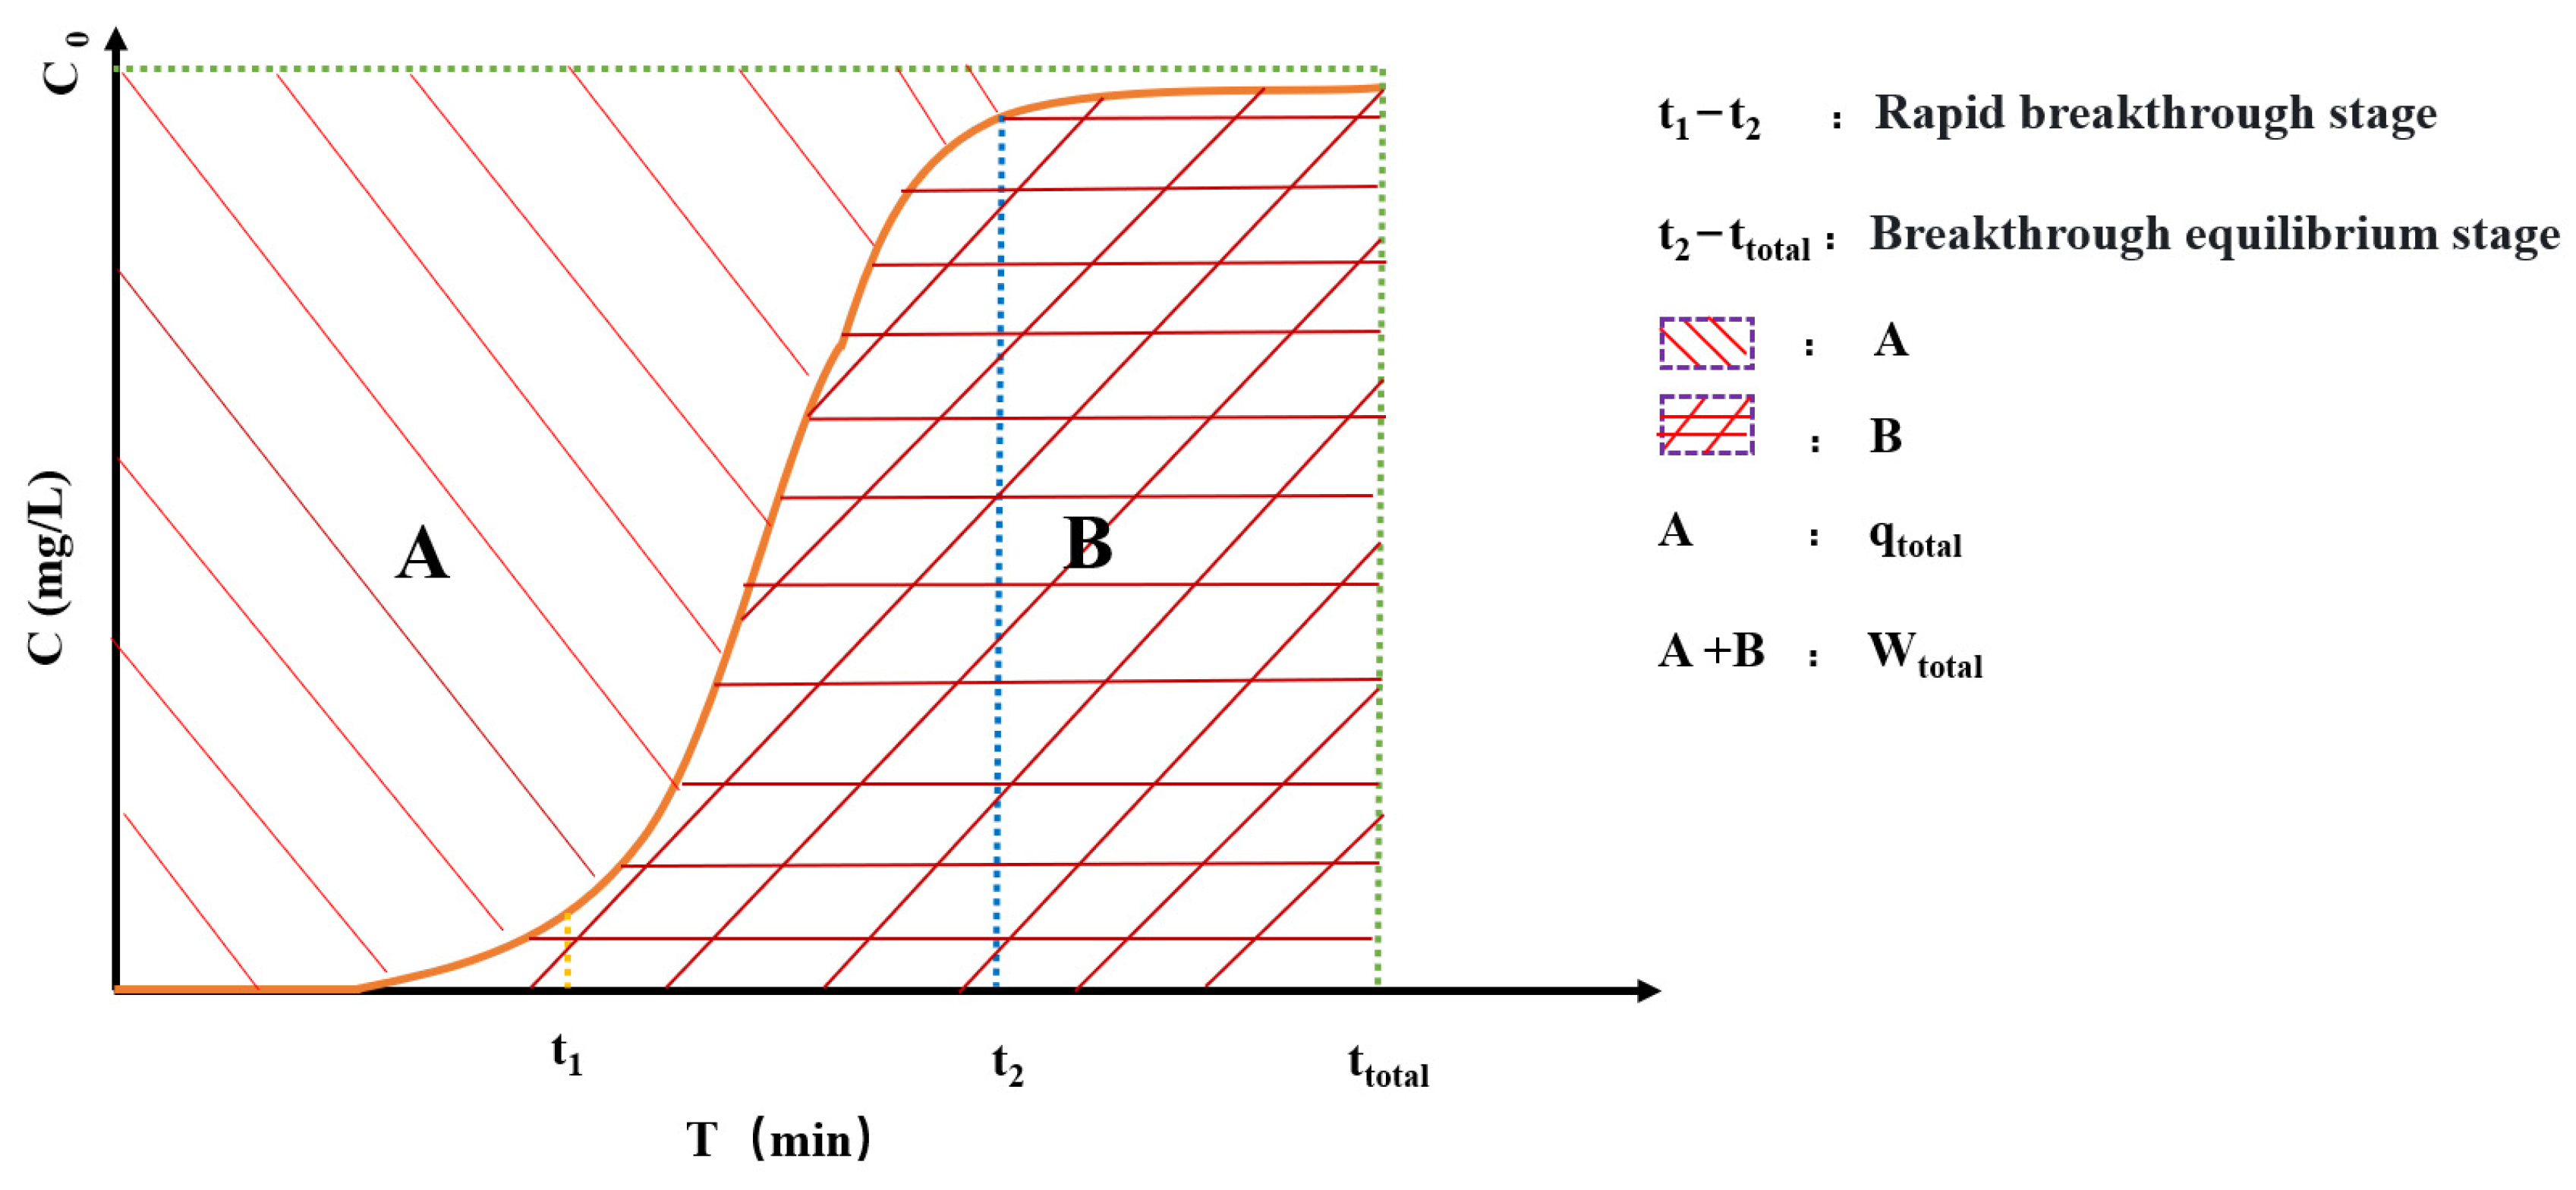
2.5.1. Column Experiment Analysis

The total removal amount ( q t o t a l ) of Cr(VI) on the adsorbent and the equilibrium adsorption capacity ( q e q ) could be computed from the area beneath the breakthrough curve (Figure 2) via the integration approach. The specific calculation formulas are as follows:
q t o t a l = Q A 1000 = Q 1000 0 t t o t a l C 0 C t d t
q e q = q t o t a l m = Q C 0 0 t t o t a l 1 C t C 0 d t 1000 m
where A is the area above the breakthrough curve; q e q is the mass of Cr(VI) (mg/g) adsorbed and reduced per unit mass of FP-nZVI in the column; m is the mass of the adsorbent (mg). The total mass of the influent Cr(VI) is determined by the following Formula (3):
W t o t a l = C 0 Q t t o t a l 1000
The total removal rate of Cr(VI) is derived from Formula (4):
r = 100 q t o t a l W t o t a l % = 100 0 t t o t a l 1 C t C 0 d t t t o t a l %

2.5.2. Response Surface Methodology

RSM represents a statistical and mathematical approach applied to efficiently address and resolve multivariate issues [64]. RSM carries out data fitting analysis through a series of rationally designed experiments and multiple regression analysis methods to estimate the functional relationship between the studied response variables and the independent variables concerned with the single factor test [65]. The testing process is defined as the conversion of the input independent variables into the response variables of several outputs, and the statistical model is established by the response surface method [66].
In this study, the independent variables include the pumping flow rate of the peristaltic pump, pH value, and Cr(VI) concentration; the response variable is the removal rate of Cr(VI). The BBD method using Design Expert software version 13 was employed to analyze, compare, and optimize the studied response variable by combining the independent variables, so as to obtain the influence of this combination on the response variable under different conditions.
Subsequently, single-factor experiments were carried out, and on this basis, the BBD was further adopted for exploration. In this BBD, three levels (−1, 0, +1) were set for each research factor. To accurately estimate the experimental error, five repeated experiments were conducted at the central point (Q = 3 mL/min, pH = 5, C0 = 20 mg/L). The objective of this investigation was to assess the precise impacts of the pumping flow rate of the peristaltic pump, the starting Cr(VI) concentration, and the solution pH on the Cr(VI) elimination rate when 0.38 g of adsorbent was deployed. The factors, values, and coded levels are as follows: the starting concentration of Cr(VI) (A): 10 (−1), 20 (0), 30 (+1); the flow rate (B): 1 (−1), 3 (0), 5 (+1); the pH value (C): 3 (−1), 5 (0), 7 (+1) (Table 1). The specific experimental design is in Table 2.
The optimization of the response performance of FP-nZVI for Cr(VI) in this experiment was based on the response level, process optimization, and analysis of variance (ANOVA) under a second-order polynomial equation. The optimization analysis of the independent variables and response variables was performed by the obtained fitted model with the equations shown below.
Y = b 0 + i = 1 k b i x i + i = 1 k b i i x i 2 + i = 1 k 1 j = i + 1 k b i j x i x j
where Y is the estimated response value of Cr(VI) removal, b0, bi, bii, bij denote coefficients, and xi, xj signifies independent variable factors.

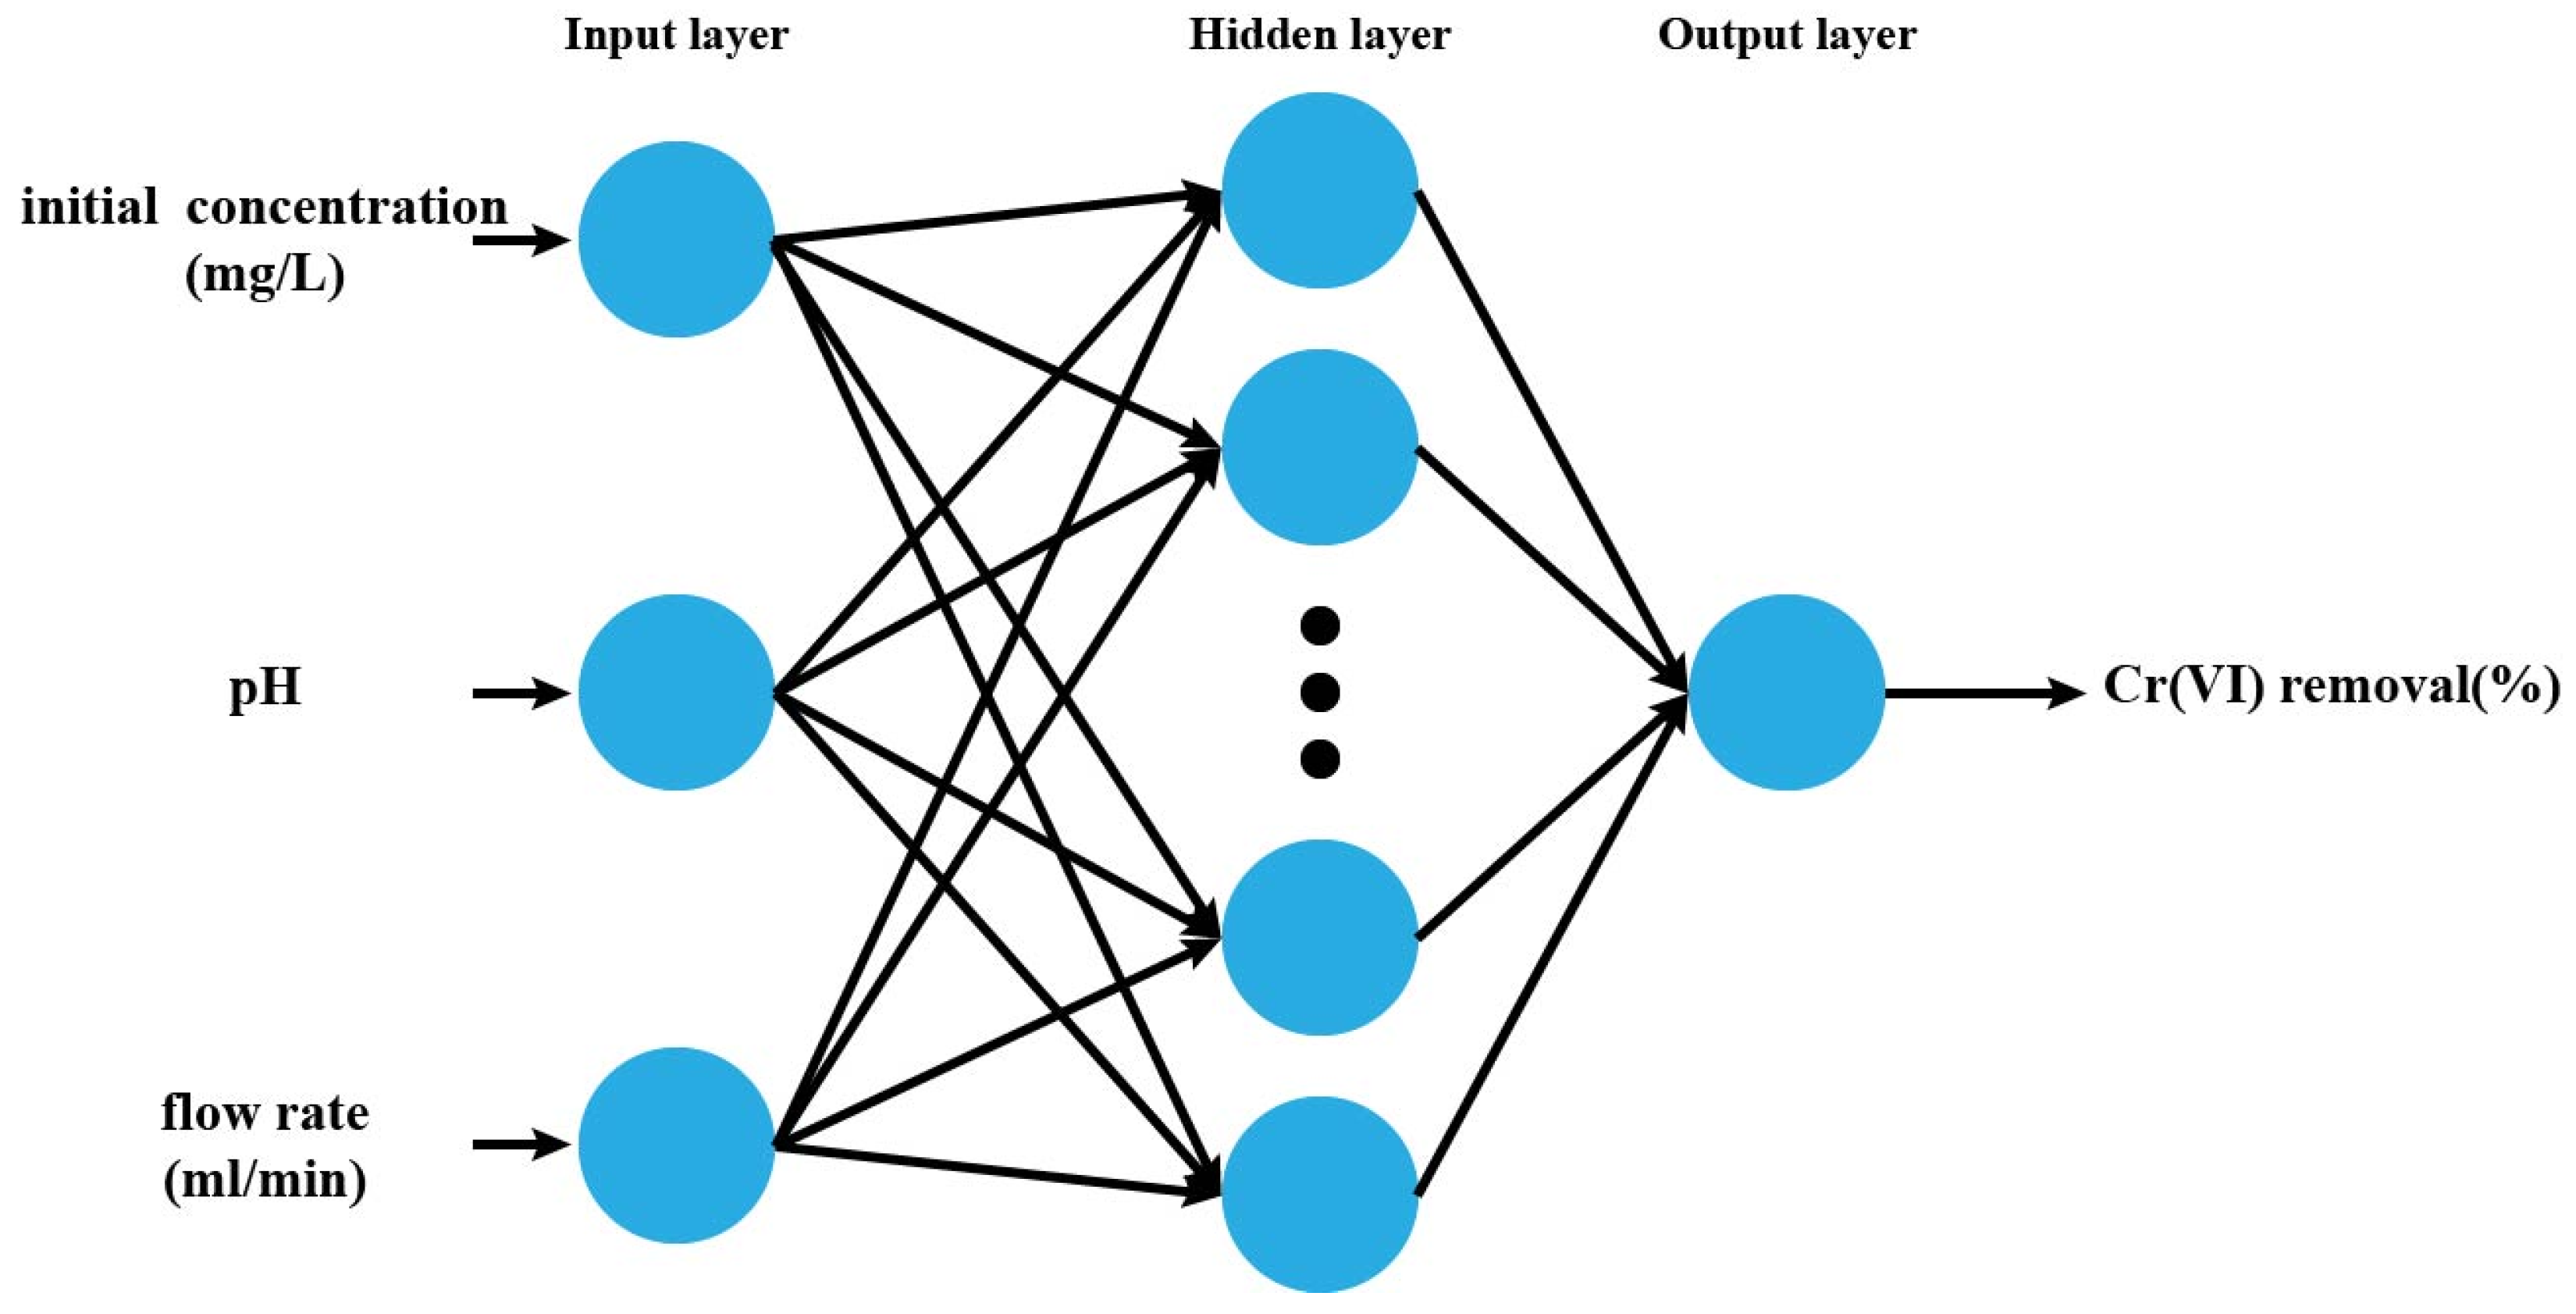
2.5.3. Artificial Neural Network

ANN, with its excellent data–processing capabilities, is widely used in the fields of data simulation and prediction [67,68,69]. In this study, the hyperbolic tangent sigmoid activation function (tansig) and the identity activation function (purelin) were employed to link the hidden layer and the output layer of the neural network. A three-layer feedforward-backpropagation network was used to train the model network (the network structure’s schematic illustration is presented in Figure 3). The transfer function shown in Equation (6) was used to simulate the ability of FP-nZVI to remove Cr(VI). In total, 17 experimental data were employed in the ANN modeling. To eliminate the impact of data magnitude differences on the model, the data were normalized. We partitioned the dataset into training, validation, and test subsets, allocating 70%, 15%, and 15% of the data, respectively. The numbers of data used in the network training, validation, and test stages were 11, 3, and 3, respectively. The Levenberg–Marquardt backpropagation algorithm was employed to conduct the network training of the model. The network topology was set with three input nodes, corresponding to the initial concentration of Cr(VI), the pH value, and the inflow rate, respectively; the output node was the removal rate of Cr(VI). In this study, Matlab R2021b was used for ANN modeling, and various statistical parameters were utilized to evaluate the model performance of RSM and ANN. The specific calculation equations are shown in Table 3.
f x = 1 1 + e x p x

3. Results and Discussion

3.1. Characterizations

3.1.1. SEM Analysis

Scanning electron microscopy (SEM) was employed to characterize the surface morphologies of the filter paper, unmodified nZVI, and the modified FP-nZVI. As shown in Figure 4a,b, the surface of the fiber strips of the filter paper is slightly rough. The interconnections between them form fiber channels, which are conducive to the loading of nanoiron particles. Besides, the intrusion of nanoiron particles into fiber channels’ inner space effectively retards oxidation. Figure 4c reveals substantial agglomeration of unmodified nZVI. Van der Waals forces and magnetic effects primarily drive this agglomeration [70]. Figure 4d,e indicates that the nanoiron particles of the modified composite material FP-nZVI are distributed in chains or exist as separate dispersions. The particles are irregular spheres with a uniform particle size of about 50–80 nm. This shows that the ethanol solution added during the preparation process has a certain dispersing effect on the nanoiron particles. Ethanol molecules contain a large number of hydroxyl groups. The strong polarity of the hydroxyl functional groups can combine with iron ions to form chelate bonds, constructing a certain spatial structure that prevents the aggregation phenomenon caused by magnetism and intermolecular forces during the formation of nanoiron particles [71]. This structure enables the nanoiron particles to be dispersed on the surface of the cellulose filter paper and prevents large-scale agglomeration, which is also consistent with relevant research [72].

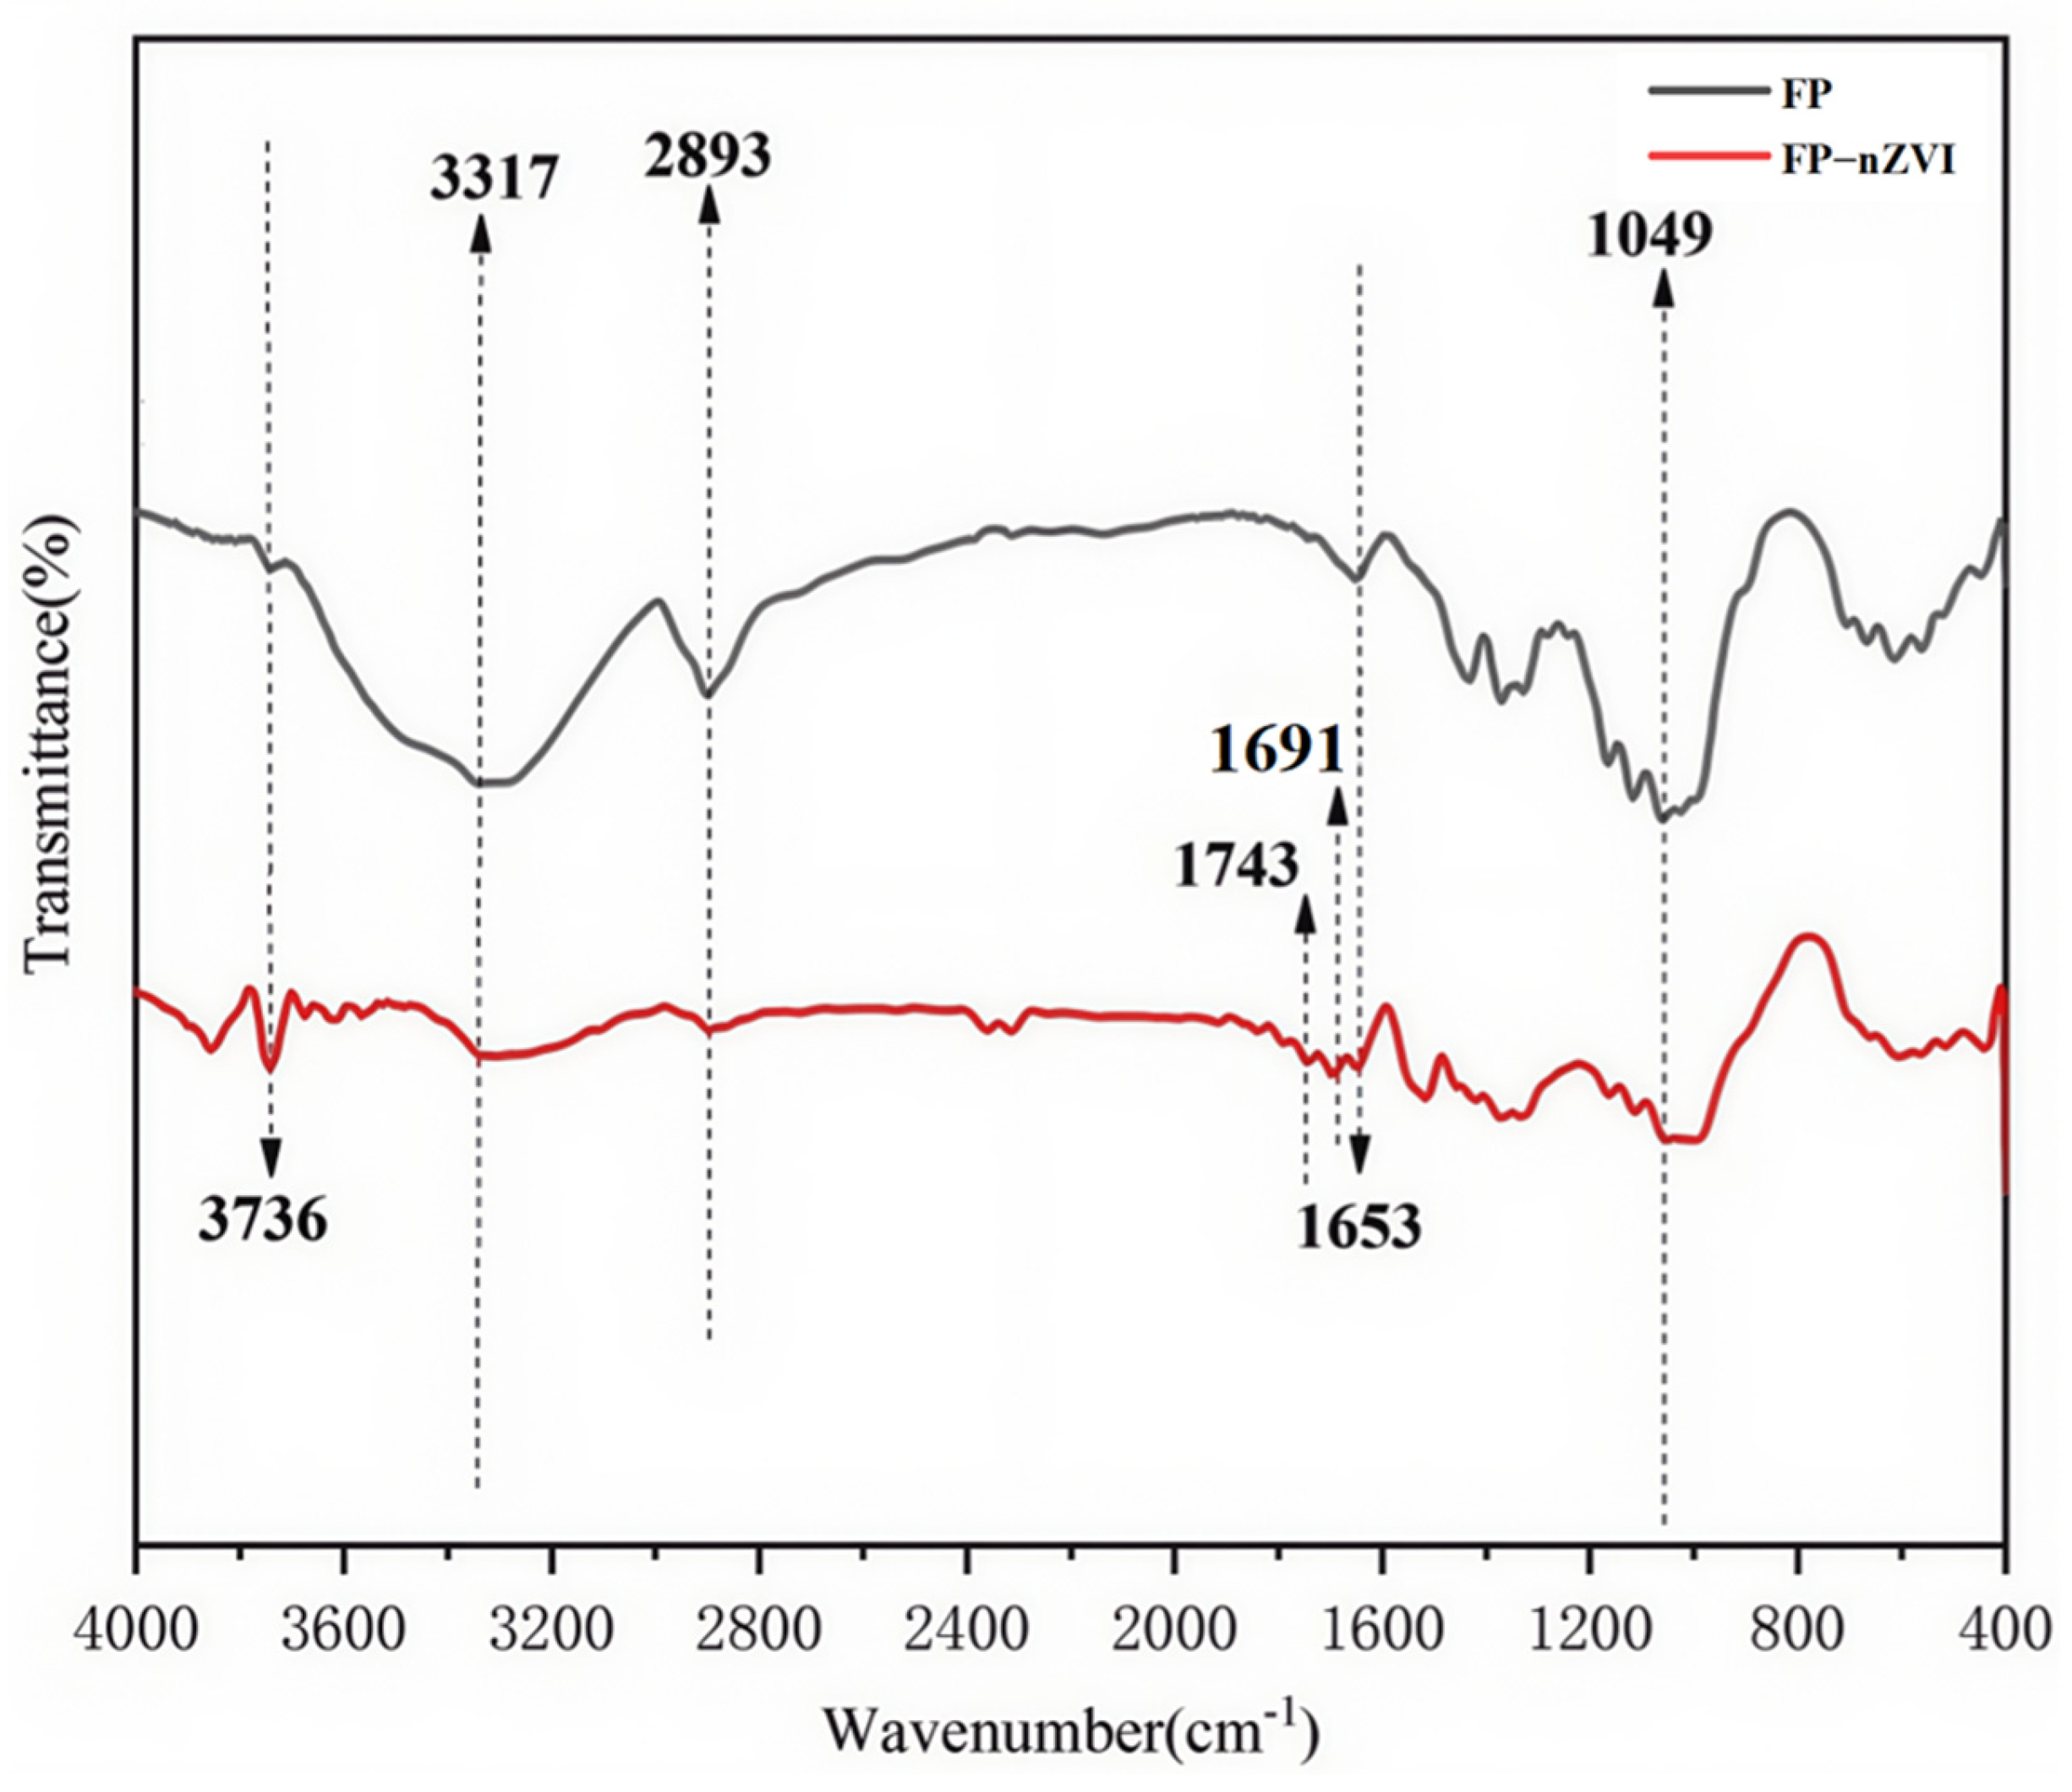
3.1.2. FTIR Analysis

Fourier transform infrared (FTIR) spectroscopy was employed to analyze FP and FP-nZVI. As shown in Figure 5, characteristic peaks were manifested at 3317 cm1, 2893 cm1, 1653 cm1, and 1049 cm1. These characteristic peaks were attributed to the stretching of -OH, -CH2, H-O-H, and the stretching of C-O and C-C, respectively [73,74]. However, when nZVI was loaded onto FP, the peak at 1653 cm1 in the spectrum of FP-nZVI almost disappeared. New peaks appeared at 1743 cm1 and 1691 cm1, which could be regarded as the asymmetric stretching of carboxyl groups. Therefore, the FTIR results indicated that nZVI had been successfully embedded in FP. Nevertheless, the C-O and C-C stretching bonds of cellulose at 1049 cm1 remained almost unchanged, suggesting that there was no substantial change in the ring structure of the cellulose filter paper.

3.1.3. XRD Analysis

Figure 6 depicts the XRD patterns of the FP and FP-nZVI. The picture on the right is an enlarged view of the area within the dashed box in the left picture. At diffraction angles of 2θ = 14.8°, 16.6° and 23.1°, these angles correspond to the (1 1 ¯ 0), (110), and (200) diffraction peaks of cellulose, respectively [75]. As can be observed from the patterns, for the fabricated composite material FP-nZVI, a diffraction peak corresponding to the (110) crystal plane of α-Fe emerges at 2θ = 44.68°, which suggests that the synthesized iron exists in the form of zero-valent iron [76]. However, a characteristic peak of FeOOH appears around 2θ = 39.21°, suggesting that the prepared nano zero-valent iron has undergone a certain degree of oxidation.

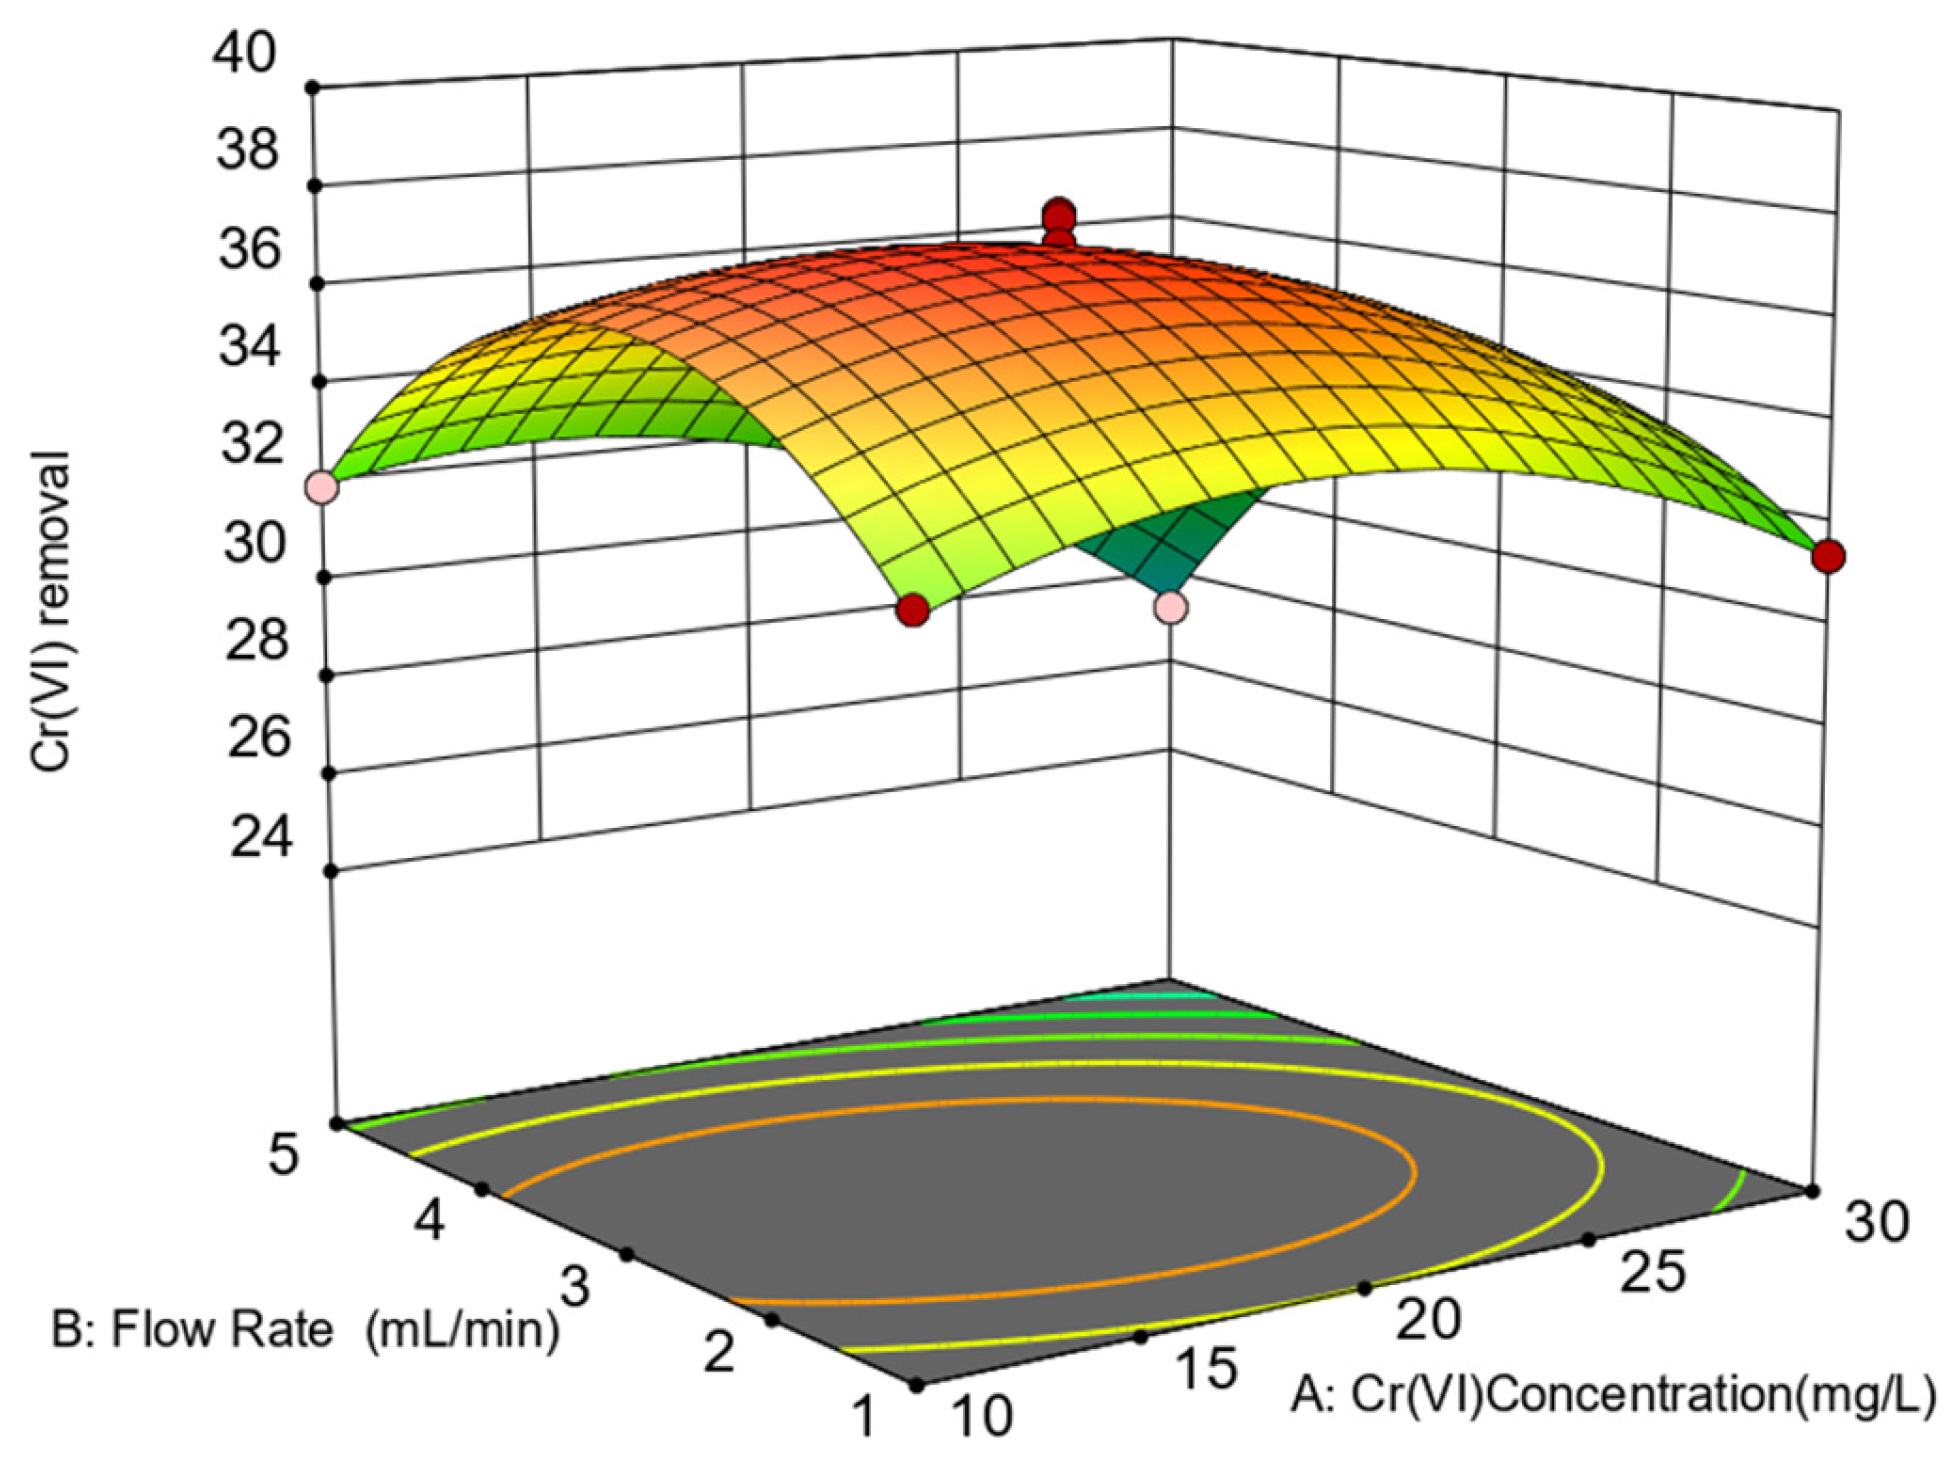
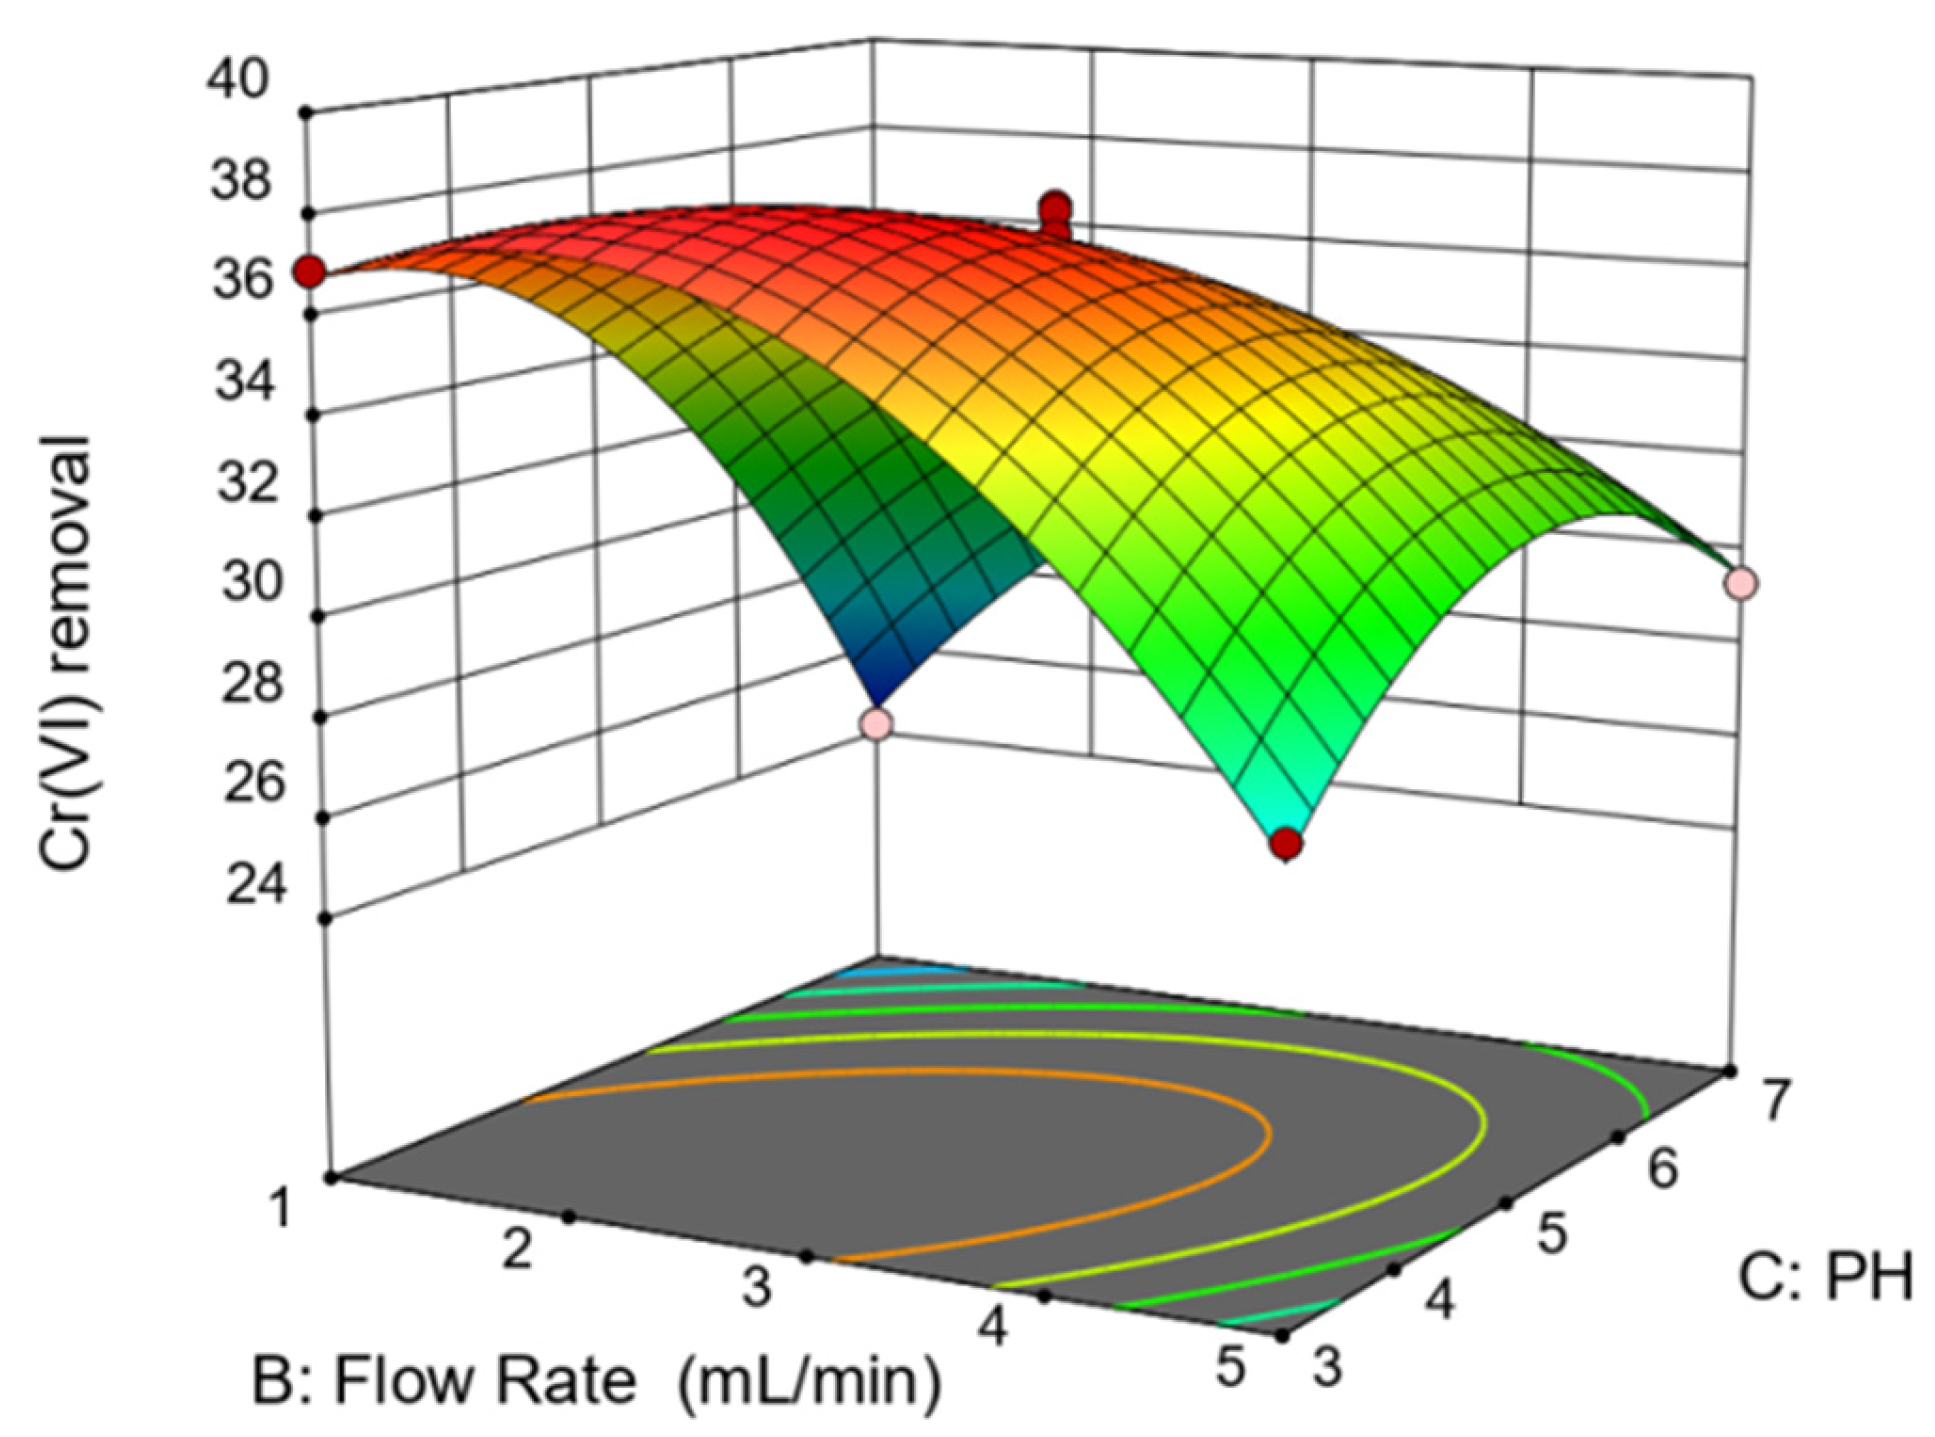
3.2. Response Surface Analysis
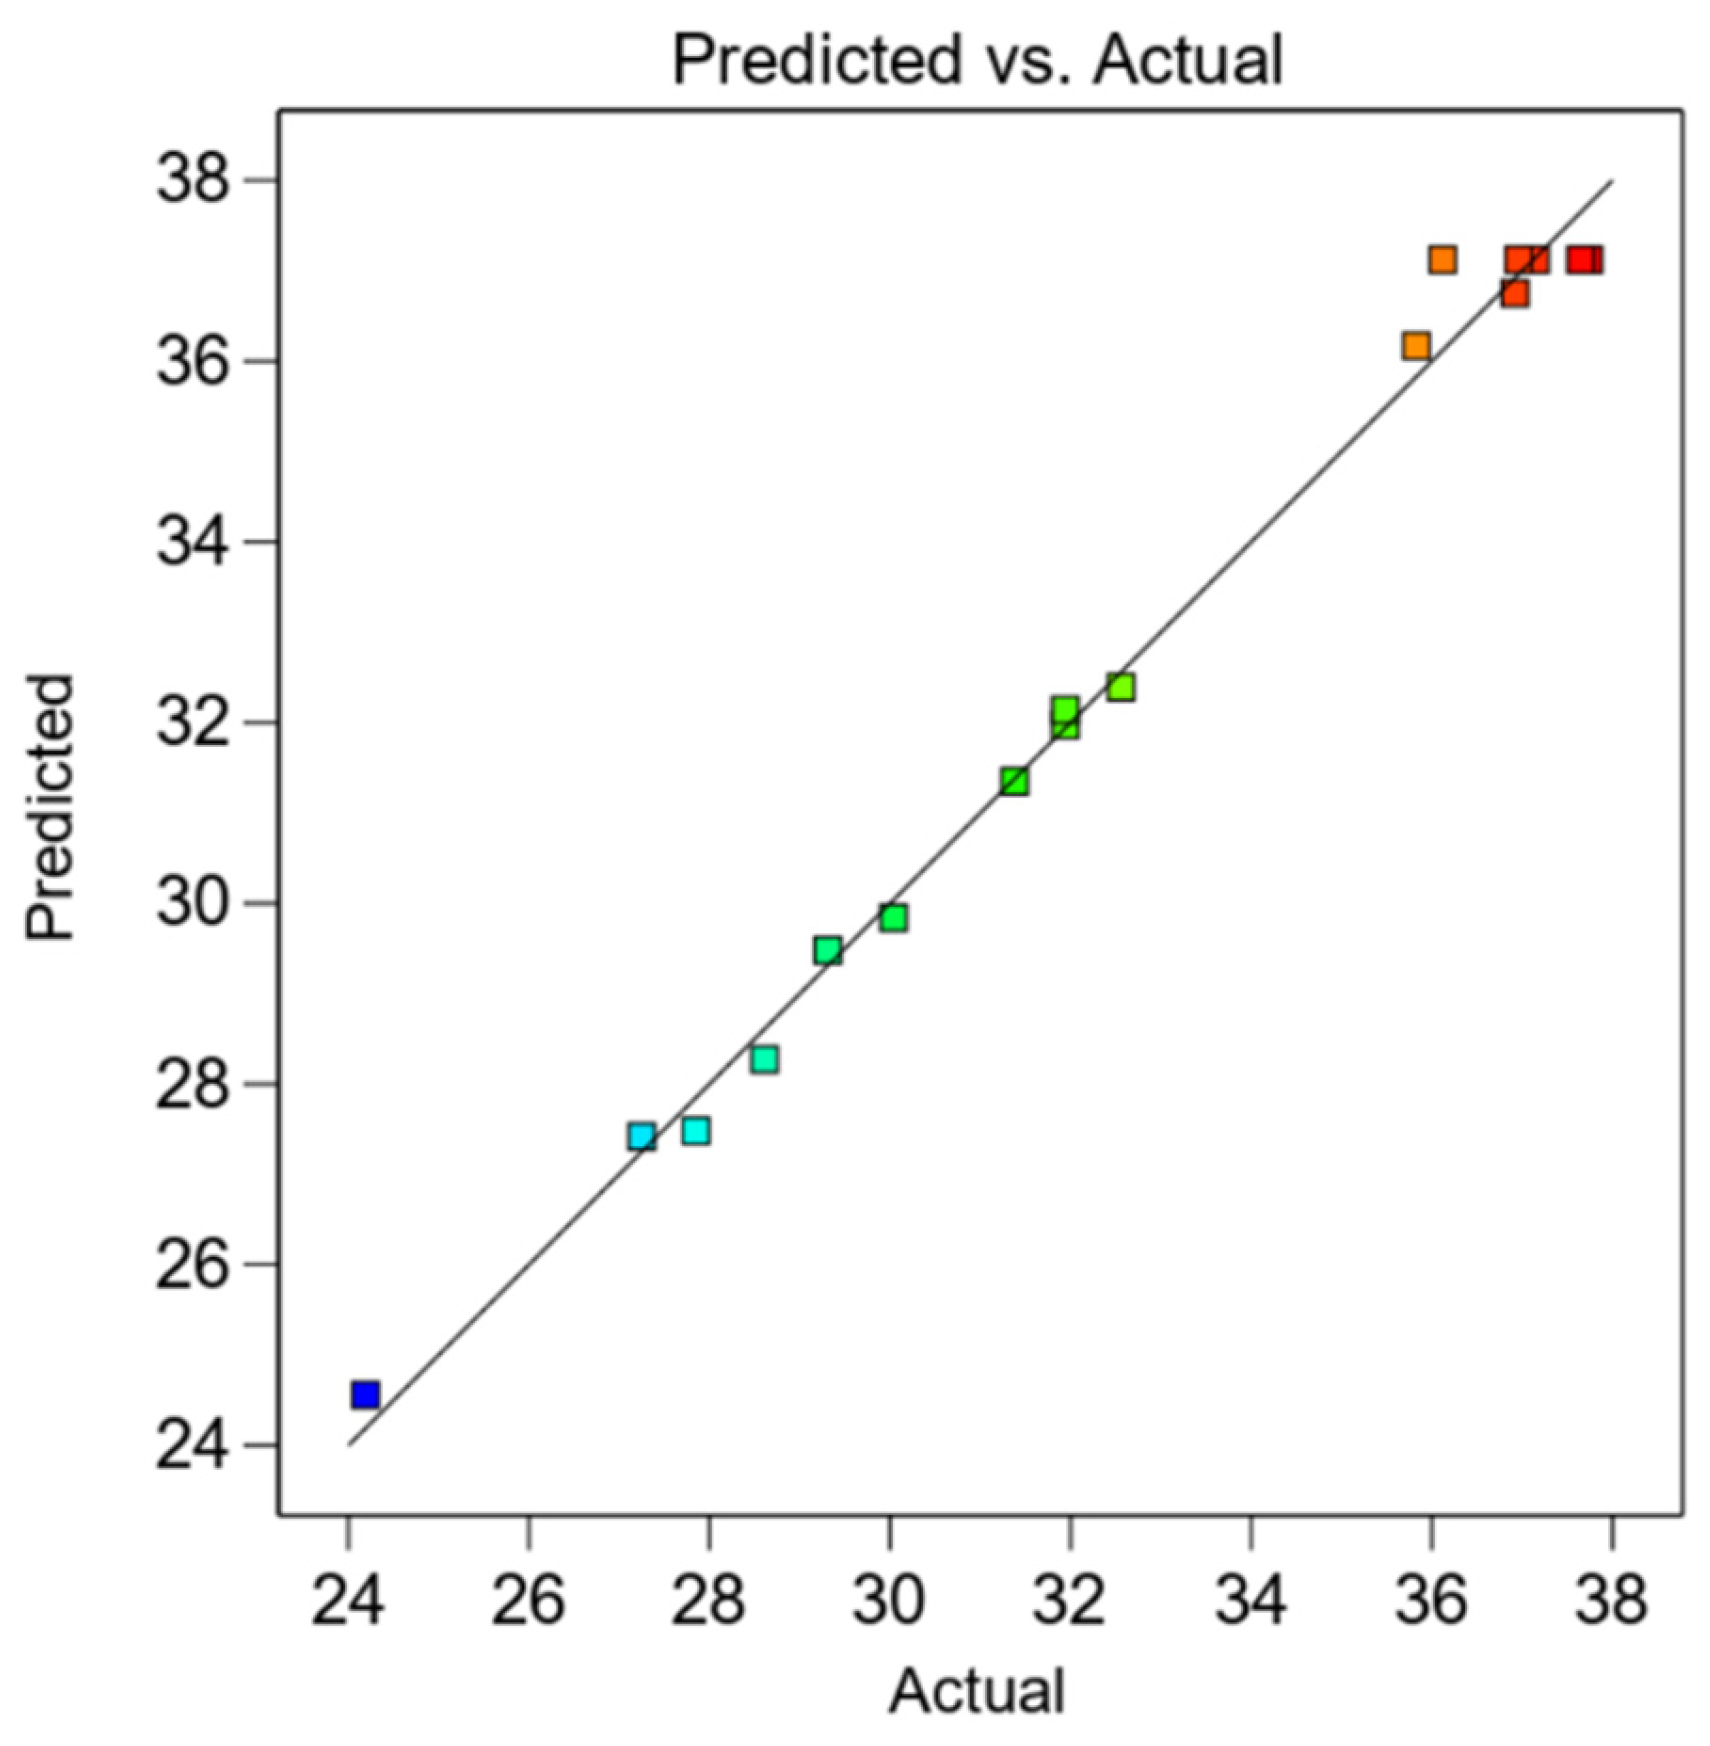
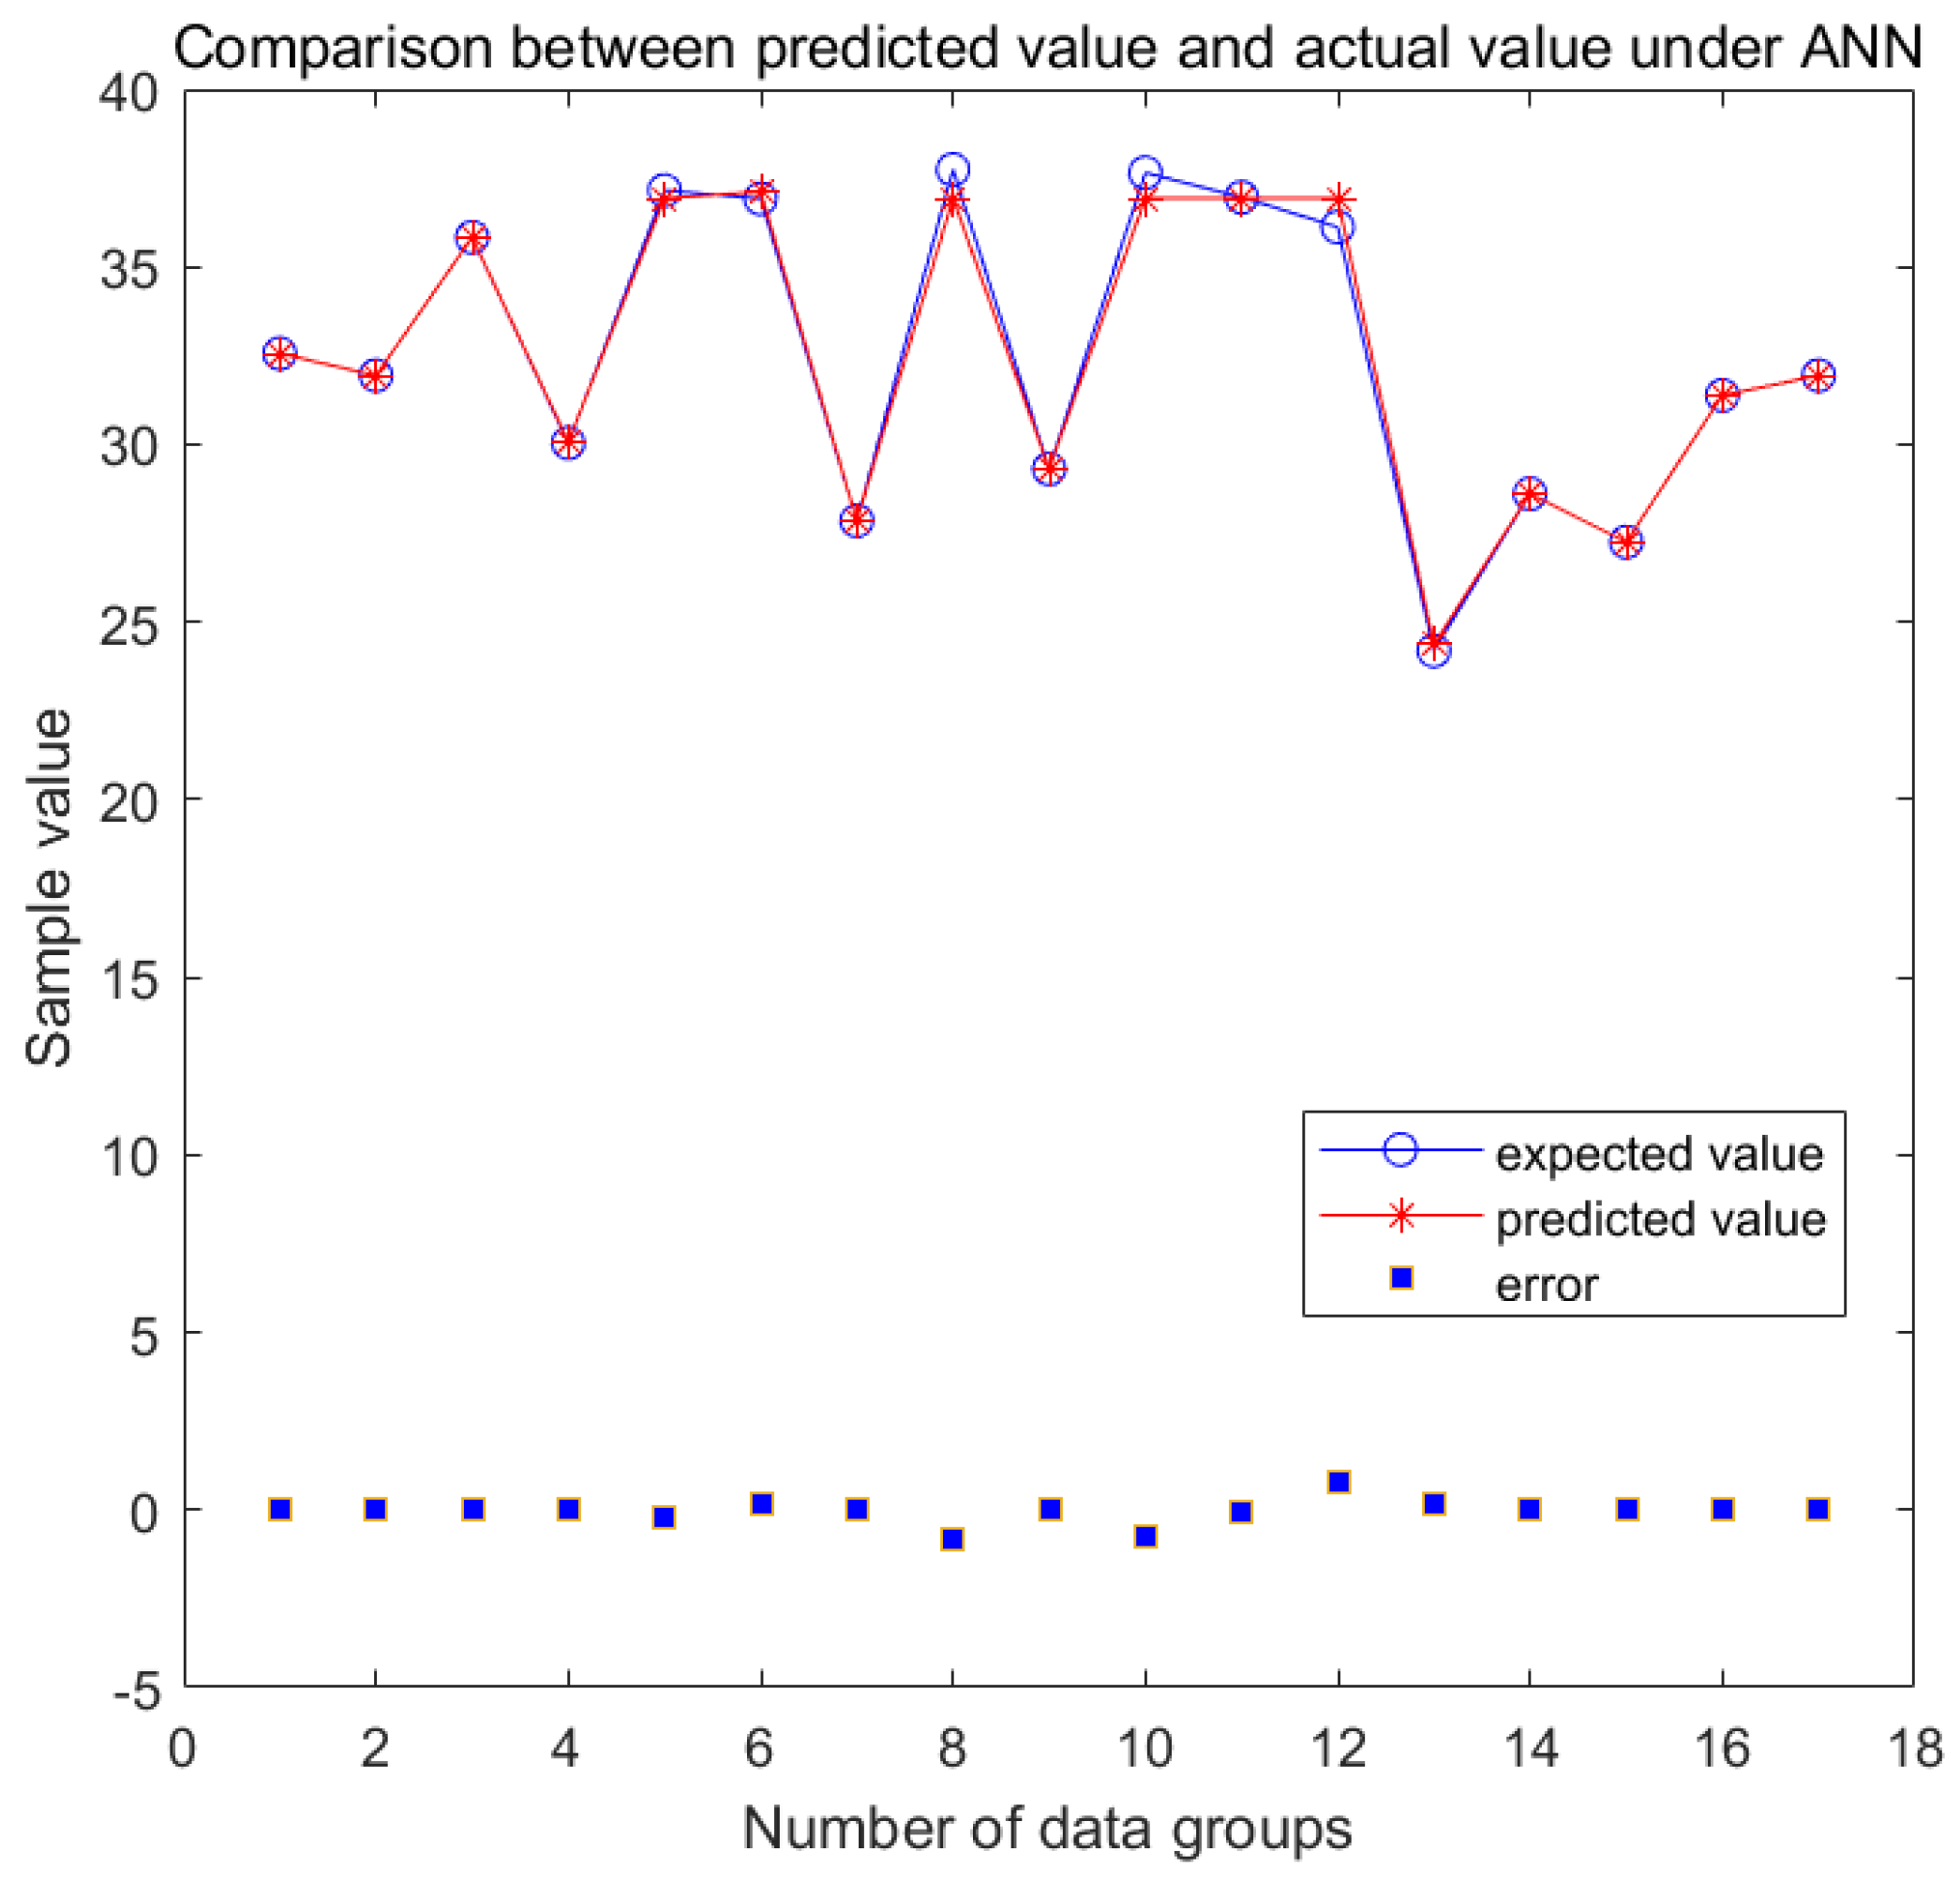
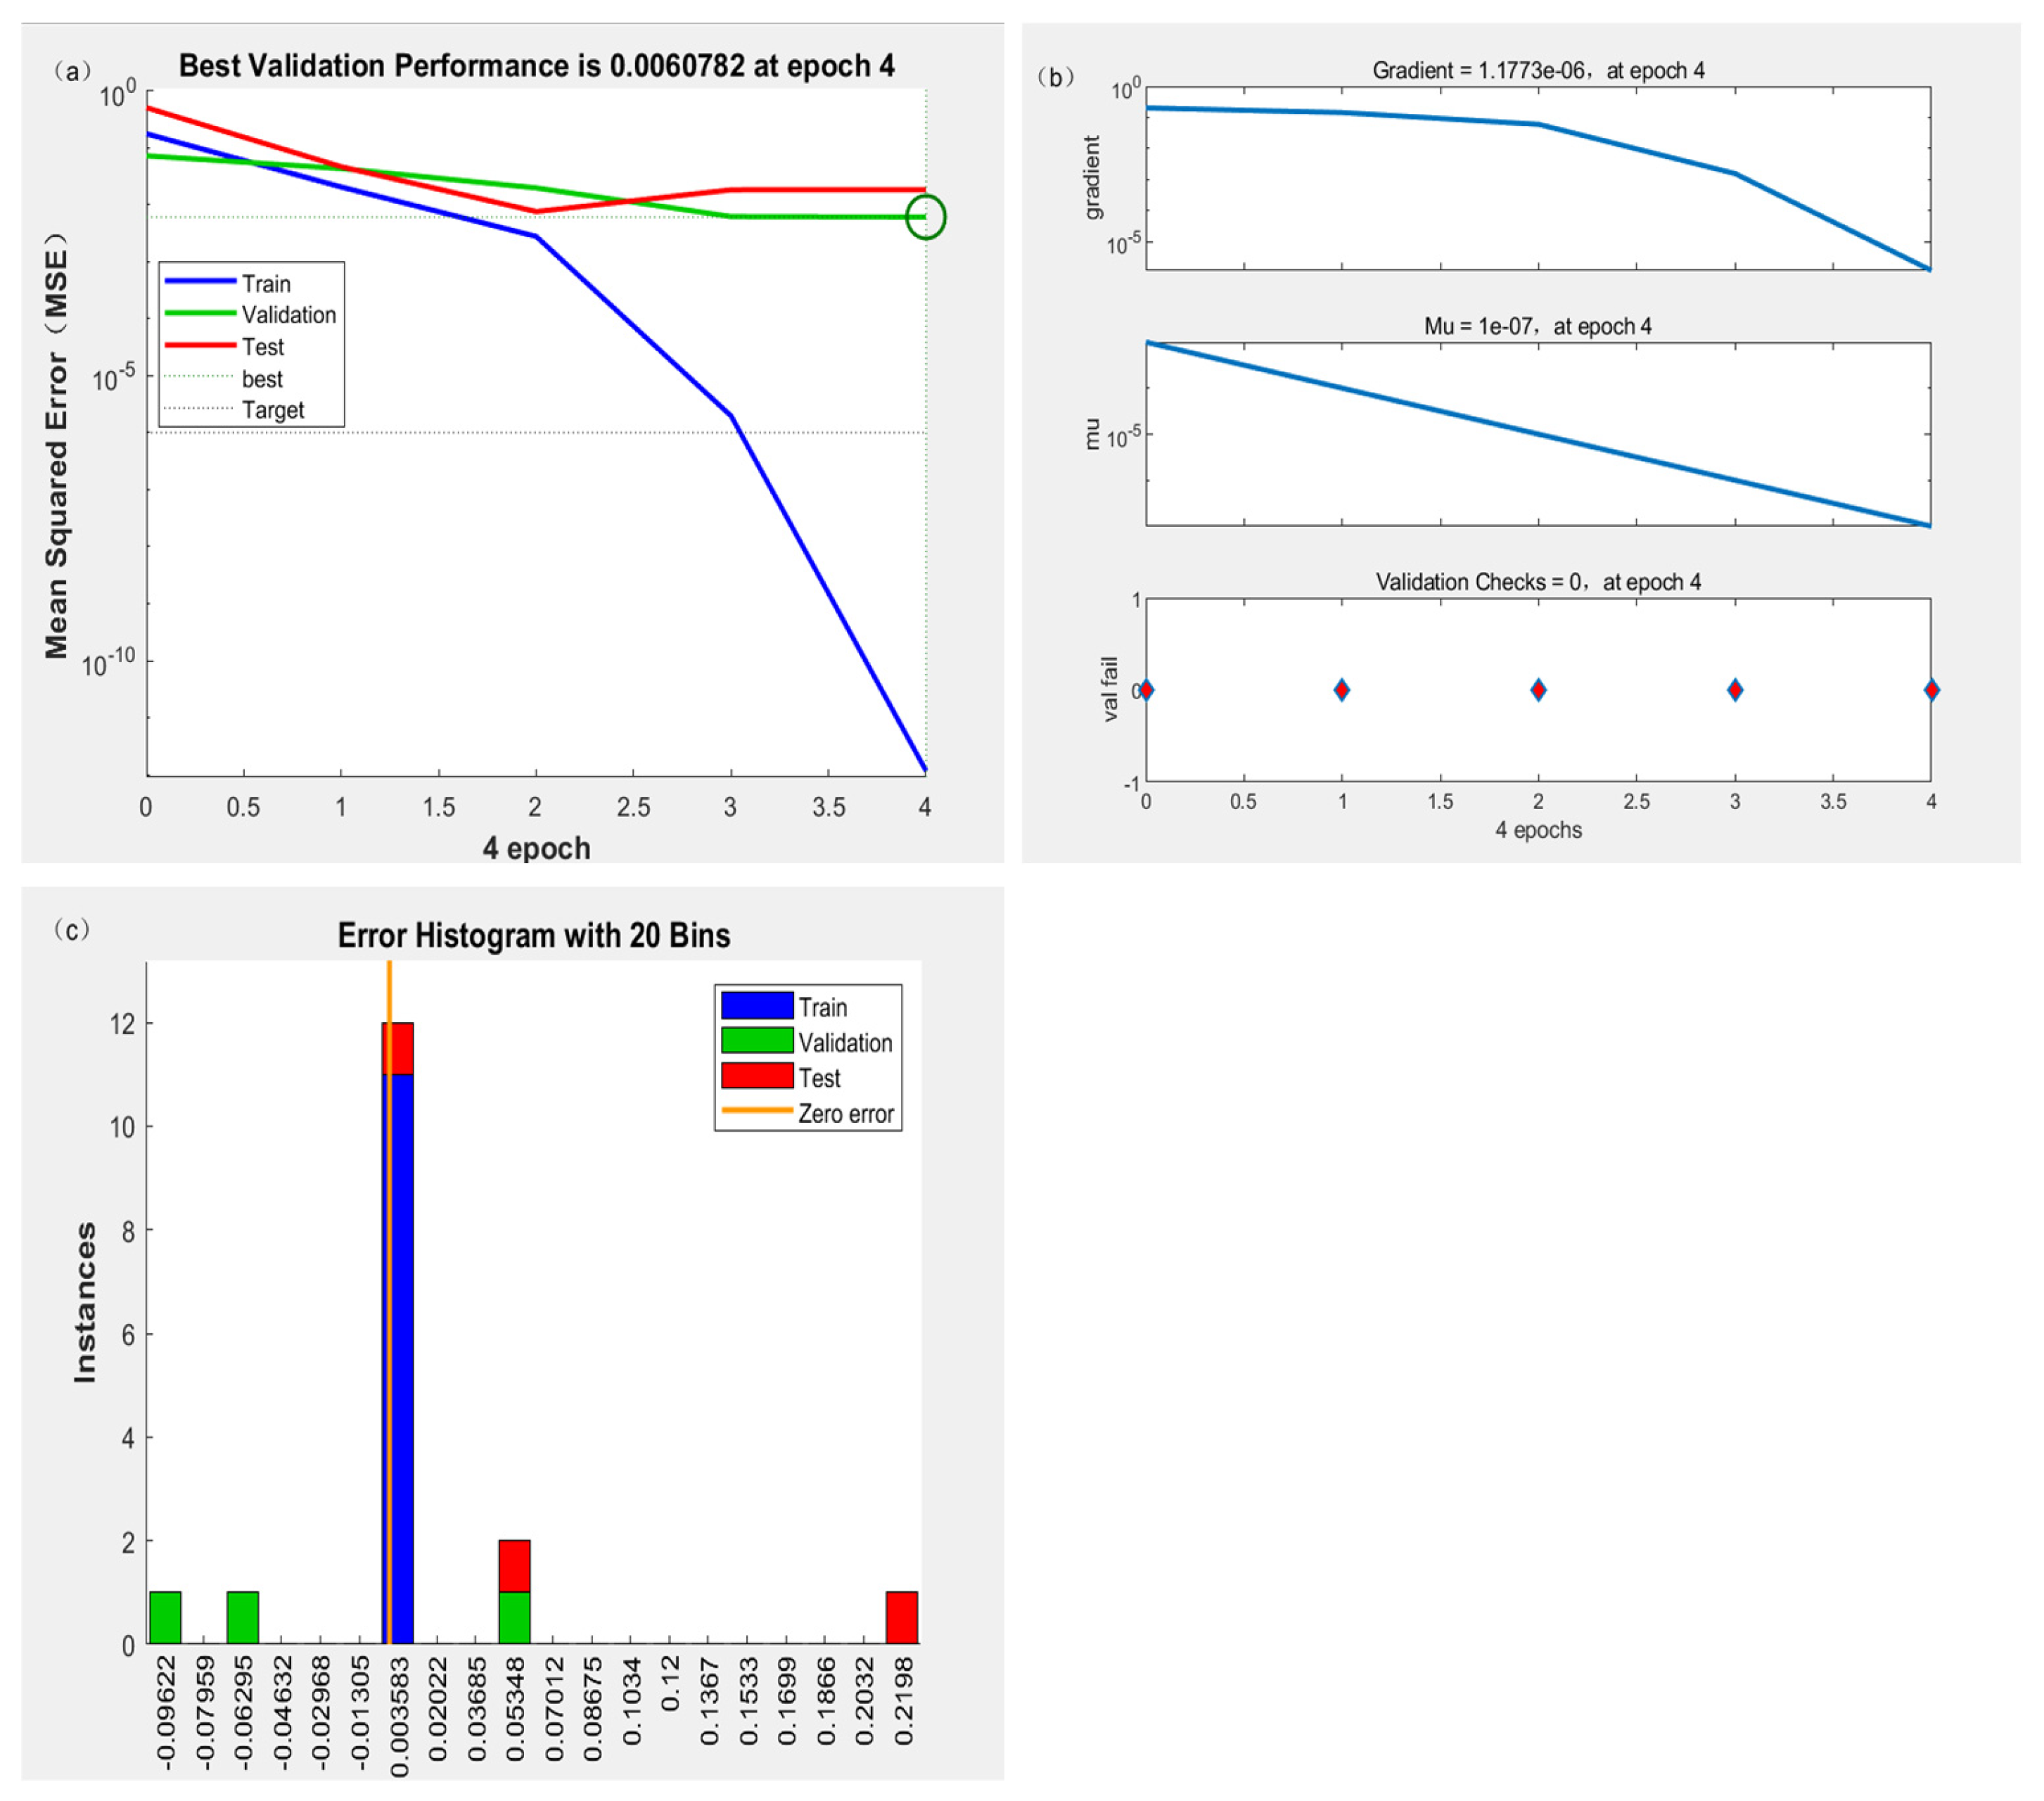
A BBD design was performed using three independent variables, flow rate, concentration, and pH, and statistically significant nonlinear regression equations were established by Expert Design version 13 using the conventional analysis of variance (ANOVA) method. The ANOVA results showed that the reductive adsorption effect of Cr(VI) on FP-nZVI was better explained using a quadratic model containing the interaction parameters, and the obtained quadratic equations were as follows.
Cr(VI) removal = 37.12 − 1.40*A − 1.09*B − 2.55*C − 0.88*AB + 0.61*AC + 3.55*BC − 2.15*A2 − 4.19*B2 − 3.37*C2
where A is the Cr(VI) initial concentration, B is the flow rate, and C is the pH value.
An analysis of variance was conducted on the second-order model, and the results are presented in Table 4. With an F-value of 93.92 and a p-value less than 0.05, the model and all its terms are statistically significant [77]. This means that the initial concentration of Cr(VI), pH, and flow rate have a significant influence on the experimental results. The R2 and adj.R2 of the model are 0.9812 and 0.9526, respectively, suggesting that the model has a good fit [78]. The fitting situation between the experimental values and the model–predicted values can be visually compared in Figure 7. The Lack-of-Fit F-value is 0.55, indicating that the lack-of-fit factors have an insignificant impact on the model. There is a 67.55% probability that an F-value higher than the current level of 93.92 may occur due to noise interference [79]. However, based on a comprehensive assessment of various indicators, the model remains stable and reliable overall and can effectively predict and analyze the experimental results.
The 3D surface maps were plotted to observe the interactions of the independent variables, as shown in Figure 8, Figure 9 and Figure 10. It can be observed that the surfaces of the plotted images are continuously varying and of different shapes, which better describes the different degrees of nonlinear interactions between the independent variables.
The interaction of chromium solution concentration and pH on chromium removal is shown in Figure 8. It can be observed that at any fixed pH, the removal rate showed a small increasing trend from 10 mg/L to 20 mg/L with increasing concentration and was at a high level, while the removal rate showed a large decreasing trend when the concentration increased from 20 mg/L to 30 mg/L. This is mainly due to the fact that at a concentration of 10 mg/L, the smaller concentration gives the chromium ion and FP-nZVI material sufficient reaction time, while the lower chromium solution concentration makes the reflection time longer, and the FP-nZVI material still maintains a certain reduction and adsorption capacity after the rapid penetration period, which makes the overall reaction time of the column system longer and the calculated removal rate slightly decreases compared with 20 mg/L. At a chromium concentration of 30 mg/L, the larger chromium concentration caused the FP-nZVI material to penetrate in a faster time compared to the other two concentrations, and a large amount of Cr(VI) at high concentrations did not have time to react with FP-nZVI for adsorption, and the adsorption sites were occupied quickly, and the nZVI was reduced by a more rapid reaction, making the calculated removal rate lower. Secondly, it can be observed that the removal rate shows a decreasing trend with the gradual increase of pH at any fixed concentration. This phenomenon is due to the fact that chromium ions are easily bound by hydroxide in an alkaline environment, which affects the reduction and adsorption of Cr(VI) with FP-nZVI, resulting in a decrease in the removal rate.
The interaction between chromium solution concentration and influent flow rate on chromium removal is shown in Figure 9, where it can be observed that the removal rate tends to increase with decreasing influent flow rate at any fixed concentration, and the Cr(VI) removal rate was higher. When the inlet flow rate increased to 5 mL/min, the faster inlet flow rate made the FP-nZVI material too late to adsorb and react with chromium ions, which made the material adsorption and reaction sites saturated rapidly, resulting in a faster penetration rate and a relatively low overall removal rate. Secondly, when the influent flow rate was controlled at a fixed value, the Cr(VI) removal rate also showed higher at low Cr(VI) concentrations and lower at high Cr(VI) concentrations.
The interaction between pH and influent flow rate on chromium removal is shown in Figure 10. It can be observed that when controlling any variable of pH or influent flow rate, the removal rate showed a similar pattern as above, i.e., the removal rate of Cr(VI) was higher under acidic conditions compared to alkaline conditions, and the removal rate of Cr(VI) was higher at lower influent flow rates compared to higher flow rates.

3.3. ANN Evaluation

The L-M backpropagation algorithm was used to conduct experiments on different numbers of hidden layer neurons. By adjusting the network parameters, a three-layer ANN model was established based on 17 sets of experimental data to obtain the optimal structure that is suitable for the experimental results. To develop and train the model, all 17 datasets underwent random division. Specifically, they were split into a training set, a validation set, and a test set following a ratio of 11:3:3. After multiple rounds of training, it was found that when the number of hidden layer neurons was 8, the model had good fitting performance, and the coefficient of determination R2 reached 0.9937. The regression plot of the model depicts the linear association between the actual and the predicted values of the ANN model during training, validation, testing, and for the entire dataset. As shown in Figure 11, all experimental results fall on or are close to the parity line, and the R2 value of each dataset is above 0.99, which well reflects the high consistency and correlation between the ANN model and the experimental results. Secondly, by comparing the predicted values of the model with the actually obtained experimental values, it was found that the predicted values fit well with the actual values. The comparison between the predicted values and the actual values obtained by the model is shown in Figure 12.
Figure 13a shows the relationship between the mean squared error (MSE) and the number of epochs of the ANN model. At the 4th training epoch, the training stopped, and the validation set achieved the best performance with an MSE of 0.0060782, which is acceptable and significantly lower than those of the validation and test sets, indicating that the model fits well on the training set.
Figure 13b shows the curves of the validation checks, damping factor Mu, and gradient changing with the number of training epochs during the training process of the ANN model. At the 4th epoch, the Gradient was 1.1773 × 10⁻⁶, which indicates that the change of the loss function tends to be gentle under the current parameters, and the model is approaching convergence. The damping factor Mu was 1 × 10⁻⁷, and its change conforms to the convergence characteristics of the Levenberg–Marquardt algorithm. The Validation Checks value was 0, indicating that the performance of the validation set did not deteriorate continuously in the current epoch, and the training process was relatively stable.
Figure 13c shows an error histogram with 20 bins, presenting the error distributions of the training set, validation set, and test set. Most of the error samples in the training set are concentrated near zero error, indicating that the model has a high degree of fitting to the training data. The error distributions of the validation set and test set are more dispersed compared to the training set, but there is still a certain concentration trend, indicating that although there are some errors when the model processes new data, the overall prediction direction is relatively accurate. This may be due to the small size of the dataset, which is also consistent with relevant literature [80].

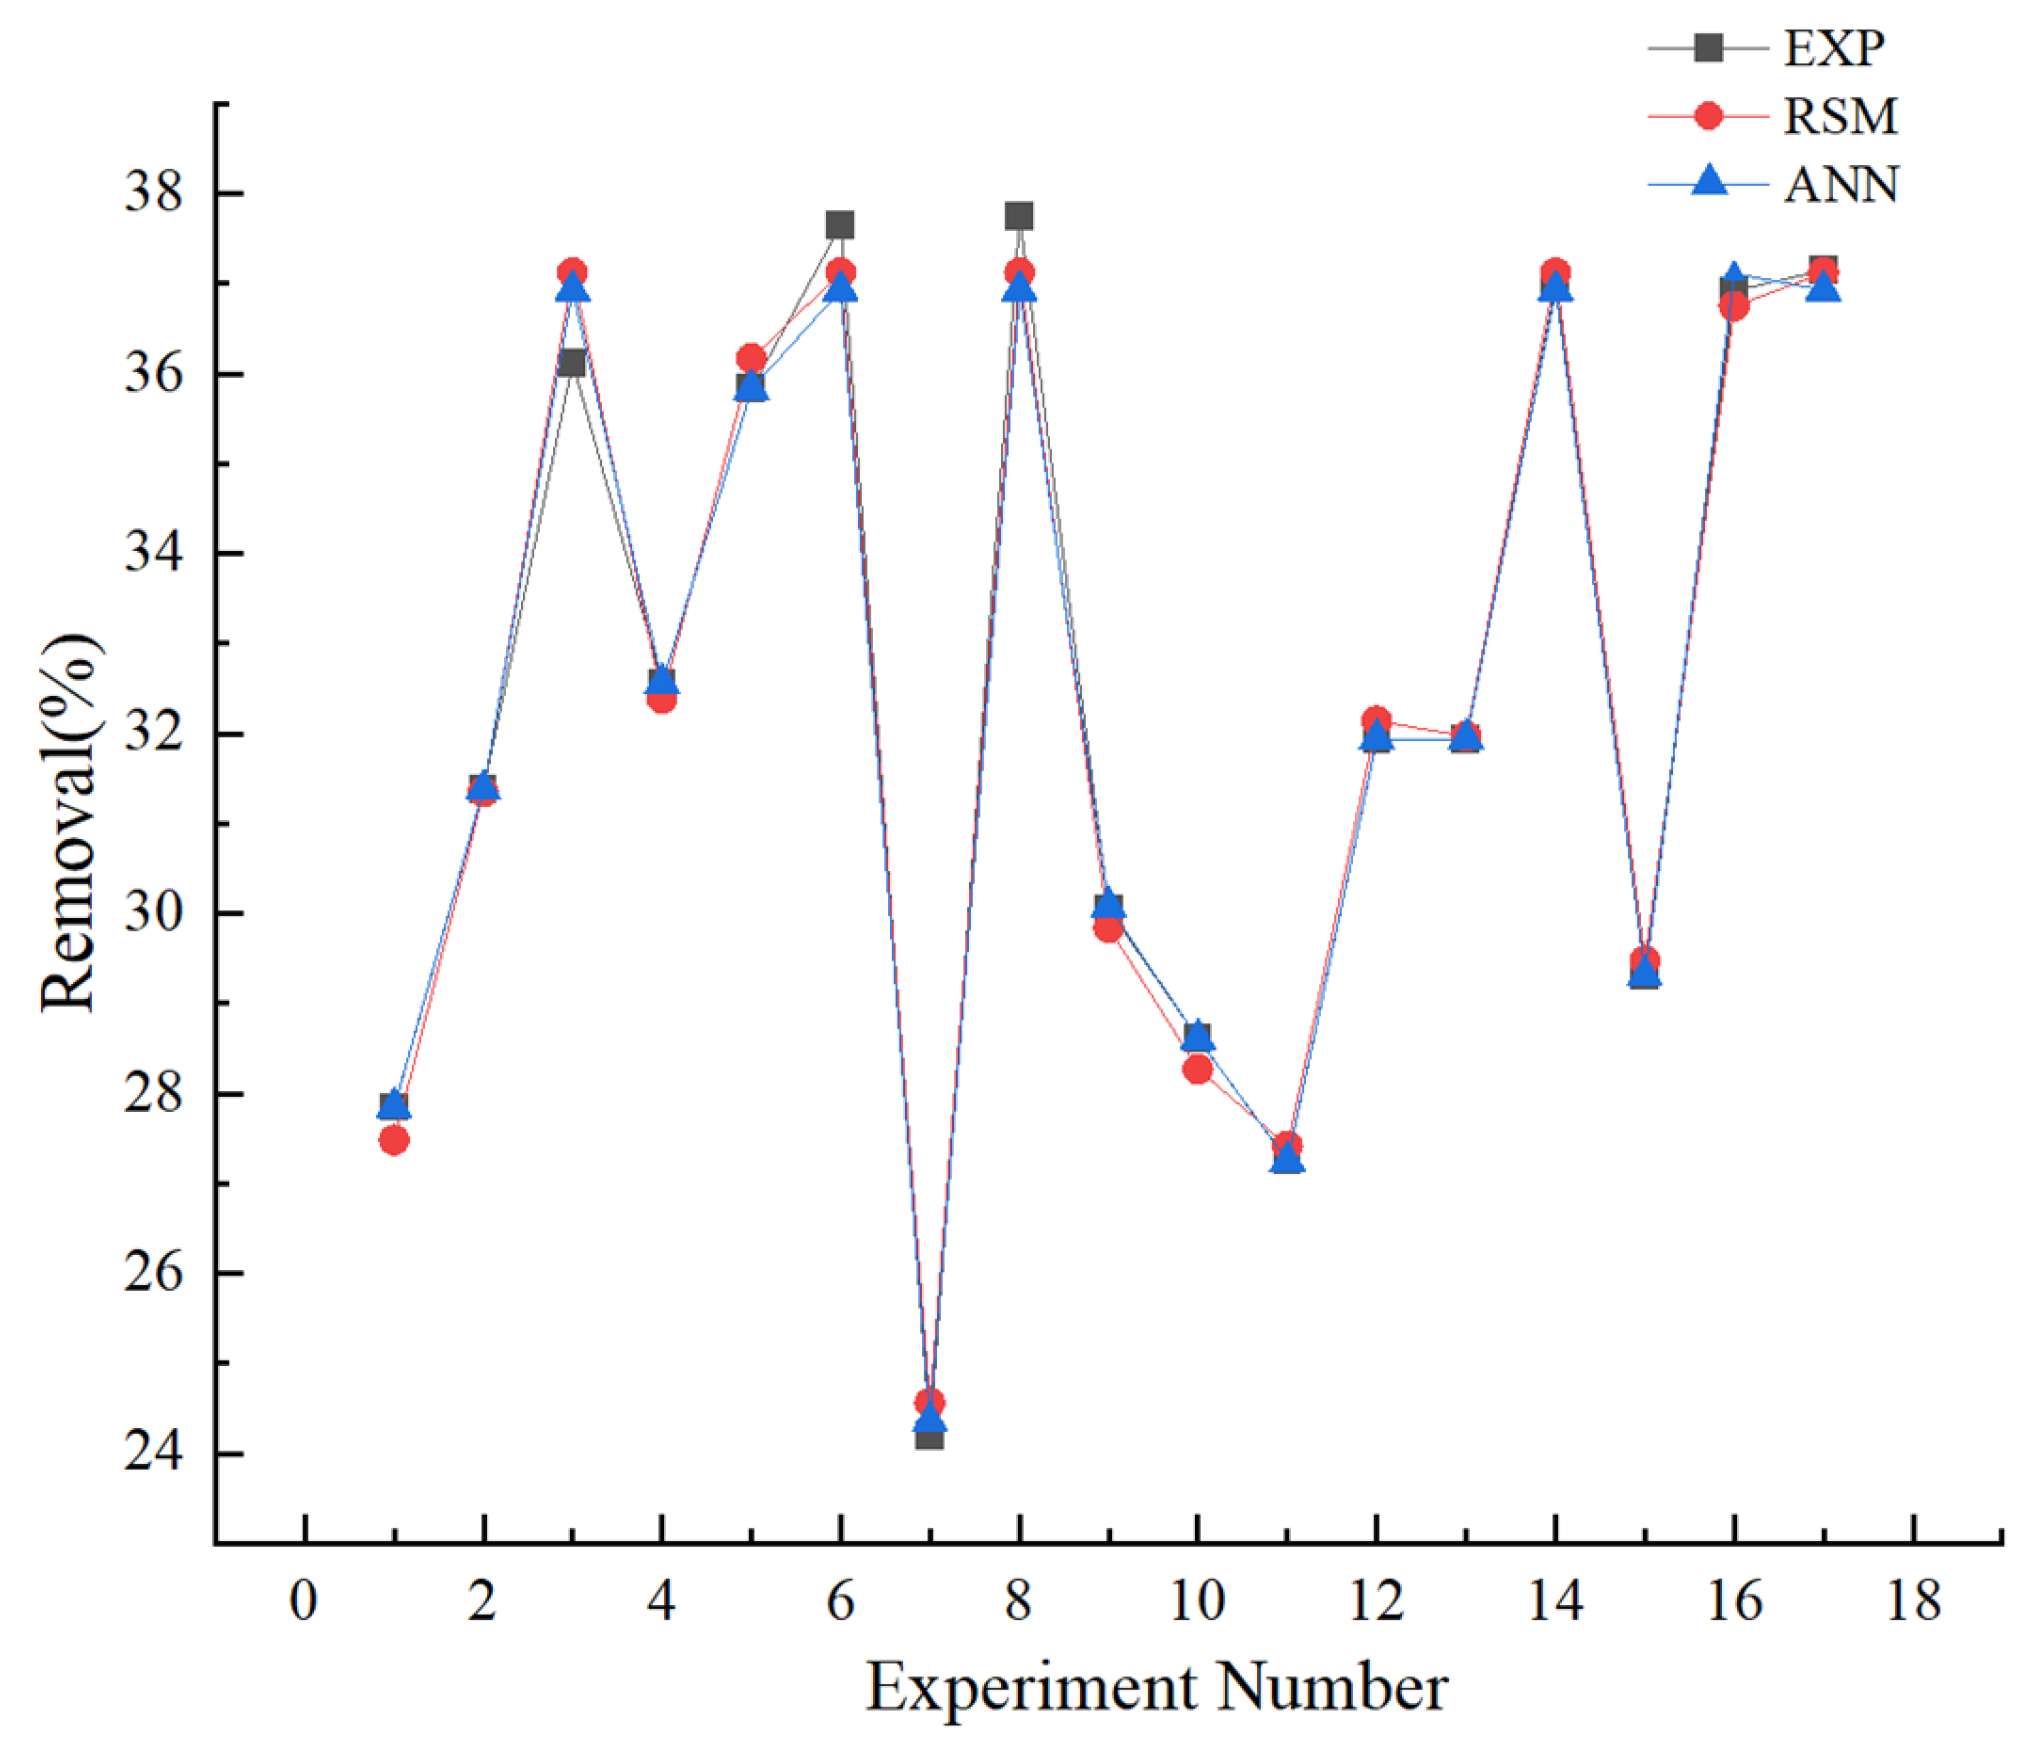
3.4. Comparison of RSM and ANN

The ANN and the RSM were employed for the study of Cr(VI) removal by the FP-nZVI material. The predicted removal rates were compared with the experimental values, and the results are shown in Figure 14. The predicted data of both models have a good correlation with the actual data, but the ANN model performs better. As can be seen from Table 5, the ANN model has a higher R2 value. The mean squared error (MSE) of the ANN model is 0.1146, and the root mean squared error (RMSE) is 0.3385, which are much lower than those of the RSM model, indicating that the deviation between its predicted values and the actual values is small and the fluctuation is low. The mean absolute percentage error (MAPE) is 0.4903, which is significantly lower than 0.8895 of the RSM model, suggesting that the proportion of the prediction error in the actual value is small and meets the requirements of high-precision prediction. The mean absolute error (MAE) is 0.1760, the average absolute deviation (AAD) is 0.4903, and the standard error of prediction (SEP) is 1.0399, all of which are at a relatively low level, highlighting the characteristics of low error and high stability of this model.
Related studies have shown that the ANN model overcomes the limitation of the RSM, which only assumes a quadratic nonlinear correlation because the ANN model itself can capture almost any complex nonlinear process [81]. This is also related to the nature of the model itself. The ANN can better imitate the human brain to learn the properties of the dataset and generalize the complex relationship between the actual response and the predicted response [82]. Similar findings have also been reported in related studies. For example, Kim et al. [83] constructed a model for the NOx removal system in an LNG receiving terminal, and Hamza et al. [84] used MIL-53(Al) as an adsorbent for the removal of dicamba and MCPA. In these cases, although we used different RSM designs (Box-Behnken Design (BDD) and Central Composite Design (CDD)), the results all showed that the artificial neural network provided more accurate predictions with smaller errors compared to the response surface methodology model.
Although the ANN model has obvious advantages, it still has limitations in practical applications. When the dimensionality of variables is low, and the observed data are scarce, the data-driven ANN model struggles to fully extract data features during the development and training phases. The model converges slowly, requiring repeated parameter adjustments and multiple training sessions. This significantly increases the time consumption and highlights the gap between theory and practice. Therefore, improving this issue requires the collective attention of the academic community to further promote the wide application and optimization of the ANN model in real-world scenarios.

4. Conclusions and Suggestions

In this research, cellulose filter paper, which is inexpensive, environmentally friendly, and biodegradable, was utilized to support nZVI. The FP-nZVI was successfully prepared, which effectively improved the dispersibility of the nZVI. Column experiments for the removal of Cr(VI) were carried out using FP-nZVI. This composite material demonstrated outstanding performance in removing Cr (VI) within a flow system. Subsequently, the RSM was employed for simulation and prediction, and RSM demonstrated good simulation performance. Based on the column experiments and response surface optimization tests, an ANN model was developed and tuned. A comparative analysis showed that both models were in good agreement with the experimental data. However, compared with RSM, the ANN model had a higher R2 value, and key indicators such as MSE, RMSE, MAE, MAPE, AAD, and SEP were all smaller than those of RSM. It performed better in terms of prediction error, value fluctuation, and closeness to the actual values. The validation set had excellent performance, the validation checks value was 0, the gradient and damping factor converged, and the error distribution of the test set was concentrated without over-fitting. Therefore, it could simulate the Cr(VI) removal process more accurately.
This research offers a novel material for the removal of Cr (VI) pollution. RSM and ANN overcome the drawbacks of the traditional single-factor variable control method, improve the experimental efficiency and model prediction accuracy, and optimize the prediction of the Cr(VI) removal process. However, this study also has certain limitations: (1) The cellulose filter paper is in the form of a thin sheet, and its strength decreases to a certain extent after treating chromium pollution, which affects its reusability to some degree. (2) This experiment was conducted under artificially set conditions in the laboratory without taking into account the hydrogeological conditions and hydrochemical characteristics in the field. (3) The scale of the experiment is small, and there is still a certain gap from industrial application. In view of the above-mentioned deficiencies, the following suggestions are put forward: (1) Improve the structural form of the cellulose filter paper. On the premise of ensuring its adsorption performance and structural characteristics, enhance its strength and increase its reusability. (2) In the follow-up, it is advisable to consider combining the hydrogeological conditions and hydrochemical characteristics of the actual polluted site to carry out pilot-scale experiments. (3) Increase the scale of the pilot-scale experiments, optimize the experimental process flow, establish a response model between the treatment rate/treatment capacity and experimental materials, pollutant concentration, pH value, anions and cations, and hydrodynamic conditions, conduct a comprehensive evaluation of the treatment effect, obtain the key treatment parameters for large-scale application, and form a treatment process applicable to industrial applications.

Author Contributions

Z.R.: conceptualization, methodology, resources, supervision, writing—reviewing and editing, and project administration. Z.L.: Methodology, investigation, data curation, writing original draft, formal analysis. H.T.: investigation, writing—reviewing and editing. L.Y.: project administration. J.Z.: project administration. Q.J.: conceptualization, resources, funding acquisition. All authors have read and agreed to the published version of the manuscript.

Funding

This research was sponsored by the National Natural Science Foundation of China for Young Scientists (Grant No. 41907176) and the Special Project of Central Government Guiding Local Scientific and Technological Development in Ningxia Hui Autonomous Region in 2024 (Grant No. 2024FRD05070).

Data Availability Statement

Data is contained within the article.

Acknowledgments

We would like to thank all the participants.

Conflicts of Interest

The authors declare that they have no known competing financial interests or personal relationships that could have appeared to influence the work reported in this paper.

References

  1. Dotaniya, M.L.; Thakur, J.K.; Meena, V.D.; Jajoria, D.K.; Rathor, G. Chromium pollution: A threat to environment—A review. Agric. Rev. 2014, 35, 153. [Google Scholar] [CrossRef]
  2. Li, N.; Jiang, J.; Xu, Y.; Pan, H.; Luo, X.; Hu, Y.; Cao, J. Insoluble carbonaceous materials as electron shuttles enhance the anaerobic/anoxic bioremediation of redox pollutants: Recent advances. Chin. Chem. Lett. 2022, 33, 71–79. [Google Scholar] [CrossRef]
  3. Wang, Y.-P.; Liu, Y.-L.; Tian, S.-Q.; Yang, J.-J.; Wang, L.; Ma, J. Straw biochar enhanced removal of heavy metal by ferrate. J. Hazard. Mater. 2021, 416, 126128. [Google Scholar] [CrossRef] [PubMed]
  4. Acharya, R.; Sillanpää, M.; Al-Farraj, S. A Comprehensive review on sequestration of aqueous Cr (VI) over graphene based adsorbents. J. Hazard. Mater. Adv. 2025, 18, 100670. [Google Scholar] [CrossRef]
  5. Hesamedini, S.; Bund, A. Formation of Cr(VI) in cobalt containing Cr(III)-based treatment solution. Surf. Coat. Technol. 2018, 334, 444–449. [Google Scholar] [CrossRef]
  6. Tu, Y.; Wang, J.; Huang, Y.; Deng, H.; Liu, X.; Lv, J. Transformational fixation of Cr(VI) during Microwave-enhanced reduction of soil iron minerals by tea polyphenols. J. Environ. Manag. 2025, 379, 124889. [Google Scholar] [CrossRef]
  7. Nizam, T.; Joseph, A.; Krishnan, R.R. Sol-gel derived bismuth-doped nickel ferrite: A promising adsorbent to tackle Cr(VI) pollution—Insights into the thermodynamics, kinetics, and isotherms. J. Alloys Compd. 2025, 1021, 179413. [Google Scholar] [CrossRef]
  8. Chen, Z.-F.; Guan, X.; Zhao, Y.-S. Morphology analysis of hexavalent chromium reduction to trivalent chromium with syrup under different pH conditions. Appl. Water Sci. 2019, 9, 187. [Google Scholar] [CrossRef]
  9. Li, T.; Huang, Z.; Hu, M.; Hu, Y.; Quan, K.; Zhou, M.; Chen, Y.; Fu, S. Highly effective adsorption, porous and charged CAP@Ui0-66-NH2@PPy hybrid fibrous membrane based on MOFs for Cr (VI) removal from wastewater. Chem. Eng. J. 2025, 509, 161213. [Google Scholar] [CrossRef]
  10. Costa, M. Toxicity and carcinogenicity of Cr(VI) in animal models and humans. Crit. Rev. Toxicol. 1997, 27, 431–442. [Google Scholar] [CrossRef]
  11. Zou, W.; Zhou, F.; Zhang, Z.; Ruan, Q.; Zhou, J.; Li, Z.; Chen, G.; Chen, Z. Unveiling the Distinctive characterization and adsorption behaviors of MnFe2O4 hydrochar/pyrochar composites for Cr(VI) removal. J. Environ. Chem. Eng. 2025, 13, 116052. [Google Scholar] [CrossRef]
  12. Mortazavian, S.; Murph, S.E.H.; Moon, J. Biochar Nanocomposite as an Inexpensive and Highly efficient carbonaceous adsorbent for hexavalent chromium removal. Materials 2022, 15, 6055. [Google Scholar] [CrossRef] [PubMed]
  13. Jamil, W.; Memon, Z.; Memon, S.Q.; Samon, M.K.; Taha, M.; Khan, K.M. Environmental friendly synthetic modification of amberlite XAD-2 resin for the removal of highly toxic hexavalent chromium from water. Acta Chim. Slov. 2020, 67, 260–269. [Google Scholar] [CrossRef] [PubMed]
  14. Yan, X.; Liu, X.; Zhang, M.; Wang, J.; Zhong, J.; Ma, D.; Tang, C.; Hu, X. Lab-scale evaluation of the microbial bioremediation of Cr(VI): Contributions of biosorption, bioreduction, and biomineralization. Environ. Sci. Pollut. Res. 2021, 28, 22359–22371. [Google Scholar] [CrossRef]
  15. Li, J.; Fan, M.; Li, M.; Liu, X. Cr(VI) removal from groundwater using double surfactant-modified nanoscale zero-valent iron (nZVI): Effects of materials in different status. Sci. Total Environ. 2020, 717, 137112. [Google Scholar] [CrossRef]
  16. Fang, Y.; Wen, J.; Zhang, H.; Wang, Q.; Hu, X. Enhancing Cr(VI) reduction and immobilization by magnetic core-shell structured NZVI@MOF derivative hybrids. Environ. Pollut. 2020, 260, 114021. [Google Scholar] [CrossRef]
  17. Ren, Y.; Han, Y.; Lei, X.; Lu, C.; Liu, J.; Zhang, G.; Zhang, B.; Zhang, Q. A Magnetic ion exchange resin with high efficiency of removing Cr (VI). Colloids Surf. A Physicochem. Eng. Asp. 2020, 604, 125279. [Google Scholar] [CrossRef]
  18. Rivero, M.J.; Primo, O.; Ortiz, M.I. Modelling of Cr(VI) removal from polluted groundwaters by ion exchange. J. Chem. Technol. Biotechnol. 2004, 79, 822–829. [Google Scholar] [CrossRef]
  19. Roy Choudhury, P.; Majumdar, S.; Sahoo, G.C.; Saha, S.; Mondal, P. High pressure ultrafiltration CuO/Hydroxyethyl cellulose composite ceramic membrane for separation of Cr (VI) and Pb (II) from contaminated water. Chem. Eng. J. 2018, 336, 570–578. [Google Scholar] [CrossRef]
  20. El Gaayda, J.; Rachid, Y.; Titchou, F.E.; Barra, I.; Hsini, A.; Yap, P.-S.; Oh, W.-D.; Swanson, C.; Hamdani, M.; Akbour, R.A. Optimizing removal of chromium (VI) ions from water by coagulation process using central composite design: Effectiveness of grape seed as a green coagulant. Sep. Purif. Technol. 2023, 307, 122805. [Google Scholar] [CrossRef]
  21. Yang, Q.; Zhang, Z.; Dang, Z.; Li, F.; Zhang, L. Simultaneous redox transformation and removal of Cr(VI) and As(III) by polyethyleneimine modified magnetic mesoporous polydopamine nanocomposite: Insights into synergistic effects and mechanisms. J. Hazard. Mater. 2022, 439, 129581. [Google Scholar] [CrossRef] [PubMed]
  22. Zhou, S.; Li, T.; Tang, Y.; Luo, T.; Huang, D.; He, P.; Cai, M.; Gan, M. Insights into the mechanism of Cr(VI) removal by biogenic jarosite-biomass derived Fe-C material with anti-environmental interference performance. J. Anal. Appl. Pyrolysis 2025, 189, 107066. [Google Scholar] [CrossRef]
  23. Yi, L.; Chen, S.; Chen, Y. Intra/extracellular electron transfer and energy-dependent Cr(VI) efflux for gram-negative/positive bacteria mediated by PMo12. J. Hazard. Mater. 2025, 491, 137872. [Google Scholar] [CrossRef] [PubMed]
  24. Liu, Y.; Liu, C.; Peng, X.; Liang, Z.; Hou, S.; Chen, W.; Zhang, T. Modulating D-orbital electronic configuration of magnetic iron sulfide nanocrystals for maximized treatment efficiency of chromium-contaminated water. Water Res. 2025, 280, 123477. [Google Scholar] [CrossRef]
  25. He, H.; Qiu, S.; Yan, Z.; Shao, D.; Sun, L.; Yuan, X. Photoreduction of Cr(VI) to Cr(III) using reduced graphene oxide/CuOx composites. Mater. Chem. Phys. 2025, 338, 130645. [Google Scholar] [CrossRef]
  26. Fan, M.; Li, X.; Liu, L.; Yang, H.; Wu, M.; Yang, J. Synthesis, Characterization, and photocatalytic activity of a carboxymethyl cellulose sodium-based hybrid material for efficient degradation of hexavalent chromium. Int. J. Biol. Macromol. 2025, 306, 141536. [Google Scholar] [CrossRef]
  27. Wang, T.; He, J.; Lu, J.; Zhou, Y.; Wang, Z.; Zhou, Y. Adsorptive Removal of PPCPs from Aqueous Solution Using Carbon-Based Composites: A Review. Chin. Chem. Lett. 2022, 33, 3585–3593. [Google Scholar] [CrossRef]
  28. Karimi-Maleh, H.; Ayati, A.; Ghanbari, S.; Orooji, Y.; Tanhaei, B.; Karimi, F.; Sillanpää, M. Recent advances in removal techniques of Cr(VI) toxic ion from aqueous solution: A comprehensive review. J. Mol. Liq. 2021, 329, 115062. [Google Scholar] [CrossRef]
  29. Wołowiec, M.; Komorowska-Kaufman, M.; Pruss, A.; Rzepa, G.; Bajda, T. Removal of heavy metals and metalloids from water using drinking water treatment residuals as adsorbents: A review. Minerals 2019, 9, 487. [Google Scholar] [CrossRef]
  30. Ali, H.; Khan, E.; Ilahi, I. Environmental chemistry and ecotoxicology of hazardous heavy metals: Environmental persistence, toxicity, and bioaccumulation. J. Chem. 2019, 2019, 6730305. [Google Scholar] [CrossRef]
  31. Duwiejuah, A.B.; Abubakari, A.H.; Quainoo, A.K.; Amadu, Y. Review of Biochar properties and remediation of metal pollution of water and soil. J. Health Pollut. 2020, 10, 200902. [Google Scholar] [CrossRef] [PubMed]
  32. Zhou, Y.; Zhang, R.; Chen, K.; Zhao, X.; Gu, X.; Lu, J. Enhanced adsorption and photo-degradation of bisphenol a by β-cyclodextrin modified pine sawdust in an aquatic environment. J. Taiwan Inst. Chem. Eng. 2017, 78, 510–516. [Google Scholar] [CrossRef]
  33. Zhou, Q.; Li, D.; Wang, T.; Hu, X. Leaching of graphene oxide nanosheets in simulated soil and their influences on microbial communities. J. Hazard. Mater. 2021, 404, 124046. [Google Scholar] [CrossRef] [PubMed]
  34. Deng, C.; Tang, Q.; Yang, Z.; Dai, Z.; Cheng, C.; Xu, Y.; Chen, X.; Zhang, X.; Su, J. Effects of Iron oxide nanoparticles on phenotype and metabolite changes in hemp clones (Cannabis sativa L.). Front. Environ. Sci. Eng. 2022, 16, 134. [Google Scholar] [CrossRef]
  35. Ling, L.; Huang, X.; Zhang, W. Enrichment of precious metals from wastewater with core–shell nanoparticles of iron. Adv. Mater. 2018, 30, 1705703. [Google Scholar] [CrossRef]
  36. Ma, Z.; Cao, H.; Lv, F.; Yang, Y.; Chen, C.; Yang, T.; Zheng, H.; Wu, D. Preparation of nZVI embedded modified mesoporous carbon for catalytic persulfate to degradation of reactive black 5. Front. Environ. Sci. Eng. 2021, 15, 1–10. [Google Scholar] [CrossRef]
  37. Yang, Z.; Ma, Y.; Jing, Q.; Ren, Z. Comigration behavior of Cr(VI) and microplastics and remediation of microplastics-facilitated Cr(VI) transportation in saturated porous media. Polymers 2024, 16, 3271. [Google Scholar] [CrossRef]
  38. Shi, Y.; Yu, C.; Liu, M.; Lin, Q.; Lei, M.; Wang, D.; Yang, M.; Yang, Y.; Ma, J.; Jia, Z. One-pot synthesis of spherical nanoscale zero-valent iron/biochar composites for efficient removal of Pb(II). RSC Adv. 2021, 11, 36826–36835. [Google Scholar] [CrossRef]
  39. Yang, J.; Wang, S.; Xu, N.; Ye, Z.; Yang, H.; Huangfu, X. Synthesis of montmorillonite-supported nano-zero-valent iron via green tea extract: Enhanced transport and application for hexavalent chromium removal from water and soil. J. Hazard. Mater. 2021, 419, 126461. [Google Scholar] [CrossRef]
  40. Ma, B.; Yao, J.; Knudsen, T.Š.; Chen, Z.; Liu, B.; Zhao, C.; Zhu, X. Simultaneous removal of typical flotation reagent 8-hydroxyquinoline and Cr(VI) through heterogeneous fenton-like processes mediated by polydopamine functionalized ATP supported nZVI. J. Hazard. Mater. 2022, 424, 126698. [Google Scholar] [CrossRef]
  41. Lubphoo, Y.; Chyan, J.M.; Grisdanurak, N.; Liao, C.H. Influence of Pd–Cu on nanoscale zero–valent iron supported for selective reduction of nitrate. J. Taiwan Inst. Chem. Eng. 2016, 59, 285–294. [Google Scholar] [CrossRef]
  42. Taghizadeh, S.M.; Berenjian, A.; Taghizadeh, S.; Ghasemi, Y.; Taherpour, A.; Sarmah, A.K.; Ebrahiminezhad, A. One-put green synthesis of multifunctional silver iron core-shell nanostructure with antimicrobial and catalytic properties. Ind. Crops Prod. 2019, 130, 230–236. [Google Scholar] [CrossRef]
  43. Chang, C.; Lian, F.; Zhu, L. Simultaneous Adsorption and Degradation of γ-HCH by nZVI/Cu Bimetallic Nanoparticles with Activated Carbon Support. Environ. Pollut. 2011, 159, 2507–2514. [Google Scholar] [CrossRef]
  44. Di, L.; Chen, X.; Lu, J.; Zhou, Y.; Zhou, Y. Removal of heavy metals in water using nano zero-valent iron composites: A review. J. Water Process Eng. 2023, 53, 103913. [Google Scholar] [CrossRef]
  45. Yu, Q.; Guo, J.; Muhammad, Y.; Li, Q.; Lu, Z.; Yun, J.; Liang, Y. Mechanisms of enhanced hexavalent chromium removal from groundwater by sodium carboxymethyl cellulose stabilized zerovalent iron nanoparticles. J. Environ. Manag. 2020, 276, 111245. [Google Scholar] [CrossRef]
  46. Ren, L.; Dong, J.; Chi, Z.; Huang, H. Reduced graphene oxide-nano zero value iron (rGO-nZVI) micro-electrolysis accelerating Cr(VI) removal in aquifer. J. Environ. Sci. 2018, 73, 96–106. [Google Scholar] [CrossRef]
  47. Liu, X.; Zhang, S.; Zhang, X.; Guo, H.; Cao, X.; Lou, Z.; Zhang, W.; Wang, C. A Novel lignin hydrogel supported nZVI for efficient removal of Cr(VI). Chemosphere 2022, 301, 134781. [Google Scholar] [CrossRef]
  48. Yu, P.; Yu, H.; Sun, Q.; Ma, B. Filter paper supported nZVI for continuous treatment of simulated dyeing wastewater. Sci. Rep. 2019, 9, 11322. [Google Scholar] [CrossRef]
  49. Kamal, T.; Khan, S.B.; Asiri, A.M. Synthesis of zero-valent Cu nanoparticles in the chitosan coating layer on cellulose microfibers: Evaluation of azo dyes catalytic reduction. Cellulose 2016, 23, 1911–1923. [Google Scholar] [CrossRef]
  50. Ren, Z.; Tang, H.; Li, H.; Jing, Q. Column experimental study on the removal of hexavalent chromium from water by modified cellulose filter paper loaded with nano zero-valent iron. J. Water Process Eng. 2024, 59, 104920. [Google Scholar] [CrossRef]
  51. Turan, N.G.; Mesci, B.; Ozgonenel, O. Response surface modeling of Cu(II) removal from electroplating waste by adsorption: Application of Box–Behnken experimental design. CLEAN—Soil Air Water 2013, 41, 304–312. [Google Scholar] [CrossRef]
  52. Raja, S.; Murty, V.R. Optimization of aqueous two-phase systems for the recovery of soluble proteins from tannery wastewater using response surface methodology. J. Eng. 2013, 2013, 217483. [Google Scholar] [CrossRef]
  53. Khan, S.A.; Hussain, D.; Abbasi, N.; Khan, T.A. Deciphering the adsorption potential of a functionalized green hydrogel nanocomposite for aspartame from aqueous phase. Chemosphere 2022, 289, 133232. [Google Scholar] [CrossRef]
  54. Ravinuthala, S.; Settu, S. Multi-response parametric optimization and biofilm studies of low-cost ceramic microbial fuel cell for dairy wastewater treatment. Bioresour. Technol. Rep. 2025, 29, 102029. [Google Scholar] [CrossRef]
  55. Kumari, B.; Tiwary, R.K.; Yadav, M. Non Linear Regression Analysis and RSM Modeling for Removal of Cr (VI) from Aqueous Solution Using PANI@WH Composites. Mater. Chem. Phys. 2022, 290, 126457. [Google Scholar] [CrossRef]
  56. Slamani, I.; Bengharez, Z.; Boudouaia, N.; Bendaoudi, A.A.; Jellali, S.; Benhafsa, F.M.; Mahmoudi, H.; Benhadria, N.; Guemra, K.; Jeguirim, M. Cross-linked chitosan/H-ZSM-5 zeolite composite film for chromium removal from aqueous solutions: Optimization using response surface methodology and adsorption mechanism assessment. Environ. Sci. Pollut. Res. 2025. [Google Scholar] [CrossRef]
  57. Saawarn, B.; Mahanty, B.; Hait, S. Adsorption of perfluorooctanoic acid from aqueous matrices onto chitosan-modified magnetic biochar: Response surface methodology-based modeling, performance, and mechanism. Environ. Pollut. 2025, 368, 125734. [Google Scholar] [CrossRef]
  58. Bingöl, D.; Hercan, M.; Elevli, S.; Kılıç, E. Comparison of the results of response surface methodology and artificial neural network for the biosorption of lead using black cumin. Bioresour. Technol. 2012, 112, 111–115. [Google Scholar] [CrossRef]
  59. Wairokpam, R.; Ningthoujam, S.; Kumar, P.A. Artificial neural network (ANN) based prediction and modeling of Fe(II) adsorption from contaminated groundwater using deccan hemp stem-derived activated carbon. Int. J. Environ. Res. 2025, 19, 61. [Google Scholar] [CrossRef]
  60. Shekoohiyan, S.; Dariyan, F.S.; Mahdavianpour, M.; Pourakbar, M.; Aghayani, E. Comparison of response surface method and artificial neural networks in predicting formaldehyde and methanol removal using moving bed sequential batch reactor (MBSBR) and fixed bed sequential batch reactor (FBSBR): Process optimization and kinetic study. Sep. Purif. Technol. 2025, 363, 132097. [Google Scholar] [CrossRef]
  61. Akanbi, T.E.; Ajayi, O.; Yusuff, A.S.; Obada, D. Modeling and optimization of photocatalytic degradation of methylene blue via TiO2-CuO/HAp catalyst: The use of response surface methodology and artificial neural network. Asian J. Chem. Sci. 2025, 15, 111–131. [Google Scholar] [CrossRef]
  62. Neishaboori, F.M.; Sohrabi, M.R.; Motiee, F.; Davallo, M. Optimization and modeling of simultaneous removal of reactive Violet 5 and Acid Red 98 using bimetallic copper-zero-valent iron nanoparticles supported on biopolymer chitosan based on a central composite design and artificial neural network. J. Polym. Environ. 2025, 33, 2402–2424. [Google Scholar] [CrossRef]
  63. Da Costa, M.F.P.; Araújo, R.D.S.; Silva, A.R.; Pereira, L.; Silva, G.M.M. Predictive artificial neural networks as applied tools in the remediation of dyes by adsorption—A review. Appl. Sci. 2025, 15, 2310. [Google Scholar] [CrossRef]
  64. Kumari, S.; Agarwal, S.; Kumar, M.; Sharma, P.; Kumar, A.; Hashem, A.; Alotaibi, N.H.; Abd-Allah, E.F.; Garg, M.C. An exploration of RSM, ANN, and ANFIS models for methylene blue dye adsorption using oryza sativa straw biomass: A comparative approach. Sci. Rep. 2025, 15, 2979. [Google Scholar] [CrossRef]
  65. Ahdour, A.; Douihi, N.; Taoufyq, A.; Aneflous, L.; Bakiz, B.; Benlhachemi, A. Electrocatalytic and photoelectrocatalytic degradation of tetracycline using BaHPO4/SSA photoanode: Insights from BBD-RSM and CCD-RSM experimental designs. Surf. Interfaces 2025, 58, 105874. [Google Scholar] [CrossRef]
  66. Nezhad, P.A.; Dabirian, F.; Derakhshan, A.A.; Rajabi, L.; Heydari, S.; Rostami, A. Optimized electrospun schiff-base Alumoxane/PAN nanofibers for lead and cadmium adsorption: Characterization & RSM analysis. J. Polym. Res. 2025, 32, 51. [Google Scholar] [CrossRef]
  67. Tunali Akar, S.; Rüstemoğlu, S.; Turkyilmaz, S.; Sayin, F.; Akar, T. ANN-Assisted comprehensive screening of silica gel-alunite composite sorbent system for efficient adsorption of toxic nickel ions: Batch and continuous mode water treatment applications. Chemosphere 2025, 373, 144127. [Google Scholar] [CrossRef]
  68. Asl, S.H.; Ahmadi, M.; Ghiasvand, M.; Tardast, A.; Katal, R. Artificial Neural Network (ANN) Approach for Modeling of Cr(VI) Adsorption from Aqueous Solution by Zeolite Prepared from Raw Fly Ash (ZFA). J. Ind. Eng. Chem. 2013, 19, 1044–1055. [Google Scholar] [CrossRef]
  69. Amini-Badr, A.; Behnajady, M.A. Photocatalytic removal of cefazolin in a photoreactor packed with TiO2-P25 nanoparticles Supported on Glass Beads: An Artificial Neural Network Modeling. Int. J. Environ. Anal. Chem. 2024, 104, 5713–5731. [Google Scholar] [CrossRef]
  70. Li, L.; Hu, J.; Shi, X.; Fan, M.; Luo, J.; Wei, X. Nanoscale zero-valent metals: A review of synthesis, characterization, and applications to environmental remediation. Environ. Sci. Pollut. Res. 2016, 23, 17880–17900. [Google Scholar] [CrossRef]
  71. Arshadi, M.; Abdolmaleki, M.K.; Eskandarloo, H.; Azizi, M.; Abbaspourrad, A. Synthesis of highly monodispersed, stable, and spherical NZVI of 20–30 Nm on filter paper for the removal of phosphate from wastewater: Batch and column study. ACS Sustain. Chem. Eng. 2018, 6, 11662–11676. [Google Scholar] [CrossRef]
  72. Wang, X.; Wang, T.; Ma, J.; Liu, H.; Ning, P. Synthesis and characterization of a new hydrophilic boehmite-PVB/PVDF blended membrane supported nano zero-valent iron for removal of Cr(VI). Sep. Purif. Technol. 2018, 205, 74–83. [Google Scholar] [CrossRef]
  73. Meraj, A.; Jawaid, M.; Karim, Z.; Awayssa, O.; Fouad, H.; Singh, B. Characterization of Carboxymethyl microcrystalline cellulose derived from sustainable kenaf fiber. Carbohydr. Polym. Technol. Appl. 2025, 10, 100745. [Google Scholar] [CrossRef]
  74. García-Vargas, M.; Munguía-Quintero, M.F.; Alcaraz-Cienfuegos, J.; Rosas-Aburto, A.; Valdivia-López, M.D.L.Á.; Hernández-Luna, M.G.; Vivaldo-Lima, E. Synthesis, characterization and evaluation of cellulose-graft-poly(4-vinylpirydine), using cellulose from a new pretreatment process, for heavy metal removal from wastewater. Int. J. Biol. Macromol. 2025, 284, 137986. [Google Scholar] [CrossRef]
  75. Duchemin, B.; Le Corre, D.; Leray, N.; Dufresne, A.; Staiger, M.P. All-cellulose composites based on microfibrillated cellulose and filter paper via a NaOH-urea solvent system. Cellulose 2016, 23, 593–609. [Google Scholar] [CrossRef]
  76. Wang, Z.; Chen, G.; Wang, X.; Li, S.; Liu, Y.; Yang, G. Removal of hexavalent chromium by bentonite supported organosolv lignin-stabilized zero-valent iron nanoparticles from wastewater. J. Clean. Prod. 2020, 267, 122009. [Google Scholar] [CrossRef]
  77. Hamid, H.A.; Jenidi, Y.; Thielemans, W.; Somerfield, C.; Gomes, R.L. Predicting the capability of carboxylated cellulose nanowhiskers for the remediation of copper from water using response surface methodology (RSM) and artificial neural network (ANN) models. Ind. Crops Prod. 2016, 93, 108–120. [Google Scholar] [CrossRef]
  78. Bayuo, J.; Abukari, M.A.; Pelig-Ba, K.B. Optimization using central composite design (CCD) of response surface methodology (RSM) for biosorption of hexavalent chromium from aqueous media. Appl. Water Sci. 2020, 10, 135. [Google Scholar] [CrossRef]
  79. Vinayagam, R.; Dave, N.; Varadavenkatesan, T.; Rajamohan, N.; Sillanpää, M.; Nadda, A.K.; Selvaraj, R. Artificial Neural Network and Statistical Modelling of Biosorptive Removal of Hexavalent Chromium Using Macroalgal Spent Biomass. Chemosphere 2022, 296, 133965. [Google Scholar] [CrossRef]
  80. de Luna, M.D.G.; Sablas, M.M.; Hung, C.M.; Chen, C.W.; Garcia-Segura, S.; Dong, C.D. Modeling and optimization of imidacloprid degradation by catalytic percarbonate oxidation using artificial neural network and box-behnken experimental design. Chemosphere 2020, 251, 126254. [Google Scholar] [CrossRef]
  81. Geyikçi, F.; Kılıç, E.; Çoruh, S.; Elevli, S. Modelling of lead adsorption from industrial sludge leachate on red mud by using RSM and ANN. Chem. Eng. J. 2012, 183, 53–59. [Google Scholar] [CrossRef]
  82. Shanmugaprakash, M.; Sivakumar, V. Development of experimental design approach and ANN-based models for determination of Cr(VI) ions uptake rate from aqueous solution onto the solid biodiesel waste residue. Bioresour. Technol. 2013, 148, 550–559. [Google Scholar] [CrossRef] [PubMed]
  83. Kim, Z.; Shin, Y.; Yu, J.; Kim, G.; Hwang, S. Development of NOx removal process for LNG evaporation system: Comparative assessment between response surface methodology (RSM) and artificial neural network (ANN). J. Ind. Eng. Chem. 2019, 74, 136–147. [Google Scholar] [CrossRef]
  84. Isiyaka, H.A.; Jumbri, K.; Sambudi, N.S.; Zango, Z.U.; Fathihah Abdullah, N.A.; Saad, B.; Mustapha, A. Adsorption of dicamba and MCPA onto MIL-53(Al) metal–organic framework: Response surface methodology and artificial neural network model studies. RSC Adv. 2020, 10, 43213–43224. [Google Scholar] [CrossRef]
Figure 1. Diagram of the sand column experiment device.
Water 17 01211 g001
Figure 2. Schematic diagram of the breakthrough curve.
Water 17 01211 g002
Figure 3. Schematic illustration of the structure of an artificial neural network.
Water 17 01211 g003
Figure 4. (a,b) SEM images of untreated filter paper; (c) SEM image of unmodified nano zero-valent iron; (d,e) SEM images of the composite FP-nZVI.
Water 17 01211 g004
Figure 5. FTIR image of FP and FP-nZVI.
Water 17 01211 g005
Figure 6. XRD characterization of FP and FP-nZVI.
Water 17 01211 g006
Figure 7. Scatter plot of actual and predicted values of Cr(VI) removal by FP-nZVI.
Water 17 01211 g007
Figure 8. The 3D response surface plot for the pH and Cr(VI) concentration.
Water 17 01211 g008
Figure 9. The 3D response surface plot for the flow rate and Cr(VI) concentration.
Water 17 01211 g009
Figure 10. The 3D response surface plot for the pH and flow rate.
Water 17 01211 g010
Figure 11. Regression plots of ANN model for Cr(VI) removal using FP-nZVI.
Water 17 01211 g011
Figure 12. Comparison between predicted and actual value under ANN.
Water 17 01211 g012
Figure 13. (a) MSE of the training, test, and validation datasets; (b) Curves showing the changes of validation checks, damping factor Mu, and gradient with the number of training epochs; (c) Error histogram.
Water 17 01211 g013
Figure 14. Comparison of experimental values with predicted values obtained by RSM and ANN model for Cr(VI) removal using FP-nZVI.
Water 17 01211 g014
Table 1. Factors and corresponding levels for experimental design optimization via BDD.
Factor Units Levels
−10+1
Flow rate mL/min135
pH -357
Concentration of Cr(VI)mg/L102030
Table 2. Cr(VI) removal rate under optimized trivariate conditions when the amount of adsorbent is 0.38 g.
Experiment No.C0
(mg/L)
Q
(mL/min)
pHr
Experimental
(%)
r
RSM
(%)
r
ANN
(%)
1205327.8527.4827.85
2301531.3831.3531.38
3203536.1237.1236.93
4101532.5632.3932.56
5103335.8336.1735.83
6203537.6537.1236.93
7201724.1924.5624.36
8203537.7437.1236.93
9103730.0429.8430.08
10303728.6128.2728.61
11305527.2527.4227.25
12303331.9432.1431.94
13105531.9431.9731.94
14203536.9637.1236.93
15205729.3129.4829.31
16201336.9236.7537.11
17203537.1537.1236.93
Table 3. Various statistical parameters and their mathematical expressions.
Statistical ParameterMathematical Expression
Root Mean Square Error (RMSE) 1 n i = 1 n y i , e x p y i , p r e d 2
Mean square errors (MSE) 1 n i = 1 n y i , e x p y i , p r e d 2
Mean Absolute Percentage Error (MAPE) 100 % n i = 1 n y i , e x p y i , p r e d y i , e x p
Mean Absolute Error (MAE) 1 n i = 1 n y i , e x p y i , p r e d
Absolute Average Deviation (AAD) 1 n i = 1 n y i , e x p y i , p r e d y i , e x p 100
Standard Error of Prediction (SEP) R M S E y i , e x p ¯
Table 4. Anova for Response Surface Quadratic model of column system.
SourceSum of SquaresdfMean
Square
F
Value
Prob > F
Model288.27932.0393.92<0.0001significant
A-Cr(VI) concentration15.65115.6545.890.0003
B-Flow rate9.4619.4627.740.0012
C-pH51.97151.97152.38<0.0001
AB3.0813.089.030.0198
AC1.5111.514.440.0732
BC50.34150.34147.60<0.0001
A219.50119.5057.170.0001
B273.90173.90216.69<0.0001
C247.73147.73139.96<0.0001
Residual2.3970.34
    Lack of Fit0.7030.230.550.6755not significant
    Pure Error1.6940.42
Cor Total290.6616
R2 = 0.9918
Table 5. Comparison of statistical parameters of RSM and ANN.
Statistical ParametersRSMANN
R20.99180.9937
MSE0.14040.1146
RMSE0.37470.3385
MAE0.28740.1760
MAPE0.8895%0.4903%
AAD0.87950.4903
SEP1.15111.0399
Disclaimer/Publisher’s Note: The statements, opinions and data contained in all publications are solely those of the individual author(s) and contributor(s) and not of MDPI and/or the editor(s). MDPI and/or the editor(s) disclaim responsibility for any injury to people or property resulting from any ideas, methods, instructions or products referred to in the content.

