Abstract
This study evaluates the applicability of the InVEST (Integrated Valuation of Ecosystem Services and Tradeoffs) model for assessing wildfire-induced changes in water-related ecosystem services at a localized scale. Wildfires significantly alter hydrological processes by reducing vegetation cover, which in turn affects water-yield dynamics. To quantify these changes, we applied the InVEST annual water-yield model to a 4.95 km2 wildfire-affected area and validated its outputs against the physically based SWAT model. The study utilized Sentinel-2 imagery to create pre- and post-wildfire land cover maps, which served as key inputs for the InVEST model. The results showed a 7.05% increase in water yield after the wildfire. Validation using SWAT confirmed that InVEST could capture localized hydrological changes with accuracy. While InVEST simplifies hydrological processes by relying primarily on land cover data, it remains a valuable tool for rapid and low-resource assessments in wildfire-prone regions. This study highlights the potential of InVEST for rapid post-fire evaluations, offering a practical decision-support model for post-fire land and water resource management in the context of climate change.
1. Introduction
Ecosystem services are the diverse benefits humans derive from natural resources, fundamentally underpinned by the health of ecological processes [1,2]. According to the Millennium Ecosystem Assessment [1], ecosystem services are classified into four primary domains—provisioning, regulating, cultural, and supporting services—offering a comprehensive framework to systematically understand the multifaceted values provided by ecosystems. Among these, forest ecosystems stand out as critical providers of a broad spectrum of services, delivering benefits including provisioning services (e.g., timber, food, water) and regulating services (e.g., flood prevention, climate regulation, air purification) [3,4]. They also offer cultural services, including aesthetic, educational, and recreational values [5]. When forest ecosystems maintain their ecological functions, these services collectively play an indispensable role in sustaining human well-being and environmental resilience, underscoring the urgency of their preservation and restoration in both social and environmental contexts.
However, wildfires can disrupt these functions, with their impact on forest ecosystem services varying across short-, medium-, and long-term timescales [6,7]. In the immediate aftermath of a wildfire, the abrupt structural changes to forests typically lead to a decline in most ecosystem services [8]. For instance, the loss of vegetation due to wildfire exposes soil, intensifying the risk of erosion and increasing the probability of natural disasters. This also reduces the forest’s capacity to store and purify water, exacerbating soil erosion and disrupting local water-management systems [9]. Furthermore, wildfires immediately destroy habitats, reduce biodiversity, and disrupt ecological balance with long-term consequences for ecosystem stability in the short term [10]. Several studies have explored the adverse effects of wildfires on water supply, carbon sequestration, and biodiversity loss [11,12]. These disruptions often lead to cascading consequences in hydrological, ecological, and social systems, underscoring the need for systematic assessments. Understanding such dynamics is essential to guide restoration planning and ensure the sustainability of ecosystem service flows in fire-affected regions.
To restore ecosystem services degraded by wildfires, systematic and quantitative assessments are essential. The impacts of wildfire-induced ecosystem service losses vary depending on regional and environmental conditions [13,14]. Therefore, accurately identifying and quantifying the services is critical for prioritizing restoration efforts and formulating effective strategies. For instance, analyzing the extent of losses in services such as water supply, carbon sequestration, water purification, and habitat quality can guide efficient resource allocation, such as prioritizing vegetation restoration in areas severely affected by wildfire. Given that wildfire damage is often localized and its effects vary significantly across regions, conducting rapid and precise initial assessments at smaller spatial scales is particularly important to ensure timely and targeted restoration actions.
Hydrological services, a subcategory of regulating ecosystem services, concerns the benefits humans derive from the water cycle, including flow regulation, baseflow maintenance, and water supply [15]. Hydrological services are particularly significant in the context of wildfires, as they have direct and immediate impacts on forest ecosystems and human societies consequently [16,17]. Wildfires reduce vegetation cover, leading to a decline in evapotranspiration, which alters surface and groundwater flows and disrupts the overall water cycle [18]. The loss of soil cover further increases erosion and sedimentation risks, contributing to secondary environmental issues such as water quality degradation. These changes exacerbate extreme water-management challenges, such as floods and droughts, posing severe threats to local water security and climate-regulation functions.
Applying the ecosystem service-assessment model to localized wildfire events can effectively capture regional variations in ecosystem service changes and inform effective restoration strategies [19,20]. Among various ecosystem service-assessment models, InVEST (Integrated Valuation of Ecosystem Services and Tradeoffs) is widely recognized for its reliability in assessing regional variations and guiding restoration strategies [21,22,23,24,25,26]. The InVEST model provides functions to quantify and map diverse ecosystem services [27], including water balance [28], and carbon storage [29], making it particularly suitable for assessments ranging from large to regional scales [30,31,32]. The relatively simple data requirements of the InVEST model are a significant advantage enabling rapid initial diagnostics and making it a practical tool for assessing wildfire-induced ecosystem service losses at localized scales [33]. This capability facilitates efficient quantification of site-specific changes, allowing time- and cost-effective assessments of initial ecosystem service damages and optimizing resource allocation for restoration. Furthermore, the model provides visualized outputs that deliver actionable insights, supporting targeted and effective restoration efforts [34].
Ecosystem service-assessment models are often applied without adequate validation, and attempts to verify the accuracy and reliability of model outputs remain relatively rare [35]. Ensuring the accuracy and reliability of model outputs is particularly important when applying the model to new environments, as validation plays a key role in confirming its suitability under varying conditions. While some studies have used the InVEST model to analyze water balance at large or national scales and validated its outputs with observational data, similar efforts at smaller, localized scales remain limited [35].
This study evaluates wildfire-induced changes in water-yield ecosystem services at a localized scale using the InVEST model, emphasizing its suitability for rapid assessments. The accuracy of the InVEST model at a localized scale was assessed by comparing its outputs with those from the SWAT (Soil and Water Assessment Tool) model. By highlighting the practicality of InVEST for localized evaluations and verifying its performance, this study seeks to provide scientific evidence supporting its application as a cost-effective tool for initial diagnostics of wildfire-affected area. The findings will provide validated insights to support restoration strategies and decision-making, particularly in contexts requiring timely and resource-efficient assessments.
2. Materials and Methods
2.1. Study Area
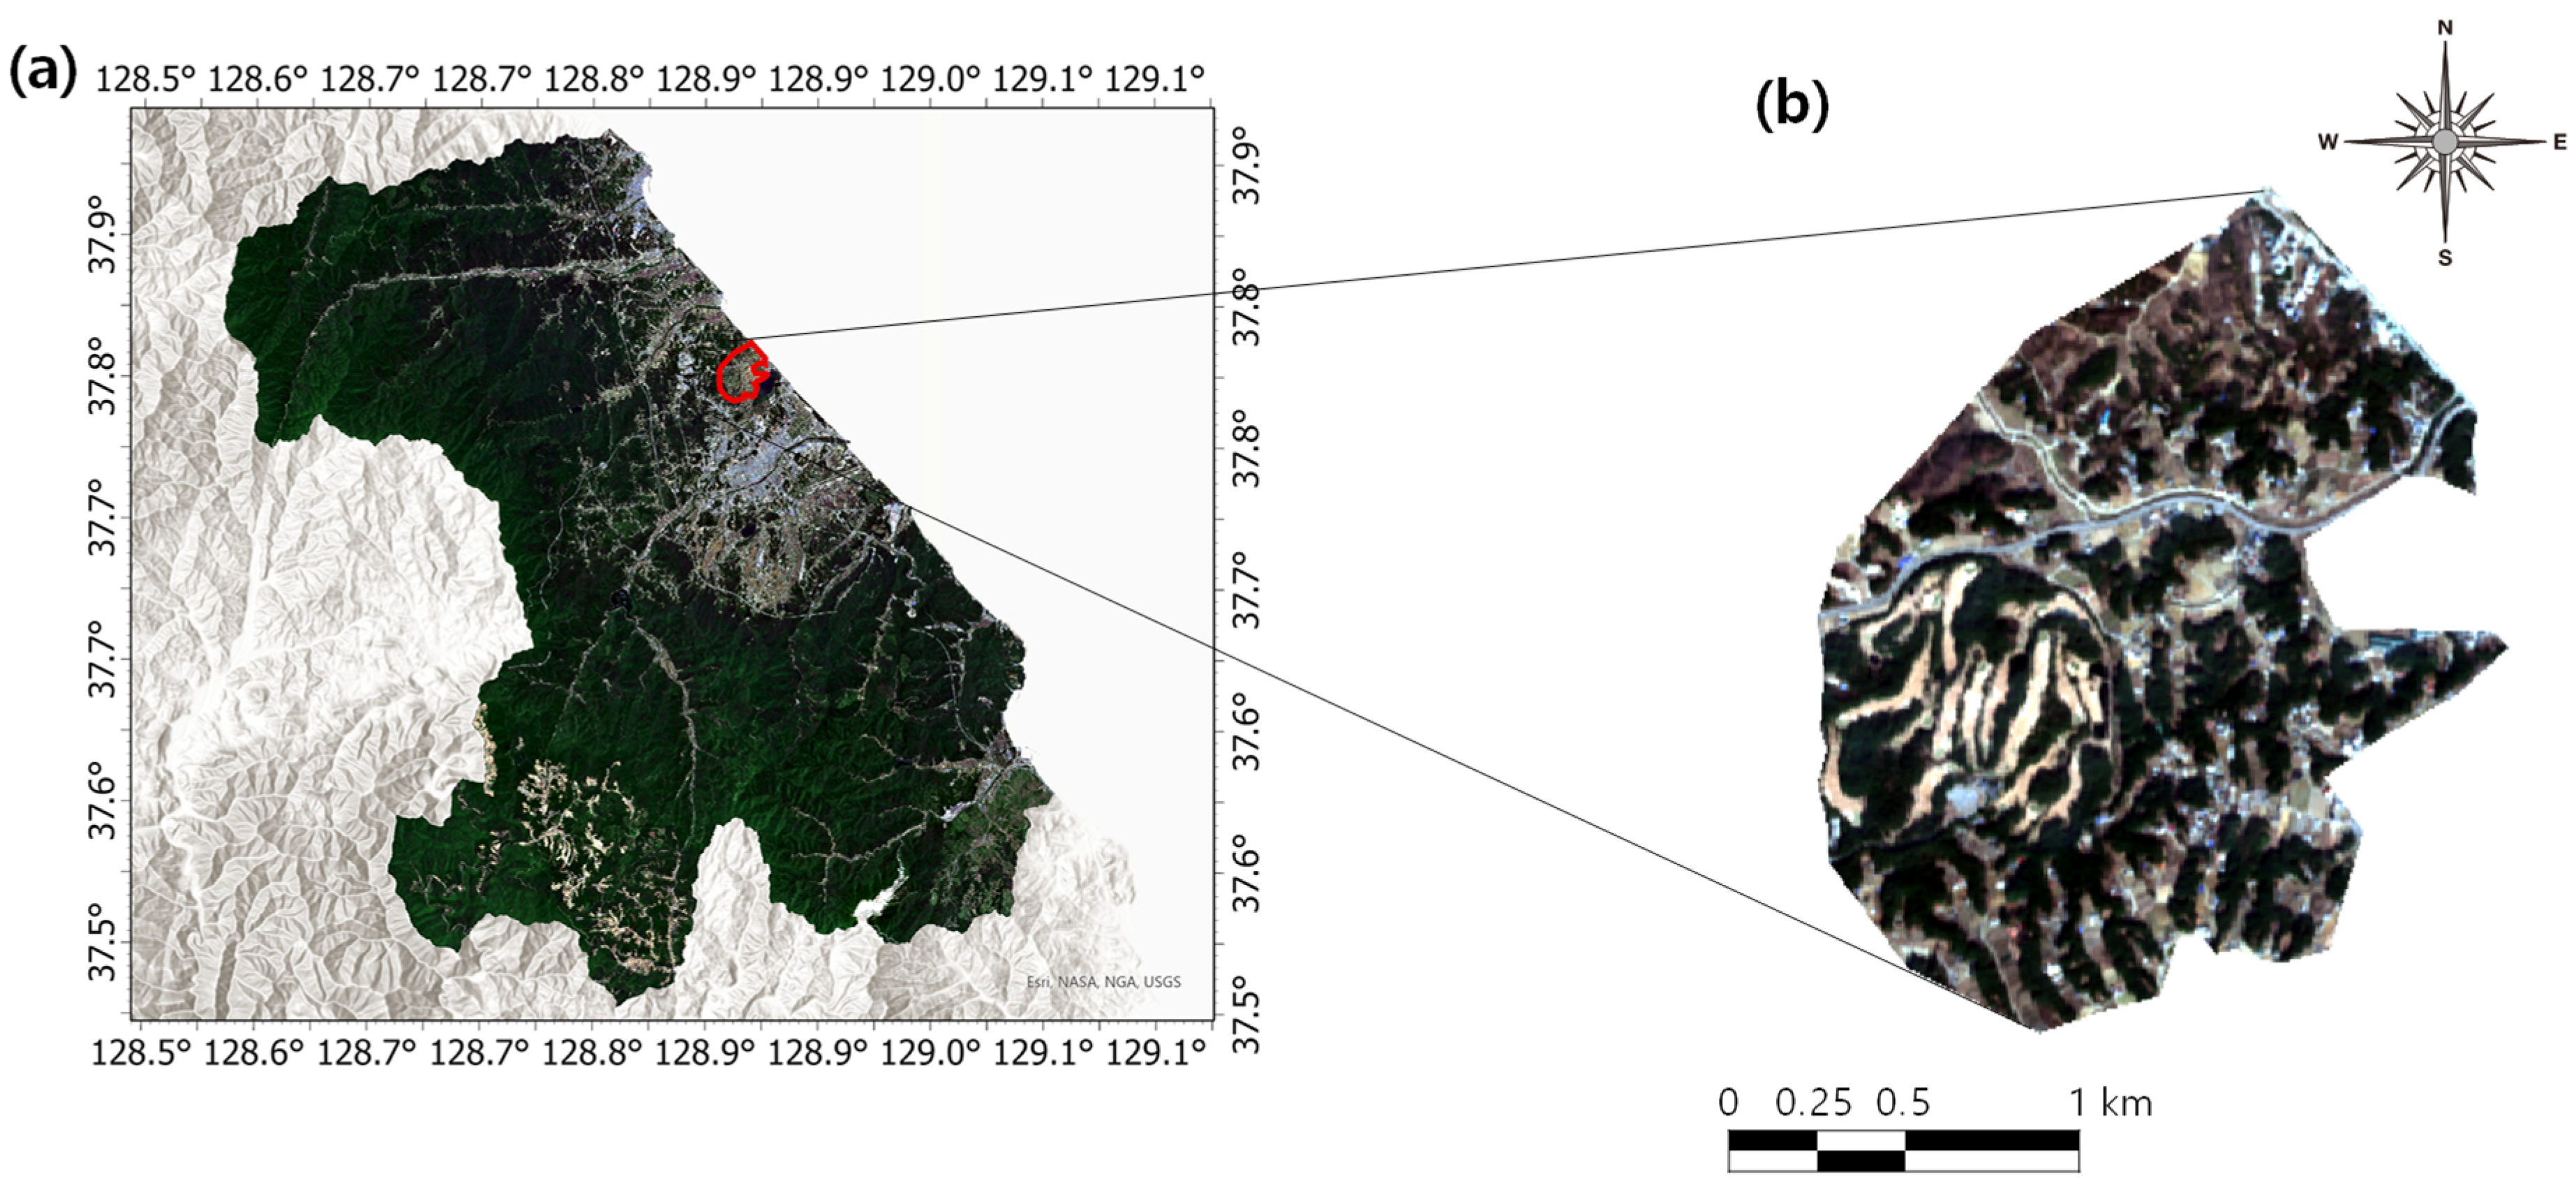
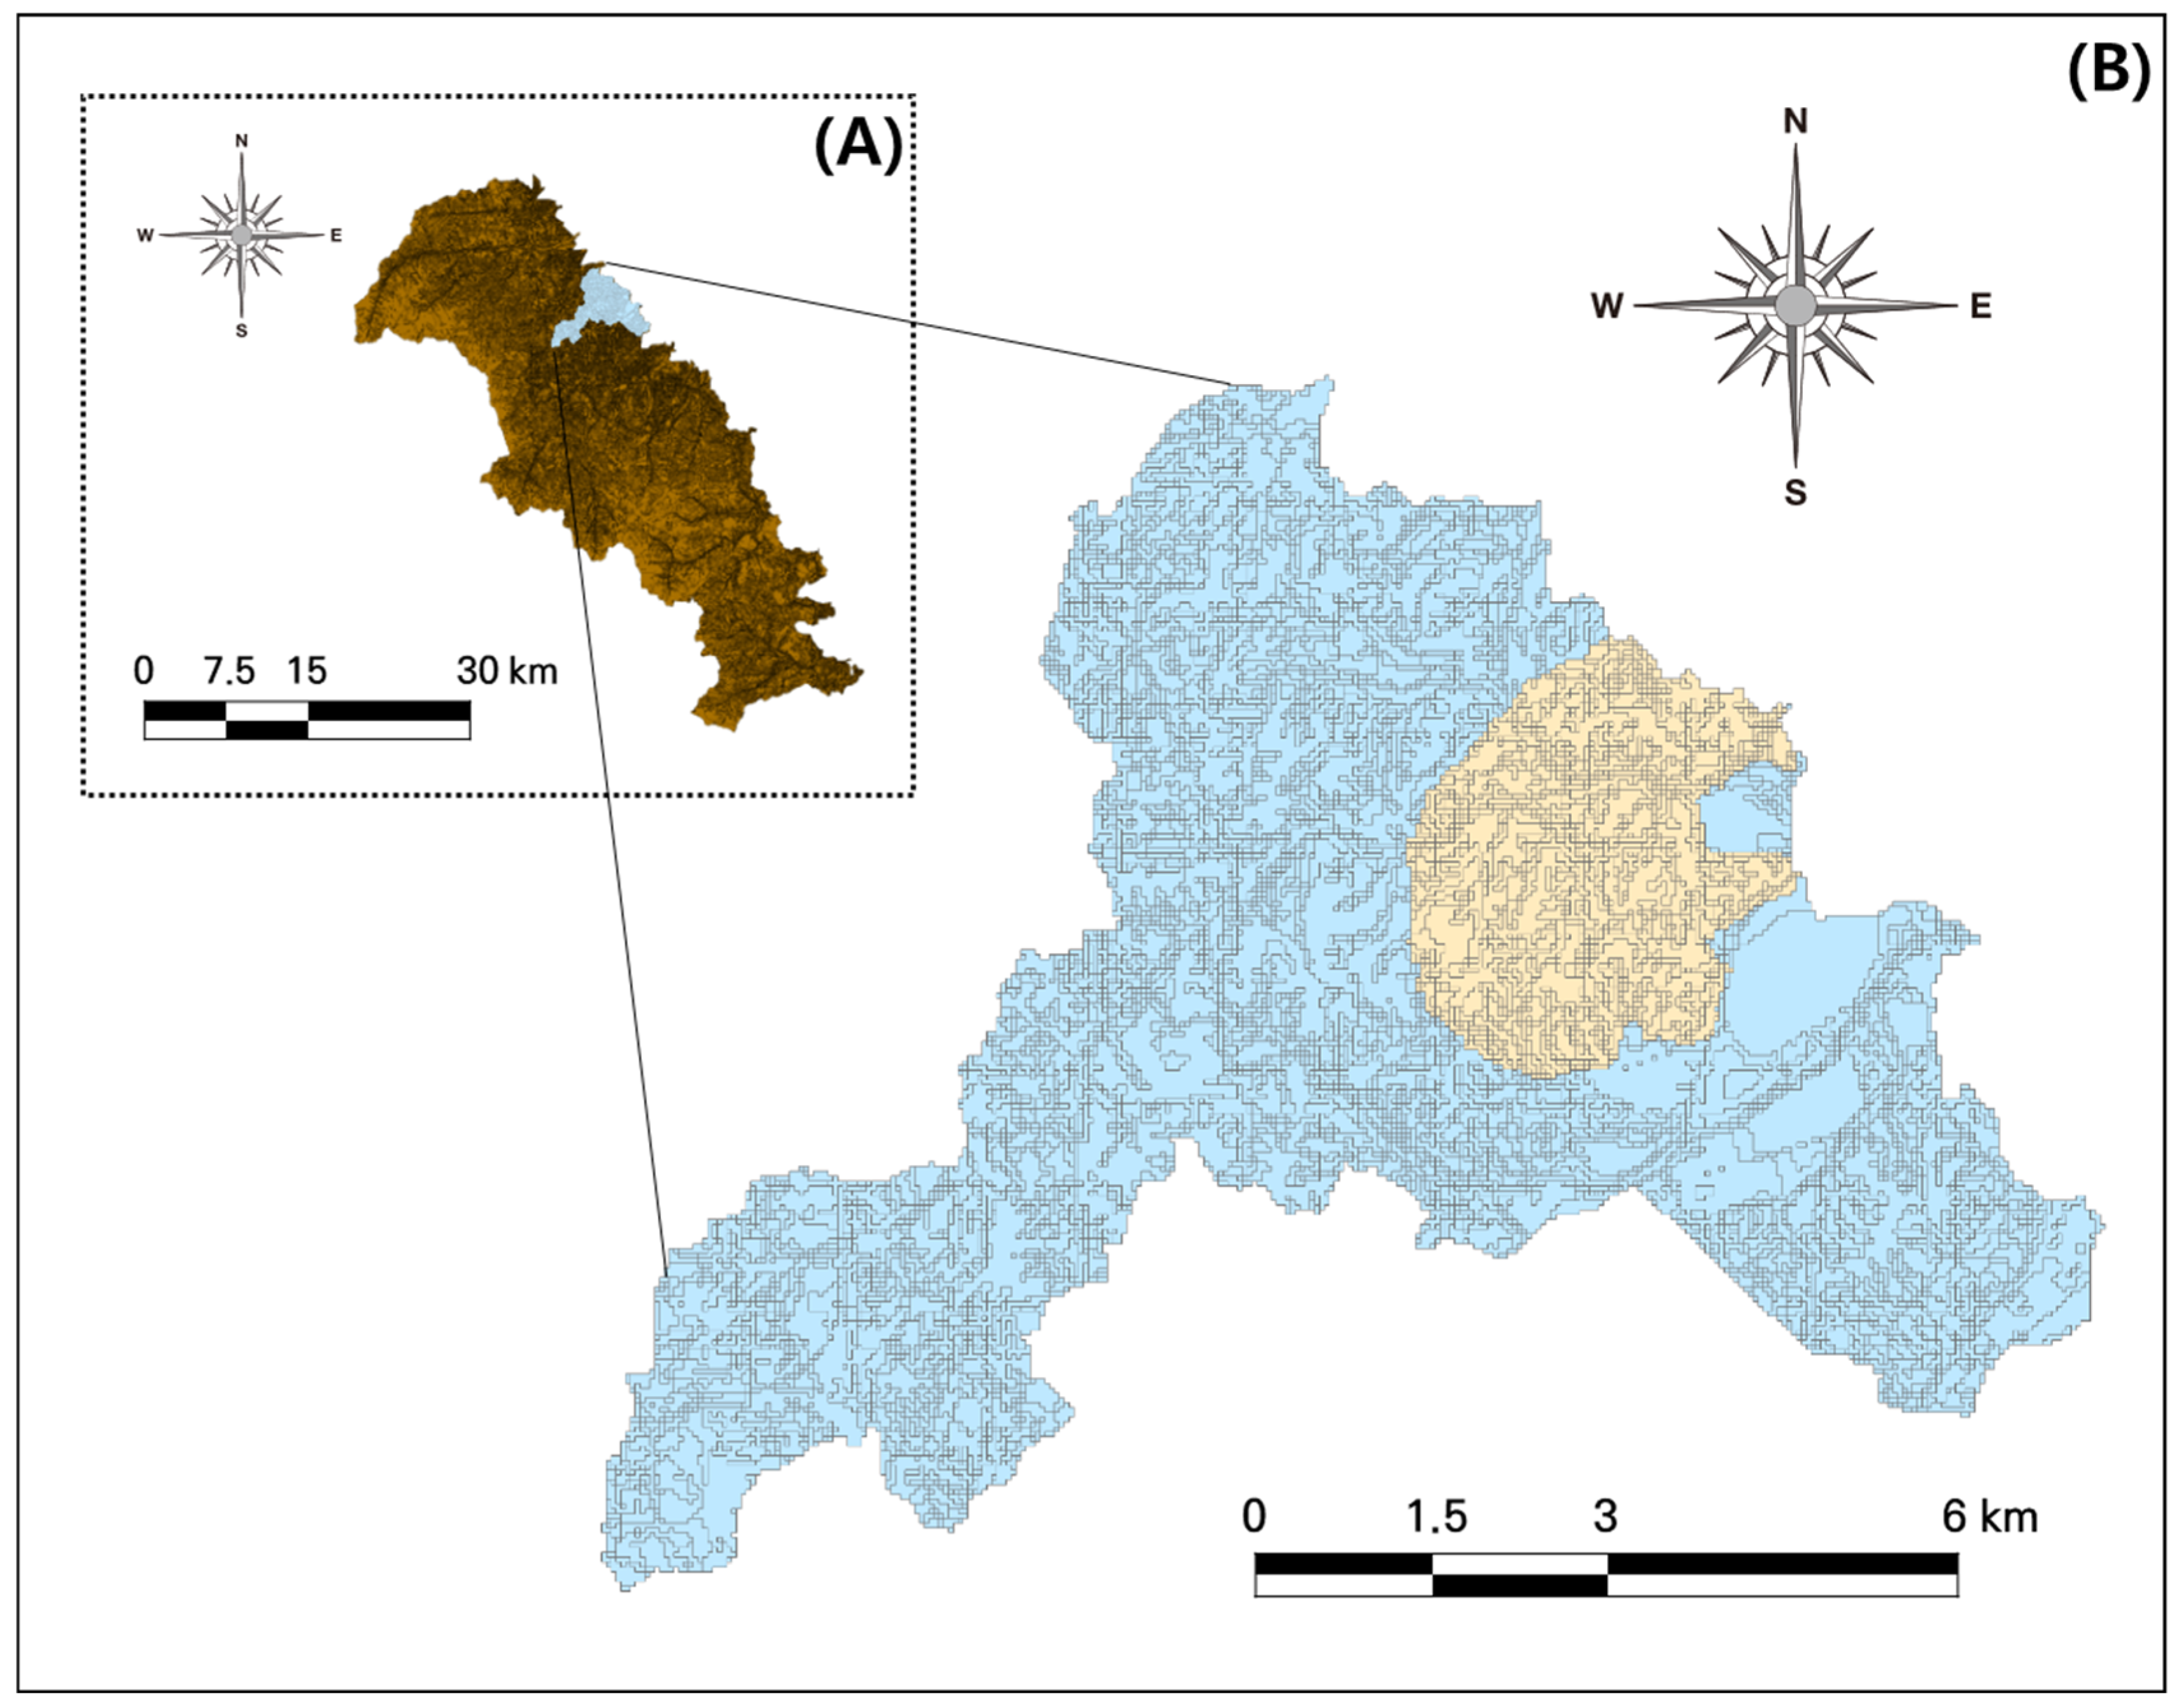
The study area is located near Gyeongpoho lake in Gangneung City, which is located in northeastern South Korea (Figure 1). The specific study area, covering approximately 4.95 km2, is surrounded by forests, urban developments, and agricultural land, providing an ideal setting for analyzing the effects of LULC changes on hydrological processes. This region is characterized by its ecological diversity and complex land-use patterns and is surrounded by forests, urban developments, and agricultural land, making it an ideal site for analyzing the impacts of LULC changes on ecosystem services. The hydrological dynamics of this area are strongly influenced by seasonal variations in precipitation and temperature with recent annual precipitation levels recorded as 1812 mm (2020), 1316 mm (2021), 1465 mm (2022), 1568 mm (2023), and 1400 mm (2024). The five-year average precipitation (2020–2024) was 1512 mm, with the highest recorded in 2020 (1812.9 mm) and the lowest in 2021 (1316.4 mm). This area gained particular research interest following the wildfire that occurred on 11 April 2023. The wildfire, originating in Nangok-dong, Gangneung, rapidly spread due to strong winds and resulted in the loss of approximately 1.20 km2 of forested land. The fire not only impacted forest ecosystems but also extended to residential areas, causing severe damage to human settlements and local infrastructure. Given its proximity to the wildfire-affected area, the study area is expected to have undergone substantial changes in LULC, which may have further influenced water-yield ecosystem services.
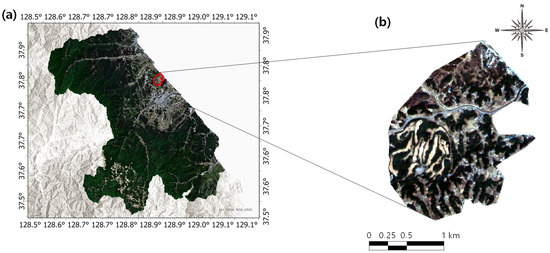
Figure 1.
Location and satellite imagery of the study area. (a) Gangneung City, highlighting the region where the study was conducted; the red circle indicates the specific area analyzed in this study. The area is characterized by a mix of forests, urban developments, and agricultural land, influencing local hydrological processes. (b) Study area, showing the wildfire-affected region where vegetation loss occurred.
2.2. Analytical Framework
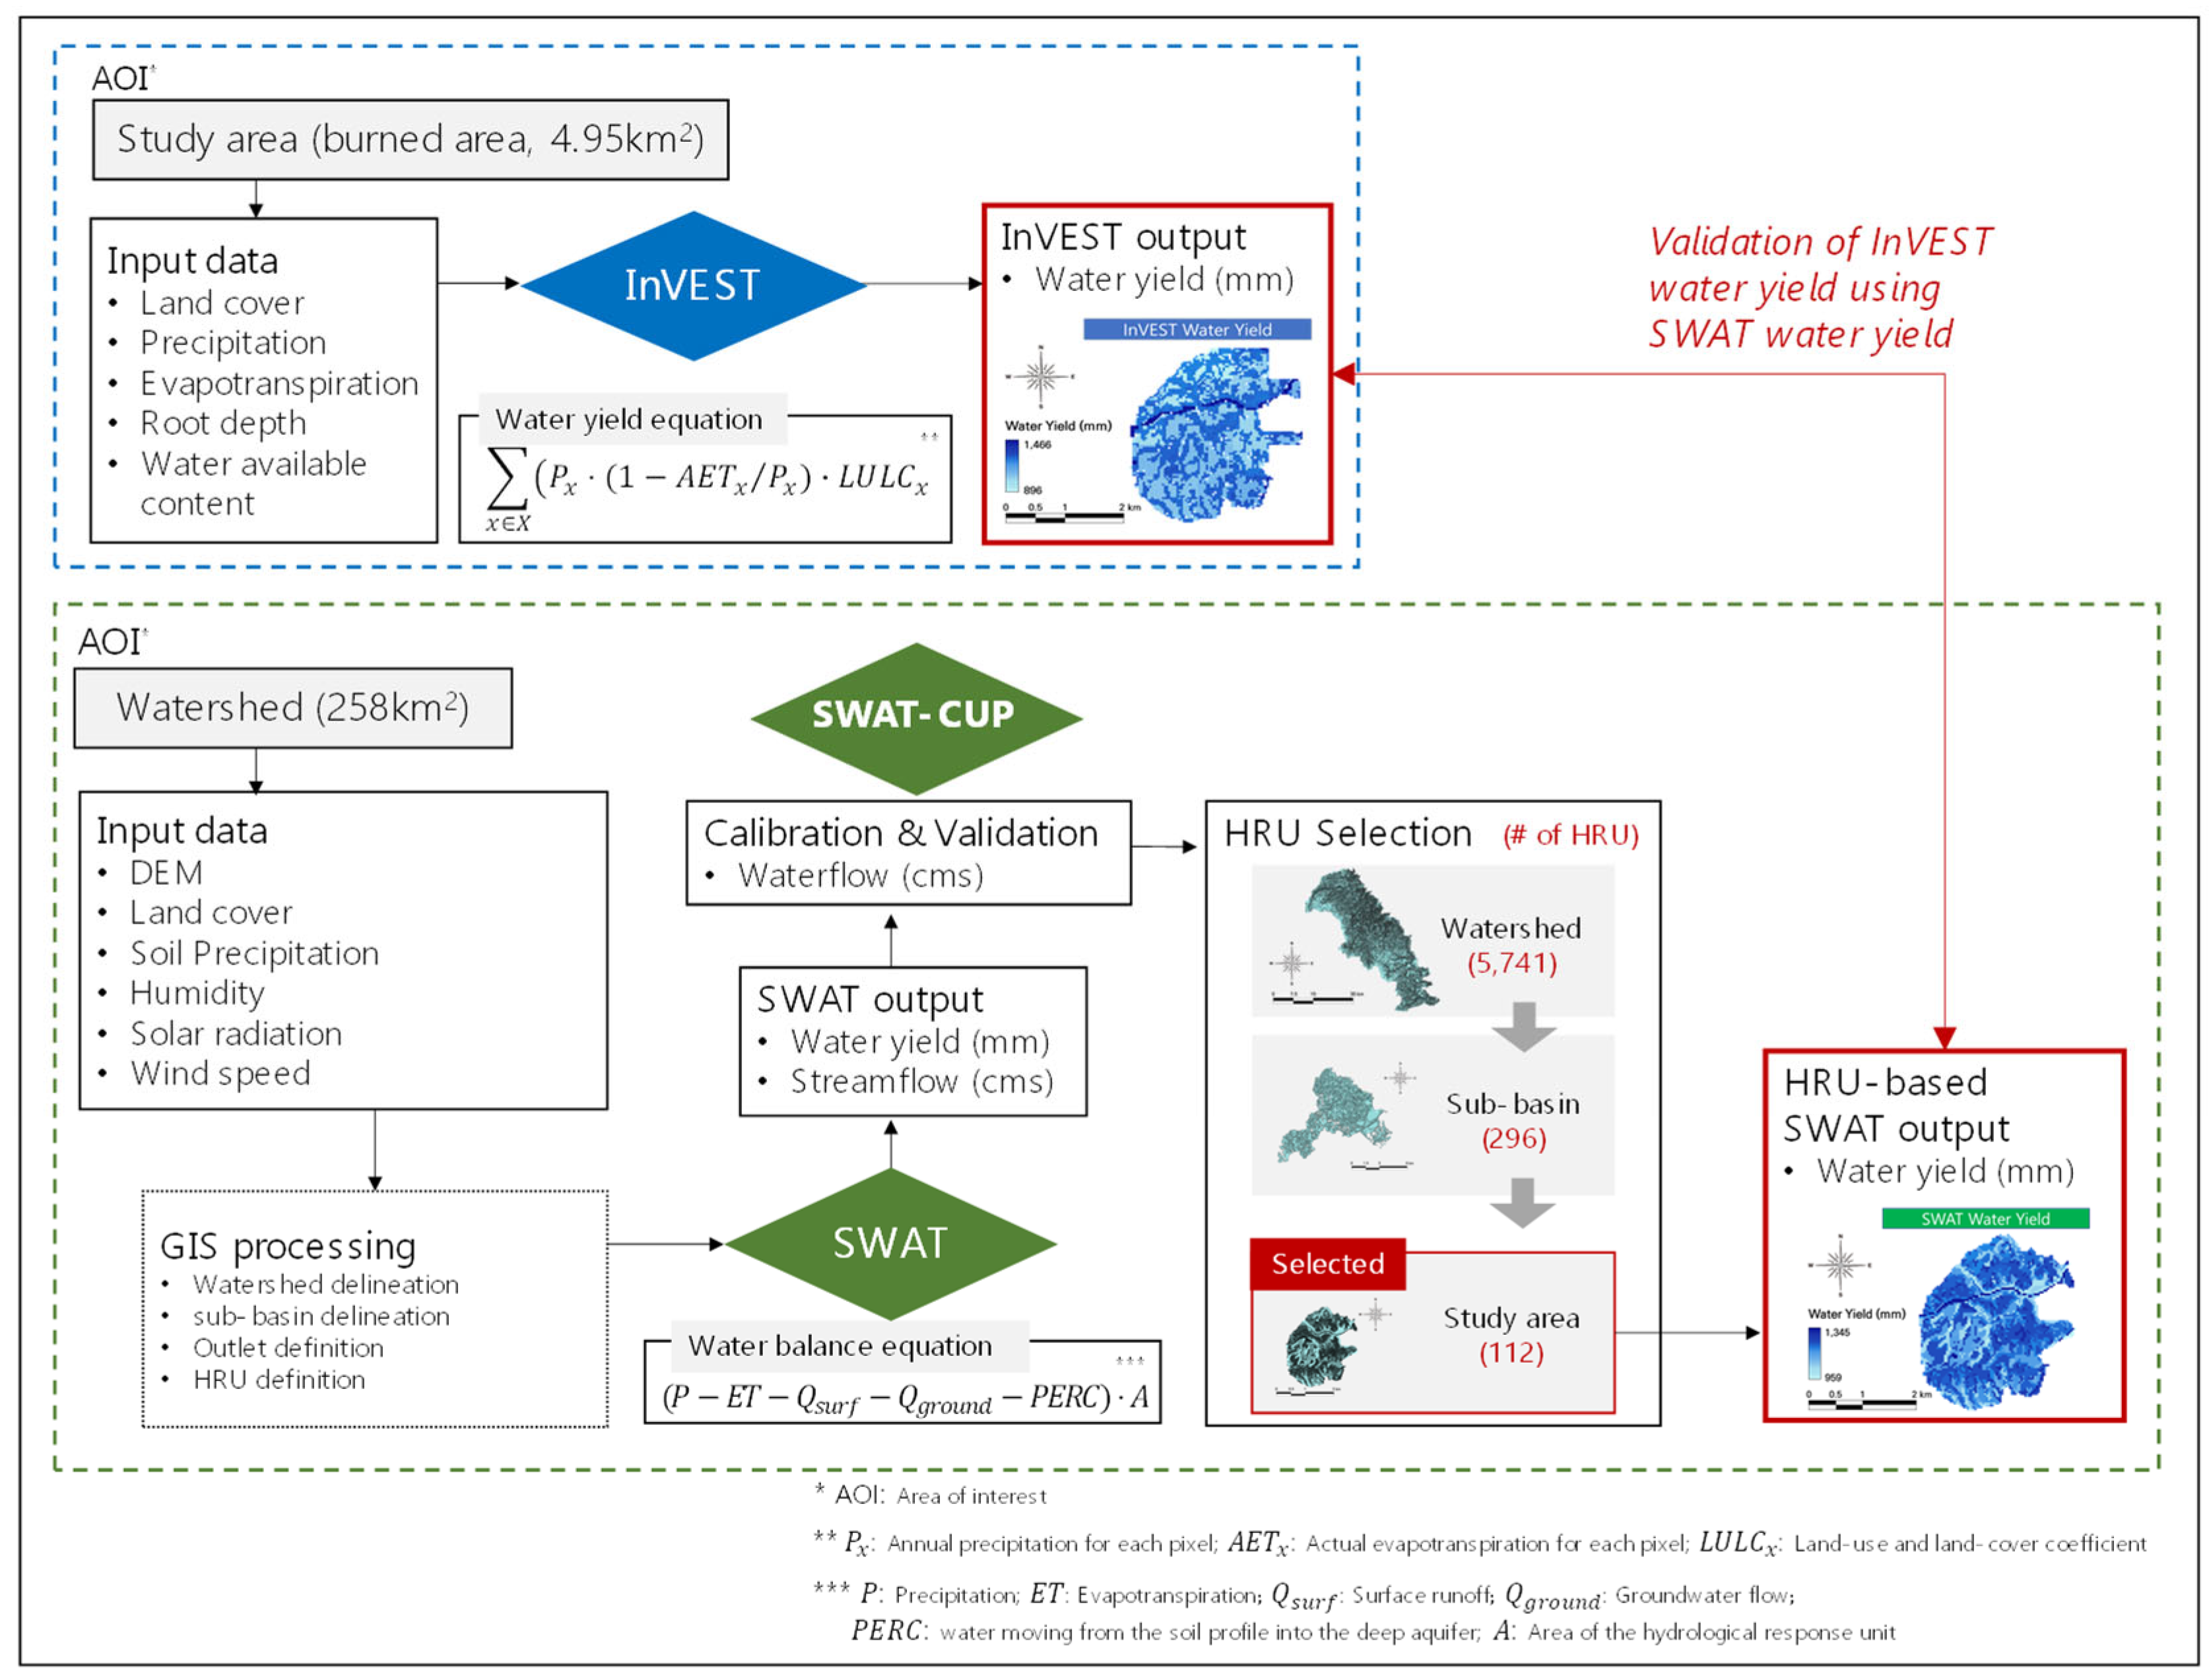
To evaluate the impacts of wildfires on water-yield ecosystem services at a localized scale, this study applied the InVEST model and validated its results using the SWAT model as shown in Figure 2. The framework integrates the following key steps:

Figure 2.
Conceptual framework for assessing wildfire-induced changes in water yield using the InVEST and SWAT models. The upper section (blue) represents the InVEST modeling process, while the lower section (green) represents the SWAT and SWAT-CUP modeling process.
- Assessing water-yield ecosystem changes using InVEST: The InVEST model was applied to the wildfire-affected study area to estimate changes in water yield resulting from post-fire land cover modifications. Key input data included land cover, precipitation, evapotranspiration, root depth, and soil water availability. Using a simplified water balance equation, the model generated spatially explicit water-yield estimates, providing a rapid assessment of hydrological changes driven by vegetation loss.
- Validation of InVEST water-yield estimates using SWAT: The SWAT model was applied to a larger watershed (258 km2) that encompasses the study area, incorporating DEM, land cover, soil properties, precipitation, humidity, solar radiation, and wind speed as input data. GIS-based preprocessing was conducted to delineate watersheds, define sub-basins, and establish Hydrological Response Units (HRUs). Initially, 5741 HRUs were identified, later refined to 112 HRUs within the study area. The SWAT model underwent calibration and validation using observed streamflow data (cms) from the Hoesangyo gauging station, ensuring model accuracy. The pre-wildfire water-yield estimates from SWAT were then compared with InVEST-derived results to assess InVEST’s ability to capture localized hydrological dynamics. While InVEST enabled rapid post-wildfire assessment, SWAT was limited to pre-wildfire conditions due to challenges in integrating localized land cover changes into a watershed-scale model. Accurately reflecting post-wildfire soil and vegetation conditions within SWAT required extensive data processing and additional parameter adjustments. As a result, post-wildfire water yield was not simulated using SWAT, and the comparison between the models was restricted to pre-wildfire conditions. Despite this limitation, the validation of InVEST’s pre-wildfire outputs using a well-calibrated SWAT model provided a strong baseline for evaluating InVEST’s reliability in wildfire-affected hydrological assessments. Although the SWAT model simulates hydrological processes at a daily resolution, in this study, its outputs were aggregated to monthly values for calibration and validation using observed streamflow. Subsequently, these monthly outputs were summarized to annual water yield to match the temporal resolution of InVEST, which operates on an annual time step based on yearly climate and land cover inputs.
- Analysis assumptions (scenario setting): This study adopted a controlled scenario approach to evaluate the impact of wildfire-induced land cover changes on annual water yield as an ecosystem service. Rather than applying observed precipitation data for pre- and post-wildfire periods, a fixed average annual precipitation for year 2023 was applied uniformly across both scenarios. This approach was designed to isolate the effect of land cover changes caused by the wildfire, while excluding the influence of precipitation variability between years. Specifically, the pre-wildfire scenario used the pre-fire land cover map, while the post-wildfire scenario applied the post-fire land cover map, both under the same climatic conditions. This allows for a direct comparison of water-yield differences attributable solely to land cover changes, ensuring that any observed changes reflect the impact of wildfire-induced vegetation loss rather than interannual climatic variation. This analytical assumption simplifies the complex interactions between climate and land cover but provides a clear and isolated quantification of wildfire impacts on water-yield ecosystem services. The implications and limitations of this approach are further discussed in Section 3.4.
2.3. Water-Yield Estimation Using InVEST Model
2.3.1. Overview of InVEST Water-Yield Model
The InVEST water-yield model estimates annual water yield based on the water balance equation (Equation (1)) where Y represents the annual water yield for each pixel χ, Pχ denotes the annual precipitation for each pixel χ, and AETχ refers to the annual actual evapotranspiration (AET) for each pixel χ. The total water yield for the study area is calculated by summing the water yield across all pixels, considering LULC of each pixel.
The model utilizes spatial data, such as precipitation, LULC, soil depth, and vegetation characteristics, to simulate hydrological processes. The AETχ was calculated using the Budyko curve embedded in the InVEST water-yield model, which relates climate and vegetation parameters. Reference evapotranspiration was derived from MODIS MOD16A2, which is based on the Penman–Monteith method.
InVEST aggregates results from individual pixels to provide insights into landscape-level water availability and ecosystem services. By comparing pre- and post-wildfire scenarios, the model evaluates the impacts of LULC changes on water yield, enabling informed decision-making for ecosystem management and restoration planning.
2.3.2. LULC Mapping from Satellite Image Imagery
The InVEST water-yield module relies on land cover data to estimate water yield, as it is directly influenced by land cover characteristics. To address the lack of readily available and updated land cover data for the study area, we generated maps reflecting pre- and post-wildfire conditions using Sentinel-2 MSI Level-2A satellite imagery processed through Google Earth Engine (GEE). GEE provides real-time access to satellite data and a cloud-based processing. For pre-wildfire land cover, imagery acquired on 13 March 2023, with a spatial resolution of 30 m, was used. Post-wildfire land cover was derived by updating the pre-wildfire map with burned area extracted from imagery obtained on 14 May 2023. To ensure methodological consistency and accurate detection of wildfire-induced land cover changes, a separate land cover classification for May was not generated. Instead, the burned areas detected from May imagery were directly integrated into the March land cover map. Since land cover remains relatively stable over short timeframes, except in cases of major disturbances such as wildfires, generating a new classification for May could introduce inconsistencies and classification errors due to seasonal variations, spectral differences, and atmospheric conditions.
To ensure the quality of the data, images with a cloud cover of 10% or less were filtered. To mitigate residual noise, such as cloud shadows, a median composite of multiple images was generated to enhance data quality and ensure consistency. The study area boundaries were delineated using ArcGIS Pro 3.0.0, and the region of interest (ROI) was defined in GEE for subsequent data processing and analysis.
The land cover maps were classified into six categories: urban land, agricultural land, forest land, grass land, water, road, and wildfire-affected area. Training data for the classification model were derived by sampling representative areas from the satellite imagery. Each land cover type was assigned specific features, and these samples were used to train a random forest (RF) classification algorithm. The data were divided into 70% for training and 30% for validation. The model’s performance was evaluated using four metrics: Kappa, overall accuracy (OA), user accuracy (UA), and producer accuracy (PA). The accuracy assessment ensured a comprehensive evaluation of the classification performance, demonstrating both the model’s ability to correctly classify land cover types and the reliability of these classifications for subsequent analysis. These metrics were essential to assessing the accuracy of the generated land cover maps and their suitability [36]. However, accurately identifying road features using satellite imagery alone proved challenging due to their spectral similarity to other land cover types. To address this limitation, a detailed road layer from the national node-link dataset, provided by the National Transportation Information Center (2024), was incorporated into the land cover map. This methodology ensured the development of accurate and reliable pre- and post-wildfire land cover maps, providing essential input for the InVEST model to assess the impacts of wildfire-induced land cover changes on ecosystem services.
2.3.3. Input Data Preparation for InVEST Model
To estimate water yield, data for reference evapotranspiration, annual precipitation, plant available water content (PAWC), root restricting layer depth, and biophysical table were collected and processed. Precipitation data were mapped using annual precipitation for 2023 provided by the Korea Meteorological Administration. The precipitation data were extracted from the yearly precipitation data observed at 15 ASOS stations in Gangwon Province where the study area was located. Based on the precipitation data for each station’s point, the map was interpolated using the inverse distance-weighting method, a method that weights values proportional to the inverse of the distance, assuming values from nearby points have a greater impact.
Data for reference evapotranspiration were mapped using monthly average for 2023 from the MODIS MOD16A2 dataset. MODIS MOD16A2 is a dataset that provides evapotranspiration data at 500 m × 500 m resolution with an 8-day interval.
Root-restricting layer depth is the soil depth at which rooting is strongly inhibited, either physically or chemically. In other words, it is the maximum depth of the layer where rooting depth is inhibited by physical obstacles such as soil density, grain size, or bedrock layers. The lower the RRL depth, the less water the soil can hold, which tends to result in lower evapotranspiration and higher runoff. In this study, we applied the root-restriction layer depth used in a previous study by [37].
Plant available water content (PAWC) was generated based on soil maps provided by the Water Management Information System. The plant available water content map was created based on the distribution ratio of soil particles such as sand, silt, and clay by a soil map. The watershed map utilizes the standard watershed map of the Gangneung–Namdaecheon watershed provided by the Water Management Information System.
Lastly, biophysical parameters of root depth and plant evapotranspiration coefficient (Kc) were created to correspond to the LULC raster. The required fields in the biophysical table are as follows: LULC code, Kc, Root depth, and LULC vegetation as shown in Table 1. LULC code is a number for each land cover and is categorized into urban, agriculture, forest, grass, water, road, and wildfire from 1 to 7. Kc ranges from 0 to 1, where 0 means no water loss and 1 means maximum water loss, and it is a coefficient that affects evapotranspiration calculation. Root depth is the maximum root depth that can extend per land cover. LULC vegetation is a value that indicates the presence or absence of vegetation by land cover for the actual evapotranspiration calculation. An LULC vegetation value of 0 means that the land cover has no vegetation, while a value of 1 means that vegetation is present. The values of these required fields in the biophysical table are based on previous studies by [37]. Table 2 summarizes the input data used in the InVEST model, including their sources and corresponding time periods.

Table 1.
Biophysical table used for the InVEST water-yield model.
Table 2.
Input data source and period for InVEST model.
2.4. Water-Yield Estimation Using SWAT Model for Validation of InVEST Results
2.4.1. Overview of SWAT Model
The SWAT model is a physically based hydrological model widely recognized for its ability to simulate hydrological processes at the watershed scale, predicting the impacts of land-use changes on water quantity and quality [38]. SWAT divides a watershed into sub-basins, each possessing a geographic position and spatial interconnection. These sub-basins are further divided into HRUs, the smallest computational units in SWAT, which represent unique combinations of land use, soil type, and management practices. This subdivision enables SWAT to simulate hydrological processes such as surface runoff, evapotranspiration, percolation, groundwater flow, and soil water content for each HRU. The results are then aggregated to the sub-basin level using weighted averages, allowing for detailed analysis of hydrological dynamics [39].
The water yield in SWAT is calculated based on the following equation (Equation (2)) where P represents precipitation, ET refers to evapotranspiration, Qsurf refers to surface runoff, Qground refers to groundwater flow, PERC refers to water moving from the soil profile into the deep aquifer, and A refers to area of the hydrological response unit.
2.4.2. Input Data Preparation for SWAT Model
The SWAT model requires a range of spatial and temporal input data to simulate hydrological processes and assess the impact of land cover changes on watershed-scale hydrology. For this study, primary input data such as topographic, land cover map, soil, and climate data were utilized to accurately model for the Gangneung–Namdaecheon watershed (Figure 3 and Table 3).

Figure 3.
Location of Gangneung–Namdaecheon watershed. The wildfire-affected area spans 4.95 km2 and partially overlaps with two sub-basins (colored with light green).
Table 3.
SWAT input data for water-yield modeling.
Topographic data were obtained from the National Geographic Information Institute (NGII) and consisted of a 30 m × 30 m digital elevation model (DEM). This DEM was clipped to the Gangneung–Namdaecheon watershed boundary and used to delineate the stream network, sub-basins, and watershed boundaries, which are essential inputs for the SWAT model. The spatial soil map was obtained from the Water Management Information System (WAMIS) and consisted of a 1:25,000 detailed soil map. The soil dataset included key properties such as soil texture, soil depth, and hydraulic conductivity, which influence infiltration rates and water-storage capacities in the SWAT model. Land cover data were obtained from the Ministry of Environment (MOE) and consisted of a 1:25,000 land cover map, which was also clipped to the study area boundary.
Climatic data were obtained from the Korea Meteorological Administration (KMA), including daily precipitation, temperature, relative humidity, wind speed, and solar radiation from 2018 to 2024 at two weather stations (Bukgangneung and Gangneung). Streamflow data were obtained from the Han River Flood Control Office (HRFCO), providing daily observed flow data at the Hoesangyo gauging station, located near the outlet of the Namdaecheon watershed, from 2020 to 2024. These streamflow data were used for calibration and validation of the SWAT model.
2.4.3. Model Setup, Sensitivity Analysis, Calibration, and Validation Using SUFI-2 in SWAT-CUP
The SWAT model was set up with a warm-up period from 2018 to 2019 to initialize hydrological processes and stabilize the system. The total simulation period spanned from 2020 to 2024 (5 years), with the calibration period set from 2020 to 2021, followed by validation using the observed data from 2022 to 2024.
Model calibration and validation were conducted using SWAT Calibration and Uncertainty Programs (SWAT-CUP), an automated calibration tool developed by the Swiss Federal Research Institute [40]. Traditional manual calibration methods require significant time and effort and rely on the experience and intuition of the researcher. To compensate for this, SWAT-CUP was developed, which provides five algorithms (SUFI-2, GLUE, ParaSol, PSO, and MCMC) for sensitivity analysis, calibration, validation, and uncertainty analysis of SWAT models.
In this study, we applied the SUFI-2 (Sequential Uncertainty Fitting ver. 2) algorithm. SUFI-2 identifies parameters that have a significant impact on model outputs through sensitivity analysis and adjusts the parameter ranges to maximize the proportion of simulations falling within the 95% prediction uncertainty interval [41]. The calibration and validation processes were conducted by comparing the simulated streamflow values to observed streamflow data at the Hoesangyo gauging station, located near the outlet of the Gangneung–Namdaecheon watershed.
An initial set of 11 parameters was selected based on previous studies related to groundwater flow and runoff in watersheds in Gangwon Province [42,43], as it was found that the proportion of groundwater was rather high in the flow-simulation results using SWAT. A sensitivity analysis was conducted to evaluate the impact of the selected parameters across the watershed, including the study area.
To account for parameter interactions and to comprehensively evaluate the influence of parameter uncertainty on model outputs, Global Sensitivity Analysis (GSA) was conducted using the SUFI-2 algorithm. Unlike a one-at-a-time sensitivity analysis, which examines the effect of individual parameters independently, GSA evaluates the combined effects of all parameters by varying them simultaneously across their full feasible ranges [44]. This approach is particularly suitable for complex hydrological models, where interactions between parameters can significantly influence simulation results. The GSA identified 10 key parameters influencing streamflow and groundwater contributions in the Gangneung–Namdaecheon watershed, which were then used for final model calibration (Table 4).
Table 4.
Parameter definition and 10 parameters used in calibration.
The coefficient of determination (R2) and Nash–Sutcliffe Efficiency (NSE) were used to evaluate the effectiveness of parameter adjustments. R2 indicates the correlation between simulated and observed values, with a value closer to 1 indicating a better agreement between simulated and observed values (Equation (3)). NSE evaluates how well the simulated value is relative to the mean of the observed value, with a value closer to 1 indicating better predictive ability of the model (Equation (4)).
2.4.4. HRU Selection
To ensure consistent spatial analysis and facilitate direct comparison between the SWAT and InVEST model outputs, an HRU selection process was conducted to define the study area within the broader Gangneung–Namdaecheon watershed. The HRU selection process was conducted to focus the hydrological analysis on the study area while maintaining the spatial heterogeneity of the watershed. The entire watershed, covering 258 km2, was initially delineated into 5741 HRUs using land use, soil type, and slope characteristics. From this, two sub-basins containing the study area were identified, encompassing 296 HRUs. These sub-basins were further refined to isolate 112 HRUs that specifically corresponded to the study area as shown in Figure 4.
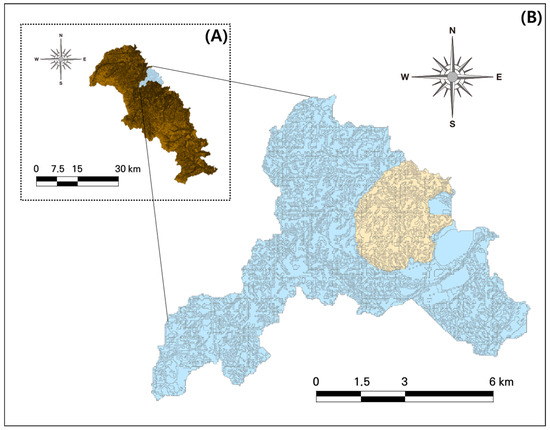
Figure 4.
Multi-step HRU selection process and location of the wildfire-affected area within the Gangneung–Namdaecheon watershed. (A) Initial delineation of the Gangneung–Namdaecheon watershed into 5741 HRUs based on unique combinations of land use, soil type, and slope classes. (B) Identification of the wildfire-affected area (shaded in light brown) within two selected sub-basins (shaded in light blue), encompassing a total of 112 HRUs. This hierarchical selection process preserved the spatial heterogeneity of the watershed and ensured localized hydrological analysis, enabling direct comparison of water-yield estimates between SWAT and InVEST under wildfire-affected conditions.
This hierarchical selection process was designed to preserve the spatial variability and environmental uniqueness of the study area. By narrowing the analysis from the entire watershed to the specific HRUs, this approach minimized the influence of external factors from the broader watershed and allowed the study to focus on localized hydrological responses. Importantly, this process enhanced the spatial resolution of the analysis, capturing critical variability in land use and terrain that might otherwise be averaged out or overlooked in broader watershed-level studies. For example, differences in land cover types or subtle terrain variations, which play a significant role in hydrological processes, were effectively accounted for by using HRU-level assessments.
Focusing specifically on the HRUs within the study area also facilitated a direct and fair comparison between SWAT and InVEST model outputs. Both models were applied at the same localized scale to evaluate water yield under wildfire-affected conditions, ensuring consistency and enhancing the reliability of the results. This HRU-based approach underscores the methodological rigor of the study, enabling micro-scale assessments that provide a deeper understanding of ecosystem service dynamics in highly dynamic and wildfire-impacted regions.
3. Results and Discussion
3.1. Changes in Water Yield After Wildfire
3.1.1. Pre- and Post-Wildfire LULC Mapping
The RF classification algorithm was employed to classify land cover types using satellite imagery collected in March. The classification results varied across land cover classes as shown in Table 5. Agricultural land (Class 2), forest land (Class 3), and grassland (Class 4) showed UA values of 83.3%, 99.0%, and 96.9%, respectively, while urban land (Class 1) and water bodies (Class 5) exhibited UA values of 70.3% and 25.0%, respectively. PA values showed similar trends, with forest land achieving the highest accuracy at 95.1%. The overall OA of the land cover classification was 86.4%, and the Kappa coefficient was 0.814, indicating moderate classification performance. The relatively lower UA values for urban land and water bodies suggest challenges in distinguishing these categories from other land cover types. Water bodies were particularly difficult to classify accurately. This may be due to variations in water surface reflectance caused by turbidity or shadows from surrounding terrain, leading to frequent misclassification. Figure 5 illustrates the comparison between the original satellite image (Figure 5a) and the classified land cover map (Figure 5b).
Table 5.
Accuracy assessment results of land cover classification using the RF algorithm. The table presents the UA, PA, OA, and Kappa coefficient for different land cover classes. The classification performance was high for agricultural land, forest land, and grassland, while urban land and water bodies exhibited relatively lower accuracy due to spectral similarities with other land cover types. The overall classification achieved an OA of 86.4% and a Kappa coefficient of 0.814, indicating a moderately strong agreement between predicted and reference data.
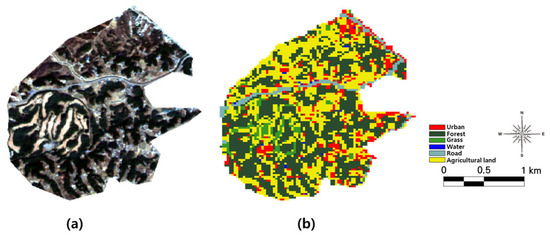
Figure 5.
(a) Study area observed on 5 March 2023, showing the satellite imagery of the region before the wildfire event. The image captures the landscape characteristics, including forested areas, agricultural land, and urban developments. (b) Land cover-classification map derived from satellite imagery taken in March 2023, using the RF classification algorithm.
For wildfire-affected area classification, the RF algorithm demonstrated exceptional performance using satellite imagery collected in May. Wildfire-affected areas (Class 1) and wildfire-non-affected areas (Class 2) achieved UA and PA values exceeding 98%. The classification also achieved an OA of 98.9% and a Kappa coefficient of 0.977, reflecting the robustness and reliability of the algorithm in distinguishing between these two classes as shown in Table 6. These results highlight the capability of the RF algorithm to effectively identify wildfire impacts by integrating satellite imagery with advanced classification techniques.
Table 6.
Accuracy assessment results for wildfire-affected area classification using the RF algorithm. The table presents the UA, PA, OA, and Kappa coefficient for distinguishing wildfire-affected and non-affected areas. The classification achieved high accuracy, with both classes exceeding 98% UA and PA. The OA was 98.9%, and the Kappa coefficient was 0.977, indicating excellent agreement between predicted and reference data.
The results demonstrate that the RF algorithm is a reliable tool for both land cover mapping and wildfire damage assessment. While the classification achieved high accuracy for most land cover classes and wildfire-affected areas, challenges remain for specific classes, such as water bodies, requiring further optimization. The pre-fire land cover map generated using March imagery and the post-fire land cover map updated with May wildfire data are presented in Figure 5 and Figure 6.
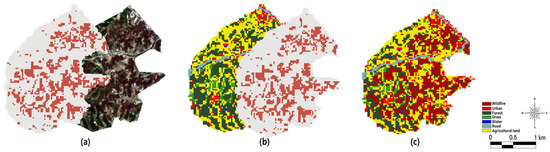
Figure 6.
Stepwise process for generating post-wildfire land cover classification. Initial wildfire-affected area classification using May satellite imagery, applying the RF algorithm to distinguish between wildfire-affected and non-affected areas. (b) Integration of wildfire-affected areas into the pre-fire land cover map, where the burned area classification from (a) is directly overlaid onto the March land cover map. This step simply replaces affected regions without altering other land cover classes. (c) Final post-wildfire land cover map, obtained by updating the March land cover map with the wildfire-affected areas from (a).
3.1.2. Water-Yield Estimation Results
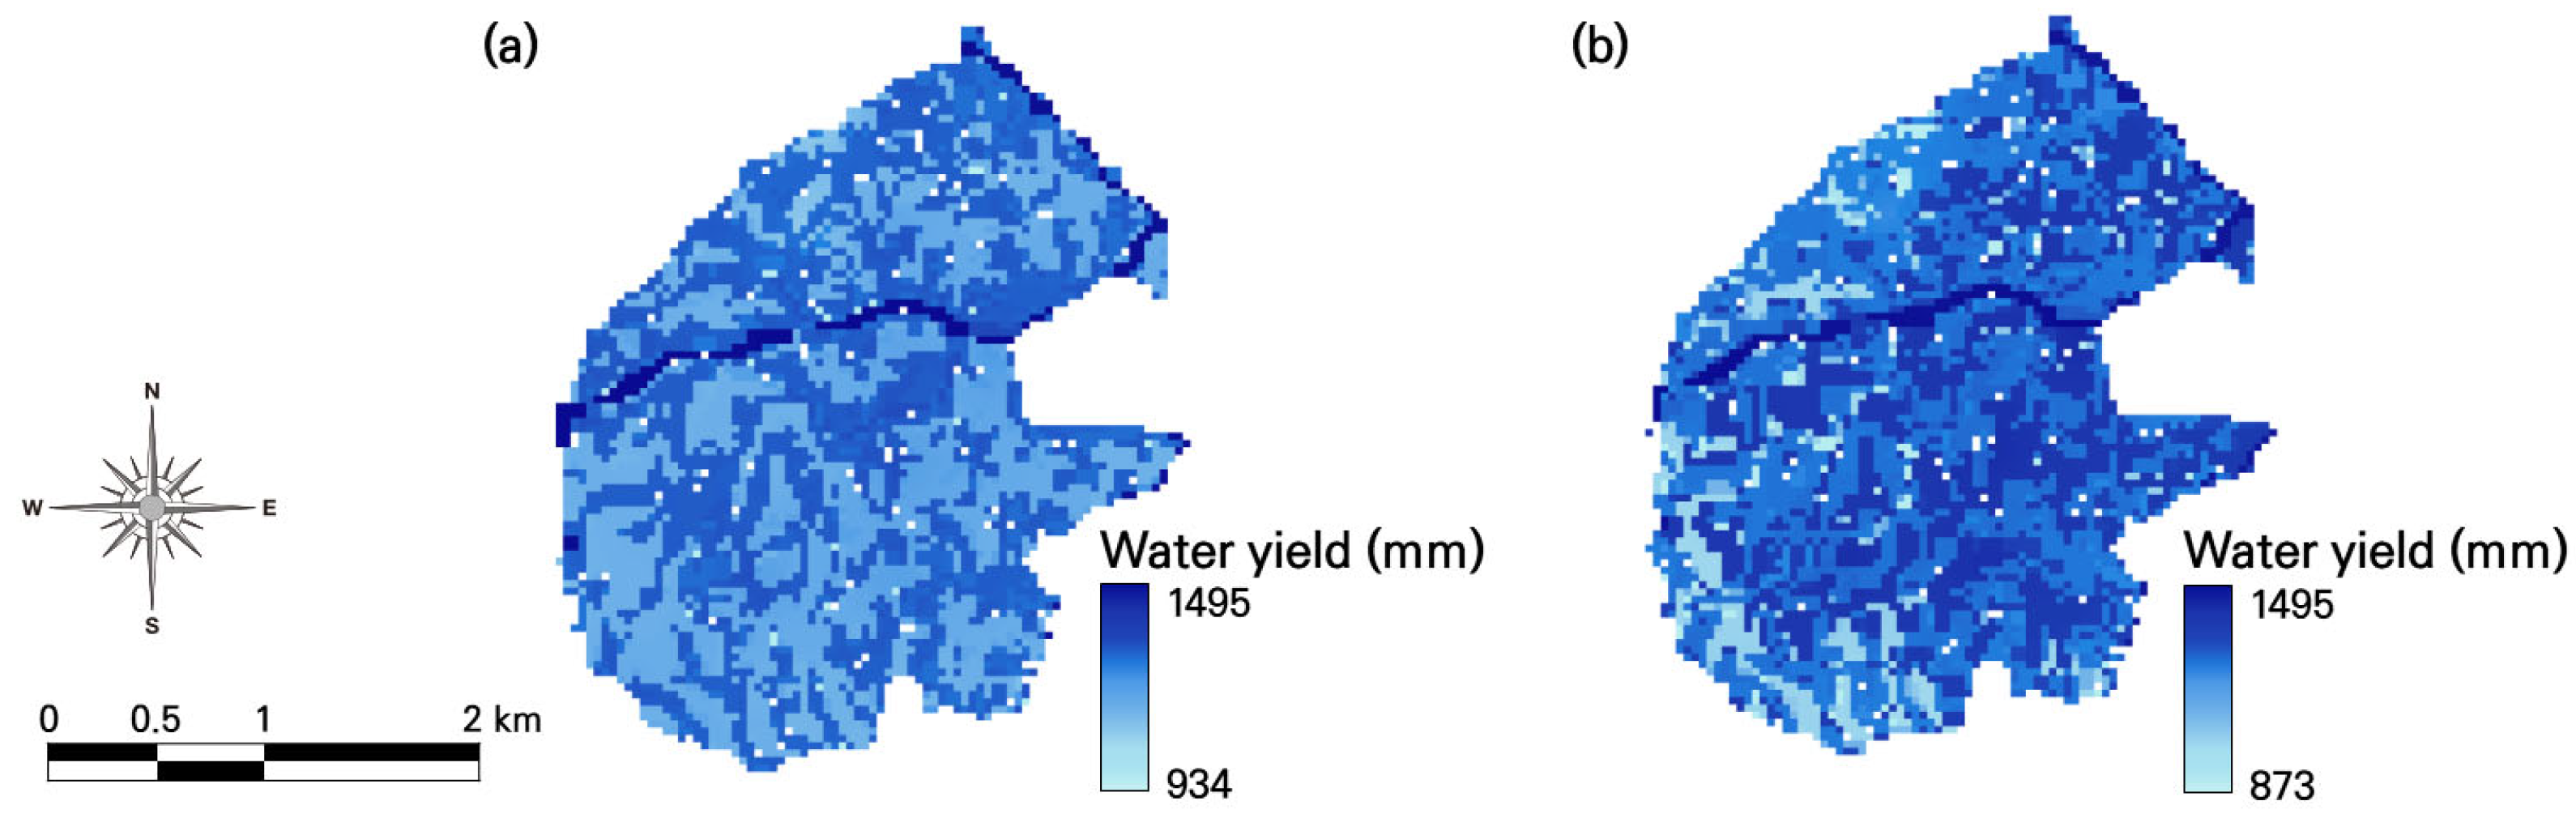
The annual total water yield for the study area was estimated at 5,998,431 m3 (1249 mm) before the wildfire and increased to 6,421,542 m3 (1337 mm) after the wildfire in May. According to the InVEST model results, the water yield increased by 423,111 m3 (87 mm), representing a 7.05% increase compared to March (Table 7 and Figure 7). This slight increase in water yield after the wildfire aligns with the general understanding that reduced vegetation cover following a wildfire leads to decreased evapotranspiration and temporarily increased runoff [45,46].
Table 7.
Pre- and post-wildfire annual water-yield estimates for the year 2023 based on the InVEST model. The estimates are derived by applying the same precipitation data from 2023 to both scenarios, isolating the impact of land cover change caused by the wildfire. The results present the water yield per unit area (mm) and total water yield (m3) for the study area.

Figure 7.
Spatial distribution of water yield (mm) before and after the wildfire for the year 2023. Both maps are based on the InVEST model using the same annual precipitation from 2023 to isolate the effects of land cover change. (a) Pre-wildfire water-yield estimates for the study area, derived from the InVEST model using land cover data from March. (b) Post-wildfire water-yield estimates incorporating burned areas detected in May.
However, this increase in water yield does not necessarily indicate an improvement in the quality of ecosystem services. On the contrary, it may signify negative impacts on the hydrological cycle, such as increased flood intensity downstream and reduced baseflow. Therefore, while the InVEST model effectively captures changes in water yield associated with land cover alterations, it does not directly quantify the quality of water-related ecosystem services or the broader ecological impacts of disturbances caused by wildfires.
This limitation highlights the need for a comprehensive approach when using the InVEST model to quantify changes in the hydrological cycle following wildfire events. While the model provides valuable insights into the magnitude of water-yield changes, it should be complemented with additional analyses to assess the qualitative impacts on ecosystem services and ecological health.
3.2. Emprical Validation of the InVEST with SWAT Model
3.2.1. Results for Calibration and Validation with SWAT-CUP
The SWAT model was calibrated and validated using observed streamflow data from the Hoesangyo gauging station, located near the outlet of the Gangneung–Namdaecheon watershed. The calibration process was conducted to optimize the model’s ability to accurately simulate streamflow, ensuring its reliability before using SWAT-derived water-yield estimates for comparison with the InVEST model’s water-yield outputs.
Excluding the warm-up period (2018–2019), the model was calibrated from 2020 to 2022 and validated from 2023 to 2024. The model demonstrated good performance during calibration, with R2 = 0.86 and NSE = 0.86, indicating reliable agreement with observed streamflow. During validation, performance improved to R2 = 0.91 and NSE = 0.88, confirming the model’s predictive accuracy beyond the calibration phase. Table 8 summarizes SWAT model performance-evaluation results. This confirms that SWAT is well calibrated for simulated runoff, as both R2 and NSE are generally considered to be very good, as shown in Table 9.
Table 8.
SWAT model performance-evaluation criteria for R2 and NSE at a monthly time step. The table presents the performance metrics for the total simulation period (2020–2024), calibration period (2020–2022), and validation period (2023–2024).
Table 9.
SWAT performance evaluation criteria for R2 and NSE for a monthly time step. These criteria were used to assess the agreement between observed and simulated streamflow, ensuring the reliability of the model-calibration and -validation process. The criteria adopted in this study follow the guidelines established by [47,48].
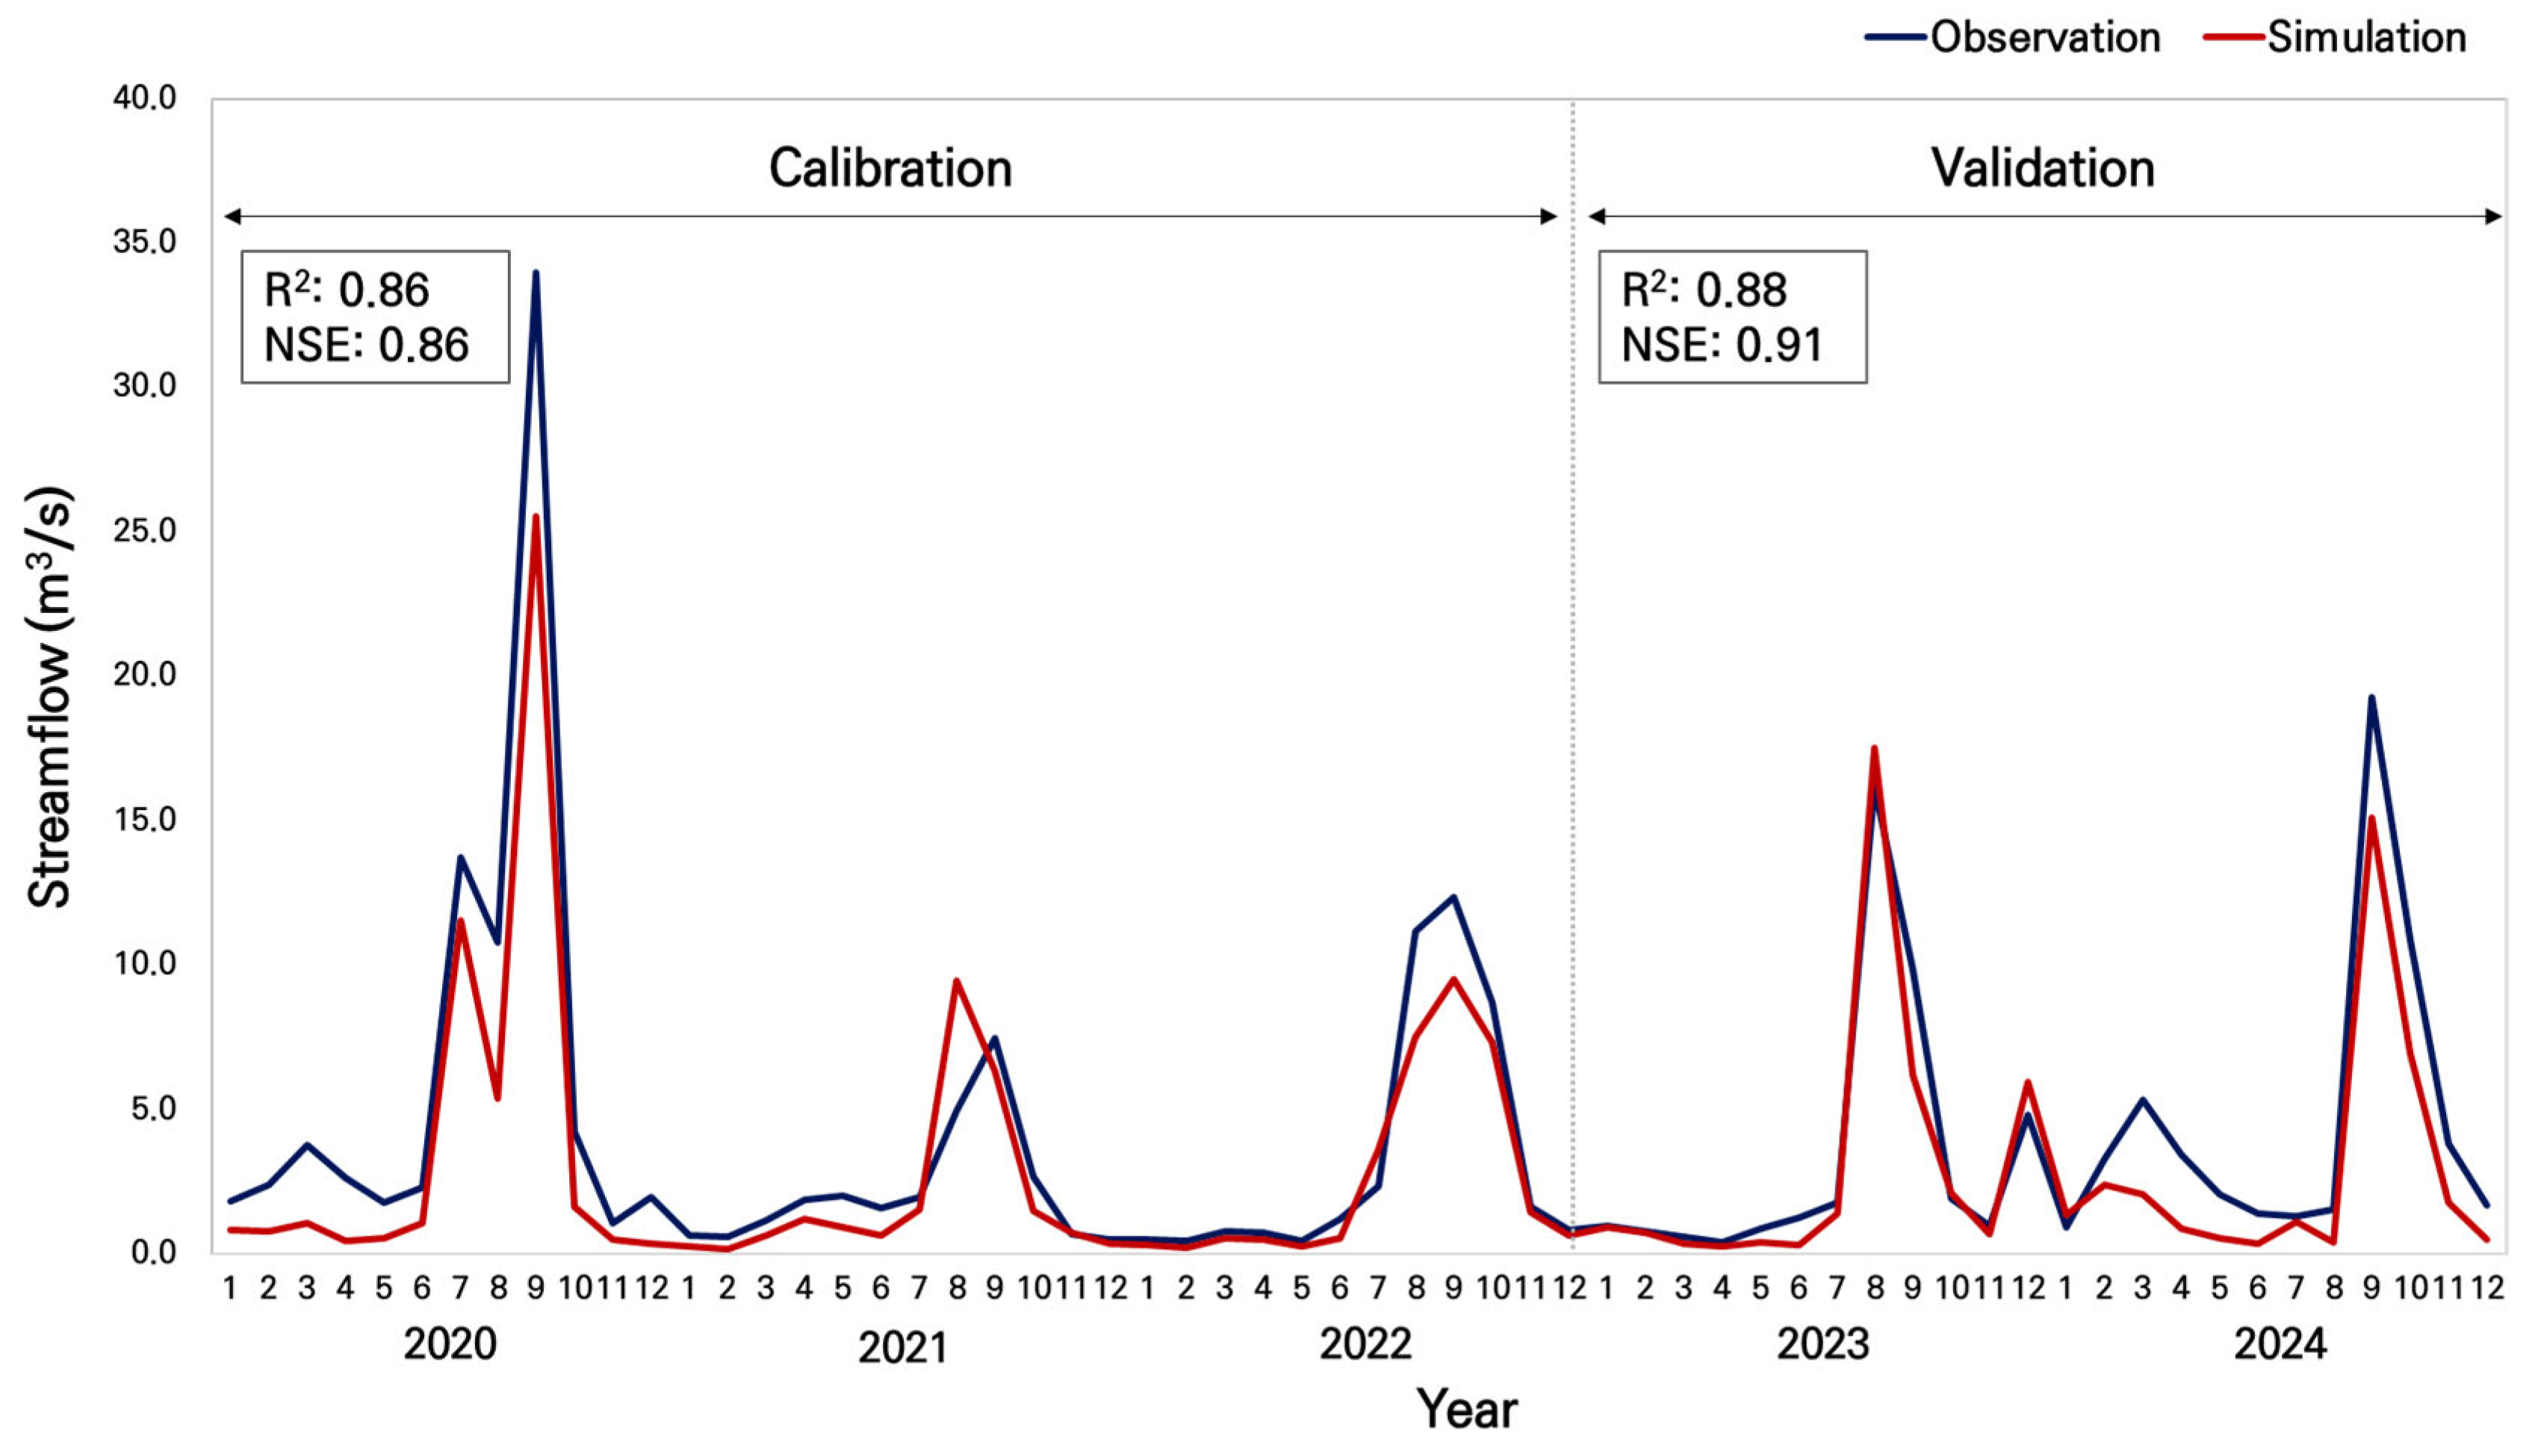
The comparison of observed and simulated streamflow (as shown in Figure 8) further supports the reliability of the model, with simulated streamflow closely following observed trends and seasonal variations. Minor discrepancies in peak flows may be attributed to uncertainties in input data (e.g., precipitation distribution, soil moisture dynamics) or ungauged inflows.
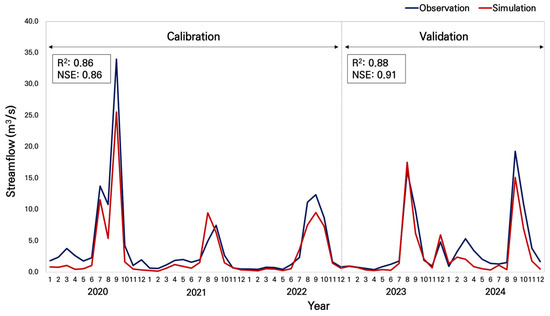
Figure 8.
Streamflow hydrograph of Hoesangyo gauging station. The figure presents the comparison between observed (blue) and simulated (red) streamflow (m3/s) at the Hoesangyo gauging station for the calibration (2020–2022) and validation (2023–2024) periods. Model performance was evaluated using R2 and NSE values, achieving R2 = 0.86, NSE = 0.86 for the calibration period and R2 = 0.88, NSE = 0.91 for the validation period.
3.2.2. Water-Yield Result Estimates Simulated by SWAT Model
After calibration and validation, the SWAT model was applied to simulate water yield at the watershed scale. To estimate water yield within the study area, the water-yield values were extracted from 112 HRUs corresponding to the study site (Figure 9). The simulated water yield for the year 2023 ranged from 598 mm to 1169 mm, indicating substantial spatial heterogeneity. This variation is likely influenced by differences in topographic slope, vegetation cover, and soil-infiltration capacity across the watershed. The mean simulated water yield was calculated as 823 mm, indicating a moderate response of the watershed to precipitation inputs under the modeled conditions. Higher water-yield values were observed in specific HRUs characterized by steeper slopes and lower infiltration capacity, while lower values were associated with areas having dense vegetation cover and higher infiltration potential. These results provide a baseline for comparing the InVEST model outputs, as discussed in Section 3.2.3.
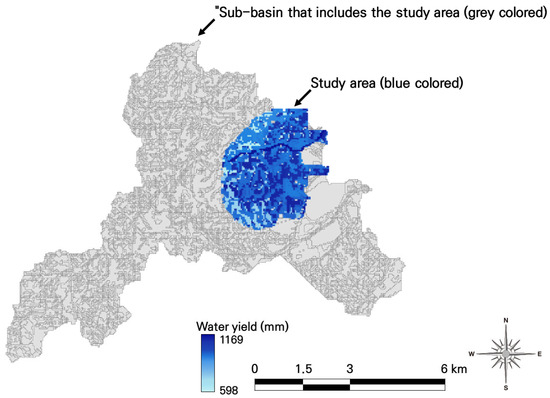
Figure 9.
Spatial distribution of water yield (mm) for the study area (blue colored) within the encompassing sub-basin (grey colored). Water-yield estimates within the study area ranged from 598 mm to 1169 mm.
3.2.3. Comparison Between InVEST and SWAT Results
The water yield per HRU extracted from the SWAT model to the study area for year 2023 was compared to the March annual water yield from InVEST as shown in Table 10. The results of running the InVEST water-yield model showed a total water yield of 1249 mm per year based on the March land cover map, while the HRU-specific water yields generated by SWAT and extracted to the study area were found to be 839 mm per year. Figure 10 shows the spatial distribution of annual water yield in 2023 estimated by the InVEST and SWAT models. While InVEST outputs appear more spatially uniform due to the model’s grid-based structure and reliance on generalized land cover parameters, SWAT outputs show greater spatial variability. This reflects the influence of HRU delineation, soil and slope heterogeneity, and the model’s detailed routing algorithms. These structural differences account for the variation in predicted spatial patterns, and should be considered when interpreting the suitability of each model for localized hydrological assessments. As shown in the results, the total annual water yield estimated by the SWAT model (3,983,515 m3) was approximately 33.6% lower than the result from the InVEST model (5,998,431 m3). This difference, equivalent to a 1.5 times higher yield in InVEST, reflects fundamental differences in model structure and assumptions. InVEST relies on a simplified water balance approach driven primarily by land cover and precipitation, while SWAT incorporates detailed hydrological processes such as infiltration, percolation, groundwater flow, and runoff routing. As a result, SWAT tends to produce more conservative water-yield estimates, especially in areas with complex topographic and subsurface conditions. This discrepancy does not undermine the utility of InVEST but highlights the importance of contextual interpretation, particularly when using the model for site-specific post-disturbance assessments. Considering the difference between the SWAT model, which considers the hydrological cycle, and the InVEST model, which is an empirical model that calculates the rainfall evapotranspiration difference, the results of InVEST are considered valid considering the precision of the SWAT model.
Table 10.
Comparison of water-yield estimates for year 2023 between the InVEST and SWAT models. The table presents water yield per unit area (mm) and total water yield (m3) for the study area, presetting the differences between the two models.
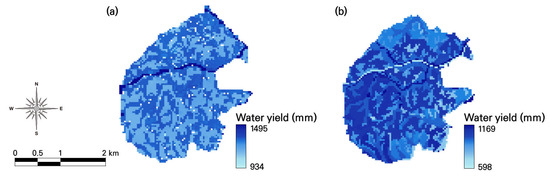
Figure 10.
Comparison of annual water-yield estimates from the InVEST and SWAT models for year 2023. (a) Water yield estimated using the InVEST model; (b) water yield estimated using the SWAT model.
3.3. Implications for Ecosystem Service Management Using InVEST Model
This study highlights the applicability and reliability of the InVEST model for assessing changes in water-related ecosystem services following a wildfire. By comparing InVEST’s water-yield estimates with those from the physically based SWAT model, this study confirms that InVEST can effectively capture the hydrological response to land cover changes caused by wildfire. Given its relatively low data and computational requirements, InVEST provides a rapid and accessible tool for evaluating water-yield variations, making it particularly useful for land and water resource managers, policymakers, and conservation planners dealing with wildfire-affected area.
A key distinction of this study is its application of InVEST at a localized scale (4.95 km2) rather than a broader watershed-level assessment. Although the InVEST model estimated a 7.05% increase in water yield following the wildfire, this result should not be interpreted as a positive outcome. Rather, the increase is likely driven by reduced evapotranspiration due to vegetation loss, leading to enhanced surface runoff. This shift may also reduce infiltration and baseflow stability, increase peak flows, and elevate the risk of erosion and downstream flooding. Prior studies have noted similar patterns, highlighting that wildfire-induced hydrological changes can compromise water quality and watershed resilience [46]. Therefore, post-wildfire water-yield assessments must be interpreted within the broader ecological and hydrological context. This demonstrates the model’s capability to provide spatially explicit, fine-scale insights into wildfire-induced hydrological changes. By quantifying changes in annual water yield before and after the wildfire, InVEST can inform post-fire management strategies, such as reforestation planning, erosion-control measures, and water resource allocation in small-scale impacted areas.
However, careful interpretation is required when using InVEST in wildfire studies. While InVEST estimates water yield as an ecosystem service, its modeling approach is based primarily on land cover characteristics and does not explicitly account for post-fire soil hydrophobicity, changes in infiltration capacity, or shifts in groundwater recharge dynamics. In wildfire-affected regions, where such hydrological processes play a critical role, InVEST may overestimate or misrepresent certain aspects of water-yield changes if used without validation.
Despite these limitations, this study demonstrates that InVEST remains a valuable tool for evaluating wildfire-induced changes in water-related ecosystem services, particularly when supported by empirical validation. By confirming its reliability through comparison with SWAT, this study underscores InVEST’s potential as a widely applicable and efficient tool for ecosystem service assessments in post-wildfire areas.
3.4. Limitations and Future Research Directions
This study isolates the impact of land cover changes caused by wildfire on annual water yield by holding precipitation constant across pre- and post-fire scenarios. While this approach effectively highlights the direct influence of land cover change, it does not account for precipitation variability, extreme weather events, or seasonal hydrological fluctuations, which also shape water-related ecosystem services. Future studies could incorporate climate variability scenarios to provide a more comprehensive assessment of post-wildfire hydrological changes. Another limitation lies in the simplified computational structure of the InVEST model. InVEST estimates water yield based primarily on land cover characteristics using a basic water balance equation, without explicitly modeling surface runoff, infiltration, or groundwater recharge. In wildfire-affected landscapes, where soil hydrophobicity and infiltration changes significantly influence hydrological processes, this simplification may limit the model’s ability to fully represent post-fire hydrological responses. Additionally, the validation of InVEST outputs in this study relied on comparison with a well-calibrated SWAT model, rather than with observed water-yield data. While this indirect validation approach is a limitation, it was necessary due to the absence of spatially distributed, post-wildfire hydrological observations. The substantial discrepancy between the two models reflects structural differences: InVEST simplifies hydrological processes, whereas SWAT incorporates detailed soil moisture, and groundwater components. As such, the comparison results should not be interpreted as a precise validation, but rather as a first-order indication of directional change. Future studies should pursue validation against field-based hydrological measurements.
Although validation against SWAT confirms the general reliability of InVEST estimates, SWAT itself has inherent uncertainties related to parameter calibration and input data resolution. Future research could refine post-wildfire assessments by incorporating models that account for soil moisture dynamics and hydrological connectivity. The spatial scale of this study also presents a limitation. By focusing on a localized area (4.95 km2), the study captures fine-scale hydrological changes but may not fully account for watershed-scale processes such as downstream flow regulation and cumulative impacts. Additionally, the use of 30 m resolution data may be considered coarse relative to the small size of the study area (4.95 km2). This resolution was selected to maintain consistency with other model inputs, such as climate and soil data. However, we acknowledge that finer-resolution datasets (e.g., <10 m) may better capture localized variability, especially in highly heterogeneous, post-wildfire landscapes. Future research could explore the influence of spatial resolution on model sensitivity and accuracy in small-scale ecosystem service assessments. Expanding research across multiple spatial scales would enhance the applicability of findings for regional water resource management. Lastly, this study primarily examines water yield, but wildfire impacts extend beyond water quantity to include sediment transport, water quality deterioration, and changes in groundwater recharge. Future research should incorporate additional ecosystem service indicators to provide a more holistic evaluation of wildfire effects. By addressing these limitations, future studies can enhance the accuracy of wildfire impact assessments and improve post-fire management strategies.
4. Conclusions
This study assessed the impact of wildfire-induced land cover changes on water yield using the InVEST model and examined its applicability through comparison with the SWAT model. The results confirmed that wildfire led to an increase in water yield due to the reduction of land cover types with high vegetation density, altering hydrological processes such as infiltration, runoff, and water retention. This response aligns with established hydrological dynamics following land cover disturbances, where the loss of vegetation reduces water-absorption capacity, increases direct runoff, and modifies watershed hydrology. While InVEST provided a rapid and spatially explicit assessment of these changes, its simplified water balance approach does not account for key post-fire hydrological factors such as altered infiltration capacity, soil hydrophobicity, and groundwater recharge shifts.
The findings of this study highlight the practical utility of InVEST as an efficient tool for assessing water-related ecosystem services in wildfire-affected landscapes, particularly for informing land management and restoration strategies. Given its computational efficiency and accessibility, InVEST can serve as a valuable decision-support tool for post-fire water resource management. However, wildfire impacts on ecosystem services extend beyond changes in water yield. A more holistic evaluation incorporating trade-offs among multiple ecosystem services, such as sediment regulation, carbon sequestration, and habitat quality, is necessary for comprehensive post-fire management strategies. While physically based models such as SWAT provide valuable validation for hydrological assessments, future research should focus on integrating diverse ecosystem service indicators to better capture the multi-dimensional impacts of wildfire on landscapes.
Future research should incorporate climate variability, extreme precipitation events, and additional ecosystem service metrics to provide a more comprehensive evaluation of wildfire impacts. Expanding the study to broader spatial scales and incorporating multi-service trade-off analyses would further enhance the robustness of ecosystem service assessments. Despite its limitations, this study demonstrates that InVEST remains a useful and scalable tool for assessing wildfire-induced changes in ecosystem services, particularly when applied within a broader framework that considers interactions between hydrological, ecological, and socio-economic factors.
Author Contributions
Conceptualization, W.S.J. and Y.I.K.; methodology, W.S.J. and Y.I.K.; validation, Y.I.K.; investigation, B.E. and Y.I.K.; resources, W.S.J. and Y.J.Y.; data curation, B.E.; writing—original draft preparation, Y.I.K.; writing—review and editing, B.E. and W.S.J.; visualization, Y.I.K. and Y.J.Y.; supervision, W.S.J. and Y.J.Y.; project administration, W.S.J. funding acquisition, W.S.J. All authors have read and agreed to the published version of the manuscript.
Funding
This study was supported by the research project Developing of S–P–C experts for field-adaptive forest fire management (S: smart, P: professional, C: confluence) (Funding number: RS-2024-04970002), funded by the Korea Forest Service.
Data Availability Statement
The original contributions presented in this study are included in the article. Further inquiries can be directed to the corresponding authors.
Conflicts of Interest
The authors declare no conflicts of interest, and the funders had no role in the design of the study; in the collection, analyses, or interpretation of data; in the writing of the manuscript; or in the decision to publish the results.
References
- Millennium Ecosystem Assessment. 2001, Volume 2. Available online: https://www.millenniumassessment.org/en/About.html (accessed on 1 January 2025).
- Pausas, J.G.; Keeley, J.E. Wildfires as an ecosystem service. Front. Ecol. Environ. 2019, 17, 289–295. [Google Scholar] [CrossRef]
- Waring, R.H.; Schlesinger, W. Forest Ecosystems. Analysis at Multiples Scales; Academic Press: Cambridge, MA, USA, 1985; Volume 55. [Google Scholar]
- Perry, D.A.; Oren, R.; Hart, S.C. Forest Ecosystems; JHU Press: Baltimore, MD, USA, 2008. [Google Scholar]
- Nesbitt, L.; Hotte, N.; Barron, S.; Cowan, J.; Sheppard, S.R. The social and economic value of cultural ecosystem services provided by urban forests in North America: A review and suggestions for future research. Urban For. Urban Green. 2017, 25, 103–111. [Google Scholar] [CrossRef]
- Hamilton, D.A.; Brothers, K.L.; Jones, S.D.; Colwell, J.; Winters, J. Wildland fire tree mortality mapping from hyperspatial imagery using machine learning. Remote Sens. 2021, 13, 290. [Google Scholar] [CrossRef]
- Vukomanovic, J.; Steelman, T. A systematic review of relationships between mountain wildfire and ecosystem services. Landsc. Ecol. 2019, 34, 1179–1194. [Google Scholar] [CrossRef]
- Pereira, P.; Bogunovic, I.; Zhao, W.; Barcelo, D. Short-term effect of wildfires and prescribed fires on ecosystem services. Curr. Opin. Environ. Sci. Health 2021, 22, 100266. [Google Scholar] [CrossRef]
- Ice, G.G.; Neary, D.G.; Adams, P.W. Effects of wildfire on soils and watershed processes. J. For. 2004, 102, 16–20. [Google Scholar] [CrossRef]
- Bosso, L.; Ancillotto, L.; Smeraldo, S.; D’Arco, S.; Migliozzi, A.; Conti, P.; Russo, D. Loss of potential bat habitat following a severe wildfire: A model-based rapid assessment. Int. J. Wildland Fire 2018, 27, 756–769. [Google Scholar] [CrossRef]
- Moritz, M.A.; Batllori, E.; Bradstock, R.A.; Gill, A.M.; Handmer, J.; Hessburg, P.F.; Leonard, J.; McCaffrey, S.; Odion, D.C.; Schoennagel, T. Learning to coexist with wildfire. Nataure 2014, 515, 58–66. [Google Scholar] [CrossRef]
- Volkova, L.; Roxburgh, S.H.; Weston, C.J. Effects of prescribed fire frequency on wildfire emissions and carbon sequestration in a fire adapted ecosystem using a comprehensive carbon model. J. Environ. Manag. 2021, 290, 112673. [Google Scholar] [CrossRef]
- Schmerbeck, J.; Fiener, P. Wildfires, ecosystem services, and biodiversity in tropical dry forest in India. Environ. Manag. 2015, 56, 355–372. [Google Scholar] [CrossRef] [PubMed]
- Lecina-Diaz, J.; Martínez-Vilalta, J.; Alvarez, A.; Vayreda, J.; Retana, J. Assessing the risk of losing forest ecosystem services due to wildfires. Ecosystems 2021, 24, 1687–1701. [Google Scholar] [CrossRef]
- Brauman, K.A.; Daily, G.C.; Duarte, T.K.e.; Mooney, H.A. The nature and value of ecosystem services: An overview highlighting hydrologic services. Annu. Rev. Environ. Resour. 2007, 32, 67–98. [Google Scholar] [CrossRef]
- Havel, A.; Tasdighi, A.; Arabi, M. Assessing the hydrologic response to wildfires in mountainous regions. Hydrol. Earth Syst. Sci. 2018, 22, 2527–2550. [Google Scholar] [CrossRef]
- Robinne, F.-N.; Hallema, D.W.; Bladon, K.D.; Buttle, J.M. Wildfire impacts on hydrologic ecosystem services in North American high-latitude forests: A scoping review. J. Hydrol. 2020, 581, 124360. [Google Scholar] [CrossRef]
- Stephens, C.M.; Lall, U.; Johnson, F.; Marshall, L.A. Landscape changes and their hydrologic effects: Interactions and feedbacks across scales. Earth-Sci. Rev. 2021, 212, 103466. [Google Scholar] [CrossRef]
- Rocca, M.E.; Miniat, C.F.; Mitchell, R.J. Introduction to the regional assessments: Climate change, wildfire, and forest ecosystem services in the USA. For. Ecol. Manag. 2014, 327, 265–268. [Google Scholar] [CrossRef]
- Marcos, B.; Gonçalves, J.; Alcaraz-Segura, D.; Cunha, M.; Honrado, J.P. A framework for multi-dimensional assessment of wildfire disturbance severity from remotely sensed ecosystem functioning attributes. Remote Sens. 2021, 13, 780. [Google Scholar] [CrossRef]
- Posner, S.M.; McKenzie, E.; Ricketts, T.H. Policy impacts of ecosystem services knowledge. Proc. Natl. Acad. Sci. USA 2016, 113, 1760–1765. [Google Scholar] [CrossRef]
- Hamel, P.; Guerry, A.D.; Polasky, S.; Han, B.; Douglass, J.A.; Hamann, M.; Janke, B.; Kuiper, J.J.; Levrel, H.; Liu, H.; et al. Mapping the benefits of nature in cities with the InVEST software. Npj Urban Sustain. 2021, 1, 25. [Google Scholar] [CrossRef]
- Arcidiacono, A.; Ronchi, S.; Salata, S. Ecosystem Services assessment using InVEST as a tool to support decision making process: Critical issues and opportunities. In Computational Science and Its Applications, Proceedings of the ICCSA 2015: 15th International Conference, Banff, AB, Canada, 22–25 June 2015; Proceedings, Part IV 15; Springer: Berlin/Heidelberg, Germany, 2015. [Google Scholar]
- Lüke, A.; Hack, J. Comparing the applicability of commonly used hydrological ecosystem services models for integrated decision-support. Sustainability 2018, 10, 346. [Google Scholar] [CrossRef]
- Zhang, R.; Shao, H.; Lim, H. Analysis of Water Conservation Mechanisms in the River Source Area of Northwest Sichuan from the Perspective of Vegetation Cover Zoning. Water 2024, 17, 54. [Google Scholar] [CrossRef]
- Mukhopadhyay, A.; Hati, J.P.; Acharyya, R.; Pal, I.; Tuladhar, N.; Habel, M. Global trends in using the InVEST model suite and related research: A systematic review. Ecohydrol. Hydrobiol. 2024; in press. [Google Scholar] [CrossRef]
- Vorstius, A.C.; Spray, C.J. A comparison of ecosystem services mapping tools for their potential to support planning and decision-making on a local scale. Ecosyst. Serv. 2015, 15, 75–83. [Google Scholar] [CrossRef]
- Daneshi, A.; Brouwer, R.; Najafinejad, A.; Panahi, M.; Zarandian, A.; Maghsood, F.F. Modelling the impacts of climate and land use change on water security in a semi-arid forested watershed using InVEST. J. Hydrol. 2021, 593, 125621. [Google Scholar] [CrossRef]
- He, C.; Zhang, D.; Huang, Q.; Zhao, Y. Assessing the potential impacts of urban expansion on regional carbon storage by linking the LUSD-urban and InVEST models. Environ. Model. Softw. 2016, 75, 44–58. [Google Scholar] [CrossRef]
- Scordo, F.; Lavender, T.M.; Seitz, C.; Perillo, V.L.; Rusak, J.A.; Piccolo, M.C.; Perillo, G.M. Modeling water yield: Assessing the role of site and region-specific attributes in determining model performance of the InVEST seasonal water yield model. Water 2018, 10, 1496. [Google Scholar] [CrossRef]
- Wei, P.; Chen, S.; Wu, M.; Deng, Y.; Xu, H.; Jia, Y.; Liu, F. Using the InVEST model to assess the impacts of climate and land use changes on water yield in the upstream regions of the Shule River Basin. Water 2021, 13, 1250. [Google Scholar] [CrossRef]
- Liu, R.; Niu, X.; Wang, B.; Song, Q. InVEST model-based spatiotemporal analysis of water supply services in the Zhangcheng District. Forests 2021, 12, 1082. [Google Scholar] [CrossRef]
- Pandeya, B.; Buytaert, W.; Zulkafli, Z.; Karpouzoglou, T.; Mao, F.; Hannah, D.M. A comparative analysis of ecosystem services valuation approaches for application at the local scale and in data scarce regions. Ecosyst. Serv. 2016, 22, 250–259. [Google Scholar] [CrossRef]
- Vogler, K.C.; Ager, A.A.; Day, M.A.; Jennings, M.; Bailey, J.D. Prioritization of forest restoration projects: Tradeoffs between wildfire protection, ecological restoration and economic objectives. Forests 2015, 6, 4403–4420. [Google Scholar] [CrossRef]
- Redhead, J.; Stratford, C.; Sharps, K.; Jones, L.; Ziv, G.; Clarke, D.; Oliver, T.; Bullock, J. Empirical validation of the InVEST water yield ecosystem service model at a national scale. Sci. Total Environ. 2016, 569, 1418–1426. [Google Scholar] [CrossRef] [PubMed]
- Xie, S.; Liu, L.; Zhang, X.; Yang, J.; Chen, X.; Gao, Y. Automatic land-cover mapping using landsat time-series data based on google earth engine. Remote Sens. 2019, 11, 3023. [Google Scholar] [CrossRef]
- Song, C.; Lee, W.-K.; Choi, H.; Jeon, S.; Kim, J.; Kim, J.; Kim., J. Application of the InVEST Water Yield Model for the evaluation of ecosystem services for the water supply of forests. J. Soc. Geoinf. 2015, 18, 120–134. [Google Scholar]
- Arnold, J.G.; Moriasi, D.N.; Gassman, P.W.; Abbaspour, K.C.; White, M.J.; Srinivasan, R.; Santhi, C.; Harmel, R.; Van Griensven, A.; Van Liew, M.W. SWAT: Model use, calibration, and validation. Trans. ASABE 2012, 55, 1491–1508. [Google Scholar] [CrossRef]
- Neitsch, S.L.; Arnold, J.G.; Kiniry, J.R.; Williams, J.R. Soil and Water Assessment Tool Theoretical Documentation Version 2009; Texas Water Resources Institute: College Station, TX, USA, 2011. [Google Scholar]
- Abbaspour, K.; Vejdani, M.; Haghighat, S. Swat-Cup2: SWAT Calibration and Uncertainty Programs Manual Version 2, Department of Systems Analysis. In Integrated Assessment and Modelling (SIAM), Eawag; Swiss Federal Institute of Aquatic Science and Technology: Duebendorf, Switzerland, 2011; p. 106. [Google Scholar]
- Abbaspour, K.C.; Johnson, C.; Van Genuchten, M.T. Estimating uncertain flow and transport parameters using a sequential uncertainty fitting procedure. Vadose Zone J. 2004, 3, 1340–1352. [Google Scholar] [CrossRef]
- Ryu, J.; Kang, H.; Choi, J.W.; Kong, D.S.; Gum, D.; Jang, C.H.; Lim, K.J. Application of SWAT-CUP for streamflow auto-calibration at Soyang-gang dam watershed. J. Korean Soc. Water Environ. 2012, 28, 347–358. [Google Scholar]
- Lee, J.M.; Park, Y.S.; Jung, Y.; Cho, J.; Yang, J.E.; Lee, G.; Kim, K.-S.; Lim, K.J. Analysis of spatiotemporal changes in groundwater recharge and baseflow using SWAT and BFlow Models. J. Korean Soc. Water Environ. 2014, 30, 549–558. [Google Scholar] [CrossRef]
- Razavi, S.; Gupta, H.V. A new framework for comprehensive, robust, and efficient global sensitivity analysis: 2. Application. Water Resour. Res. 2016, 52, 440–455. [Google Scholar] [CrossRef]
- Jones, J.A.; Wei, X.; Archer, E.; Bishop, K.; Blanco, J.A.; Ellison, D.; Gush, M.B.; McNulty, S.G.; van Noordwijk, M.; Creed, I.F. Forest-water interactions under global change. For.-Water Interact. 2020, 240, 589–624. [Google Scholar]
- Poon, P.K.; Kinoshita, A.M. Spatial and temporal evapotranspiration trends after wildfire in semi-arid landscapes. J. Hydrol. 2018, 559, 71–83. [Google Scholar] [CrossRef]
- Jang, W.S.; Engel, B.; Ryu, J. Efficient flow calibration method for accurate estimation of baseflow using a watershed scale hydrological model (SWAT). Ecol. Eng. 2018, 125, 50–67. [Google Scholar] [CrossRef]
- Moriasi, D.N.; Gowda, P.H.; Arnold, J.G.; Mulla, D.J.; Ale, S.; Steiner, J.L.; Tomer, M.D. Evaluation of the Hooghoudt and Kirkham tile drain equations in the Soil and Water Assessment Tool to simulate tile flow and nitrate-nitrogen. J. Environ. Qual. 2013, 42, 1699–1710. [Google Scholar] [CrossRef] [PubMed]


Disclaimer/Publisher’s Note: The statements, opinions and data contained in all publications are solely those of the individual author(s) and contributor(s) and not of MDPI and/or the editor(s). MDPI and/or the editor(s) disclaim responsibility for any injury to people or property resulting from any ideas, methods, instructions or products referred to in the content. |
© 2025 by the authors. Licensee MDPI, Basel, Switzerland. This article is an open access article distributed under the terms and conditions of the Creative Commons Attribution (CC BY) license (https://creativecommons.org/licenses/by/4.0/).