Article

Analysis of Contaminant Behavior in Loop Pipe System for Ultrapure Water Distribution Using Computational Fluid Dynamics and Autopsy


1
School of Civil and Environmental Engineering, Kookmin University, 77 Jeongneung-ro, Seongbuk-gu, Seoul 02707, Republic of Korea
2
Jinsung ENC Co., Ltd., 46 Nonggongdanji-gil, Goa-eup, Gumi-si 39137, Gyeongsangbuk-do, Republic of Korea
*
Author to whom correspondence should be addressed.
Water 2026, 18(3), 429; https://doi.org/10.3390/w18030429
Submission received: 28 December 2025 / Revised: 2 February 2026 / Accepted: 5 February 2026 / Published: 6 February 2026
(This article belongs to the Section Water Quality and Contamination)

Abstract

Ultrapure water (UPW) distribution loops must deliver stable hydraulics while limiting contamination from polymer piping. This study integrates computational fluid dynamics (CFD) with systematic pipe autopsy to examine contaminant behavior in a pilot-scale UPW loop constructed using chlorinated polyvinyl chloride (CPVC) and polyvinylidene fluoride (PVDF) and operated under identical conditions. CFD predicted nearly identical loop-scale velocity, pressure, and temperature fields for both materials, and identified low-shear recirculation at elbows and downstream tees as zones of elevated particle residence. Lagrangian particle tracking (0.05 μm, no-sticking) showed rapid breakthrough and complete flushing within 13 min, providing a hydraulic susceptibility map for transient retention. After eight months of operation, 17 sections were inspected endoscopically and leached at 60 °C. CPVC exhibited yellow–brown discoloration and highly heterogeneous total organic carbon (TOC) release with hot spots of 16–18 mg·L−1, whereas PVDF showed low, spatially uniform TOC (0.4–2.3 mg·L−1) and minimal fouling; inorganic ions remained at sub-mg·L−1 levels for both materials. Overall, geometry governs where contamination can accumulate, while material properties control its magnitude and persistence, with PVDF providing greater resistance to long-term organic contamination than CPVC.

1. Introduction

Ultrapure water (UPW) and high-purity process water are indispensable utilities in semiconductor and advanced electronics manufacturing [1], where even trace levels of ions, organic carbon, microorganisms, or sub-micrometer particles can adversely affect device yield [2,3,4]. Industry guidelines such as SEMI F63 and ASTM D5127 define stringent quality criteria for UPW production and distribution, emphasizing that water quality must be preserved not only at the plant outlet but throughout the entire distribution loop to the point of use [5,6]. In parallel, SEMI F57 specifies minimum performance requirements for high-purity polymer materials and components for pipes, fittings and valves used in UPW and liquid chemical distribution systems. Collectively, these standards underscore that polymer piping must preserve UPW quality throughout distribution, yet may also introduce trace contaminants through extractables and surface-mediated accumulation phenomena [2].
Among polymer materials, chlorinated polyvinyl chloride (CPVC) and polyvinylidene fluoride (PVDF) are widely used in high-purity water distribution owing to their corrosion resistance and relatively low extractables compared with conventional polyvinyl chloride (PVC) or metallic piping [5,7,8]. However, they differ markedly in extractables and biostability. CPVC is a chlorinated derivative of PVC with improved temperature resistance and stiffness, and is commonly used in hot- and cold-water systems and industrial process piping [7]. In UPW applications, CPVC has been shown to exhibit higher leaching of organic carbon, metals and particles than PVDF, with stronger temperature dependence and longer stabilization times under both batch and loop conditions [9]. PVDF, a semi-crystalline fluoropolymer, is generally characterized by high chemical inertness, smoother internal surfaces, and comparatively low organic and particulate extractables in high-purity water service.
Recent biostability and leaching studies have demonstrated that PVDF pipes release significantly less TOC and support lower biomass formation than CPVC in semiconductor UPW systems. Duong et al. demonstrated that PVDF piping exhibits lower organic carbon elution and reduced susceptibility to bacterial growth compared to CPVC in full-scale semiconductor facilities [10]. Furthermore, Park et al. reported that CPVC released substantially higher amounts of TOC, metals and particles than PVDF in both batch and loop pilot tests, with CPVC showing a pronounced temperature dependence while PVDF rapidly reached a low, quasi-steady leaching level [9]. Together, these results indicate that PVDF is intrinsically more favorable than CPVC for maintaining low extractables and suppressing biofilm formation. However, these studies do not identify where particles and deposits preferentially accumulate within actual loop piping systems, nor do they clarify how loop geometry and local hydrodynamic conditions influence this behavior.
The transport and deposition of small particles in internal flows have been extensively analyzed in previous works in the literature. For example, Guha reviewed how convection, Brownian and turbulent diffusion, turbophoresis, gravitational settling and near-wall interception jointly govern particle motion and wall deposition in laminar and turbulent flows, highlighting the role of near-wall turbulence and surface characteristics [11]. Direct numerical simulations of turbulent pipe flow by Zahtila et al. have shown strong size-dependent segregation and near-wall accumulation of inertial particles driven by coherent turbulence structures and turbophoretic drift [12]. While these studies provide mechanistic insight, they did not focus on specific situations in industrial UPW distribution loops where there are tees, elbows, looped segments, flow splits, and elevation changes. The behavior of contaminant particles in UPW loop systems remains poorly quantified.
Autopsy techniques for membranes and other critical components in UPW production are well established for diagnostic purposes. Rho et al. combined autopsy of fouled reverse osmosis elements with detailed chemical and microscopic analysis to relate foulant composition and distribution to operating history and cleaning performance in a UPW system [13]. In contrast, systematic autopsy of UPW distribution loops, particularly CPVC and PVDF pipes used in semiconductor facilities, remains rare. This is primarily because disassembling the loops is costly and operationally disruptive. As a result, current understanding of polymer piping performance in UPW systems is dominated by short-term leaching and biostability tests, with limited direct evidence of spatial fouling patterns in realistic loop geometries [10,14].
Beyond short-term extractables and biostability testing, long-term contamination behavior in UPW distribution loops is increasingly recognized as a coupled outcome of hydrodynamics, pipe material, and spatially heterogeneous stagnation phenomena. Studies on drinking-water distribution systems have shown that regions of low wall shear stress and intermittent flow reversal strongly promote discoloration, particle retention, and biofilm persistence, independent of bulk water quality conditions [15,16]. At the same time, material-dependent surface properties modulate the extent to which these hydraulically defined zones evolve into stable contamination reservoirs, with smoother and more chemically inert polymers supporting lower biomass accumulation and reduced assimilable organic carbon utilization [15,17]. Despite their relevance, such interactions have not been systematically examined in UPW loop piping systems that combine complex geometries with high recirculation rates and stringent contamination control requirements.
In this context, resolving loop hydrodynamics is not auxiliary but essential because contamination hot spots in recirculating distribution loops are fundamentally conditioned by spatially heterogeneous velocity structures, branch-to-branch flow maldistribution, and the resulting distributions of wall shear stress and residence time. Discoloration material and cohesive particulate deposits have been shown to preferentially stabilize under chronically low or intermittent shear, whereas hydraulic conditioning and transient shear increases can mobilize stored material and trigger episodic water-quality excursions such as elevated particle counts [15,18]. Moreover, controlled loop studies demonstrate that the hydrodynamic regime and pipe material jointly govern biofilm development and detachment, indicating that material-dependent contamination cannot be interpreted without quantifying local shear and near-wall transport [19]. Accordingly, in the present work, a three-dimensional description of loop hydrodynamics is required to identify geometry-induced “dead zones” (e.g., elbows/tees) and interpret the position-resolved particle-transport and autopsy/leaching heterogeneity on a physically consistent basis [16].
These gaps motivate an integrated approach combining detailed three-dimensional simulations of flow and particle transport with a physical examination by autopsy. Building on this foundation, the present study focuses specifically on CPVC and PVDF loop piping used for the supply of UPW. A pilot-scale UPW supply loop was modeled using computational fluid dynamics (CFD) to estimate velocity, wall shear stress and temperature distributions, and to perform Lagrangian particle tracking for sub-micrometer particles. Sections of decommissioned CPVC and PVDF loop piping from the same system were then subjected to autopsy, including internal visual inspection and TOC extractable analysis, regarding SEMI F57-type criteria [20]. By explicitly comparing simulated hydrodynamic and particle-transport patterns with the spatial distribution of deposits and extractables observed in real loop segments, this work aims to elucidate how material choice (CPVC and PVDF) and loop hydrodynamics jointly determine contamination risk. The specific objectives are: (i) to characterize the flow and particle-transport behaviors in loop pipes using CFD; (ii) to identify high-risk regions for particle accumulation by autopsy; and (iii) to derive design-oriented indicators and qualitative guidelines that can support more robust design and operation of CPVC and PVDF loop systems for UPW distribution. The original contribution of this study lies in the spatially resolved coupling of CFD-predicted low-shear recirculation zones with experimentally observed TOC hot spots and discoloration patterns obtained from pipe autopsy in a UPW pipe system.

2. Methods

2.1. UPW Loop Piping System

2.1.1. System Configuration

The UPW distribution system investigated in this study is a closed-loop piping configuration that continuously recirculates UPW from a supply header through multiple points of use (POUs) and back to a return header. The primary functions of the loop are to maintain stable flow and pressure at the POUs, minimize water age, and suppress stagnant regions that could promote particle accumulation, pipe-wall leaching, or microbial growth. The loop was installed within a confined test area using a compact layout with an overall hydraulic path length of approximately 70 m between the supply and return lines, representative of industrial UPW distribution systems. This path length was selected to match the supply-to-return loop distance of the full-scale UPW distribution/return piping installed and operated in the semiconductor facility that motivated this study.
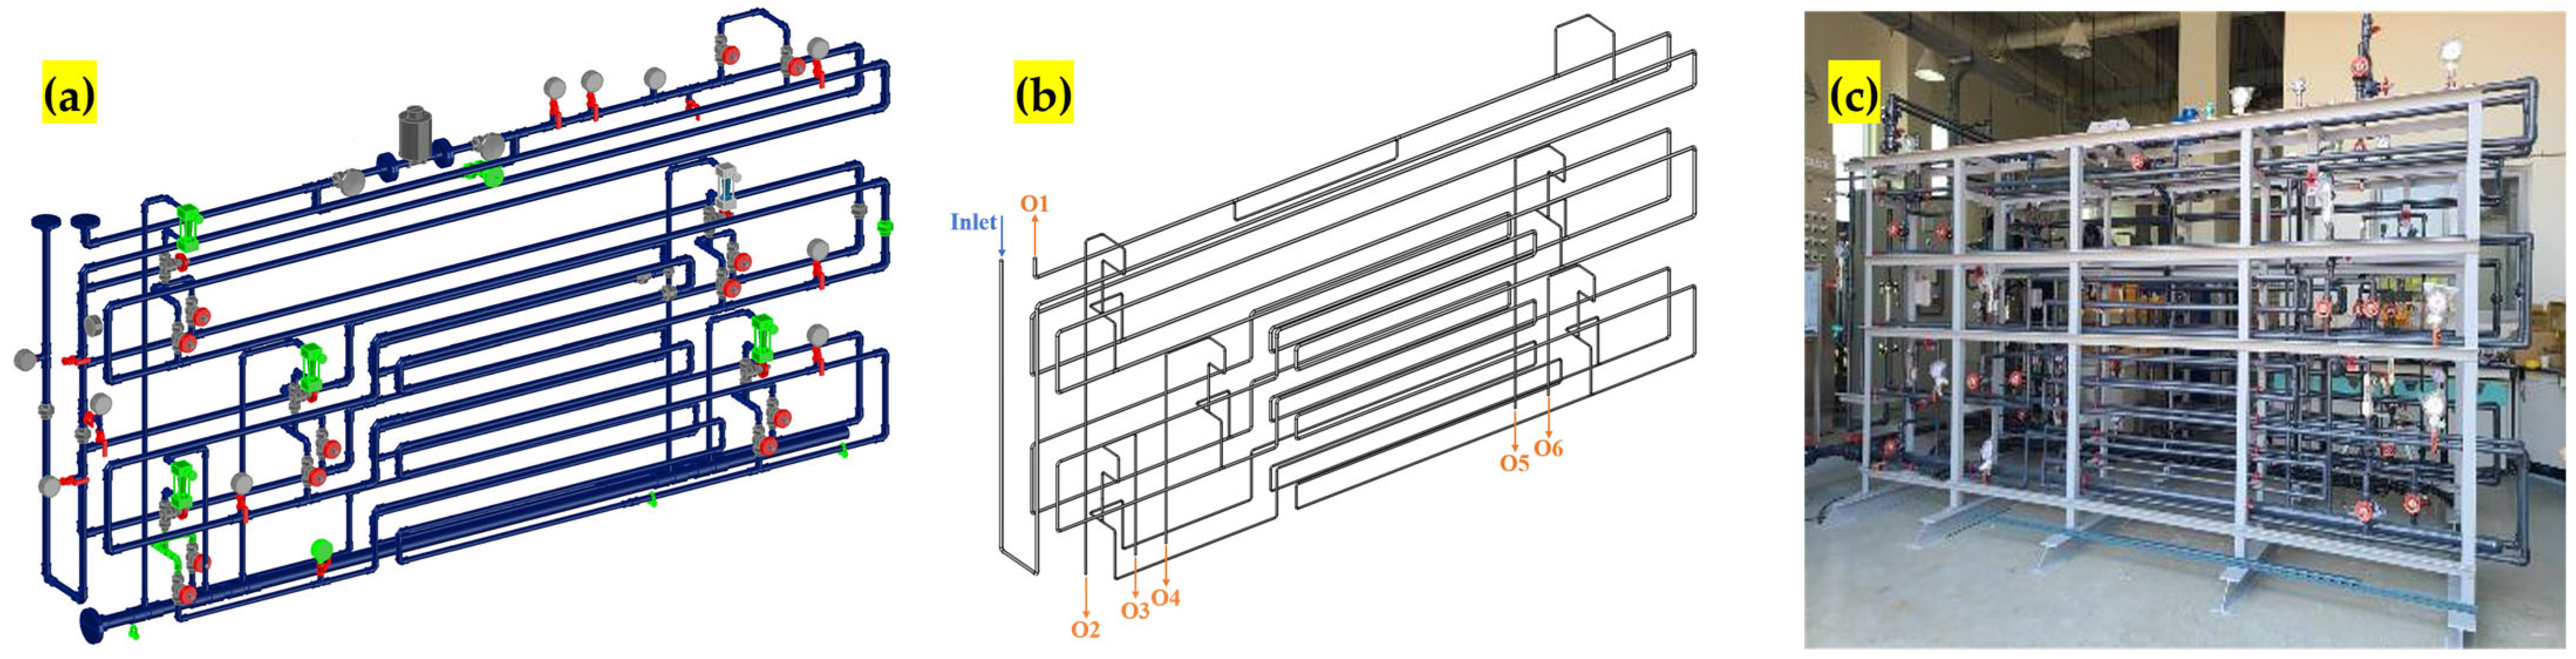
As shown in Figure 1, a direct-return loop layout was employed. In this configuration, UPW is distributed from the supply header to each point-of-use (POU) branch and returns to the header along the hydraulically shortest path, which yields a simple and widely adopted topology for high-purity distribution systems. Loop circulation was provided by a dedicated pump, and the operating conditions were fixed at a volumetric flow rate of 1.0 m3·h−1 with the return-line pressure controlled by a pressure-control valve (PCV) set to 0.7 bar. These setpoints were selected to match the operating conditions of the corresponding full-scale UPW distribution loop, thereby reproducing comparable recirculation intensity and return-line pressure level in the pilot platform. The same boundary conditions were applied identically in the physical loop tests and all CFD simulations to ensure direct comparability between experimental observations and numerical predictions. Figure 1 also represents the as-built pilot loop (3D design and installation photograph) and therefore includes auxiliary instrumentation and fittings (e.g., pressure gauges and manual valves) used for operation and monitoring; however, these components were not represented in the CFD geometry, and their hydraulic effects were not considered in this study.

2.1.2. Pipe Materials

To replicate the field UPW distribution network in a semiconductor manufacturing facility in Korea, the pilot-scale loop was constructed using the same commercial-grade CPVC and PVDF pipes installed on-site and selected to comply with SEMI F57 requirements. These two materials were intentionally chosen as representative high-purity polymer options, enabling a controlled head-to-head comparison under identical geometry and operating conditions. Table 1 summarizes the properties of these materials, which were determined based on manufacturer specifications and internal characterization. These properties were assumed to be temperature-independent over the investigated operating range and were applied consistently in all CFD simulations to enable direct comparison of hydrodynamic and particle-transport behavior between the two materials.
The CPVC loop was assembled using a high-purity CPVC pipe line intended for semiconductor UPW service (SEKISUI Chemical Co., Ltd., Isesaki, Japan), for which UPW conveyance requires piping that does not release contaminants such as TOC or heavy metals and that the inner surface is manufactured to be smooth to help suppress bacterial attachment. The PVDF loop employed a PVDF piping system (AGRU Korea Co., Ltd., Gyeonggi-do, Republic of Korea), which is described as being produced for ultrapure media supply systems under ISO Class 5 cleanroom conditions and delivered in double hermetically sealed packaging to reduce particulate contamination prior to installation. The compound of pipes contain no stabilizers, plasticizers/softeners, lubricants, or flame-retardant additives and exhibits very low leach-out behavior, with performance exceeding the SEMI F57 requirements, while also highlighting low roughness and a non-porous surface as beneficial for minimizing biofilm initiation [7].

2.2. Computational Fluid Dynamics (CFD)

All simulations were performed in COMSOL Multiphysics (version 6.3; COMSOL AB, Sweden), a commercially available finite-element CFD/multiphysics software package, using the Turbulent Flow, k–ω interface (RANS-EVM) for the hydrodynamics and Heat Transfer in Fluids for thermal transport, coupled through the Nonisothermal Flow formulation; particle transport was evaluated using a time-dependent Particle Tracing for Fluid Flow analysis based on the converged flow field.

2.2.1. Governing Equation

The CFD model of the UPW loop piping system was developed under the following assumptions: three-dimensional, steady-state, single-phase water flow in rigid pipes; incompressible and Newtonian fluid behavior, with density treated as constant except in the buoyancy term (Boussinesq approximation); turbulent flow described by the Reynolds-averaged Navier–Stokes (RANS) equations closed with a two-equation k–ω turbulence model; conjugate heat transfer between the fluid and the pipe wall, with thermal radiation and viscous dissipation neglected; and constant thermophysical properties for the solid materials (CPVC and PVDF), while water properties were treated as piecewise temperature-dependent over the investigated range.
Under these assumptions, the governing equations to simulate the momentum profile, the Navier–Stokes equations with k-ω turbulence model were used and represented as follows [21,22,23]:
ρ u · ∇ = 0
ρ u · ∇ = ∇ · − p I + K + F + F g
K = ( μ + μ T ) ( ∇ u + ( ∇ u ) T )
μ T = ρ k ω
F g = ρ r e f ( 1 − α r e f ) ( T − T r e f ) g
where ρ is the carrier-fluid (water) density (kg·m−3), u is the velocity vector (m·s−1), p is dynamic pressure (Pa), μ is dynamic viscosity of carrier-fluid (water) ((N·s)·m−2), and T is inlet temperature (K). In the k–ω closure, μT denotes the eddy (turbulent) viscosity; therefore, (μ + μT) represents the effective viscosity appearing in the momentum/stress terms, and μ and μT also enter the molecular and turbulent diffusion terms of the k- and ω-transport equations. I, F, K, and ∇ are the unit tensor, the volume force vector and del operator, respectively.
Energy conservation was written as follows [24,25]:
ρ C p u · ∇ T + ∇ · q = Q q = − k ∇ T
o u t e r   b o u n d a r y : − n · q = ∫ Q s − ∇ · q s q s = − k ∇ T
where Cp is heat capacity (J·kg−1·K−1), q is heat flux (W·m−2), Q is the heat source (W·m−3), and k is thermal conductivity (W·m−1·K−1).
These equations indicate that convective transport of sensible heat is balanced by effective conduction, including turbulent contributions, and by volumetric heat sources. An analogous Fourier conduction equation is solved within the pipe wall. The governing equations and modeling assumptions are consistent with previous CFD studies of pressurized water pipelines employing RANS-based Navier–Stokes and energy formulations for internal pipe flow.
All governing equations for the carrier flow (RANS with the k–ω turbulence model) and heat transfer were spatially discretized using the Galerkin finite element method (FEM) as implemented in COMSOL Multiphysics (CFD Module). For the convection-dominated transport terms inherent to turbulent internal pipe flow, consistent stabilization (e.g., streamline and crosswind diffusion in COMSOL) was enabled to mitigate nonphysical numerical oscillations and improve solver robustness [26,27].
It is noted that the k–ω model is employed to close the RANS momentum equation by modeling the Reynolds stresses (eddy-viscosity hypothesis), thereby providing the turbulent velocity field for the loop hydraulics [24,27]. Steady RANS was used to obtain mean fields. Thermal effects are accounted for by solving the energy conservation equation coupled to the turbulent flow field (nonisothermal/conjugate heat transfer), where the turbulent transport of heat is represented through a turbulent thermal conductivity (or eddy diffusivity) model, commonly expressed using a turbulent Prandtl number [28].
Particle motion was computed in a Lagrangian framework using the Particle Tracing for Fluid Flow interface. The trajectory q of each spherical particle (density ρp, diameter dp) obeys Newton’s second law:
m p d 2 q d t 2 = F D + F g
where FD is the Stokes drag and Fg is the net gravity–buoyancy force. The drag force is modeled by the classical Stokes law:
F D = m p τ p ( u − v ) τ p = ρ p d p 2 18 μ ( u − v )
where u is the carrier-fluid velocity interpolated from the RANS solution. Although the loop flow is turbulent at the pipe scale, the validity of the drag expression in Equation (9) is determined by the particle Reynolds number (Rep), which characterizes the flow regime around an individual particle and can be calculated by following equation [25,28,29]:
R e p = ρ f , l o c d p u − v μ
With size of particle we used (dp = 0.05 μm) and an upper-bound slip velocity on the order of the inlet mean velocity (0.85 m·s−1 at 1.0 m3·h−1), Rep, calculated from Equation (10), is approximately 4×10⁻² at 20 °C, confirming creeping-flow conditions around the particle and justifying the use of linear Stokes drag in the present Lagrangian tracking model (i.e., FD ∝ (u − v)) [30,31]. For larger particles or Rep approaching unity, a nonlinear drag correlation would be required; however, such conditions are not encountered in this study [29,30].
The gravity term is given by:
F g = m p g ρ p − ρ f , l o c ρ p
where ρp is the particle material density, ρf,loc is the local carrier-fluid density evaluated at the particle position, and g is the gravitational acceleration. Particle–wall interactions were treated as perfectly elastic reflections using a following bounce condition:
v + = v − − 2 n · v − n
where n is the wall normal and v− and v+ are the particle velocity immediately before and after collision, respectively. Other hydrodynamic forces such as virtual-mass, pressure-gradient, and lift forces were neglected, which is consistent with the standard Newtonian formulation of COMSOL’s Particle Tracing for Fluid Flow interface for small, dense particles in liquid flows [30,31].

2.2.2. Simulation Conditions

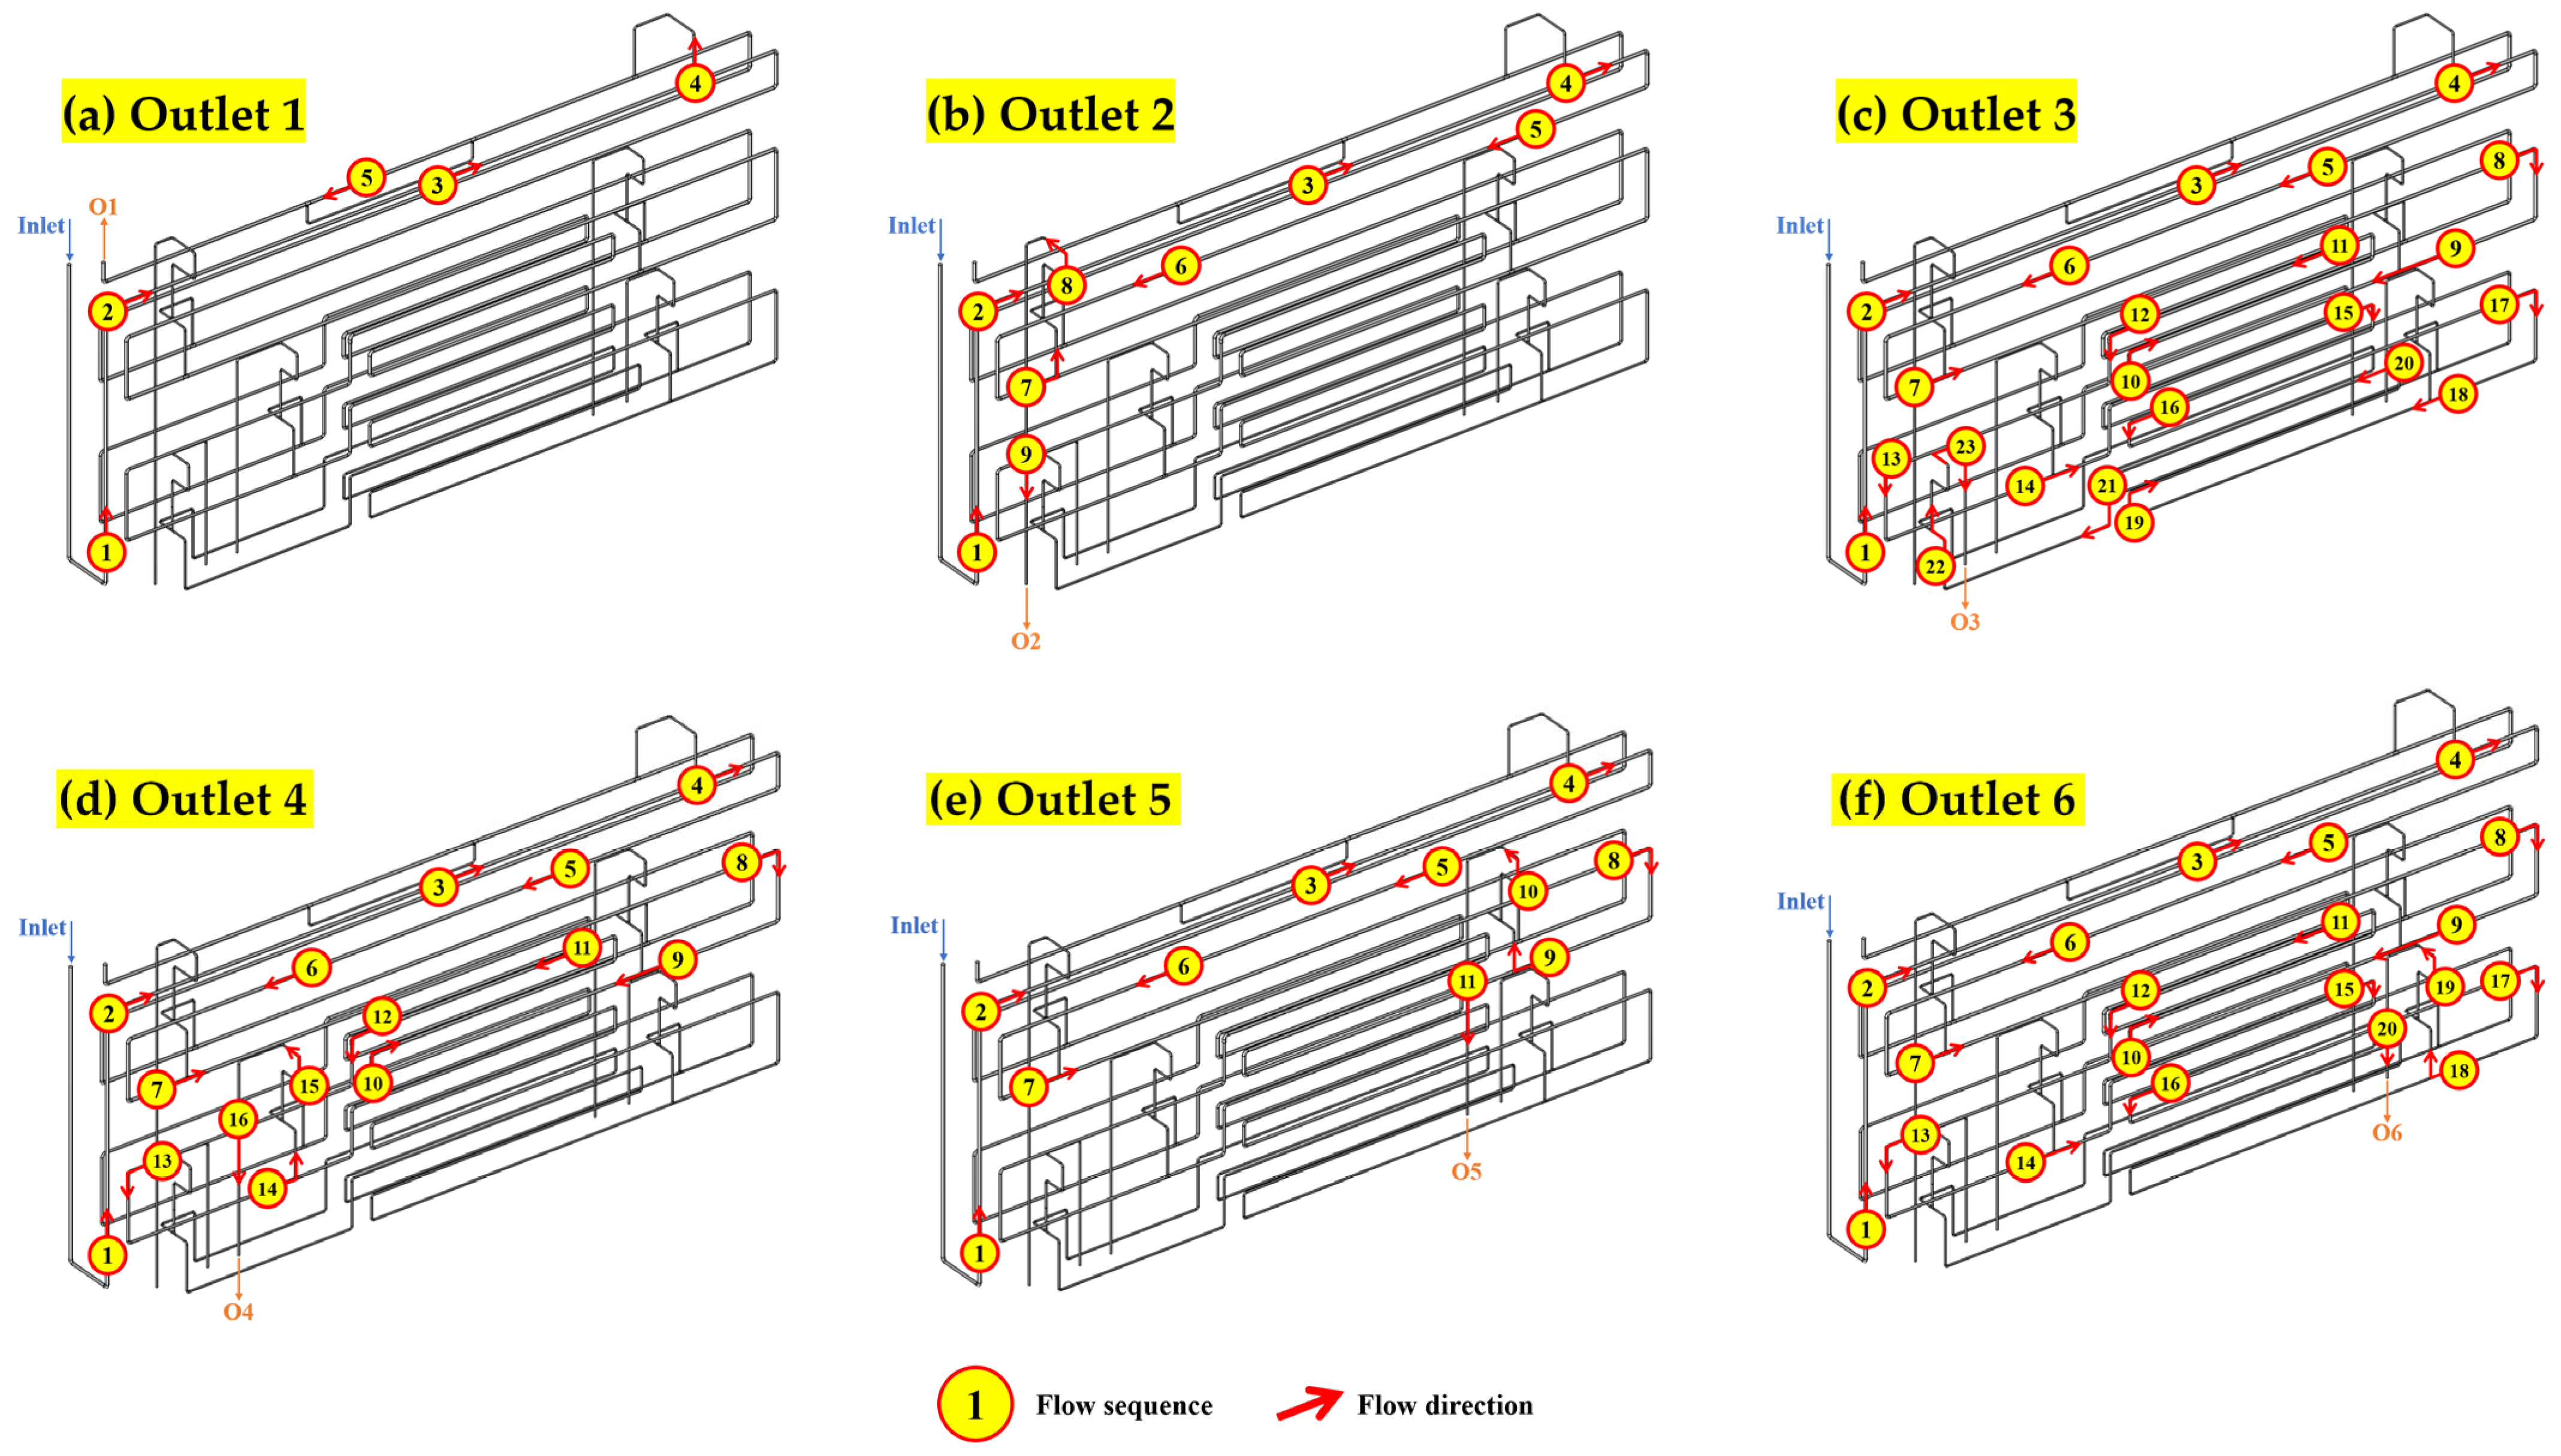
In the loop piping simulations, the inlet was specified as a velocity boundary condition corresponding to the experimental circulation flow rate. A uniform axial velocity of 0.85 m·s−1 was imposed, computed from the experimentally controlled circulation flow rate (1.0 m3·h−1) and the inner diameter (20.4 mm), was imposed together with a fixed inlet water temperature of 20 °C for all cases. This inlet condition was set to be identical to the experimentally controlled circulation flow rate (and the full-scale loop setpoint), thereby ensuring consistent boundary conditions between the pilot operation and the CFD simulations. As depicted in Figure 1b, six outlets (i.e., Outlet 1 to 6, which correspond to the six POU branch discharge locations) were modeled, each assigned a static pressure of 0 bar gauge (reference pressure 1 bar), representing discharge to a common return header; no additional constraints were applied to the outlet temperature, which was determined by the solution of the coupled energy equation. To explicitly indicate the flow routing and branch destinations that are not readily discernible in the as-built view (Figure 1), the CFD-geometry-based schematic in Figure 2 highlights the nominal UPW flow direction from the single inlet to each outlet branch (Outlet 1–6).
On all internal solid surfaces, a no-slip condition was applied and the appropriate surface roughness was specified according to the pipe material. Heat transfer through the pipe wall was represented using a thin-layer boundary formulation with the nominal wall thickness for each pipe size, and convective heat flux was imposed at the external surface with the ambient air temperature as a parameter. The computational domain was subjected to gravity acting in the –z direction.
Ambient temperature was varied from 0 to 40 °C in 10 °C increments as an external convective boundary condition at the outer pipe surface, while the inlet UPW temperature was fixed at 20 °C for all cases. This combination is physically plausible since the UPW supply temperature is controlled at a setpoint, whereas the surrounding air temperature depends on the pipe-routing environment and can be lower than the conveyed water. Under the present operating conditions with continuous circulation of 20 °C UPW, the pipe wall is thermally buffered; thus, freezing is not expected and the low-ambient cases do not impose a meaningful material-property limitation for either CPVC or PVDF. Based on these results, the case with the highest overall flow velocity (ambient temperature 40 °C and flow rate 1.0 m3·h−1) was selected for transient Lagrangian particle-tracking analysis, which was carried out separately for PVDF and CPVC using identical particle properties and injection conditions.
Particle transport was simulated using a one-way coupled, Lagrangian particle-tracking approach, in which individual particles follow Newton’s second law under hydrodynamic forces obtained from the carrier-flow solution [26,29]. The particle diameter (0.05 μm) was selected to match the smallest online particle-size class used for UPW monitoring at the point of distribution in ASTM D5127 (0.05–0.1 μm; >0.05 μm) [6]. A pulse release of 150 neutral solid particles (dp = 0.05 µm, ρp = 2650 kg·m−3) was injected at t = 0 from Inlet 1, seeded over the inlet cross-section using a density-based distribution, with the initial particle velocity set equal to the local fluid velocity field. A time-dependent study was performed for 15 min. Particle–surface adhesion or physicochemical interactions (e.g., electrostatic attachment) were not modeled; instead, particle–wall contact was treated using a bounce condition (no sticking), such that the simulation identifies hydrodynamically favorable residence/retention zones rather than absolute deposition. Particles reaching the outlet boundaries (Outlet 1–Outlet 6) were set to freeze and be counted, enabling outlet-wise transmission statistics and the remaining in-loop fraction to be quantified. The particle-tracing time horizon was set to 15 min to exceed multiple convective residence times (order of 100 s) and to be longer than the complete-flushing time, ensuring that outlet-wise cumulative particle fractions have stabilized.
The coupled thermo-hydraulic simulations were performed in COMSOL Multiphysics using Turbulent Flow, k–ω (RANS with wall functions) coupled with Heat Transfer in Fluids via the Nonisothermal Flow multiphysics formulation. Water was treated as incompressible with gravity enabled and a reference pressure level of 1 bar. Boundary conditions were prescribed as a normal inflow velocity (0.85 m·s−1) and fixed inlet water temperature (20 °C), with “Medium” turbulence intensity (IT = 0.05) and a geometry-based turbulence length scale; each outlet was set as a static pressure boundary (0 bar gauge) with hydrostatic-pressure compensation and backflow suppression [29].
To obtain a converged carrier-flow field, we used a staged stationary solution. First, an isothermal steady RANS solution was solved using a fully coupled direct solver with relative tolerance 10−3. The coupled nonisothermal flow was then solved using segregated stationary steps (=8.08 × 10⁶ DOFs) and a final stationary refinement step (=1.01 × 10⁷ DOFs), both with relative tolerance 10−3. Convergence was confirmed when the solution error estimates for the segregated groups decreased below 10−3. Particle transport was computed in a time-dependent Particle Tracing for Fluids study on the converged carrier-flow field using the PARDISO direct solver with relative tolerance 10−5.

2.3. Autopsy of Piping System

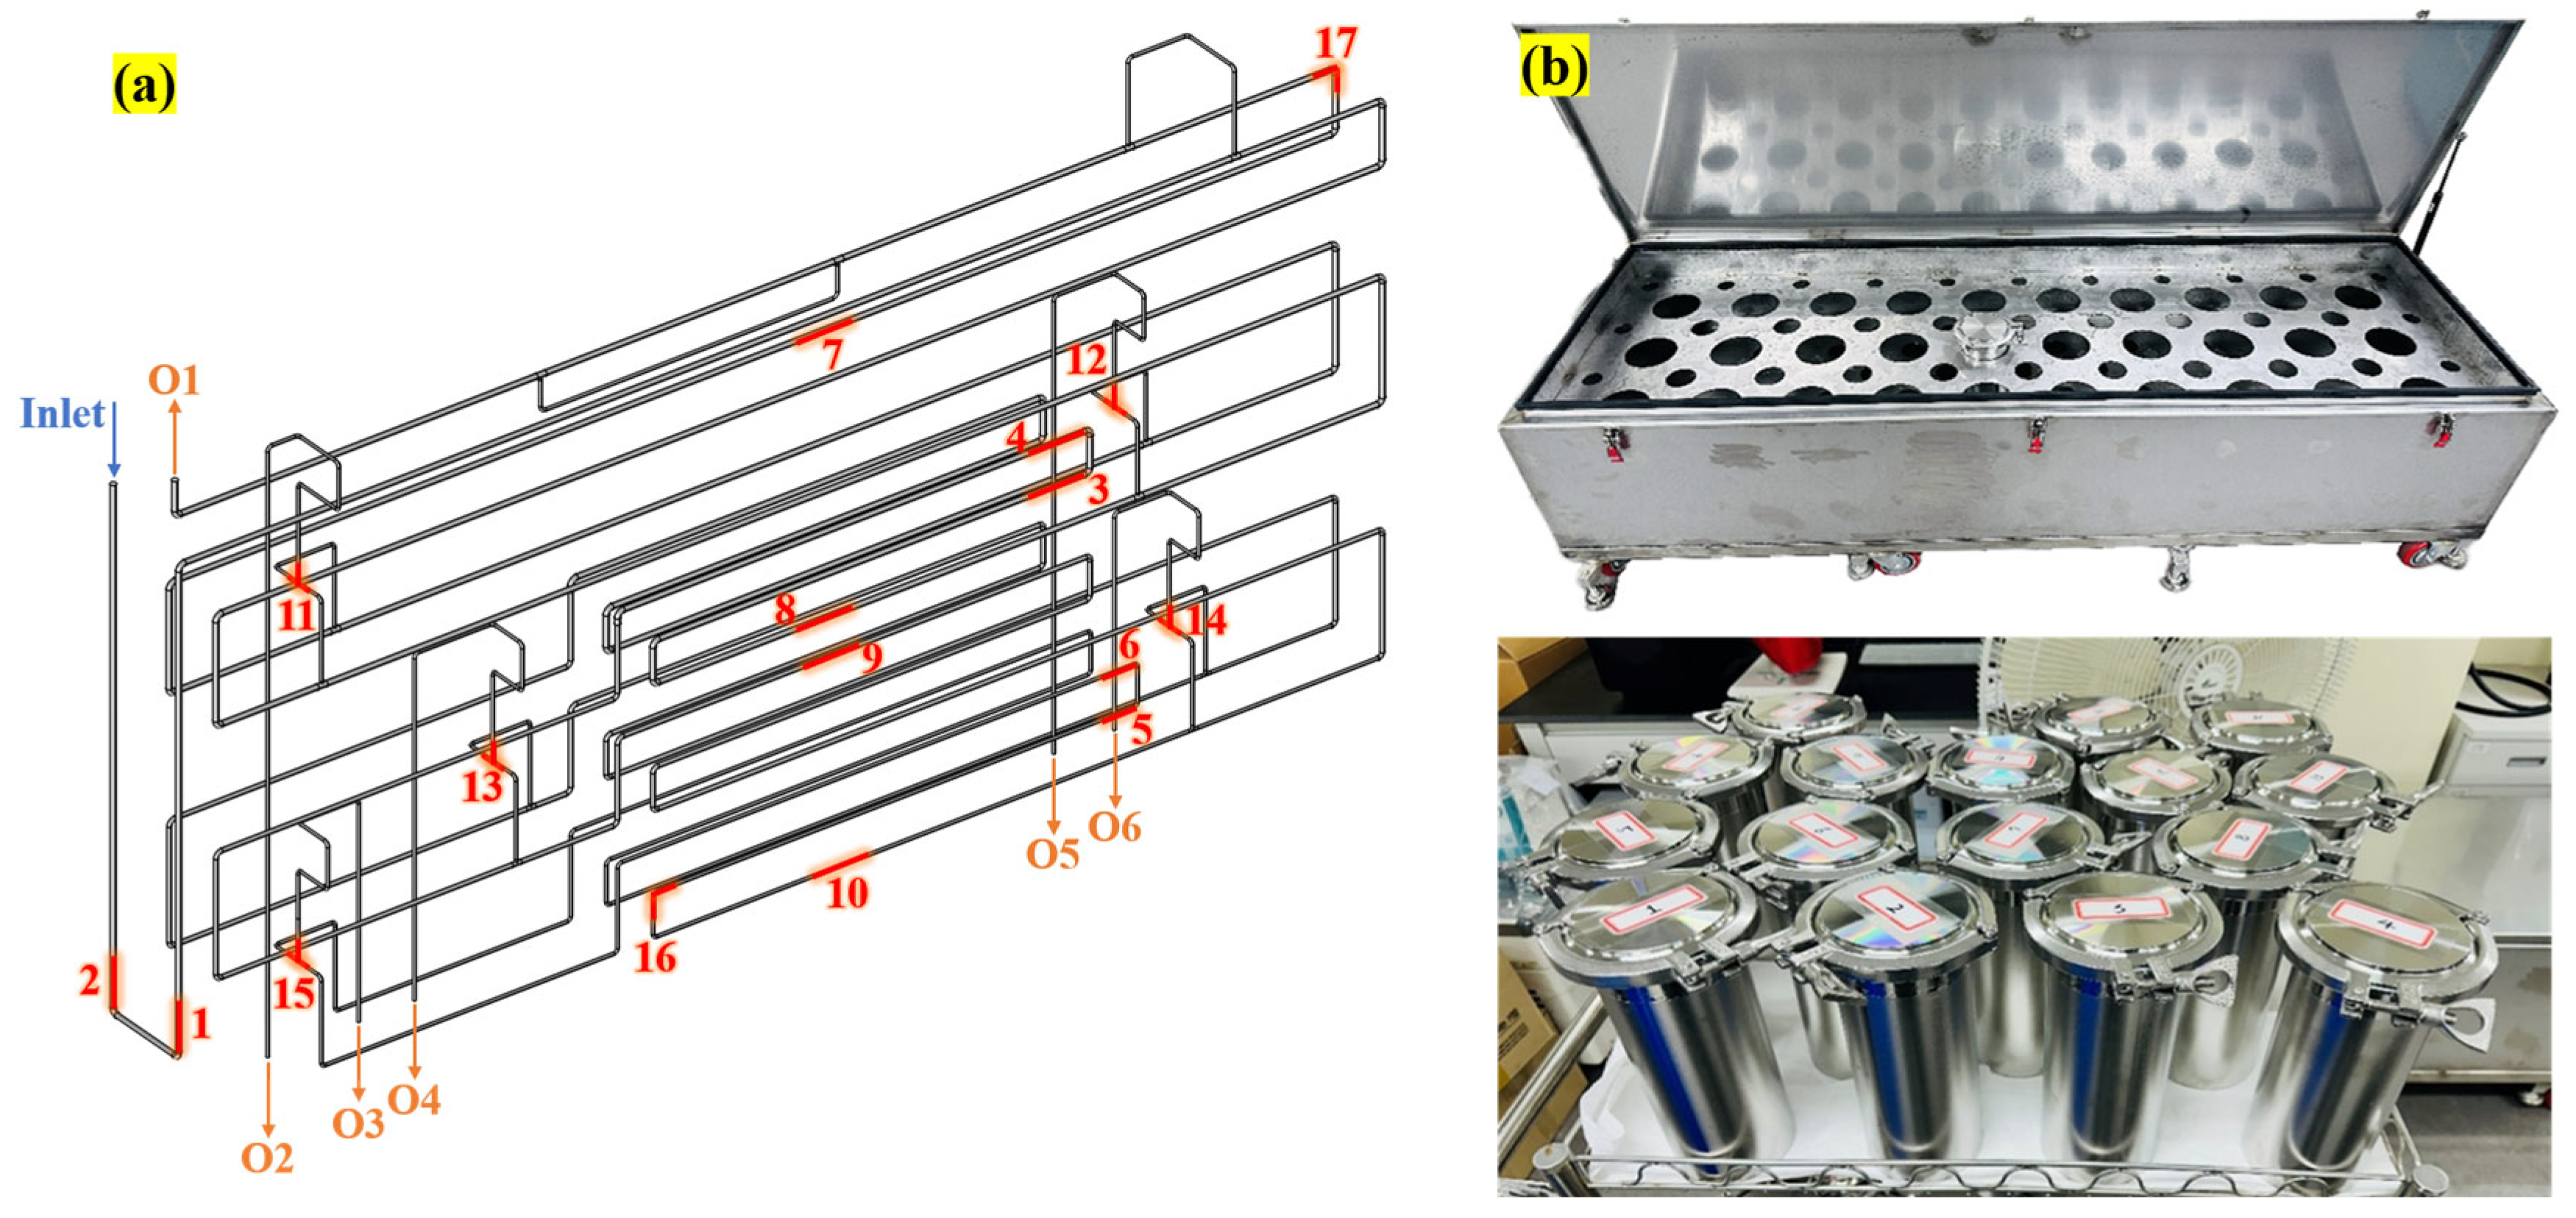
To characterize the spatial distribution of leaching and internal contamination, an autopsy was conducted on the pilot-scale CPVC and PVDF loop piping systems after 8-month operation (24 h per day, seven days per week) under the conditions described in Section 2.1.1. The autopsy was conducted as follows: First, each loop was fully drained and disassembled. Then the piping was segmented into 17 sections with nominally identical internal wetted surface areas, as shown in Figure 3a. These 17 locations were defined a priori using a hydraulics-informed, stratified sampling scheme: sections were selected to represent hydraulically disturbed zones (elbows/tees and solvent-welded joints) as well as straight, joint-free reference runs, while keeping the wetted surface area of each section approximately constant. Specifically, we grouped the sections as (i) elbow-adjacent segments including solvent-welded joints (Sections 1–6), (ii) joint-free straight reference runs remote from elbows and tees (Sections 7–10), (iii) outlet-proximal tee sections immediately upstream of each outlet branch (Sections 11–15), and (iv) two representative elbows located in the mid-loop and immediately upstream of an outlet (Sections 16–17). This design enables position-resolved comparison under a constant wetted area, while directly linking autopsy/leaching heterogeneity to geometry-driven disturbance zones identified by the CFD analysis.
Leaching tests were performed using the stainless-steel extraction apparatus shown in Figure 3b. Each pipe section was placed in an individual STS304 extraction cell and fully immersed in UPW. The sealed cells were heated to 60 °C and maintained at this temperature for three extraction durations: 8 h (8H), 24 h (1D), and 72 h (3D). At the end of each contact period, the UPW leachate from each cell was collected as an individual sample, cooled to room temperature, and transferred to pre-cleaned containers for analysis.
All leachate samples were analyzed for the parameters listed in Table 2, under the procedures and quality control requirements specified in SEMI F57, the specification for high-purity polymer materials and components used in UPW and liquid chemical distribution systems [32]. These measurements provide a comprehensive assessment of the organic and ionic contamination because of each pipe segment and material. The combination of spatially resolved sampling (Sections 1–17) and standardized leaching conditions at 60 °C allows for a direct comparison of the contamination behavior of CPVC and PVDF in relation to their position within the UPW loop.

3. Results and Discussion

3.1. CFD Simulation of UPW Distribution Loop Piping System

3.1.1. Hydraulic Characteristics

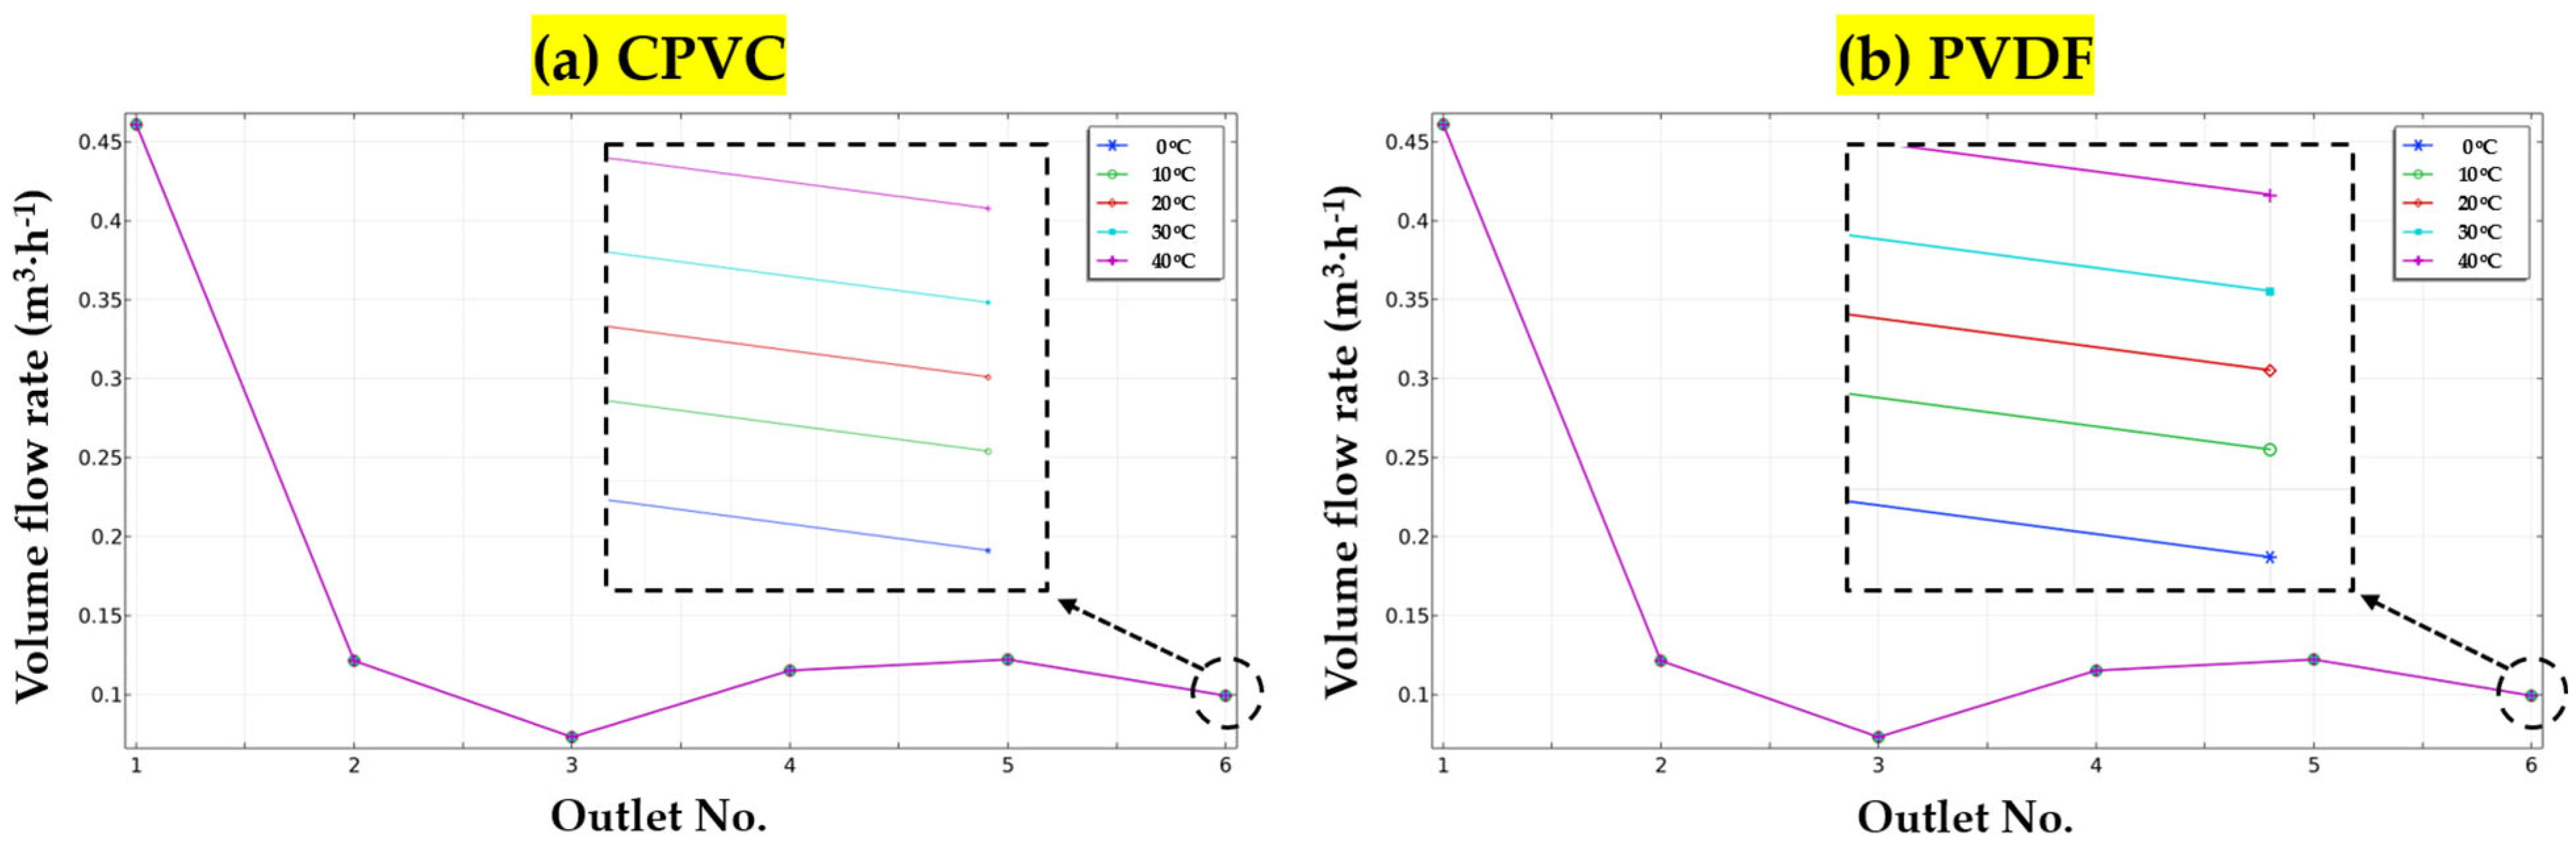
CFD simulations of the UPW loop were conducted for CPVC and PVDF pipes under identical operating conditions. As shown in Figure 4 and Figure 5, the predicted hydraulic fields in the loop were similar despite differences in the properties of the solids, such as density, thermal conductivity, roughness.
Figure 4 compares the volume flow rate distribution among individual outlets for CPVC and PVDF piping systems at different ambient temperatures. An identical flow distribution pattern was observed for both materials across the full temperature range: Outlet 3 consistently exhibited the lowest flow rate, while the remaining outlets shared the residual flow in similar proportions. Across 0–40 °C, Outlet 3 remained the minimum-flow branch (Qmin = 0.073 m3·h−1), whereas the maximum branch flow was Qmax = 0.461 m3·h−1. The resulting maldistribution ratio (Qmax/Qmin) stayed within 6.3 over the entire ambient-temperature sweep. Although the absolute flow rates increased with temperature due to reduced water viscosity, the relative distribution among the outlets remained unchanged. This consistency suggests that flow maldistribution is primarily governed by loop geometry and branching configuration rather than piping material. Thus, CPVC and PVDF exhibit comparable hydraulic behavior under identical operating conditions.
The outlet-wise flow partitioning arises because all outlets are prescribed with the same static-pressure boundary, so branch flow rates are determined by the relative equivalent hydraulic resistance of each flow path (distributed friction losses along the path, minor losses at elbows/tees/joints, and elevation-related head components). Therefore, the branch exhibiting the largest equivalent resistance draws the smallest fraction of the total flow under a common outlet pressure condition. This explains the persistent low-flow behavior at Outlet 3 across ambient temperatures, while the absolute flow increases with temperature primarily through the viscosity-dependent reduction in frictional losses.
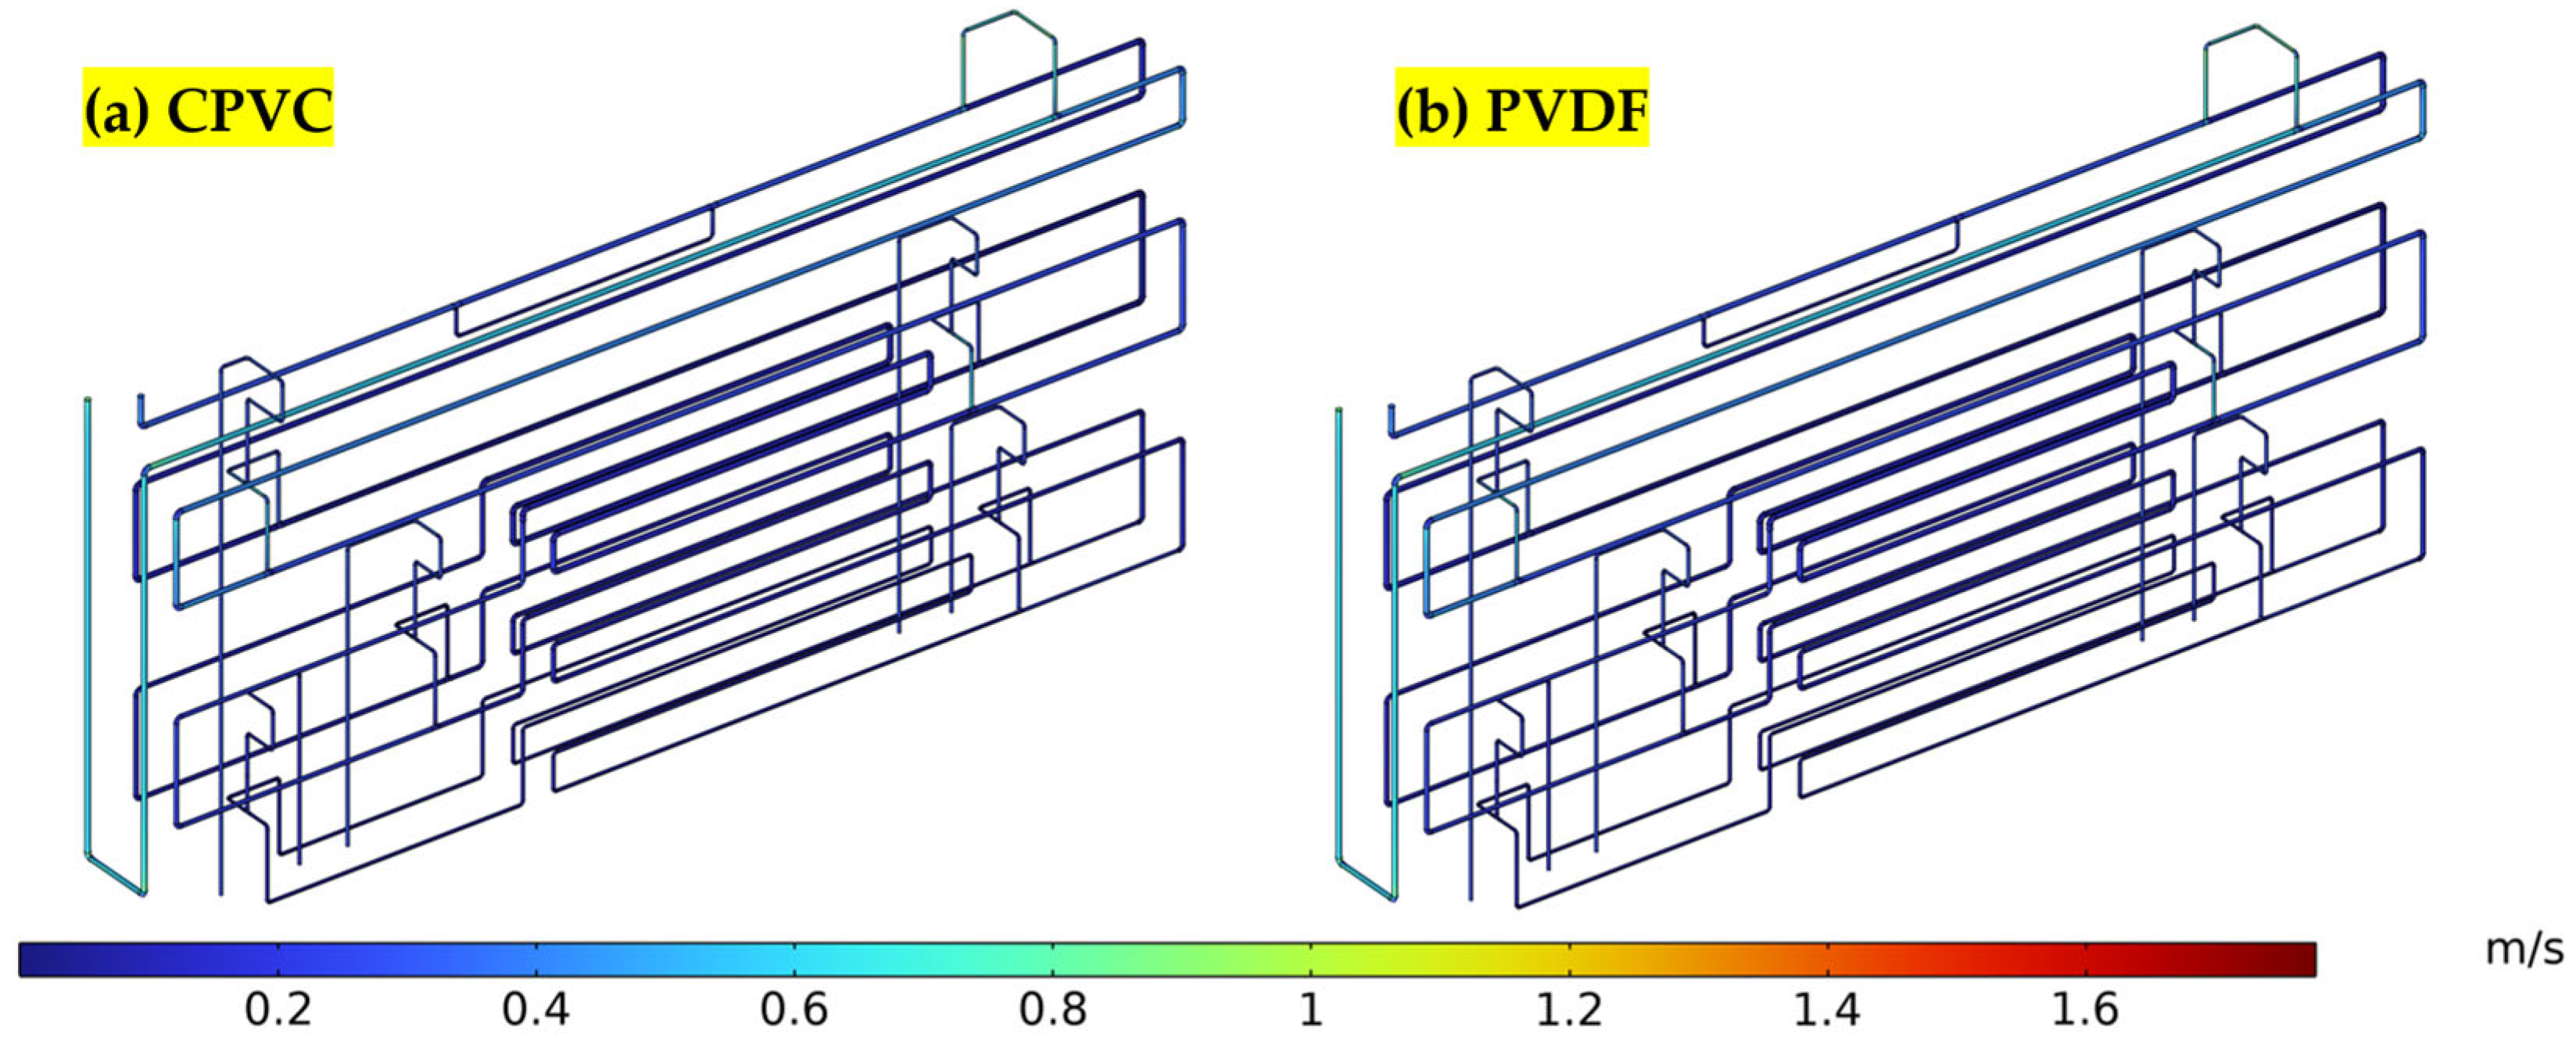
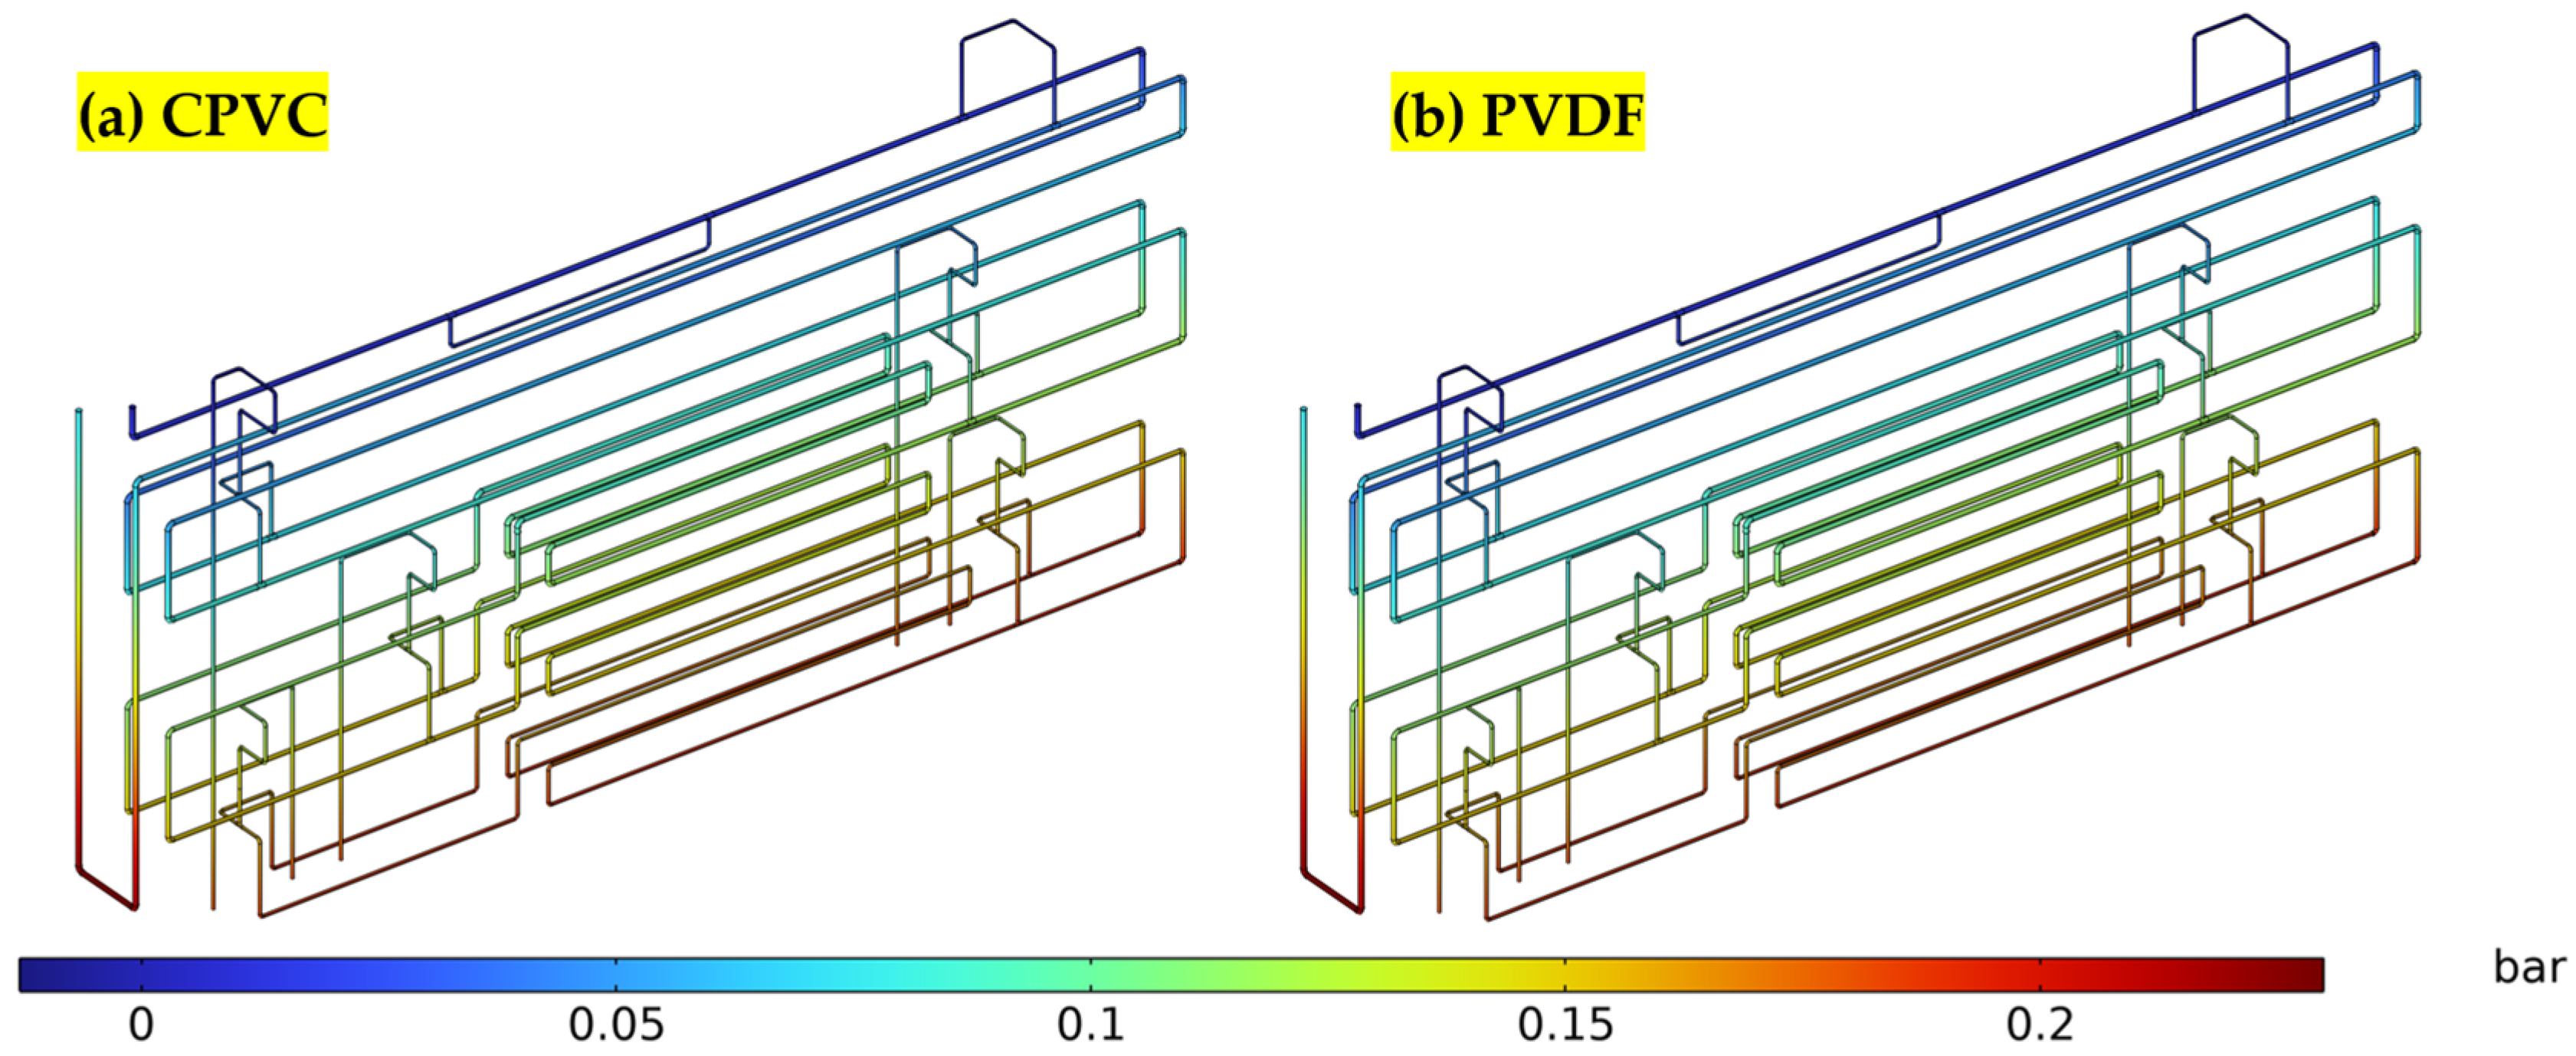
The velocity and pressure fields in the CPVC and PVDF loop piping systems were analyzed using CFD under identical operating conditions at an ambient temperature of 40 °C. As shown in Figure 5, the velocity magnitude spans 9.9 × 10⁻⁵–1.78 m·s−1 for both materials. The minimum velocity differs by only 0.4% between CPVC and PVDF, indicating that the loop-scale momentum field is insensitive to the pipe-wall material under the fixed geometry and boundary conditions (inlet 0.85 m·s−1; outlets at 0 bar gauge). These structures are characterized by localized acceleration in constricted sections and moderate deceleration near bends and directional changes. This indicates that the material properties of CPVC and PVDF do not significantly affect the internal flow field under the same operating conditions. Likewise, Figure 6 shows a pressure range of 0–0.23 bar, with local deviations confined to elbows and tees as expected from minor-loss effects. Pressure increases with decreasing elevation, with only minor local perturbations arising from pipe curvature, fittings, and associated minor losses. Together, these results confirm that the overall hydraulic behavior of the loop is primarily governed by geometric configuration and gravitational effects rather than the choice of polymeric piping material.
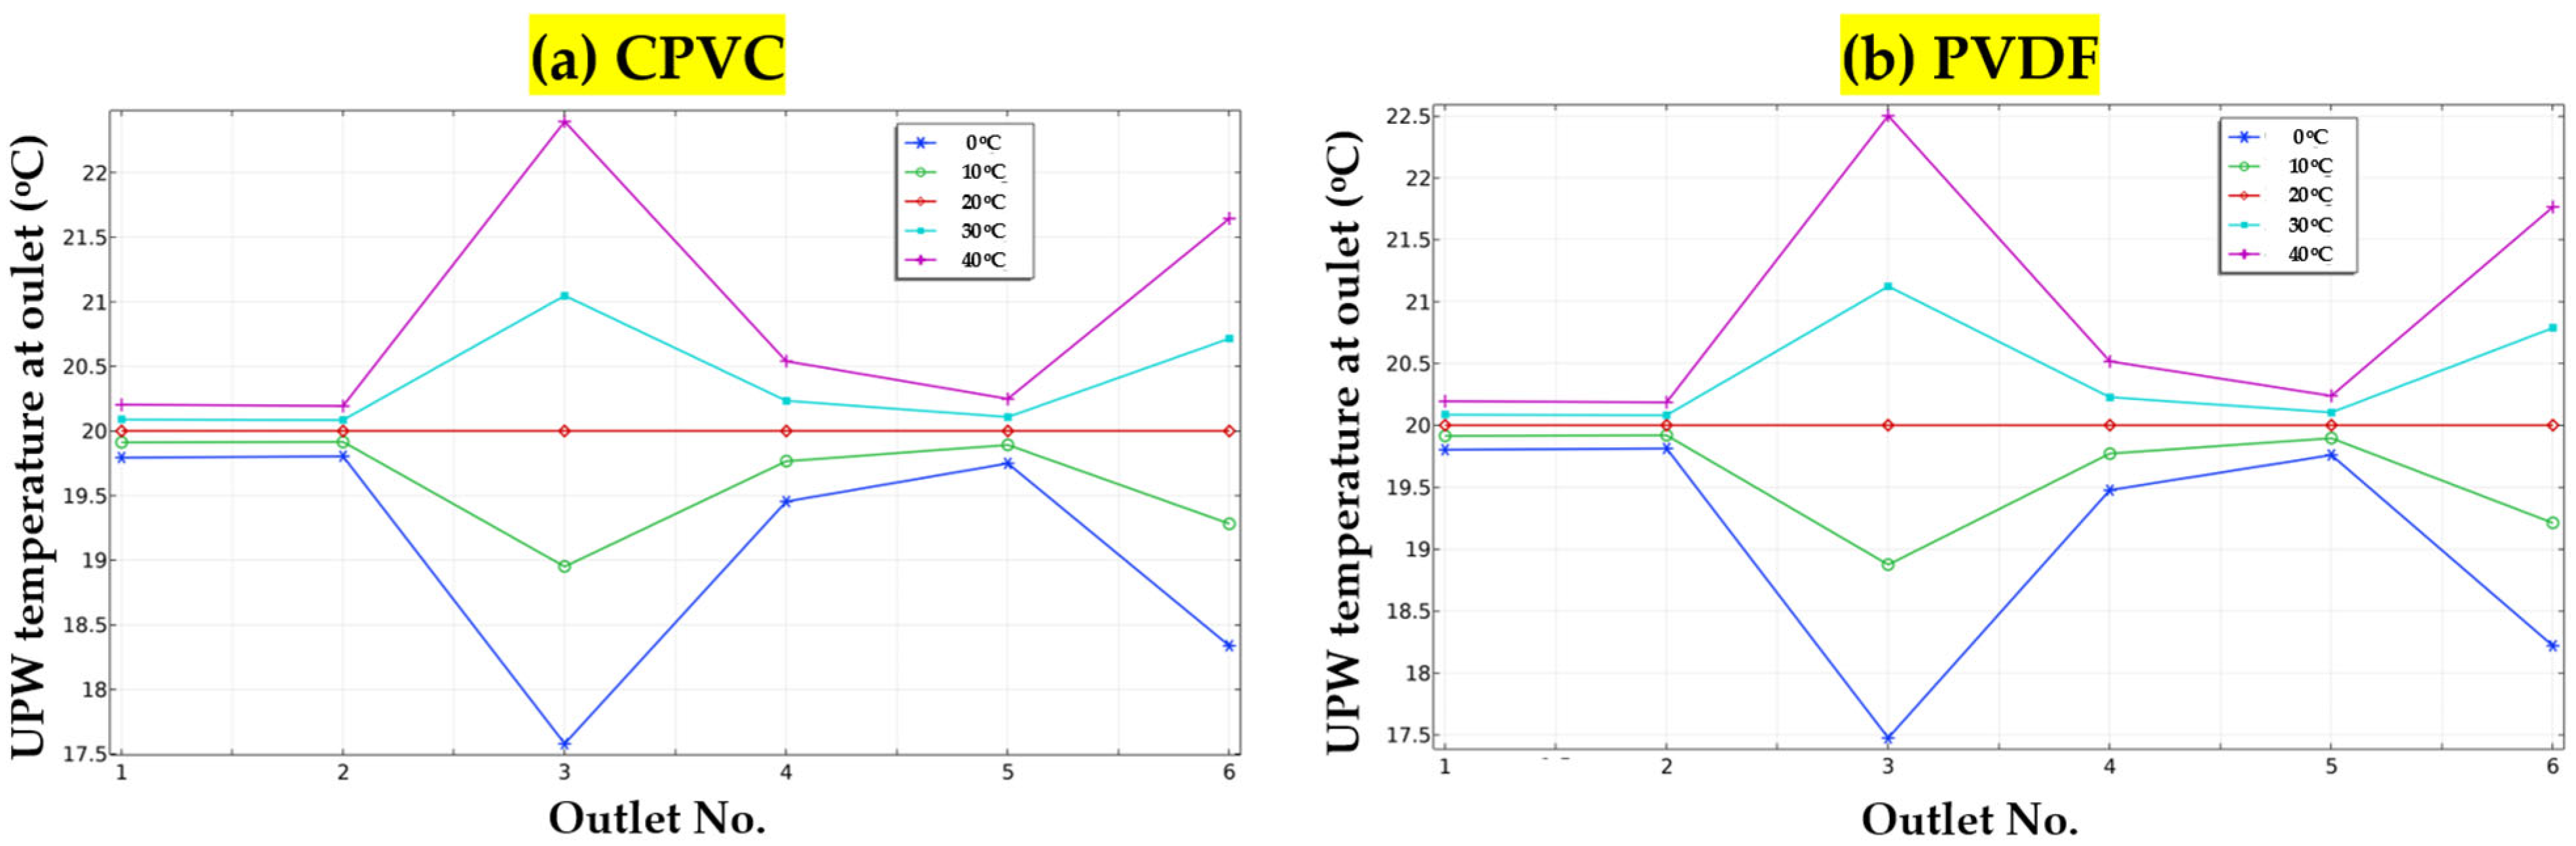
As illustrated in Figure 7, the outlet temperature distributions exhibit nearly identical spatial patterns for the CPVC and PVDF loop piping systems across all ambient temperature conditions. For example, at ambient temperature of 40 °C, Outlet 3 deviates from the outlet-mean temperature by ΔT = 2.4 °C with CPVC and ΔT = 2.5 °C with PVDF pipes, whereas other outlets remain within ± 1.6 °C of the mean. For a given ambient temperature, outlet 3 consistently shows the largest deviation from the mean, reflecting its distinct hydraulic and thermal environment within the loop. Although the overall temperature profiles are comparable, the maximum fluid and wall temperatures in the CPVC system are marginally lower than those in the PVDF system, which is because of the approximately 50% higher thermal conductivity of CPVC. Under the present operating conditions, these temperature differences are small and do not produce a measurable impact on bulk fluid viscosity or Reynolds number. Nevertheless, such material-dependent thermal characteristics may become relevant over long-term operation by influencing local thermal gradients and, indirectly, microbial activity or particulate interactions at the pipe wall.
From a UPW process perspective, the results demonstrate that loop-level hydraulic behavior, including flow balance among outlets, pressure distribution, and main-pipe velocity, is predominantly governed by system geometry and operating conditions, rather than by the choice between CPVC and PVDF. When these boundary conditions are fixed, both materials yield essentially identical hydraulic performance. Since the loop geometry, boundary conditions, and fluid properties are fixed, the loop-scale momentum balance is primarily controlled by geometric losses and operating conditions. Within the present configuration, the CPVC vs. PVDF differences mainly manifest through surface-dominated and thermal/chemical factors (e.g., roughness-mediated foulant persistence and material-dependent TOC leaching). Thus, the primary implications of material selection in UPW loop piping lie in surface-dominated phenomena, such as leaching characteristics, roughness-dependent fouling, and biofilm adhesion and stability, rather than in bulk hydraulics. This aligns with observations from drinking water and high-purity water systems, where hydrodynamic regimes and geometric features define shear and stagnation patterns while material properties influence biological and particulate responses as secondary modifiers under the same flow conditions [33].

3.1.2. Particle Transport and Contamination Resistivity

Under representative loop operating conditions, a Lagrangian particle-tracking model was applied to 150 inert particles (particle density, ρp = 2650 kg·m−3; particle diameter, dp = 0.05 μm) injected at the loop inlet and transported by the turbulent flow field in both CPVC and PVDF systems. This particle-tracking model is intended to identify hydrodynamically favorable residence and retention zones rather than to predict absolute deposition or adhesion, as physicochemical particle–surface interactions were not included. Because the two loops share identical geometry and comparable internal diameters, the resulting velocity fields, pressure distributions, and outlet flow partitioning were essentially indistinguishable. Consequently, any observed differences in particle transport or residence behavior can be attributed primarily to near-wall interactions rather than to loop-scale hydraulic effects.
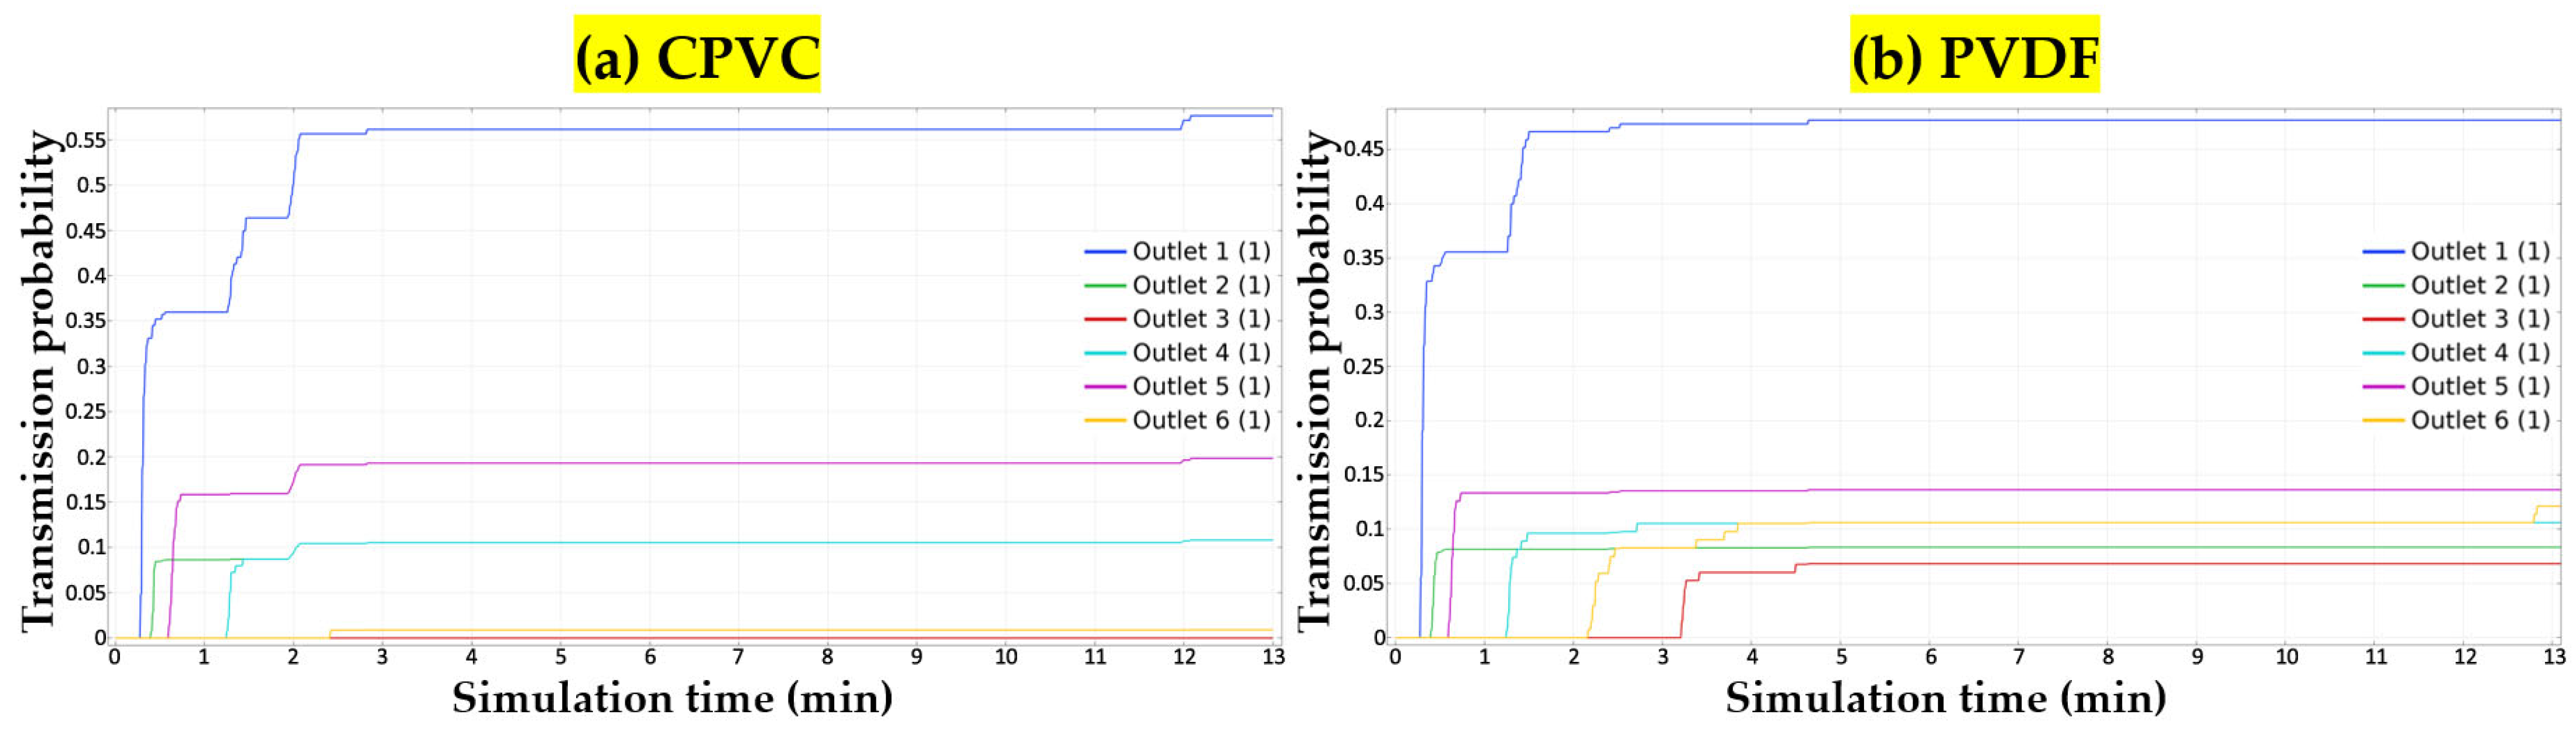
Here, breakthrough time is defined as the first-arrival time at any outlet (at t = 17 s), and complete flushing corresponds to the time when the cumulative discharged fraction reaches unity (at t = 13 min) (Figure 8). The particle transmission–probability curves indicate rapid breakthrough and complete flushing of injected particles in both CPVC and PVDF loop piping systems. Particles first reached outlet 1 at approximately 17 s, and all particles exited the loop within ~13 min, demonstrating efficient global transport under the applied operating conditions. Although the outlet-specific transmission profiles were non-uniform, they were nearly identical for the two materials, showing that the Direct-Return loop topology, rather than pipe wall material, governs the partitioning of particle discharge among outlets. During the transient phase, particles exhibited prolonged residence in localized low-velocity and recirculation zones, particularly at the inner curvature of elbows and downstream of branch tees, where the hydrodynamic solution predicts reduced wall shear stress and intermittent flow reversal. Locally, elbows and downstream tees induce curvature-driven secondary motions and adverse pressure-gradient effects that can create intermittent separation and recirculation pockets near the inner curvature or downstream junction region. These features reduce near-wall velocities and wall shear stress, increasing particle residence time and the likelihood of temporary retention. Accordingly, the dead zones identified here should be interpreted as hydrodynamically favorable residence regions rather than absolute deposition sites, consistent with our no-sticking particle–wall treatment. The role of these low-shear regions as temporary particle-retention zones is consistent with controlled loop experiments, which show that cohesive particulate deposits preferentially stabilize under chronically low or highly intermittent wall shear conditions [34,35].
The preferential residence of particles in elbows and downstream tees observed in the present CFD simulations is consistent with prior experimental and modeling studies demonstrating that hydrodynamic dead zones act as precursors to rapid deposition and upstream-biased accumulation in pressurized pipe systems. Laboratory-scale investigations have shown that even modest reductions in near-wall velocity can lead to disproportionate increases in particle deposition rates, particularly for sub-micrometer particles transported under turbulent conditions [7]. Importantly, these effects persist even when bulk Reynolds numbers remain high, underscoring that local hydrodynamic structure rather than average flow intensity governs particle fate near the wall.
Consistent with the hydraulically controlled transport behavior described above, the comparison between CPVC and PVDF indicates that material properties exert only a secondary influence on particle fate under the conditions considered. PVDF exhibits a lower arithmetic surface roughness (Ra ≈ 0.1 μm) than CPVC (Ra ≈ 0.25 μm) and a more chemically inert surface, characteristics that are expected to reduce mechanical interlocking and to promote particle re-entrainment under comparable shear stresses. This interpretation is qualitatively consistent with observations from drinking-water loop studies, in which relatively small changes in near-wall hydrodynamic conditions produced pronounced differences in particle deposition rates and upstream-biased accumulation patterns [16], as well as with pipe-material investigations reporting lower biomass and deposit accumulation on smoother polymeric or stainless-steel surfaces compared with rougher or more chemically reactive substrates [36]. When these CFD results are considered together with the autopsy and leaching analyses presented in Section 3.2, a coherent framework emerges: loop geometry establishes the locations of low-shear “dead zones” that govern the spatial distribution of potential contamination, while material properties modulate whether these hydraulically defined zones evolve into persistent reservoirs of particles and organic deposits, with CPVC being more susceptible than PVDF due to its higher roughness and lower chemical stability.

3.2. Autopsy of UPW Distribution Loop Piping System

To directly connect the CFD-based predictions with experimentally observed material behavior, the pilot-scale loop piping systems fabricated from CPVC and PVDF were disintegrated after completion of the circulation tests. As shown in Figure 4, pipe sections corresponding to positions 1–17 in the loop layout were extracted and subjected to standardized leaching tests by immersion in ultrapure water for 8 h, 24 h, and 72 h. The chemical parameters measured in the resulting leachates are summarized in Table 2. In parallel, industrial endoscopic inspections were performed prior to sectioning to document inner-wall contamination in situ, thereby enabling a spatially resolved comparison between hydraulically predicted low-shear regions and experimentally observed surface contamination.
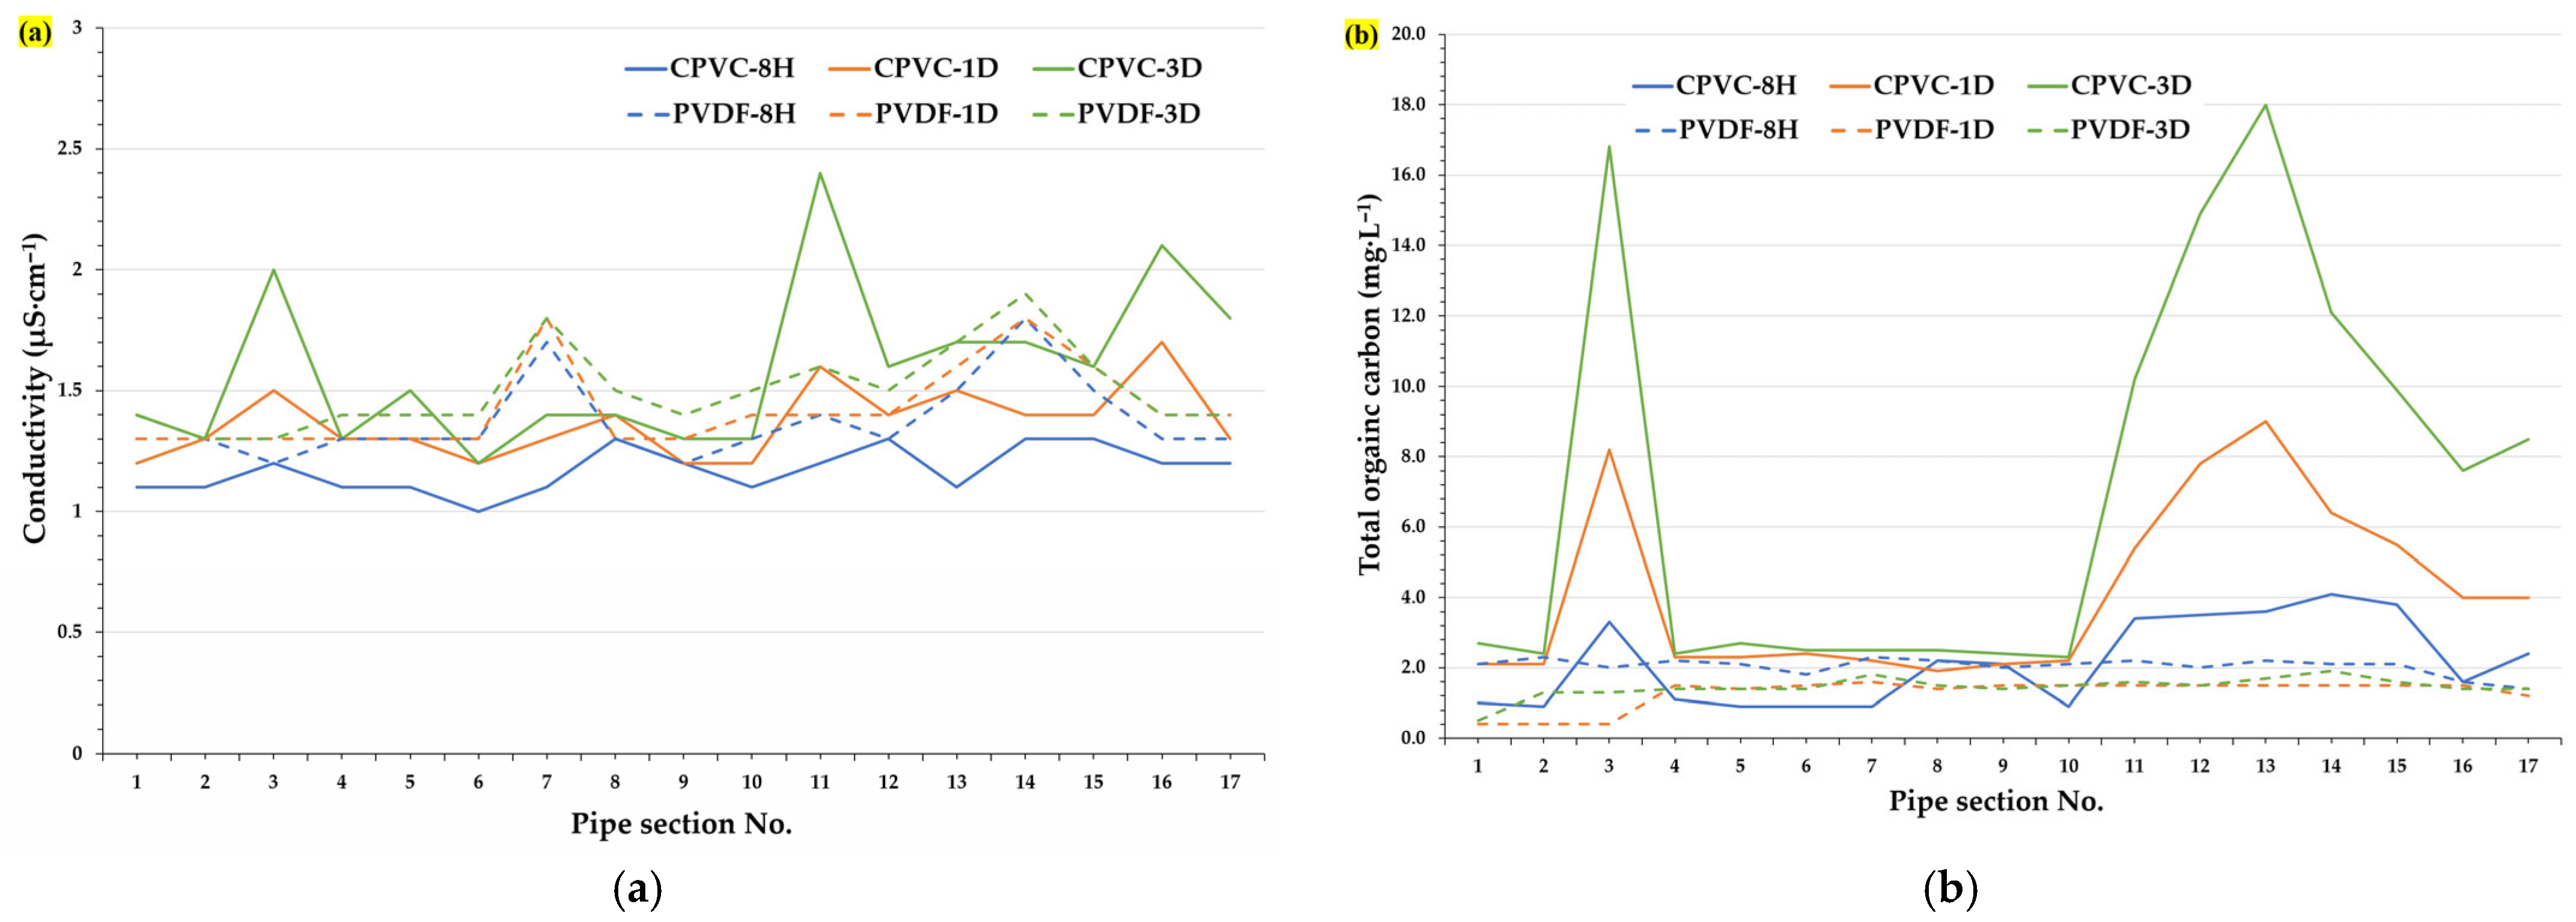
Figure 9 compares the spatial distributions of conductivity and total organic carbon (TOC) in the leachates from individual pipe sections as a function of leaching duration. While conductivity varied only modestly with time and position for both materials (Figure 9a), pronounced material-dependent differences were observed in TOC release (Figure 9b). In the CPVC loop, TOC concentrations increased strongly with contact time and exhibited marked spatial heterogeneity, with the mean TOC across all sections rising from ~2.2 mg·L−1 at 8 h to ~4.1 mg·L−1 at 1 d and ~7.1 mg·L−1 at 3 d. Distinct hot-spot regions, notably Sections 3 and 13–15, showed the highest TOC release, increasing from approximately 3–4 mg·L−1 at 8 h to 8–9 mg·L−1 at 1 d and reaching 16–18 mg·L−1 after 3 d. In contrast, the PVDF loop exhibited substantially lower and more spatially uniform TOC levels, with average concentrations of ~2.0 mg·L−1 (8 h), ~1.3 mg·L−1 (1 d), and ~1.6 mg·L−1 (3 d), and most sections remaining within a narrow range of 0.4–2.3 mg·L−1. These results indicate that organic leaching is both time- and location-dependent for CPVC, whereas PVDF shows comparatively stable and limited TOC release under identical conditions.
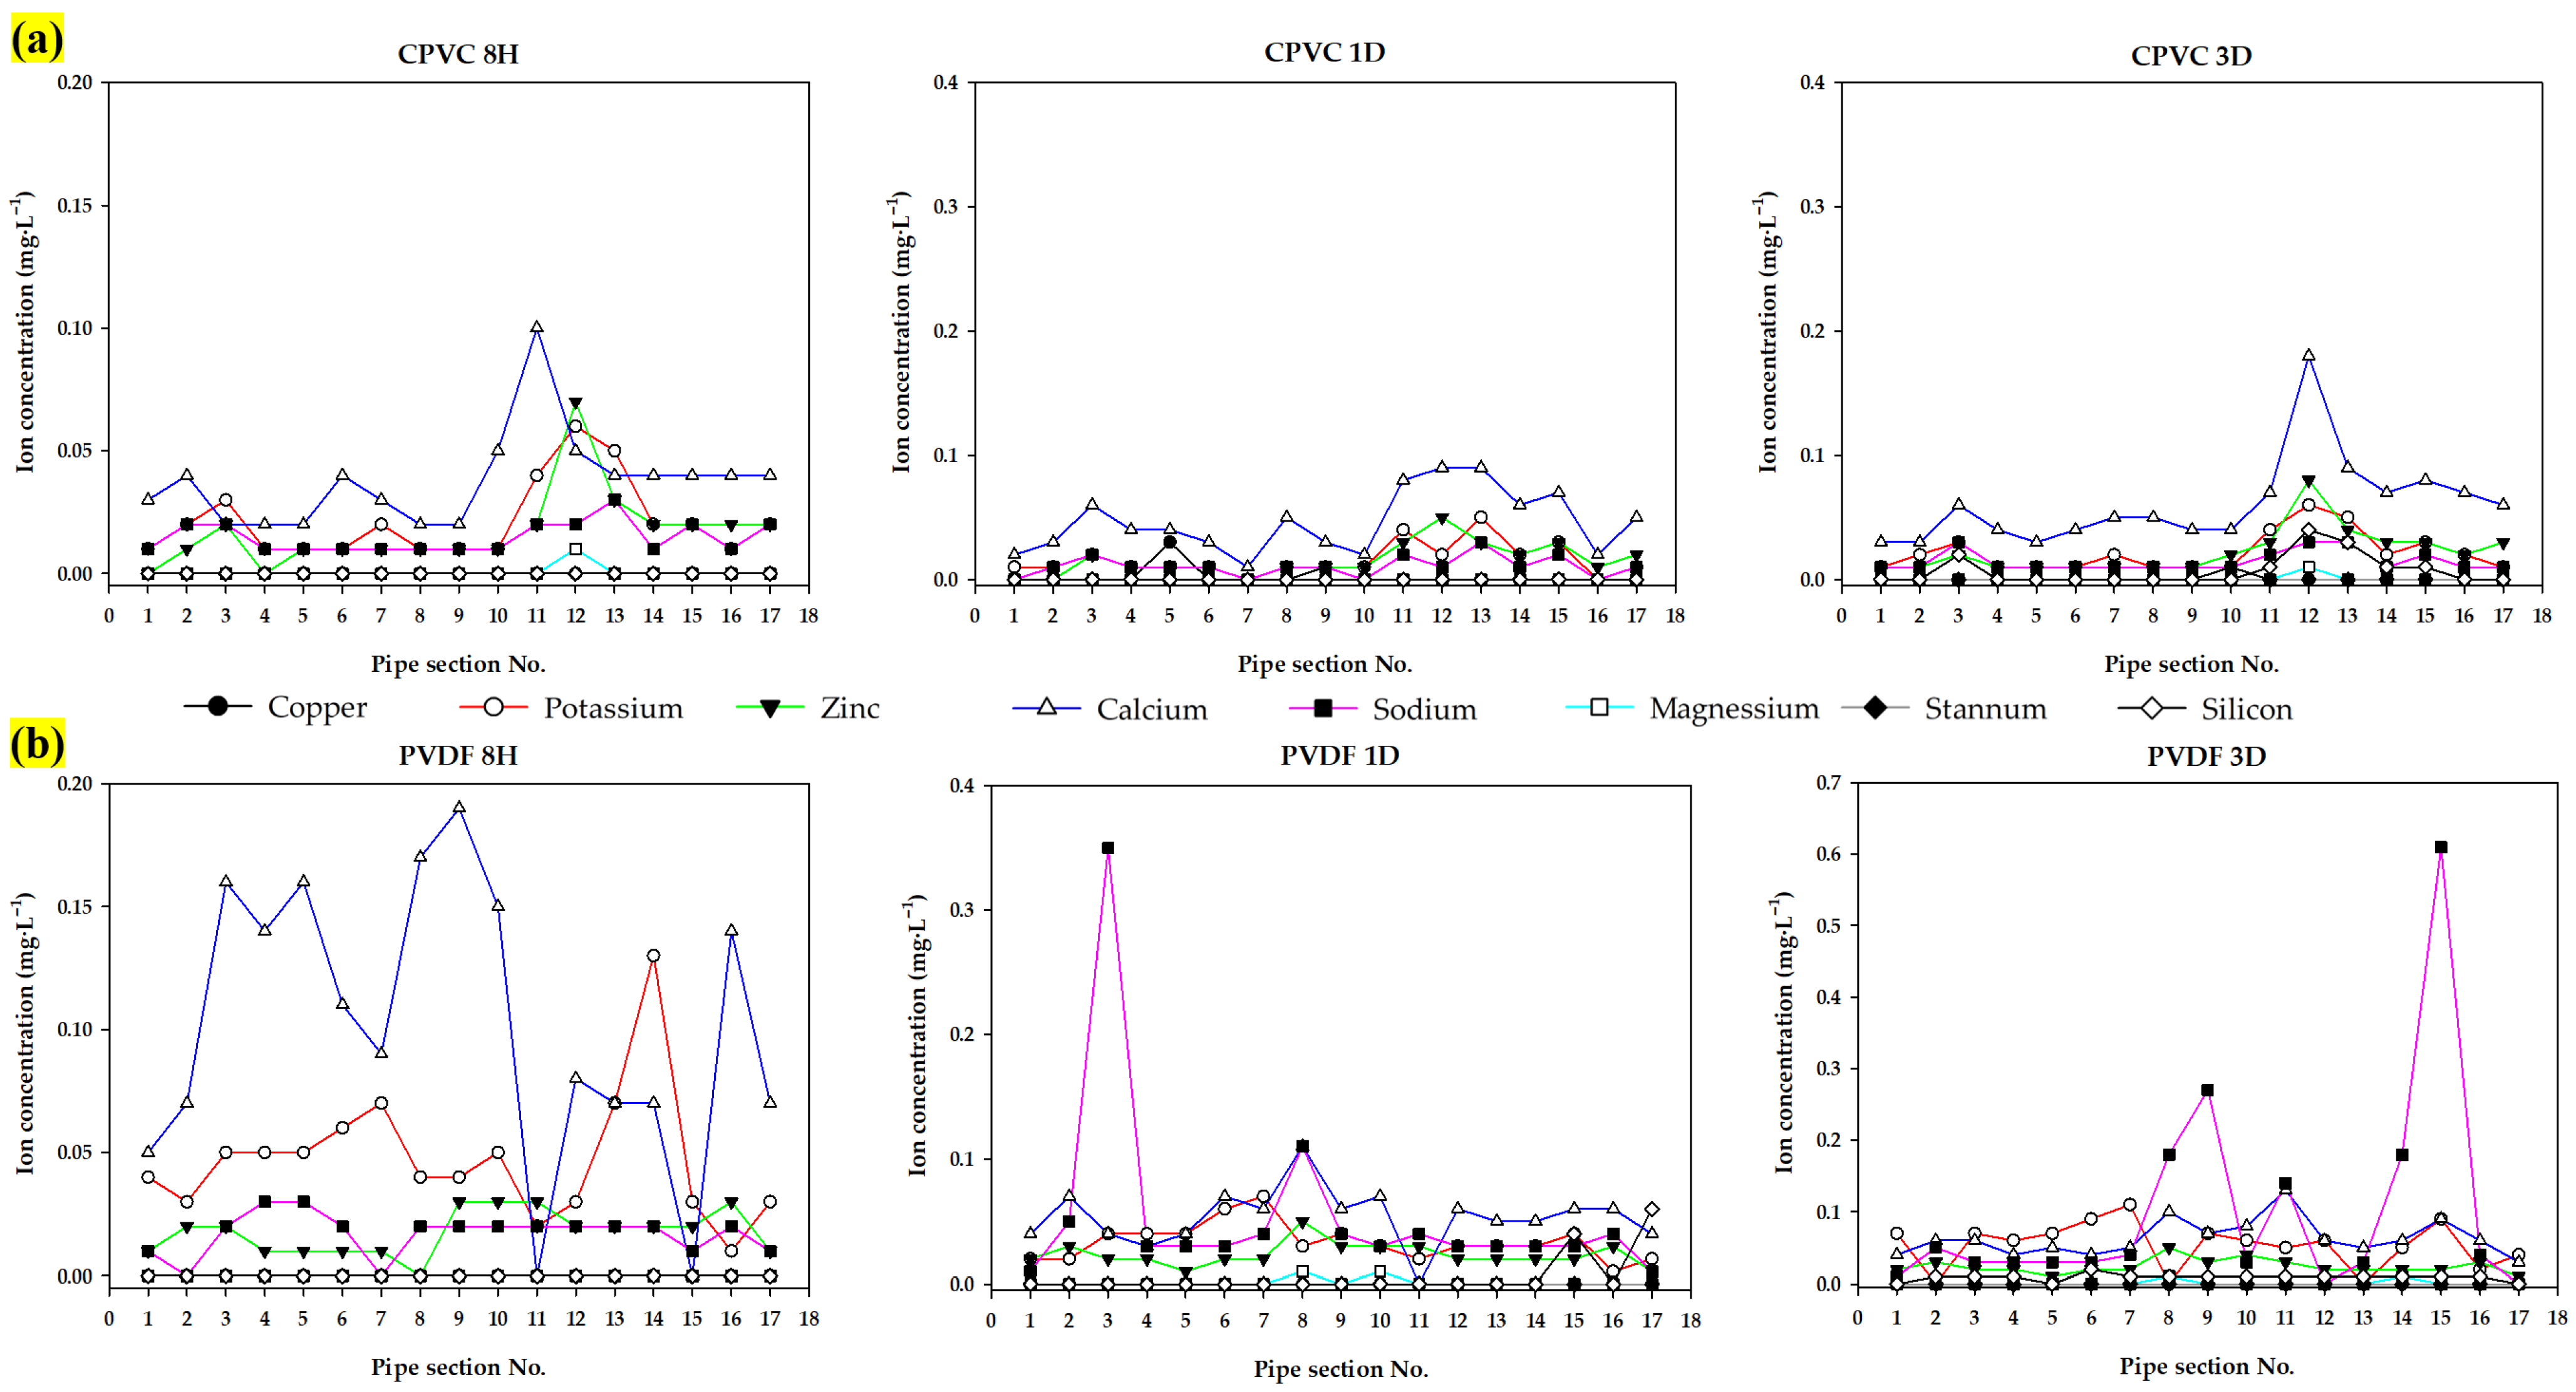
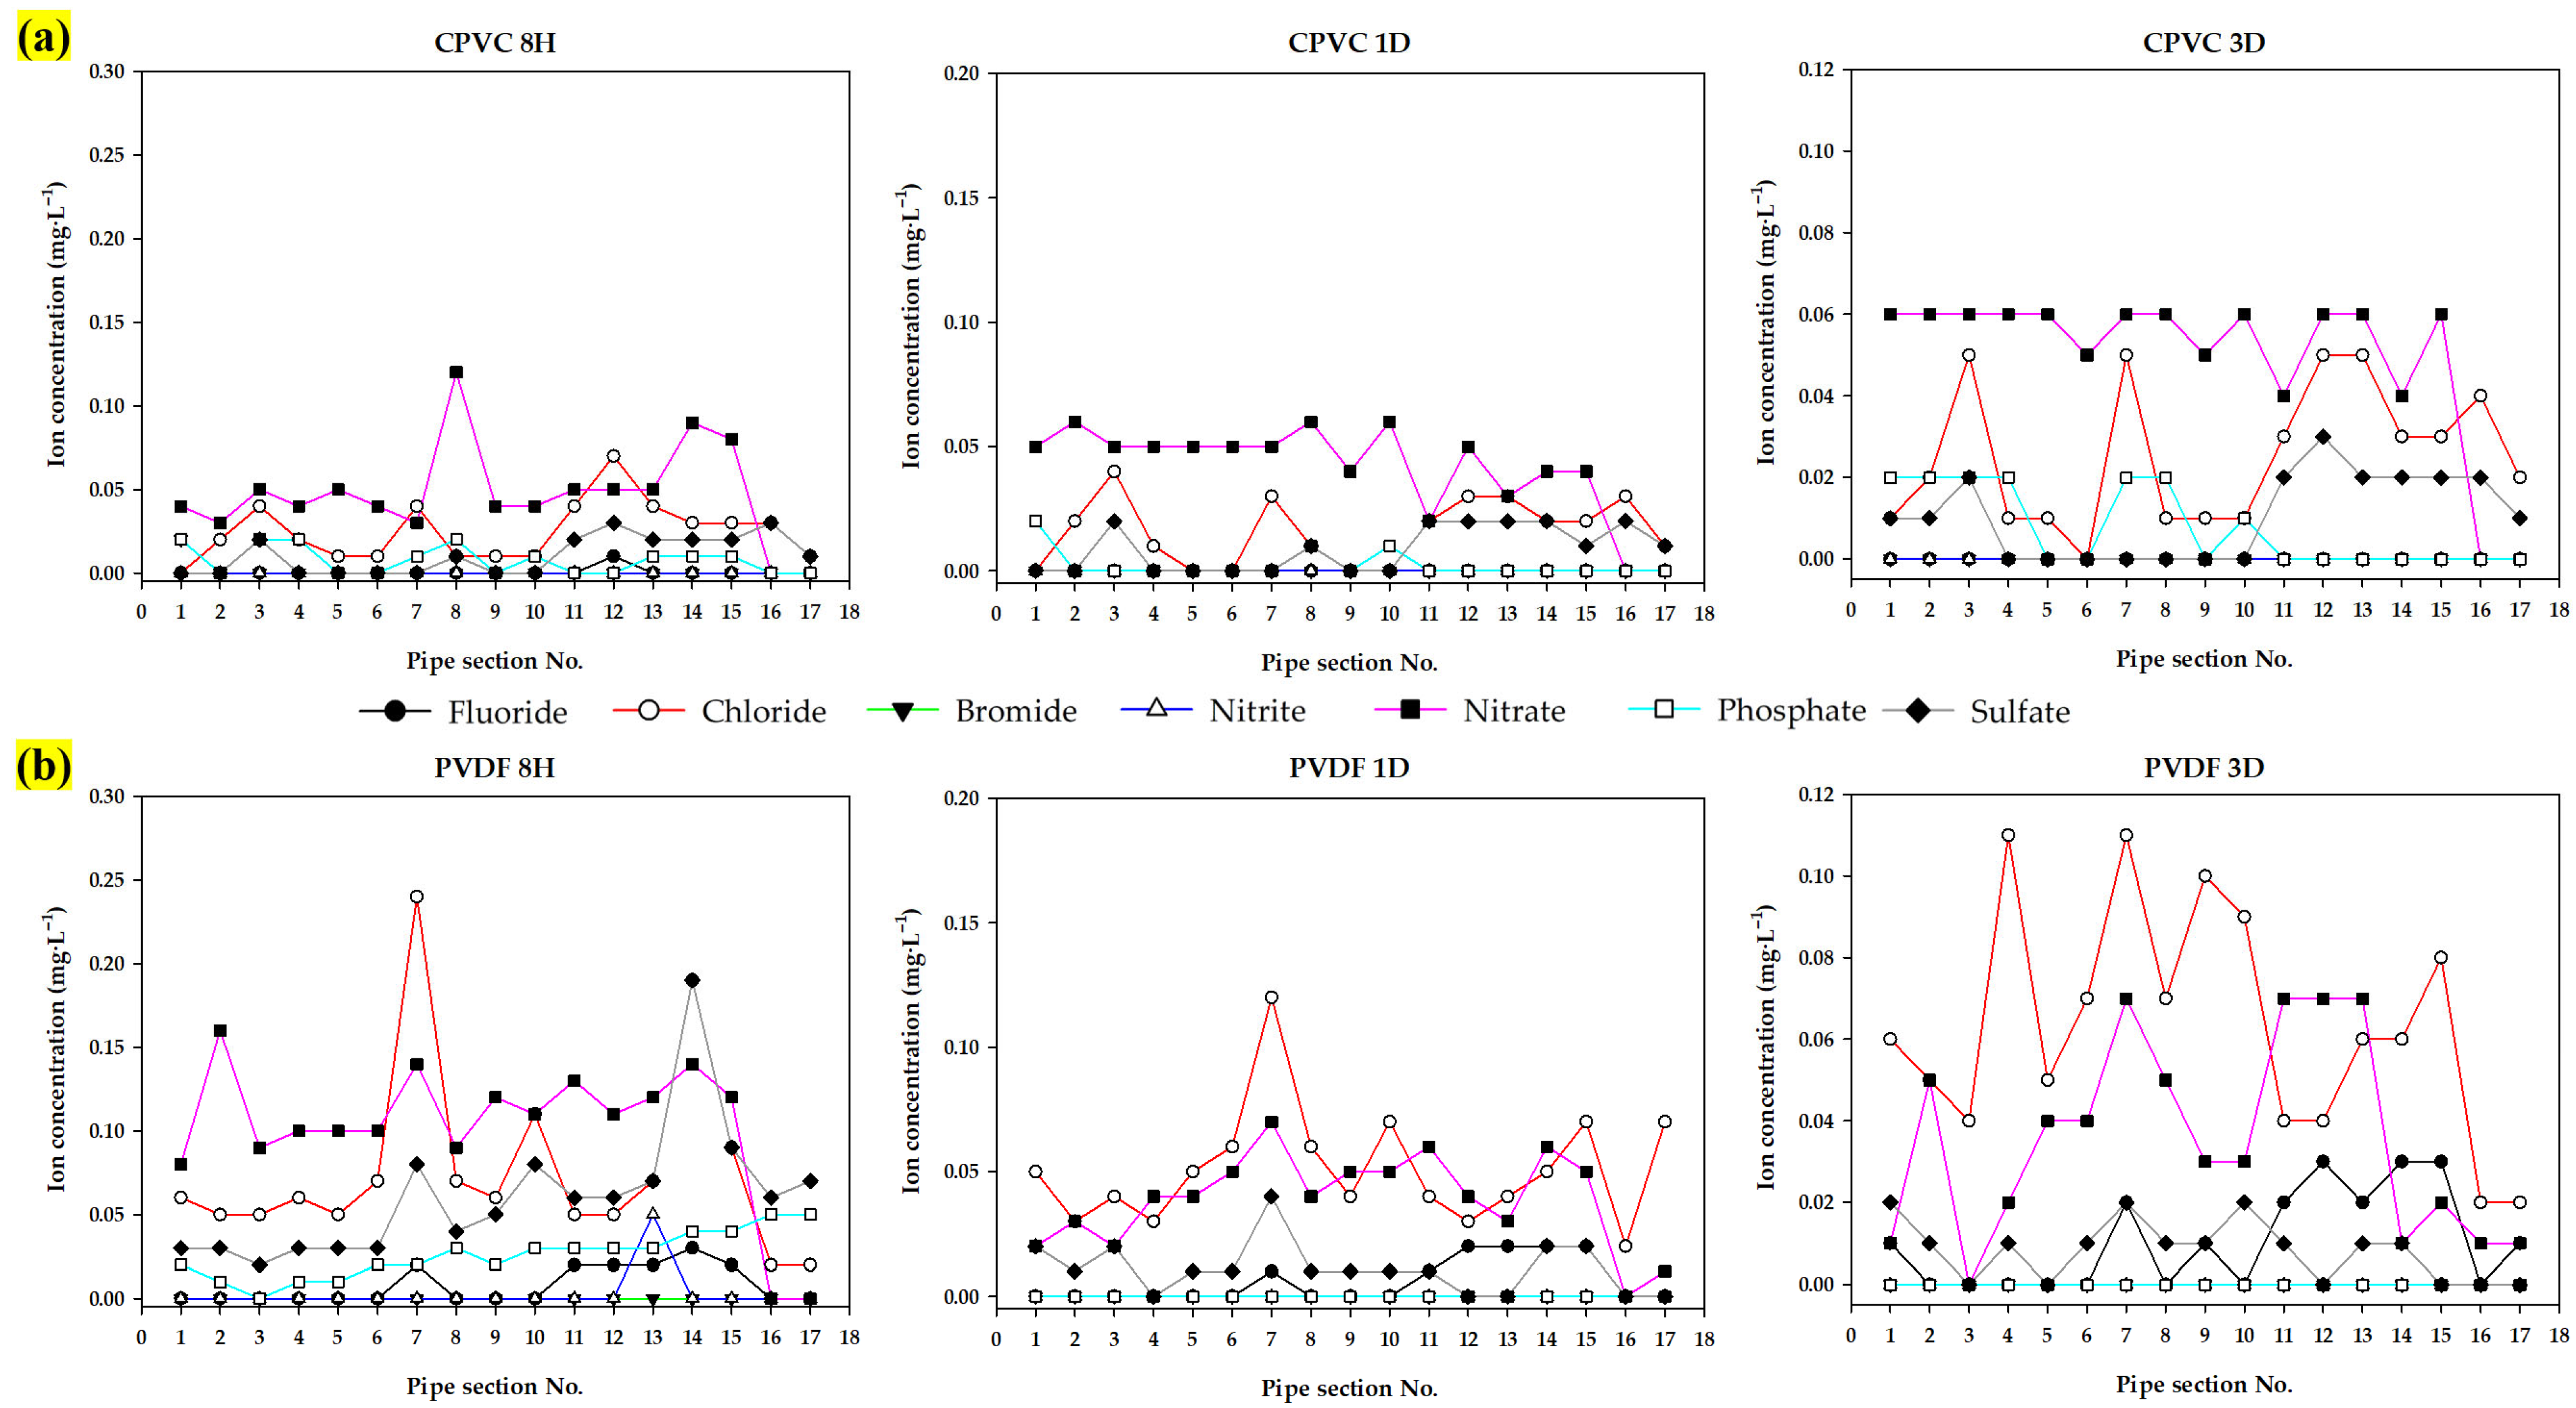
The spatial distributions of cationic and anionic species released from individual pipe sections are shown in Figure 10 and Figure 11 for CPVC and PVDF as a function of leaching duration. Across all conditions, inorganic ion concentrations, including major species such as Ca2+ and Na+, generally remained at sub-mg·L−1 levels for both materials, with limited temporal amplification compared with the organic response. Although isolated peaks of sodium ions (Na+) were observed at specific locations in the PVDF loop, these excursions were rare and did not result in an overall increase in ionic release. In contrast to the pronounced magnitude and spatial variability observed for TOC, the inorganic ion profiles were relatively unremarkable, suggesting that ionic leaching plays a minor role in total contamination under the current UPW conditions. This behavior is consistent with independent UPW loop studies that report CPVC exhibits higher, location-dependent organic leaching and particle release than PVDF under comparable hydraulic and thermal conditions [36].
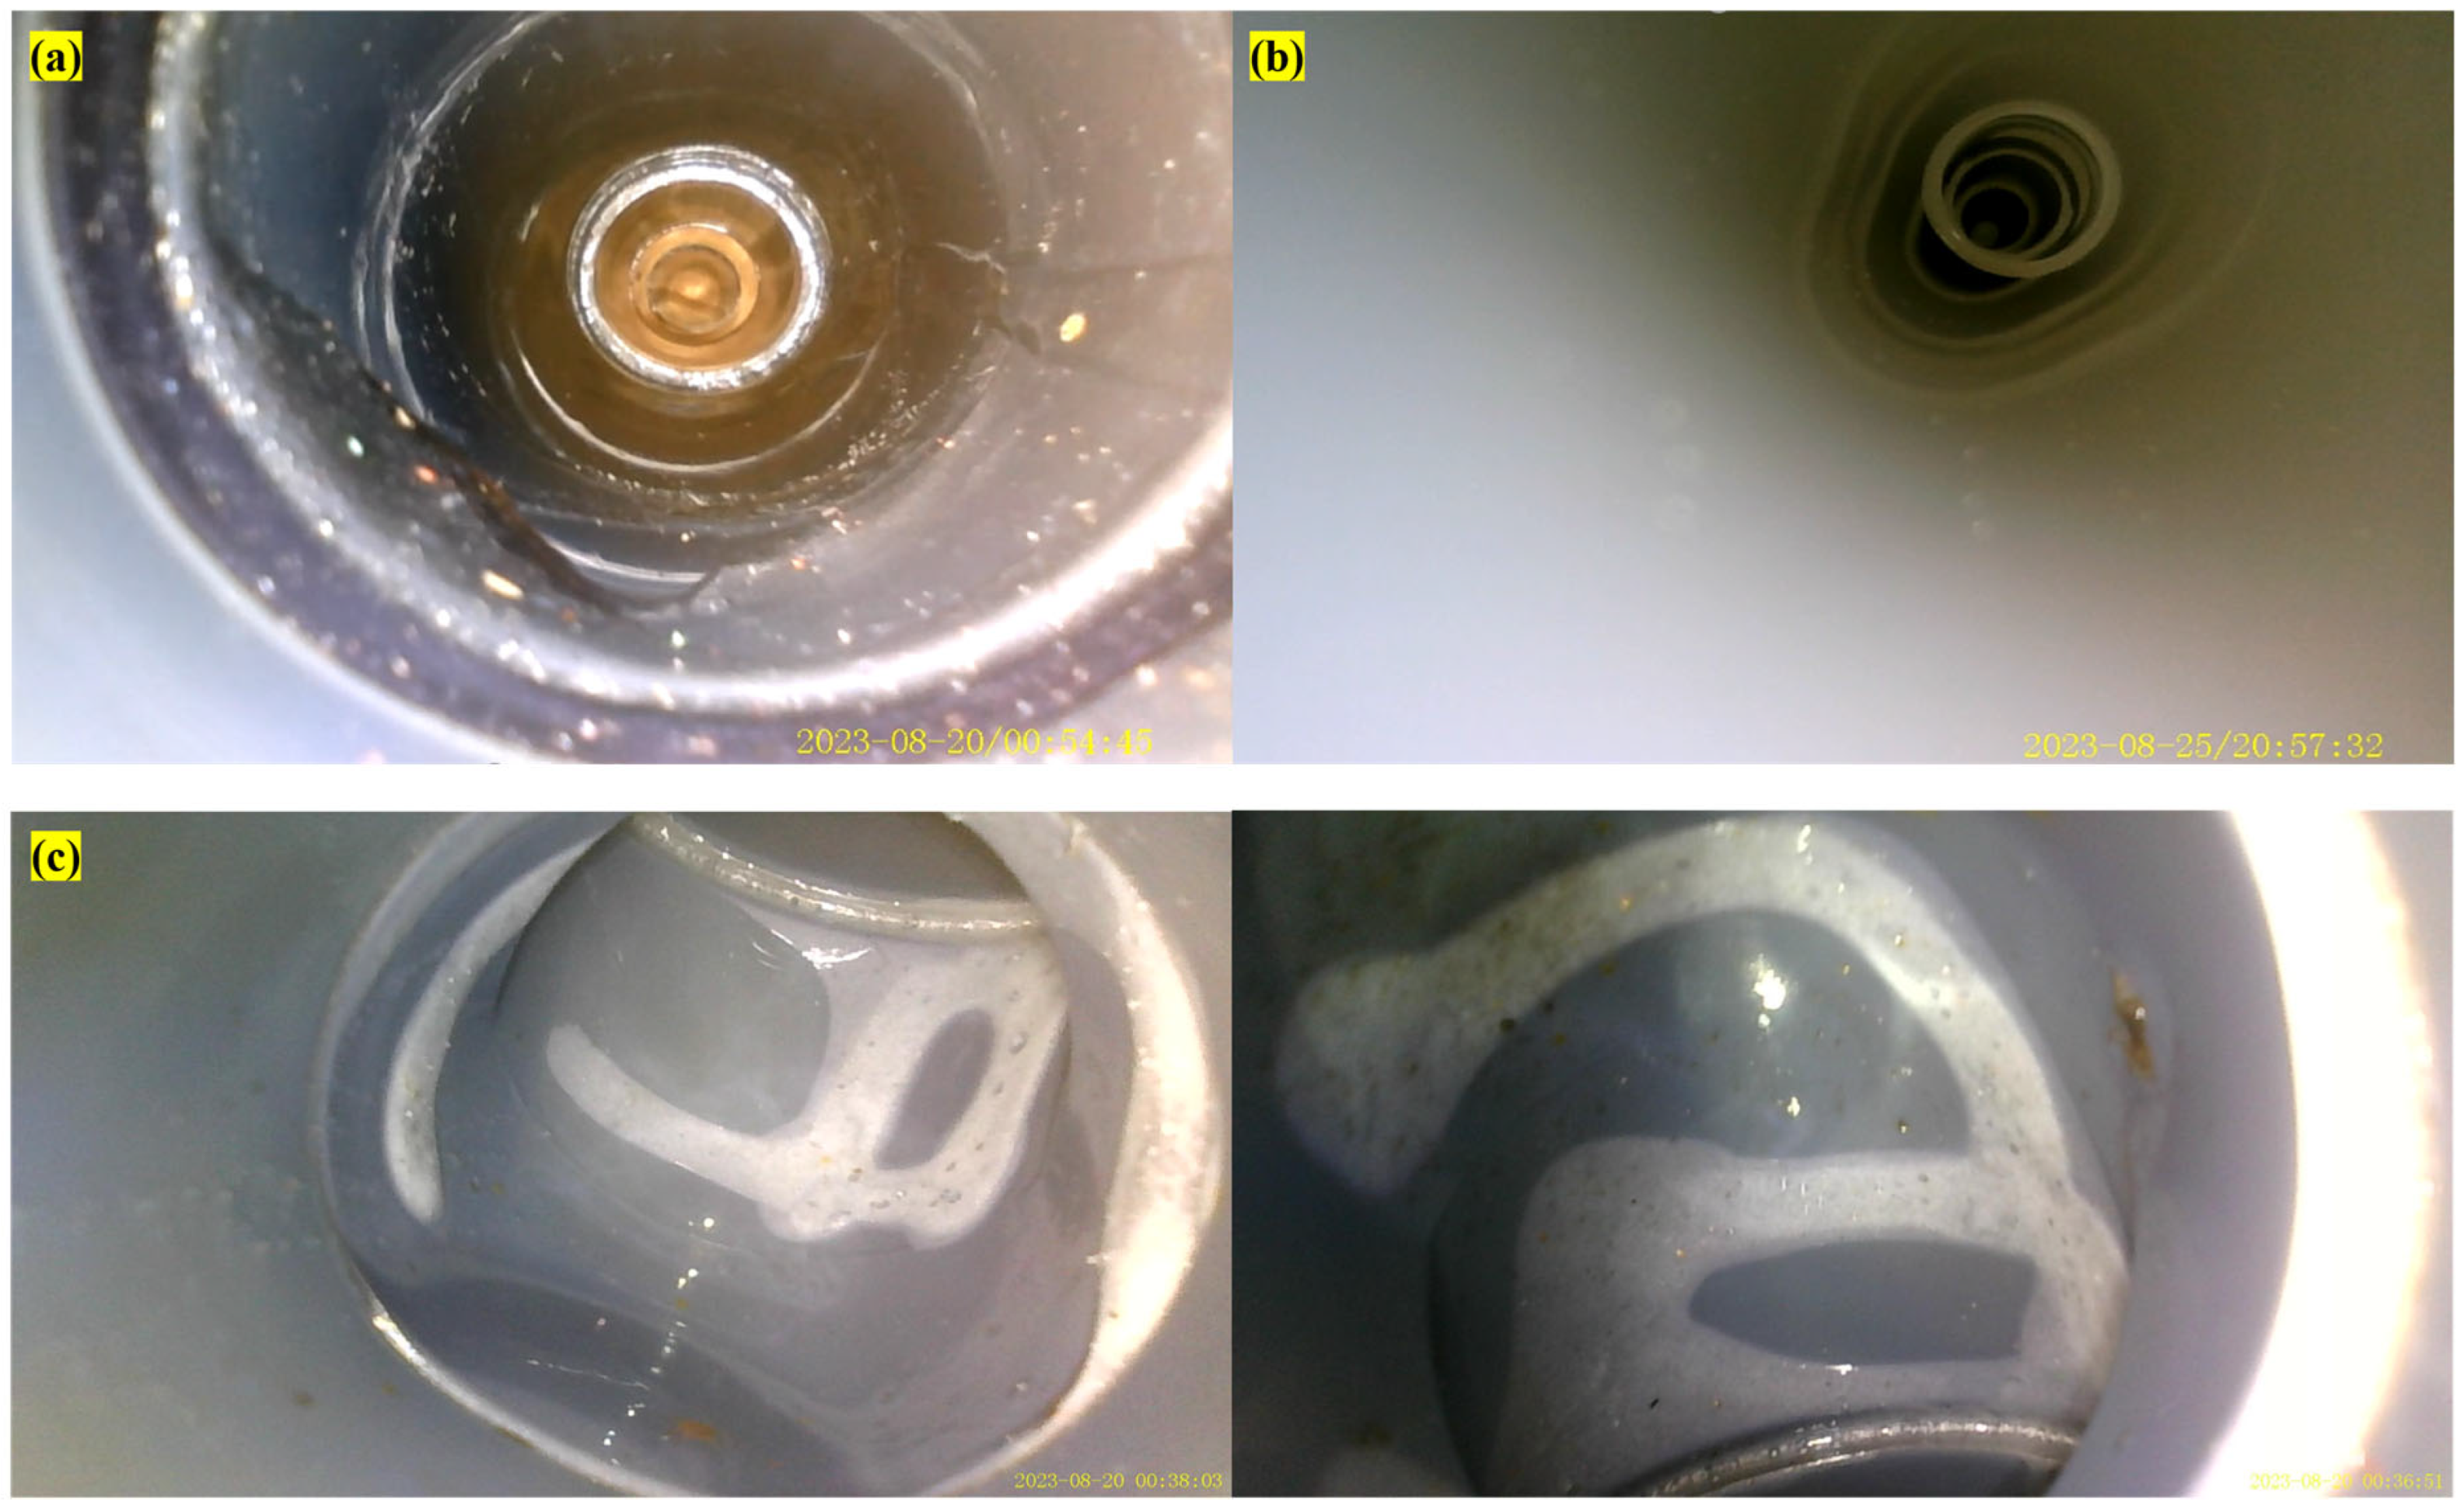
Endoscopic observations directly corroborate the material-dependent leaching and fouling trends identified in chemical analyses. Figure 12 shows that CPVC pipe segments, particularly elbows and joints near distal branches, exhibited yellow-brown discoloration and thin surface deposits. In contrast, corresponding PVDF segments appeared substantially cleaner with only faint, limited staining. Despite the comparable hydraulic and thermal conditions in the two loops, these autopsy results indicate more pronounced discoloration and deposit accumulation in CPVC than in PVDF. This contrast suggests that long-term fouling behavior is primarily governed by material chemical stability and surface roughness. These observations align with recent biostability evaluations of UPW piping materials that report reduced assimilable organic carbon release and diminished microbial growth on PVDF compared to CPVC [37]. They also align with drinking water studies demonstrating that smoother, more chemically inert polymeric surfaces tend to support lower biomass and deposit accumulation than rougher or more reactive substrates [9,20].
Integrating the experimental observations with the CFD analyses yields a coherent framework that describes the material-dependent “contamination resistivity” in UPW loop systems. We emphasize a two-step mechanism: (i) loop geometry creates reproducible low-shear regions (elbows/tees) that define the spatial map of contamination susceptibility; (ii) material properties govern whether those susceptible regions evolve into persistent organic contamination reservoirs, as evidenced by CPVC hot spots (e.g., Sections 3 and 13–15) versus the comparatively uniform PVDF response. As demonstrated in Section 3.1.1, the velocity and pressure fields at the loop scale are essentially identical for CPVC and PVDF. Therefore, the observed differences in contamination cannot be attributed to bulk hydraulic effects. Instead, Section 3.1.1 and Section 3.1.2 reveal that localized wall-temperature cycling and particle residence are concentrated in low-velocity recirculation zones near elbows and downstream tees. These geometrically defined “dead zones” coincide with the CPVC locations that exhibit the highest TOC release and the most pronounced discoloration. In contrast, the same regions in the PVDF loop show substantially lower TOC levels and minimal visual fouling. This spatial correspondence is consistent with prior pipe autopsy and hydraulic conditioning studies that report the preferential accumulation of discoloration materials and deposits in regions of chronically low wall shear or reduced flow velocity [10], as well as with biofilm experiments that demonstrate hydrodynamics and pipe material jointly affect biomass accumulation and detachment behavior [20,37]. From a contamination-resistance perspective, the combined CFD and autopsy evidence indicates that, under identical hydrodynamic conditions, PVDF piping offers substantially greater resistance to long-term organic contamination than CPVC, while also underscoring that mitigating recirculation and stagnation zones remains a critical design priority regardless of material selection. While these results pertain to a direct-return loop geometry and specific operating conditions, the identified mechanisms are expected to be broadly applicable to other UPW loop systems.
Taken together, the present CFD and autopsy results support a conceptual distinction between contamination susceptibility and contamination resistivity in UPW loop systems. While loop geometry and operating conditions define where particles, organic matter, and microorganisms are most likely to accumulate, material properties determine the resistance of those locations to long-term stabilization of contaminants. This framework mirrors observations in drinking-water systems, where hydrodynamic conditioning establishes spatial risk patterns, but smoother and more chemically inert materials consistently suppress biomass growth and deposit persistence under otherwise identical conditions [16,38]. Applying this distinction to UPW distribution highlights the necessity of combining hydraulic optimization with material selection to achieve durable contamination control.

4. Conclusions

This study evaluates the hydraulic characteristics and behavior of contaminants in UPW loop pipes by applying computational fluid dynamics (CFD) and autopsy. The following conclusions were drawn:
  • Outlet flow partitioning remained unchanged across 0–40 °C with a persistent maldistribution (Qmax/Qmin = 6.3; Qmin = 0.073 m3·h−1 at Outlet 3; Qmax = 0.461 m3·h−1 at Outlet 1), confirming that layout and outlet pressure boundaries dominate flow balance rather than polymer material choice. Velocity and pressure fields at 40 °C also showed the same numerical ranges for both materials (|u| = 9.9 × 10⁻⁵–1.78 m·s−1; p = 0–0.23 bar), while Outlet 3 exhibited the largest outlet-mean temperature deviation (ΔT = 2.4 °C for CPVC; 2.5 °C for PVDF).
  • A pulse of 150 inert particles exhibited rapid breakthrough (at t = 17 s) and complete flushing (at t = 13 min) in both loops, indicating efficient global transport under the applied operating conditions. Nonetheless, particles showed prolonged residence in low-velocity/recirculation regions, especially at elbows and downstream tees, attributable to curvature-driven secondary motions and adverse pressure-gradient effects that reduce near-wall velocity and wall shear stress—thereby increasing temporary retention likelihood.
  • Notably, the section-resolved leaching patterns in Figure 9 are not expected to correlate directly with the outlet-wise particle transmission behavior in Figure 8. Figure 8 quantifies short-term hydrodynamic transport of inert particles (15 min) on the converged carrier-flow field and applies a bounce (no-sticking) wall condition; therefore, it identifies hydrodynamically favorable residence/retention zones rather than deposition or material-controlled stabilization. In contrast, Figure 10 reflects long-term, material-dependent organic extractables and surface-mediated accumulation effects captured by standardized leaching of the 17 autopsied pipe sections after extended loop operation. Accordingly, Figure 8 should be interpreted as a hydraulics-based susceptibility map, whereas Figure 9 provides the material-dependent contamination resistivity within those susceptible locations.
  • Leaching/autopsy results showed that CPVC released substantially higher and spatially heterogeneous TOC (mean TOC rising from 2.2 mg·L−1 at 8 h to 7.1 mg·L−1 at 72 h) with pronounced hot spots (Sections 3 and 13–15 reaching 16–18 mg·L−1 at 72 h), whereas PVDF maintained low and spatially uniform TOC (most sections within 0.4–2.3 mg·L−1). Inorganic ion release remained minor (sub-mg·L−1) for both materials, indicating that long-term organic contamination—not ionic leaching—dominates the material contrast under the present UPW conditions.
  • Endoscopic inspection corroborated the chemical results: CPVC segments (notably elbows/joints) showed yellow–brown discoloration and thin deposits, while PVDF remained substantially cleaner. Together, the evidence supports a two-step framework: (i) geometry establishes contamination susceptibility by repeatedly creating low-shear recirculation regions, and (ii) material properties govern contamination resistivity, i.e., whether those susceptible regions evolve into persistent organic reservoirs (consistent with PVDF’s smoother, more inert surface relative to CPVC; Ra = 0.1 µm for PVDF and 0.25 µm for CPVC). Practically, durable mitigation therefore requires both hydraulic design to minimize recirculation/stagnation features and material selection favoring high chemical stability and low roughness (PVDF over CPVC under identical hydrodynamic conditions).

Author Contributions

Conceptualization, S.L. (Sangho Lee) and J.A.L.; methodology, J.A.L. and J.P.; software, J.A.L.; validation, J.A.L., J.P. and K.S.; formal analysis, J.A.L.; investigation, J.A.L. and J.P.; resources, J.P.; data curation, J.A.L.; writing—original draft preparation, J.A.L.; writing—review and editing, S.L. (Sangho Lee) and S.L. (Song Lee); visualization, J.A.L.; supervision, S.L. (Sangho Lee); project administration, S.L. (Sangho Lee); funding acquisition, S.L. (Sangho Lee). All authors have read and agreed to the published version of the manuscript.

Funding

This study was conducted with research funds from the Ministry of Climate, Energy and Environment to develop domestic EPC-O&D technology for UPW (2021003210004).

Data Availability Statement

The data supporting the findings of this study are not publicly available due to the confidential nature of the Study. Access to the data is restricted in order to comply with confidentiality obligations. However, the data may be made available from the corresponding author upon reasonable request and subject to appropriate confidentiality conditions.

Conflicts of Interest

Author J.P (Jinsu Park) was employed by the company Jinsung ENC Co., Ltd. The remaining authors declare that the research was conducted in the absence of any commercial or financial relationships that could be construed as a potential conflict of interest.

References

  1. Wang, Z. Chapter 6—Reverse osmosis. In Fundamentals of Membrane Separation Technology; Wang, Z., Ed.; Elsevier: Amsterdam, The Netherlands, 2024; pp. 241–412. [Google Scholar]
  2. Zhao, P.; Bai, Y.; Liu, B.; Chang, H.; Cao, Y.; Fang, J. Process optimization for producing ultrapure water with high resistivity and low total organic carbon. Process Saf. Environ. Prot. 2019, 126, 232–241. [Google Scholar] [CrossRef] [Scilit]
  3. Miraflores, A.H.; Gómez, K.H.; Muro, C.; Hernández, M.C.D.; Blancas, V.D.; Álvarez Sánchez, J.; Isordia, G.E.D. Ultrapure Water Production by a Saline Industrial Effluent Treatment. Membranes 2025, 15, 116. [Google Scholar] [CrossRef] [Scilit]
  4. Libman, S.; Wilcox, D.; Zerfas, B. (Invited) Ultrapure Water for Advance Semiconductor Manufacturing: Challenges and Opportunities. ECS Trans. 2015, 69, 17. [Google Scholar] [CrossRef] [Scilit]
  5. SEMI F63; Guide for Ultrapure Water System Used in Semiconductor Processing. SEMI: Milpitas, CA, USA, 2022.
  6. ASTMD5127-13; Standard Guide for Ultra-Pure Water Used in the Electronics and Semiconductor Industries. ASTM International: West Conshohocken, PA, USA, 2018.
  7. SEMI F57; Specification for High Purity Polymer Materials and Components Used in Ultrapure Water and Liquid Chemical Distribution Systems. SEMI: Milpitas, CA, USA, 2022.
  8. Zainudin, N.F.; Ting, S.S.; Wong, Y.-S.; Ismail, H. Plastics in Water Treatment. In Encyclopedia of Materials: Plastics and Polymers; Hashmi, M.S.J., Ed.; Elsevier: Oxford, UK, 2022; pp. 285–294. [Google Scholar]
  9. Park, H.; Kim, S.; Choi, S.; Park, J.; Lee, K.-H.; Kang, S. Comparative Evaluation of PVC and PVDF Pipe Leaching in Ultrapure Water (UPW) Using Batch and Loop Pilot Systems. KSCE J. Civ. Eng. 2025, 30, 100366. [Google Scholar] [CrossRef] [Scilit]
  10. Duong, T.H.; Choi, S.; Lee, K.-H.; Maeng, S.K. Biostability assessment of ultrapure water piping materials in the semiconductor industry and their susceptibility to Ralstonia growth. Desalination 2025, 593, 118199. [Google Scholar] [CrossRef] [Scilit]
  11. Guha, A. Transport and deposition of particles in turbulent and laminar flow. Annu. Rev. Fluid Mech. 2008, 40, 311–341. [Google Scholar] [CrossRef] [Scilit]
  12. Zahtila, T.; Chan, L.; Ooi, A.; Philip, J. Particle transport in a turbulent pipe flow: Direct numerical simulations, phenomenological modelling and physical mechanisms. J. Fluid Mech. 2023, 957, A1. [Google Scholar] [CrossRef] [Scilit]
  13. Rho, H.; Chon, K.; Cho, J. An autopsy study of a fouled reverse osmosis membrane used for ultrapure water production. Water 2019, 11, 1116. [Google Scholar] [CrossRef] [Scilit]
  14. Mathews, C.L.; Wasel, O.; Isaacson, K.P.; Proctor, C.R.; Tariq, M.; Shah, A.D.; Freeman, J.L.; Whelton, A.J. Crosslinked polyethylene (PEX) drinking water pipe: Carbon leaching, impacts on microbial growth, and developmental toxicity to zebrafish. Environ. Adv. 2023, 13, 100386. [Google Scholar] [CrossRef] [Scilit]
  15. Vreeburg, I.J.; Boxall, J.B. Discolouration in potable water distribution systems: A review. Water Res. 2007, 41, 519–529. [Google Scholar] [CrossRef] [Scilit]
  16. Husband, P.; Boxall, J.; Saul, A. Laboratory studies investigating the processes leading to discolouration in water distribution networks. Water Res. 2008, 42, 4309–4318. [Google Scholar] [CrossRef] [Scilit] [PubMed]
  17. Fish, K.E.; Sharpe, R.L.; Biggs, C.A.; Boxall, J.B. Impacts of temperature and hydraulic regime on discolouration and biofilm fouling in drinking water distribution systems. PLoS Water 2022, 1, e0000033. [Google Scholar] [CrossRef] [Scilit]
  18. Prest, E.I.; Hammes, F.; Van Loosdrecht, M.C.; Vrouwenvelder, J.S. Biological stability of drinking water: Controlling factors, methods, and challenges. Front. Microbiol. 2016, 7, 45. [Google Scholar] [CrossRef] [Scilit] [PubMed]
  19. van der Kooij, D.; van der Wielen, P.W.J.J. Microbial growth in drinking-water supplies: Problems, causes, control, and research needs. Water Sci. Technol. Water Supply 2013, 13, 209–217. [Google Scholar] [CrossRef] [Scilit]
  20. Cowle, M.W.; Webster, G.; Babatunde, A.O.; Bockelmann-Evans, B.N.; Weightman, A.J. Impact of flow hydrodynamics and pipe material properties on biofilm development within drinking water systems. Environ. Technol. 2020, 41, 3732–3744. [Google Scholar] [CrossRef] [Scilit]
  21. Wilcox, D.C. Formulation of the kw turbulence model revisited. AIAA J. 2008, 46, 2823–2838. [Google Scholar] [CrossRef] [Scilit]
  22. Happel, J.; Brenner, H. Low Reynolds Number Hydrodynamics: With Special Applications to Particulate Media; Springer Science & Business Media: Berlin/Heidelberg, Germany, 2012; Volume 1. [Google Scholar]
  23. Wilcox, D.C. Reassessment of the scale-determining equation for advanced turbulence models. AIAA J. 1988, 26, 1299–1310. [Google Scholar] [CrossRef] [Scilit]
  24. Cao, Y.; Zhou, L.; Ou, C.; Fang, H.; Liu, D. 3D CFD simulation and analysis of transient flow in a water pipeline. AQUA—Water Infrastruct. Ecosyst. Soc. 2022, 71, 751–767. [Google Scholar] [CrossRef] [Scilit]
  25. Menter, F.R. Two-equation eddy-viscosity turbulence models for engineering applications. AIAA J. 1994, 32, 1598–1605. [Google Scholar] [CrossRef] [Scilit]
  26. Martins, N.M.; Soares, A.K.; Ramos, H.M.; Covas, D.I. CFD modeling of transient flow in pressurized pipes. Comput. Fluids 2016, 126, 129–140. [Google Scholar] [CrossRef] [Scilit]
  27. Brooks, A.N.; Hughes, T.J. Streamline upwind/Petrov-Galerkin formulations for convection dominated flows with particular emphasis on the incompressible Navier-Stokes equations. Comput. Methods Appl. Mech. Eng. 1982, 32, 199–259. [Google Scholar] [CrossRef] [Scilit]
  28. Huang, X.; Pang, B.; Chai, X.; Yin, Y. Proposal of a turbulent Prandtl number model for Reynolds-averaged Navier–Stokes approach on the modeling of turbulent heat transfer of low-Prandtl number liquid metal. Front. Energy Res. 2022, 10, 928693. [Google Scholar] [CrossRef] [Scilit]
  29. Maxey, M.R.; Riley, J.J. Equation of motion for a small rigid sphere in a nonuniform flow. Phys. Fluids 1983, 26, 883–889. [Google Scholar] [CrossRef] [Scilit]
  30. Horwitz, J.; Mani, A. Accurate calculation of Stokes drag for point–particle tracking in two-way coupled flows. J. Comput. Phys. 2016, 318, 85–109. [Google Scholar] [CrossRef] [Scilit]
  31. Chiarini, A.; Tandurella, S.; Rosti, M.E. Kolmogorov-size particles in homogeneous and isotropic turbulence. J. Fluid Mech. 2025, 1007, A81. [Google Scholar] [CrossRef] [Scilit]
  32. Elghobashi, S. On predicting particle-laden turbulent flows. Appl. Sci. Res. 1994, 52, 309–329. [Google Scholar] [CrossRef] [Scilit]
  33. Russo, F.; Basse, N.T. Scaling of turbulence intensity for low-speed flow in smooth pipes. Flow Meas. Instrum. 2016, 52, 101–114. [Google Scholar] [CrossRef] [Scilit]
  34. Michaelides, E. Particles, Bubbles & Drops: Their Motion, Heat and Mass Transfer; World Scientific: Singapore, 2006. [Google Scholar]
  35. Lu, L.; Fu, L.; Liu, Z.; Chen, Y.; Li, M. Influences of wall shear stress on bacterial colony formation at pipe joints and elbows in drinking water distribution systems. J. Water Process Eng. 2025, 72, 107595. [Google Scholar] [CrossRef] [Scilit]
  36. Braga, A.S.; Filion, Y. The interplay of suspended sediment concentration, particle size and fluid velocity on the rapid deposition of suspended iron oxide particles in PVC drinking water pipes. Water Res. X 2022, 15, 100143. [Google Scholar] [CrossRef] [Scilit]
  37. Jang, H.-J.; Choi, Y.-J.; Ka, J.-O. Effects of diverse water pipe materials on bacterial communities and water quality in the annular reactor. J. Microbiol. Biotechnol. 2011, 21, 115–123. [Google Scholar] [CrossRef] [Scilit]
  38. Shen, Y.; Monroy, G.L.; Derlon, N.; Janjaroen, D.; Huang, C.; Morgenroth, E.; Boppart, S.A.; Ashbolt, N.J.; Liu, W.-T.; Nguyen, T.H. Role of biofilm roughness and hydrodynamic conditions in Legionella pneumophila adhesion to and detachment from simulated drinking water biofilms. Environ. Sci. Technol. 2015, 49, 4274–4282. [Google Scholar] [CrossRef] [Scilit]
Figure 1. (a) Three-dimensional design of the pilot-scale ultrapure water (UPW) distribution loop; (b) Geometric layout of the UPW loop piping system in CFD simulation showing the inlet and six outlet locations; (c) photograph of the assembled UPW loop piping system.
Water 18 00429 g001
Figure 2. UPW flow direction through the loop piping system; from inlet to (a) Outlet 1; (b) Outlet 2; (c) Outlet 3; (d) Outlet 4; (e) Outlet 5; (f) Outlet 6. Arrows indicate the nominal flow direction; Outlet 1–6 correspond to the six point-of-use (branch) outlets defined in the CFD model.
Water 18 00429 g002
Figure 3. (a) Locations of the 17 pipe sections extracted from the UPW loop (Sections 1–6: elbow-adjacent with solvent-welded joints; Sections 7–10: straight joint-free references; Sections 11–15: outlet-proximal tees; Section 16: mid-loop elbow; Section 17: outlet-proximal elbow); (b) stainless-steel (STS304) extraction apparatus used for standardized leaching tests of UPW loop piping components.
Water 18 00429 g003
Figure 4. Volume flow rates in the UPW loop as a function of ambient temperature for (a) CPVC and (b) PVDF piping systems.
Water 18 00429 g004
Figure 5. CFD-predicted velocity magnitude distribution in the UPW loop piping system for (a) CPVC and (b) PVDF at an ambient temperature of 40 °C.
Water 18 00429 g005
Figure 6. CFD-predicted pressure distribution in the UPW loop piping system for (a) CPVC and (b) PVDF at an ambient temperature of 40 °C.
Water 18 00429 g006
Figure 7. Outlet water temperature as a function of ambient temperature for (a) CPVC and (b) PVDF UPW loop piping systems.
Water 18 00429 g007
Figure 8. Time-dependent cumulative particle transmission probability (fraction of injected particles discharged) at each branch outlet (Outlet 1–Outlet 6) for (a) CPVC and (b) PVDF UPW loop piping systems predicted by Lagrangian particle tracking. Outlet numbering follows the six POU branch discharge locations indicated in Figure 1b.
Water 18 00429 g008
Figure 9. Spatial distribution of (a) conductivity and (b) total organic carbon (TOC) in leachates from individual UPW loop pipe sections as a function of leaching duration for CPVC and PVDF.
Water 18 00429 g009
Figure 10. Spatial distribution of cation concentrations in leachates from individual UPW loop pipe sections for (a) CPVC and (b) PVDF as a function of leaching duration.
Water 18 00429 g010
Figure 11. Spatial distribution of anion concentrations in leachates from individual UPW loop pipe sections for (a) CPVC and (b) PVDF as a function of leaching duration.
Water 18 00429 g011
Figure 12. Endoscopic images of inner pipe surfaces. (a) a straight section of the CPVC loop, (b) a straight section of the PVDF loop, and (c) an elbow section of the CPVC loop.
Water 18 00429 g012
Table 1. Physical and thermal properties of CPVC and PVDF pipes (based on manufacturer data).
PropertyCPVCPVDF
Density1520 kg·m−31750 kg·m−3
Thermal conductivity0.1743 W·m−1·K−10.1162 W·m−1·K−1
Heat capacity1200 J·kg−1·K−11200 J·kg−1·K−1
Surface roughness0.25 μm0.1 μm
Table 2. Water quality parameters analyzed in the leaching tests of UPW loop pipe sections.
GroupItems
GeneralConductivity (μS·cm−1)
OrganicTotal organic carbon (TOC) (mg·L−1)
CationCopper, Potassium, Zinc, Calcium, Sodium, Magnesium, Silicon
AnionFluoride, Chloride, Bromide, Nitrite, Nitrate, Phosphate, Sulfate
Disclaimer/Publisher’s Note: The statements, opinions and data contained in all publications are solely those of the individual author(s) and contributor(s) and not of MDPI and/or the editor(s). MDPI and/or the editor(s) disclaim responsibility for any injury to people or property resulting from any ideas, methods, instructions or products referred to in the content.