1. Introduction
All of Earth’s major biogeochemical cycles have been massively altered by human population expansion and industrialization [
1]. In particular, the total amount of circulating nitrogen (N) in the biosphere has been increased by ~100% [
2,
3]. Much of this “extra N” is on the form of oxidized, reactive N species (NO
X, representing the sum of nitrate and nitrite) formed by fossil fuel combustion that enter the atmosphere to join agriculturally-derived N for regional transport and deposition to terrestrial and aquatic habitats, primarily
via rain and snowfall [
3]. Considerable previous work has evaluated the biogeochemical and ecological impacts of this atmospheric N deposition on terrestrial ecosystems as primary production in these systems often is strongly limited by bioavailable N. The effects of atmospheric N deposition on freshwater ecosystems in terms of productivity, stoichiometry and community composition have received considerably less attention, as primary production in lakes is generally thought to be limited by P [
4]. However, the strict primacy of P limitation of lake phytoplankton production is not supported by consideration of experimental assessments of nutrient limitation on ecological (rather than geological) time scales [
5].
Over the past 50 years, emissions of NO
x over Europe have increased manifold, resulting in increased deposition and subsequently a range of ecosystem impacts [
6,
7,
8,
9]. The present NO
x emissions in Europe are of the same order of magnitude as the use of commercial fertilizers. Correspondingly, atmospheric output of reduced N (NH
4 and NH
3) from agricultural activity, particularly livestock emissions, has also increased. In central Europe, with typical annual depositions of N (NO
3 + NH
4) in the range 4–6 g N m
−2 year
−1, continuous increases in NO
3 concentrations have been reported for several brooks and rivers [
10]. In urban and agricultural catchments, inputs and N and P from surface runoffs will generally completely override the signal from atmospheric deposition, while in more pristine catchments, N-delivered by wet or dry deposition may play a major role to productivity and elemental ratios both in the terrestrial and aquatic part of the catchment. The effects in the aquatic systems will to a large extent reflect the catchments properties.
Increased N-deposition in pristine systems may affect surface waters in fundamentally different ways. Increased precipitation of ammonium and nitrate promotes increased DIN in surface waters and soil and water acidification [
11,
12,
13], but could also affect elemental ratios in lakes and rivers [
14,
15,
16]. If the supply ratio of N relative to phosphorus (P) or silicate (Si) is sufficiently skewed towards N, one could expect a predominant P or Si (for diatoms) limitation of primary production. The relative proportions of these vital elements will determine the nature of elemental limitation for both autotrophs and a range of heterotrophs, and could thus profoundly affect community composition and ecosystem processes. Indeed, comparative studies of regions of high and low N-deposition in US, Sweden and Norway suggested a major regional transition from predominantly N- to P-limitation of aquatic primary production and intensified herbivore P-limitation in response to elevated N-deposition [
17,
18].
This review will discuss how deposition of inorganic N potentially may affect the balance between N and P-limitation and thus productivity of lake phytoplankton, and the extent to which this reflect catchment properties and catchment processes. It will focus on pristine boreal and subalpine watersheds, and will draw upon large datasets available from Norwegian boreal lakes and watersheds. Norwegian lake ecosystems are ideal for testing the role of N-deposition on surface waters for several reasons. The annual N deposition rates vary more than 10-fold between southern areas that receive high anthropogenic inputs to the pristine northern areas. There is also a strong gradient in annual precipitation and various lake and catchment properties that allow for testing for the stoichiometric effects of N-deposition over a variety of catchments [
19].
The impact of increased N export to lake ecosystems is not only determined by N itself, but to a large extent also by the fluxes of other major elements of importance for aquatic primary production like inorganic P, Si, iron (Fe), carbon (C), and to some extent also calcium (Ca) which is important for many aquatic animals. The balance between catchment mineralization, release and uptake of these elements will again have feedbacks on CO
2-uptake and C-sequestration (
Figure 1). Elevated N-deposition may promote primary production and forest growth, where root activity may alter the export of key elements like P and Si due to increased bedrock mineralization. It may also reduce catchment export of P by increased vegetation demands for this element under increased availability of N (and CO
2), and mineralization of soil organic matter may in fact be retarded by N-deposition [
20]. The resulting export to surface waters will determine productivity both on short and long term, and, at longer geological periods, these processes will ultimately regulate “new” production of aquatic production, and thus serve as important climate regulators via feedbacks to the global C-cycle [
21]. A review of these processes is beyond the scope of this paper, here I will instead evaluate the links between N-deposition, catchment properties and N-export to surface waters, and specifically its bearings for NO
3:P ratios and productivity of lakes.
Figure 1.
Conceptual and simplified relationships and feedbacks between dissolved inorganic nitrogen (DIN)-deposition in catchments, catchment processes including root weathering, uptake and release of elements relevant for aquatic productivity. This again feed into the C-dynamics via aquatic uptake or release of CO2. See text for further explanation.
2. N-Deposition and N:P-Ratios in Lakes, the Catchment as a Modifier
The fraction of DIN-deposition over a catchment eventually ending up as DIN in lakes as well as ratio of DIN to organic N, the ratio between reduced and oxidized DIN and N:P-ratios very much hinge of the catchment itself, the “catchment filter”. Much of a lake’s specific chemical properties are thus actually footprints from the terrestrial part of the catchment, and hence changes in these lake-specific attributes may serve as early signals of altered terrestrial processes that are difficult to detect in the more heterogeneous terrestrial ecosystem. Typically, mass balance of carbon and other elements in terrestrial systems depend on weathering rate, hydrology, soil and vegetation processes, which again depend on drivers like temperature, precipitation and deposition of elements. With short renewal rates (
i.e., a few months or less), lakes may track short-term seasonal shifts in the catchments, while lakes with long renewal rates will memorize and integrate catchment changes on a yearly to decadal basis, and thus it may also be beneficial to use lakes as “sentinels” of processes in the terrestrial part of the catchment [
22,
23].
N-deposition also yields large-scale patterns in elemental ratios in surface waters. Hessen
et al. [
15] observed a consistent geographical pattern in stoichiometry of riverine runoff, reflecting this regional pattern in N-deposition. The NO
3:PO
4 ratio showed a pronounced peak in south-western rivers which receives high atmospheric input of N with a median N:P ratio (at:at) above 440 declining to less than 210 in the eastern and northern rivers draining areas with low N-deposition. A corresponding pattern is found for total N:total P, pointing to a pronounced stoichiometric effect of elevated N-deposition. This is most likely attributed to increased runoff of N, but perhaps also decreased N-retention in areas receiving high N-deposition [
24,
25]. Also in-lake processes like denitrification [
26] as well as water body volume and water-sediment interface [
27] may strongly affect DIN:TP-ratios.
However, the NO
3-flux and elemental concentrations as well as ratios in boreal and pristine systems is to a large extent determined by catchment properties, notably vegetation cover and fraction of bogs and wetlands, but also hydrology, soil richness, bedrock attributes and terrain slopes [
28,
29,
30]. The seminal studies in the Hubbard Brook experimental system [
31] clearly demonstrated the interaction between atmospheric deposition and vegetation, notably forest cover, for the catchment export of inorganic N. Clear-cutting caused a dramatic mobilization especially on NO
3, partly due to reduced uptake of NO
3 during the growing season, but also due to mobilization of organic N from debris and soils. Similarly, the strong capacity of boreal forests to sequester N is also seen on the seasonal scale where NO
3-export (or “leakage”) may be high in winter while close to zero during summer [
12,
25]. Although forest ecosystems have strong capacities to assimilate extra N into biomass, as well as redirecting N-back to the atmosphere via denitrification, studies in several sites with highly different N inputs, combined with experimental removal or additions of N in precipitation, invariably reveal increased losses (lower retention) with increased deposition. An examination of 65 forested plots and catchments throughout Europe indicated a three-stage response to increasing N inputs [
10]. At deposition rates <1000 kg N km
−2 year
−1 no significant leaching occurred. At intermediate levels (1000–2500 kg N km
−2 year
−1) leaching occurred at some sites, while at deposition >2500 kg N km
−2 year
−1, a significant leaching of N was seen at all sites, still with pronounced site-specific variability in N export. Since these data apply to forested catchments with well-developed soils, it is reasonable to assume that saturation thresholds would be lower over alpine or sub-alpine non-forested areas with less developed soils.
Grouping the rivers and watersheds into 16 large areas of southern Norway gave area-specific runoff ranging from 306 to 2200 kg N km
−2 year
−1 with an average of 725 kg N km
−2 year
−1. By calculating direct anthropogenic catchment inputs from sewage and fertilizers, the “background” runoff was estimated as the difference between total flux (measured) and anthropogenic flux (calculated). These background fluxes ranged from 125 to 744 kg N km
−2 year
−1, with an average of 327 kg N km
−2 year
−1. Thus, anthropogenic inputs contributed from 23% to 79% (average 42%) of total N export from the different regions [
32].
The modifying role of catchment properties is even better visualized on the local scale. Sub-catchment studies in two large watersheds in southern Norway clearly demonstrated on a smaller scale the role of various catchment properties for N export to estuaries. In the sparsely populated Bjerkreim watershed, dominated by atmospheric inputs (1500–2300 kg N km
−2 year
−1), total N export were 230–420, 420–500 and 630–870 kg N km
−2 year
−1, from forested, heathlands and mountainous sub-catchments respectively [
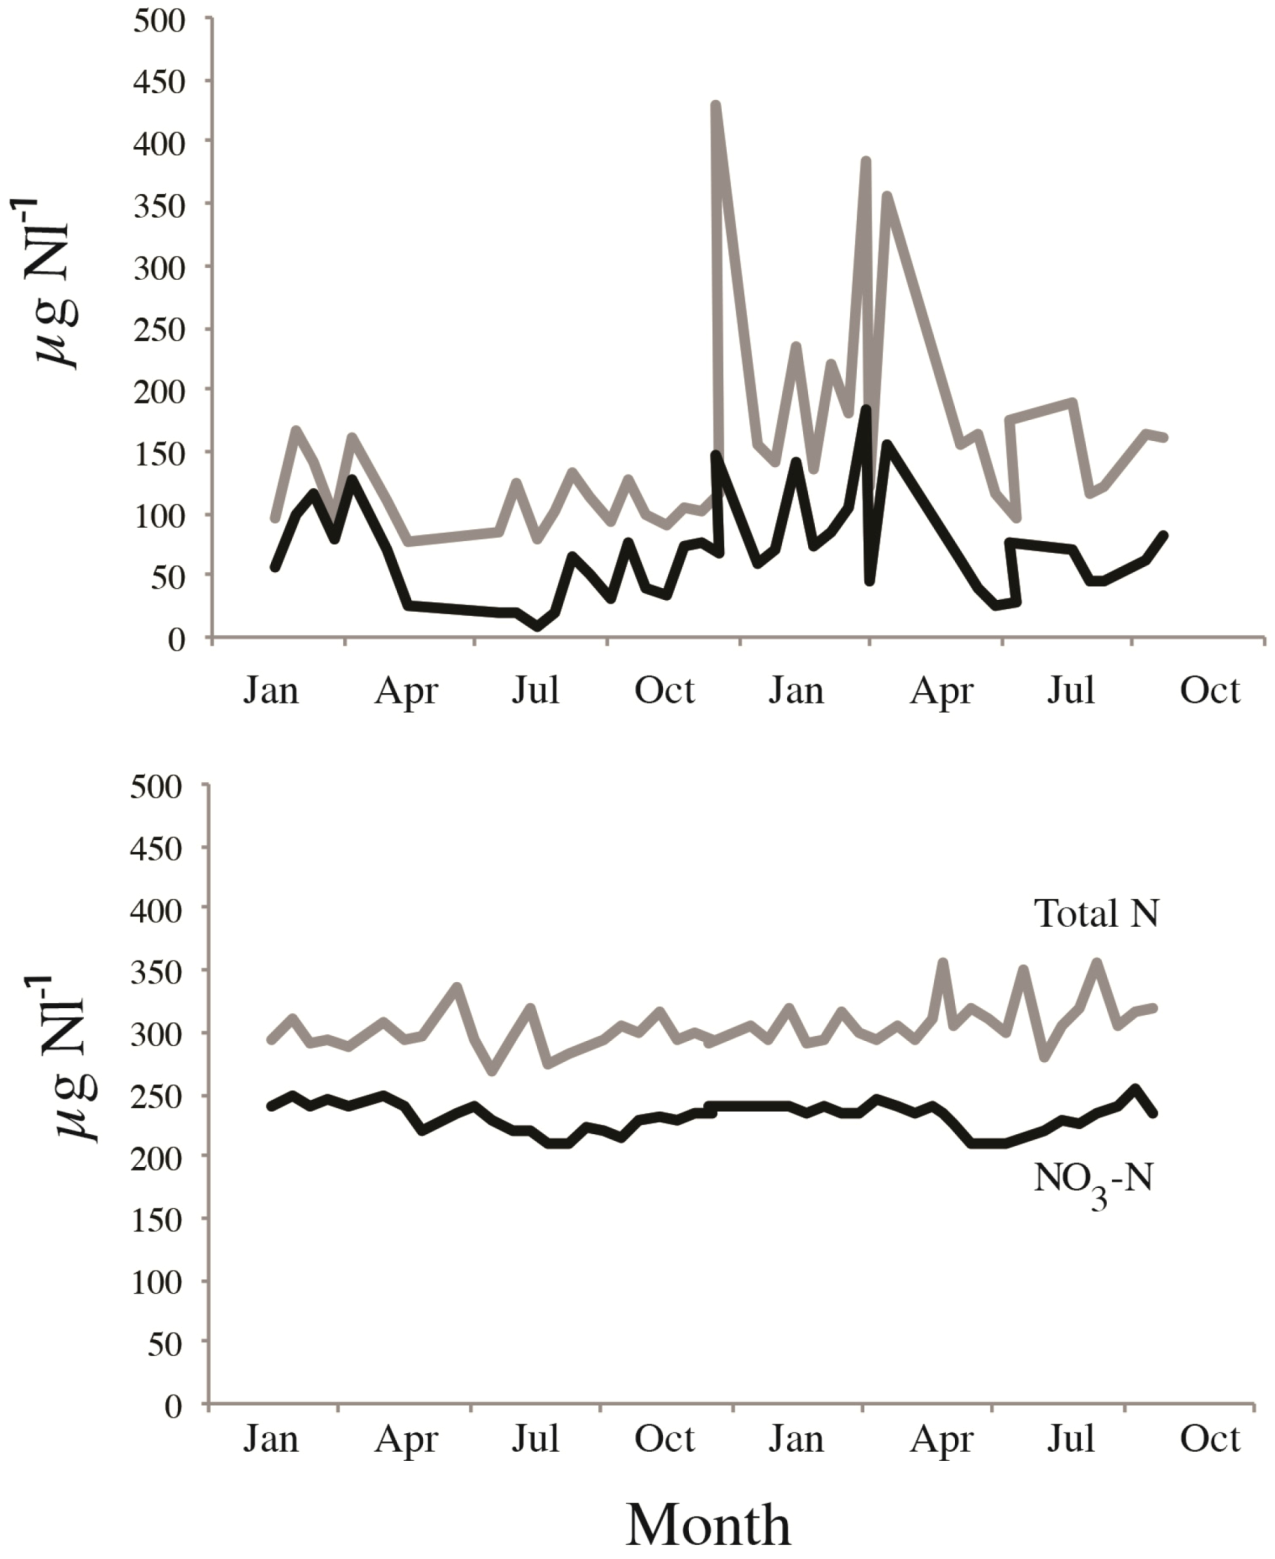
25]. This corresponds to retentions of 70%–90%, 65%–70% and 55%–70% respectively, and clearly demonstrates that N-export from equally “pristine” catchments may differ significantly, even within a small region. The role of forest and soil cover on NO
3-uptake is also clearly seen not only from levels of NO
3, but also on the ratio of organic N to NO
3 and not the least the seasonal dynamics. Two adjacent catchment within the aforementioned Bjerkreim catchment that both receive approximately 2000 kg N km
−2 year
−1, but while the forested catchment has strong seasonal fluctuations, and a major share of organic N in total N runoff, the heathland catchment had substantially higher levels of NO
3, only minor seasonal variability and a low proportion of organic N (
Figure 2).
By using a large number of catchment variable, the study of Hessen
et al. [
19] combined the effects of N-deposition, catchment hydrology and a range of other catchment properties including the satellite-derived NDVI-index as a proxy of vegetation (forest) density, to assess the overall drivers of nutrient ratios in 1000 lakes sampled by fall overturn. In Norway, the ratio of oxidized and reduced atmospheric N is close to unity, and there is a strong gradient from north to south in N-deposition (100–2000 kg km
−2 year
−1) owing to a combined effect of precipitation and long distance transported N. In contrast, there are negligible amounts of reduced N in surface waters. In fact, in a survey of almost 1000 lakes in pristine catchments (see [
13,
19] for details), NH
4 was below detection limits in the majority of sites, reflecting either a preferential uptake of reduced N by roots or soils, a pronounced oxidation of reduced N, or a combination of both. Thus although a significant fraction of NH
4 actually may enters surface waters either by direct deposition or surface runoff, it is generally rapidly transformed or assimilated in upper layers, thus for practical reasons, DIN in surface waters is in the following represented by NO
3 alone. Clearly there are times and sites, notably in smaller ponds and wetlands as well as anoxic deep layers of lakes, where also NH
4 may contribute substantially or dominate the DIN-pool.
Figure 2.
Example of seasonal responses and differences in total nitrogen (grey line) and NO
3-N (black line) in two adjacent catchments receiving almost equal amounts of atmospheric DIN, but where the (
upper) is a forested catchment, the (
lower) a heathland catchments (see [
15,
25] for details).
The study of Hessen
et al. [
19] clearly demonstrated that N-deposition and forest plus bog coverage in the catchments serve as main determinants of lake concentrations of NO
3, and since forest and bog coverage had positive impact on lake concentrations of total P (due to P associated with dissolved organic matter), the NO
3:TP-ratio was also largely explained by N-deposition, and forest cover and bogs in the catchment (
Figure 3). The major role of N-deposition, and climate-sensitive catchment parameters (like vegetation density, temperature and hydrology), also suggest that not only DIN-fluxes but also elemental ratios are likely to be affected by climatic changes both regionally and locally. Organic and inorganic N and P fractions are subject to different fluxes and fates in the terrestrial realms, and they will respond differently to temperature and hydrology. One major effect of changes in hydrology may be to alter nutrient ratios in lakes because changes in precipitation and runoff can influence different elements in different ways [
19]. These deposition and catchment driven changes at the lake level seem to reflect corresponding shifts in nutrient ratios effects in rivers, resulting in different stoichiometric loadings to costal areas [
28,
32,
33].
Figure 3.
Effect plot of catchment properties; fractions or arable land, lakes, bogs, N-deposition, vegetation cover (inferred from the satellite-derived NDVI-index) terrain slope, mean annual temperature and runoff of NO
3:TP-ratios in nearly 1000 surveyed lakes. Extensions of lines scaled to the relative positive (to the right of the vertical line) or negative impacts of the included variables. The multivariate model explains 53% of observed NO
3:TP. See [
19] for details.
3. N or P-Limitation?
The ratio between the major nutrient elements N, P and Si is of considerable interest, primarily as determinant of relative nutrient limitation and community composition if autotrophs, but also secondarily for the herbivores. To determine the shift in nutrient limitation by nutrient ratios alone is not straightforward however for a number of reasons. First of all different autotrophs have different demands for elements and this is in fact why community composition also will change with changed nutrient ratios. E.g., Si deficiency clearly affect diatoms while not other taxa, and several cyanobacteria may compensate for N-deficiency by N-fixation. Also light levels may affect nutrient ratios and nutrient demands and not the least the form on which the elements exist have wide implications for their bioavailability and thus their role for autotrophs. The commonly large pool of organic N in boreal lakes may to a certain extent become bioavailable after photo-oxidation or microbial breakdown of organic molecules, but for a number of reasons NO
3:TP has been adopted as a good proxy of the shift between N and P-limitation for lake phytoplankton [
34,
35].
Based on nutrient enrichment assays from mountain lakes in Colorado Morris and Lewis [
34] suggested the ratio between NO
3 and TP as an appropriate measure of N
versus P-limitation. In lakes with a DIN:TP-ratio <9 (molar ratio), phytoplankton would be stimulated by additions of both N and P, while at ratios <2, there was a strict N-limitation. Based on combinations of nutrient bioassays and lake data, Bergström [
35] suggested a transition from N to P limitation when DIN:TP mass ratios increased from 1.5 to 3.4, which is in good accordance with previous studies [
34]. Based on the tested dataset, a majority of lakes were in fact found to be primarily N-limited, and a transition from N to P-limitation was strongly affected by N-deposition.
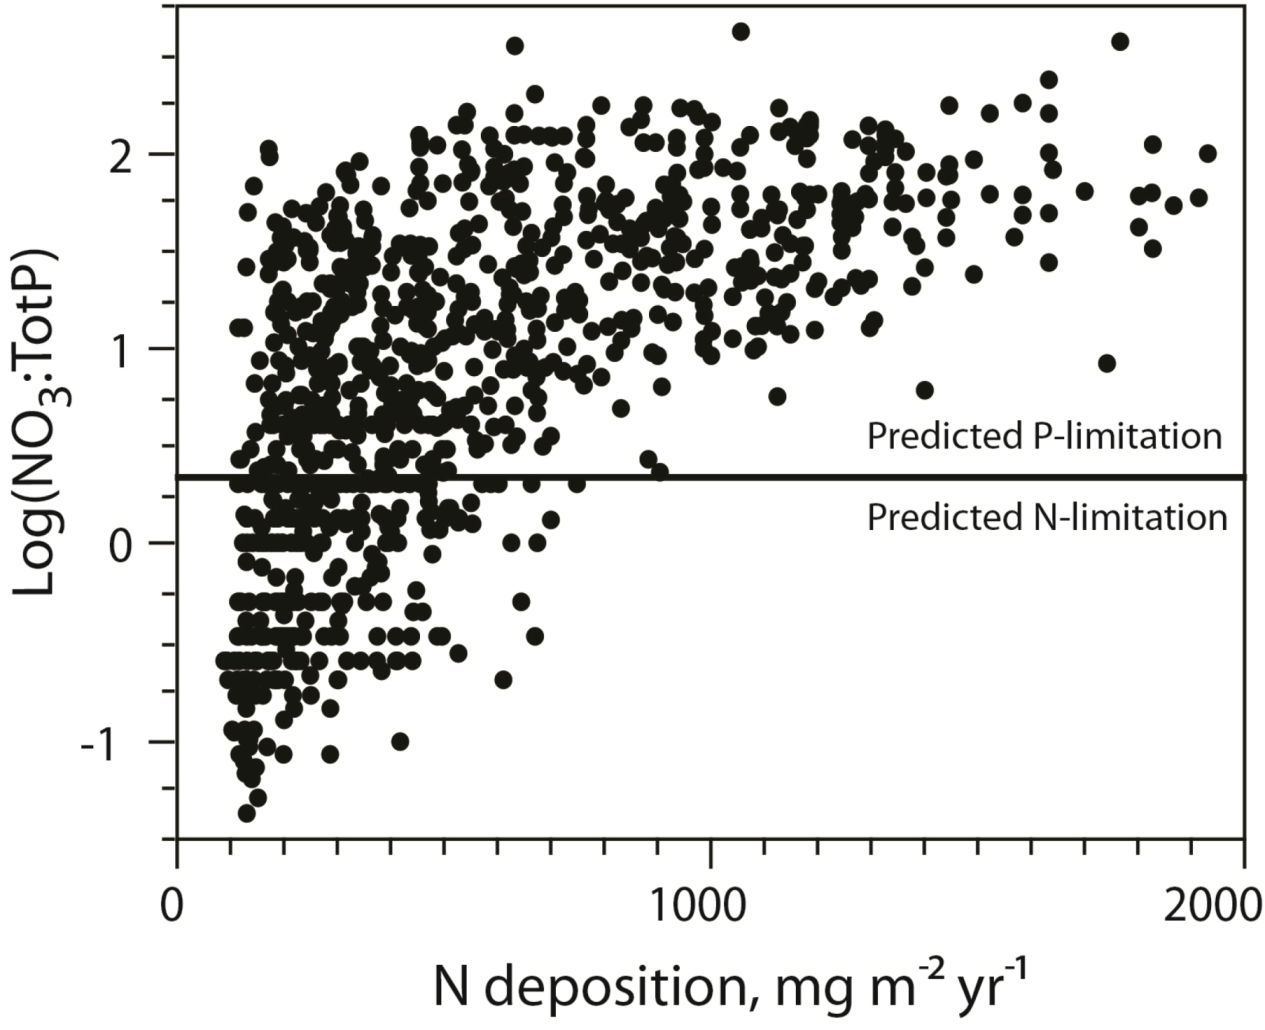
A survey of nearly 1000 Norwegian lakes revealed a 2700-fold range in the NO
3:TP ratio [
19]. According to the threshold suggested by Bergström [
34] for lakes in the same Nordic region, autotroph P-limitation is prevailing in the majority of these lakes, yet with a strong relationship to N-deposition.
I.e., the lakes receiving low N-deposition was most likely of being N-limited (
Figure 4). This also suggests that a large number of lakes actually would be co-limited by N and P, and that there indeed is a delicate balance between N and P-limitation for many systems. This is in support of the study of Elser
et al. [
36] who in a literature review of 62 nutrient limitation studies in lakes, found that in 82% of these the largest growth stimulation was found when both N and P was added, which again in backed up with later studies including a large range of ecosystems [
5,
37,
38].
An essential implication from these studies is that elevated N-deposition not only increases concentrations of DIN in lakes, but also may shift between N and P-limitation or eventually cause intensified P-limitation in surface waters. This was clearly demonstrated in a recent Swedish study [
16]. Based on regional differences in N-deposition, a pronounced increase in chlorophyll yield per unit P coincided with increased deposition of inorganic N. This was further addressed in a large scale survey [
17] of lakes receiving high and low N-deposition in US (Colorado), Sweden and Norway, and for all these regions the findings of Bergström [
16] was confirmed by bioassays where the phytoplankton growth responses was assessed in response of DIN and PO
4 additions; regions with elevated N-deposition responded more to P-additions indicative of P-limitations while vise versa for regions receiving low atmospheric N-depositions. The conclusion from this is twofold; elevated DIN-deposition may in fact shift from N to P-limitation in lakes, and a large number of lakes primary producers are actually co-limited by N or P or by N alone. This means that additional N-inputs indeed could affect productivity of lakes, but could it really cause eutrophication?
Figure 4.
The relationship between NO
3:TP and DIN-deposition and the potential shift from N to P-limitation of aquatic autotrophs (following [
35]). See [
19] for details on data.
Figure 4.
The relationship between NO
3:TP and DIN-deposition and the potential shift from N to P-limitation of aquatic autotrophs (following [
35]). See [
19] for details on data.
4. N-Deposition and Lake Productivity
Recent works have demonstrated that primary production in lakes respond much more to N and P combined than to P alone [
16,
17], that growth of lake autotrophs may be stimulated by DIN-inputs [
39,
40] and that the generally held view that P alone was determining primary production in lakes [
4] should be replaced by a literally more balanced view [
41,
42].
The increased focus on inorganic N as a contributor to plant growth also in lakes has raised a quite heated debate on the role of N
vs. P in lake eutrophication [
43]. It has been argued [
43] that by focusing on N, or N and P combined, rather than P alone as a source of eutrophication, there is a risk of wasting large amounts of money on reducing N inputs to lakes without any significant effect on eutrophication status. This is probably true for agriculturally dominated catchments where reductions of N generally both are more costly and less efficient in terms of reduced algal production and biomass. However in the case of the largely pristine catchment over the vast boreal, subalpine or alpine areas, both the sources and effects of increased inputs of DIN are quite different, not the least because the background levels of P often are very low and thus, as we have seen, the major effect of elevated DIN-deposition rather is an intensified P-limitation or a shift in nutrient limitations for aquatic autotrophs from N to P [
17,
40,
44]. Hence, the role of DIN-inputs for elevated productivity and biomass of autotrophs in lakes is principally restricted to the lakes in the N-limited area (e.g., below the vertical line of
Figure 4). The mean concentration of total P in these lakes is 5.5 µg P l
−1 (and PO
4 is generally below detection limits), hence only a modest increase in primary production can be promoted by elevated inputs of DIN since further production is constrained by P.
Autotrophs generally have non-homeostatic regulation,
i.e., their elemental content should to a large extent reflect ambient, available nutrient concentrations and ratios. The canonical Redfield ratio of C:N:P = 106:16:1 (by atoms) or 41:17.2:1 (by weight) is often assumed to represent balanced growth in phytoplankton. This means that under strict P-limitation, for every extra µg of P a plant mass of 41 µg C can in theory be built, representing some 1.4 mg wet weight (WW) (assuming 35% C of DW, and a dry weight equaling 10% of WW). For per µg of N, however, the corresponding extra plant mass produced under strict N-limitation would be no more than 95 µg WW. There is however a general difference in elemental ratios between phytoplankton and aquatic macrophytes that could yield different responses and biomasses in these two major groups. A compilation of data from Duarte [
45] gave on the average a C:P (by atoms) in phytoplankton of 77, for freshwater angiosperms 339, while for macroalgae 641. Corresponding ratios for C:N was 7, 18 and 15 respectively. This implies that a significantly higher biomass of benthic plants can be produced per amount of extra N or P, which may explain why increased growth of benthic algae has been linked with elevated DIN-deposition in pristine areas [
46], while no strong effects on phytoplankton have been detected.
Some macrophytes have truly extreme elemental ratios, and the “nuisance” species
Juncus bulbosus that has expanded its distribution and stands over vast areas in Northern Europe that receives elevated N-deposition has C:P and C:N-ratios of 1067 and 33 respectively, which could indicate than DIN-inputs or shifts in nutrient regimes could be a driver for the observed expansion [
47]. Thus for truly C-rich plants like
Juncus, a strong increase in mass could result from modest enrichments of DIN (and even more for P). By and large, however, strong responses to N or P alone is not to be expected, and the biochemical explanation for the tight response linkage between N and P lies in the protein synthesis where the highly P-demanding ribosomes is the very unit for producing the N-rich proteins that translates to growth rate [
48].
In general, increased productivity or biomass of plants would be assumed to stimulate production also of higher trophic levels.
I.e., herbivores would have access to more plant matter. Also elevated concentrations of N could increase the specific N-content of plants and thus improve the food quality for herbivores. Paradoxically however, it has been suggested that elevated inputs of DIN in oligotrophic systems could negatively impact grazers due to intensified P-limitation of autotrophs. This may yield elevated C:P-ratios and subsequently reduced growth in zooplankton consumers which suffer from dietary P-constraints [
18]. As herbivores usually have much lower C:N and C:P ratios than their food sources [
48,
49,
50,
51] they can suffer “quality starvation” if feeding on stoichiometrically unfavourable food (
i.e., high C to P and N), even when food is abundant [
48], and under food scarcity high C:P-ratios may pose an extra stress to herbivores. By comparing C:P-ratios in seston, the fine particulate pelagic matter including algae that zooplankton feed on, Elser
et al. [
18] recorded remarkably higher C:P ratios in lakes receiving high DIN deposition relative to those receiving low DIN-deposition. This response was related to intensified P-limitation of autotrophs, and this in turn was correlated with a strong increase in alkaline phosphatase activity as a sign of P-deficiency in the key herbivore
Daphnia. If this effects really holds true, it implies that not only may the productivity of key pelagic herbivores like
Daphnia as well as zoobenthos [
51,
52,
53] be affected, but that this negative impact will affect higher trophic levels like fish. This in turn would also affect community production and composition of both autotrophs and heterotrophs since different herbivores have different dietary requirements for N and P, and also excrete N:P in different proportions [
48].
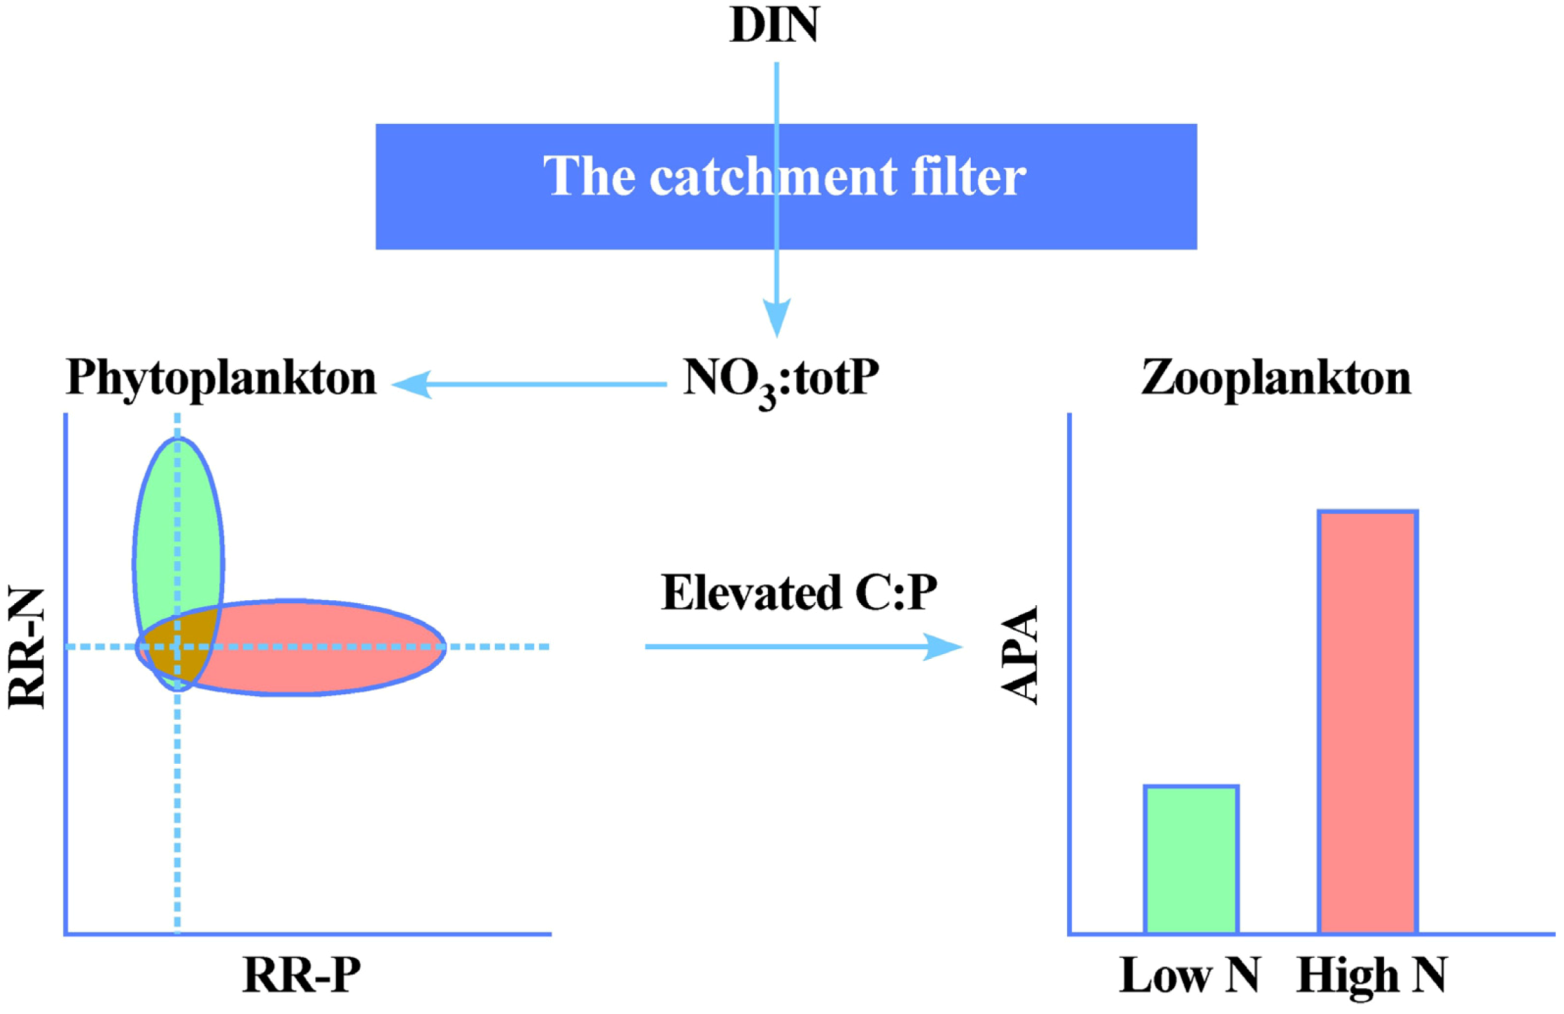
Thus the effects of DIN-deposition on lake stoichiometry and productivity can be summarized as in
Figure 5. The magnitude of DIN-deposition will in itself be a major determinant of the responses, yet these inputs are literally filtered and transformed by the catchment properties to yield different NO
3:TP-ratios as indicative of relative N
vs. P-limitation. In the case of high DIN-inputs and modest terrestrial N-retention, the effect is seen as a transition from N to (even more) P-limited systems. This again may have strong bearings not only of autotroph community composition, but also have quality effects up the trophic ladder. Thus the strongly increased emissions and thus depositions of DIN may be seen as a global N-fertilization experiment that have a multitude of effects, some positive (e.g., increased C-sequestration), and some negative (increased eutrophication, increased emissions of N
2O). For pristine freshwater systems, a modest increase in productivity especially of macrophytes may be the most visible results, but no major eutrophication effects will take place, unless the elevated N-inputs are accompanied by increased inputs of P. Again, it is finally worth stressing the vital role of catchment effects and properties in this context. In fact, if elevated DIN-inputs promote forest growth and thus increased uptake of inorganic P, the net effect for could somewhat counterintuitively be reduced productivity of downstream lakes. Since the elevated DIN-deposition will play in concert with climate change in the years to come, which again will affect catchment properties and element export [
54], increased focus on the catchment-lake connections and the use of lakes as “sentinels” [
21,
22] of terrestrial changes in DOC and nutrient cycling will become increasingly relevant.
Figure 5.
The potential effects of DIN-deposition and catchment on autotroph nutrient limitation and grazer P-limitation in lakes receiving low (green) and high (red) DIN-deposition. The NO
3:TP ratio reflects DIN-inputs and catchment properties and processes, and will determine whether phytoplankton displays a positive relative response towards single nutrient additions in bioassays, either N-addition (RR-N > 1), or P-addition (RR-P > 1) (Modified from [
17]). Intensified P-limitation will cause reduced food quality for grazers in terms of elevated C:P-ratios in their phytoplankton food, which is manifested as elevated alkaline phosphatase activity (APA) (modified from [
18]).


