5.1. Major Ion Composition
In addition to two well parameters (approximate horizontal flow path distance,
x, and depth to the top of the screened interval,
z), concentrations of the major cations (Na
+, K
+, Ca
2+ and Mg
2+) and anions (Cl
−, alkalinity (as CaCO
3), and SO
42−), dissolved oxygen (DO), as well as Ba, B, and Sr are presented in
Table 1. The DO concentration, which can be a useful proxy for oxidation effects during sampling of reduced groundwater, ranged between <0.1 to 2.6 mg L
−1. Of the 30 samples that were measured for DO, only one sample (LWEB-4) was slightly above a “hypoxic” condition. While most chloride concentrations of native groundwater did not exceed 35 mg L
−1 in the Lower aquifer systems, some wells close to the coast had historic Cl
− values as high as 90 mg L
−1.
Table 2 lists summary parameters and descriptions of well waters. Water levels of many of these near-shore wells increased in response to sustained freshwater injection, yet a concomitant decrease in Cl
− values is not always observed [
41]. For example, elevated Cl
− concentrations have been measured in several Upper and Lower aquifer system wells east of the Dominguez Gap Barrier Project; Long Beach 3 and Long Beach 4. In water from the wells, the Na
+ concentration varied between 39 (Huntington Park #1) and 10,800 mg L
−1, while the Cl
− concentration ranged from 18.5 to 19,900 mg L
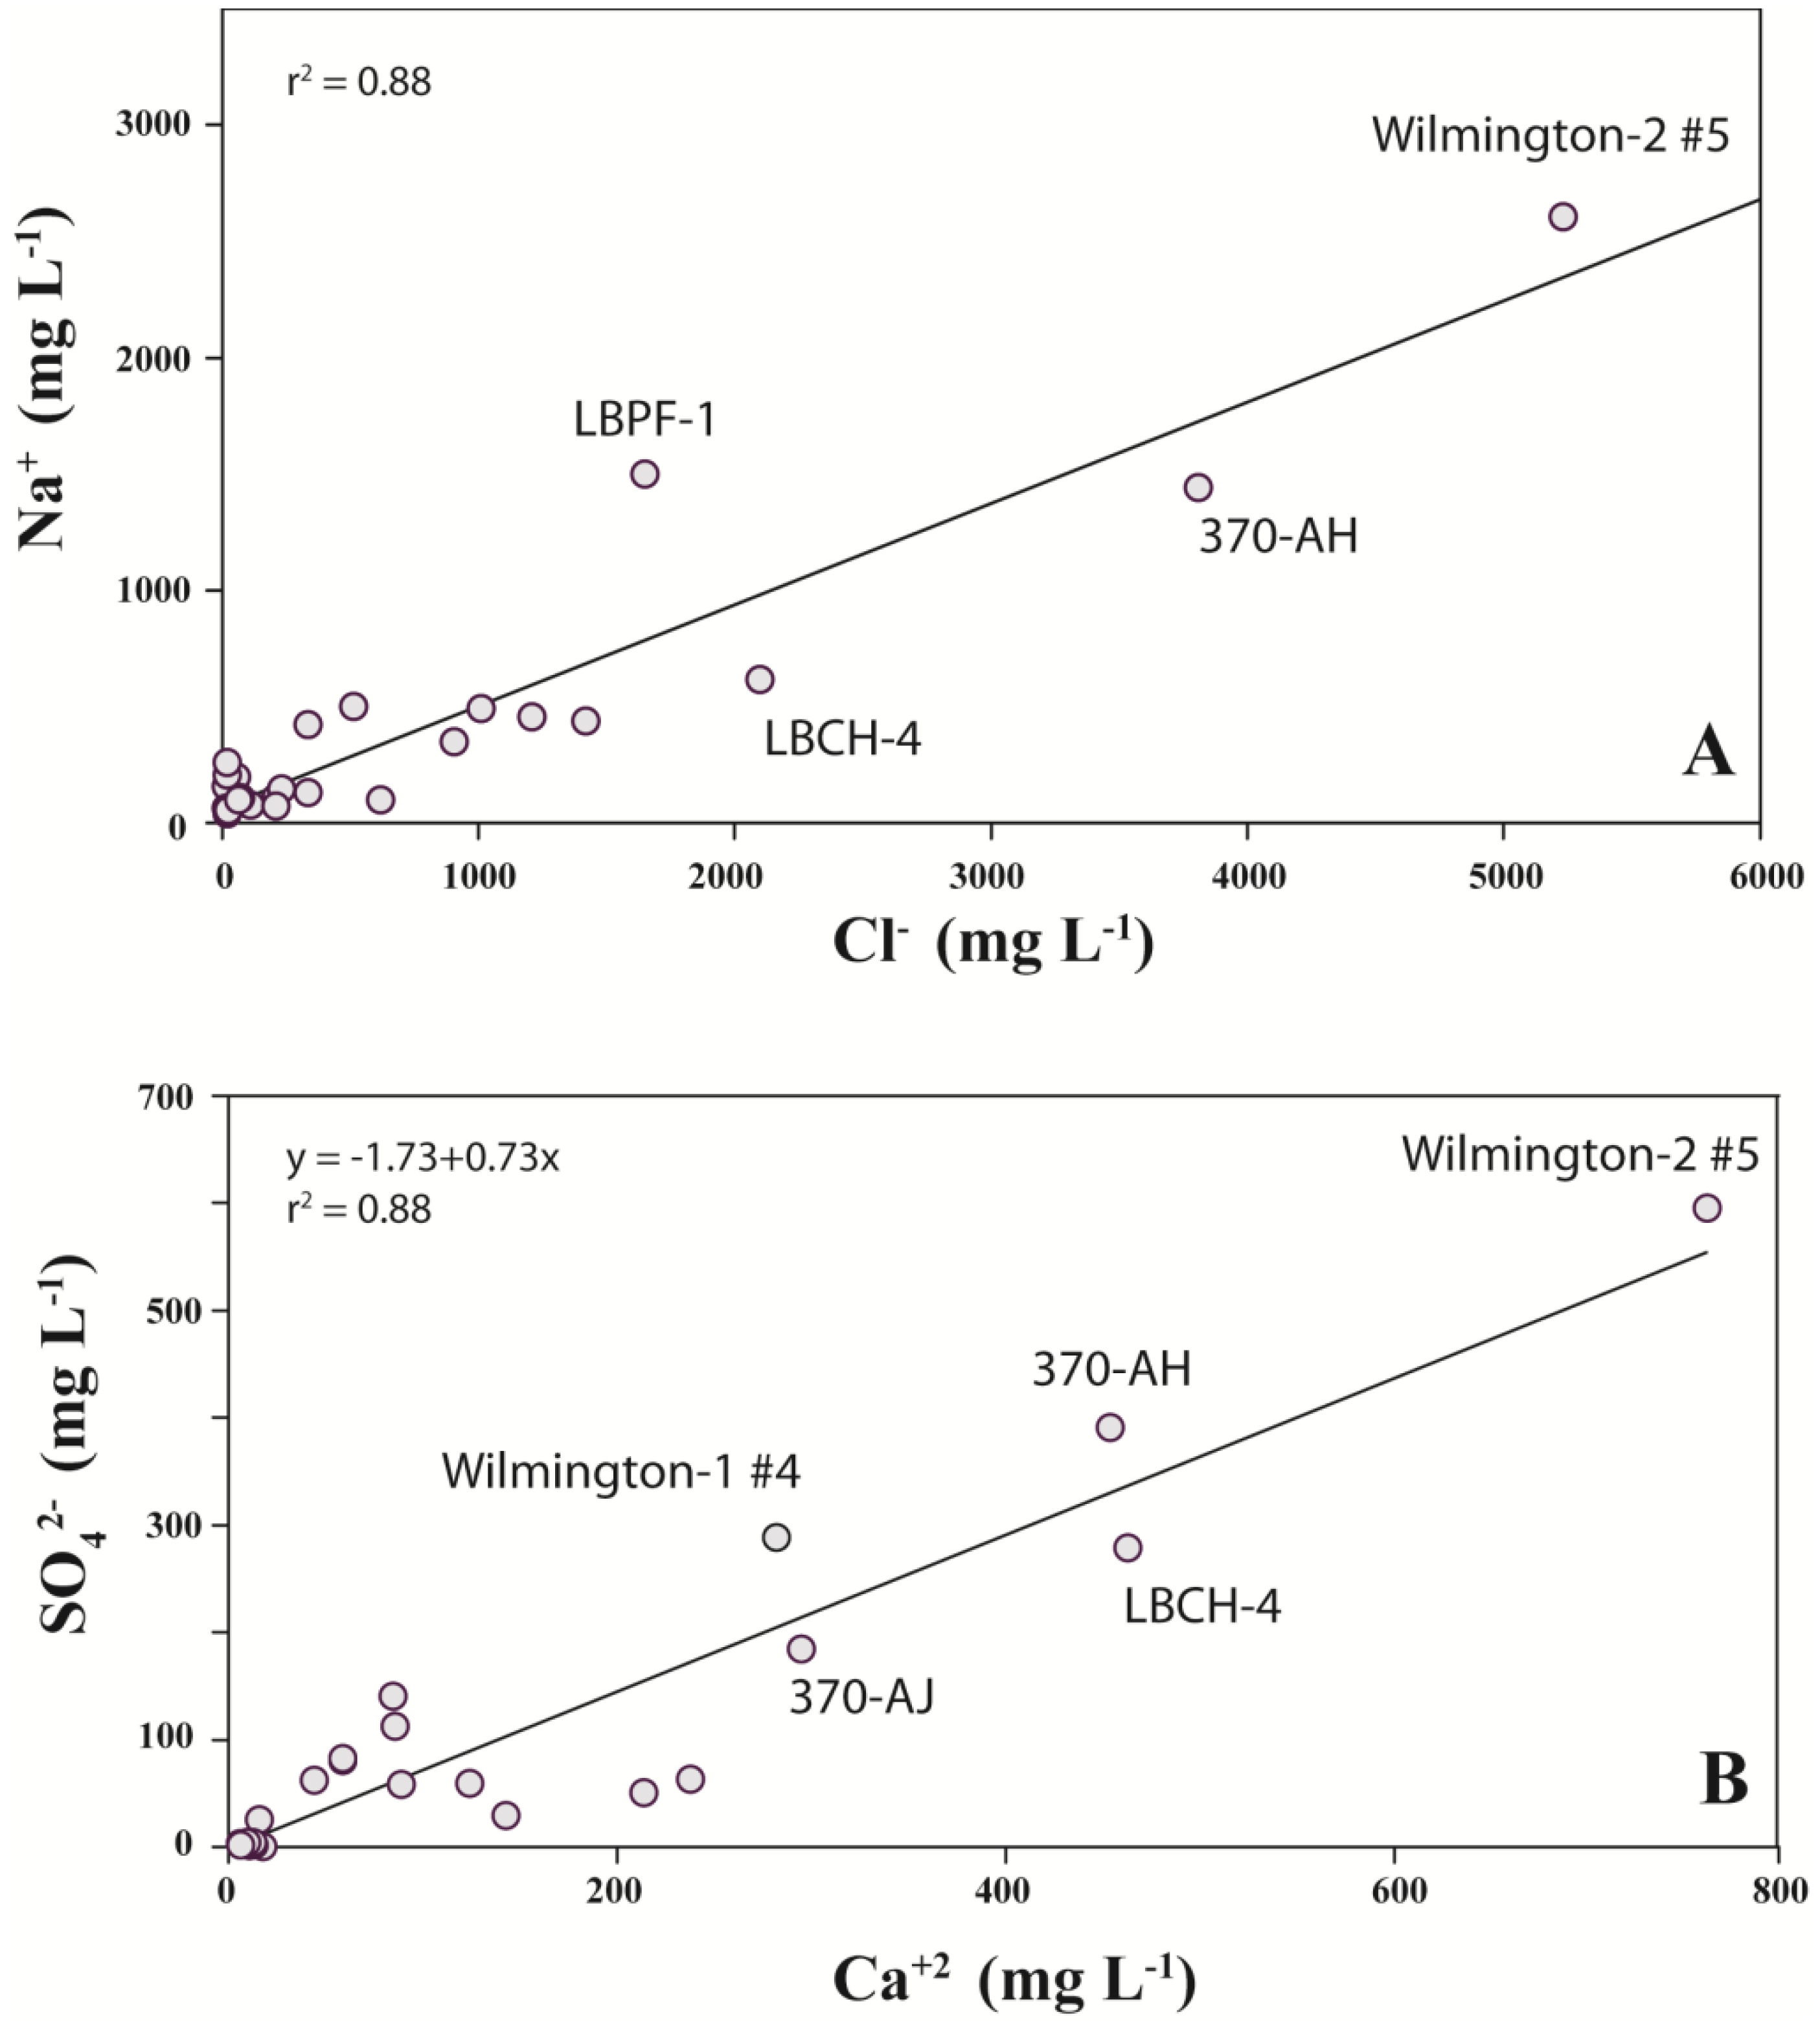
−1 (seawater-like value observed at LBPF-2). Excluding LBPF-2 as groundwater here consist mostly of seawater, a plot of Cl
− as a function of Na
+ (
Figure 3A) illustrates that many of the wells are variably influenced by elevated Cl
− concentrations. There is an expected [
41] strong positive correlation (
R2 = 0.88) between SO
42− and Ca
2+ concentrations (
Figure 3B). Extensive SO
42− reduction and cation exchange reactions result in most native groundwater within the study area having a characteristic Ca/Na-bicarbonate to Na-bicarbonate composition with very low Cl
− concentrations, <65 mg L
−1 [
6,
42]. Non-native water typically exhibits a dominant Ca/Na-sulfate composition, while wells intruded by seawater or mixed with oil-field brines have a Na-Cl composition [
6]. As many Tertiary brine fluids are also defined by a high Na-Cl composition, it is not easy to separate these from seawater-intruded waters (e.g., Wilmington-2 #2). See
Table 2 for a summary of characteristic geochemical parameters that define these well waters as well as recent trends in water quality.
Table 1.
Select well characteristics and water quality data for wells sampled. Well location for all but Huntington Park sites shown in
Figure 1. The Huntington Park site is located in a recharge area of the adjacent Central Basin, near downtown Los Angeles [
6].
Table 1.
Select well characteristics and water quality data for wells sampled. Well location for all but Huntington Park sites shown in Figure 1. The Huntington Park site is located in a recharge area of the adjacent Central Basin, near downtown Los Angeles [6].
| Well ID | x 1 | z 2 | DO 3 | Ca2+ | Mg2+ | K+ | Na+ | Alk. 4 | Cl- | SO42- | Ba | B | Sr |
|---|
| km | m | mg L−1 | mg L−1 | mg L−1 | mg L−1 | mg L−1 | mg L−1 | mg L−1 | mg L−1 | µg L−1 | µg L−1 | µg L−1 |
|---|
| Huntington Park #1 (4/9/1997) | 0.0 | 271 | 0.2 | 59 | 14 | 3 | 39 | 168 | 21 | 80 | 58 | 132 | 451 |
| Huntington Park #2 (4/10/1997) | 0.0 | 210 | 0.5 | 59 | 14 | 3 | 40 | 178 | 22 | 82 | 70 | 133 | 470 |
| Carson-1 #1 (1/6/1998) | 16.7 | 279 | <0.1 | 19 | 4 | 3 | 51 | 141 | 20 | <0.1 | 12 | 96 | 185 |
| Carson-1 #2 (1/5/1998) | 16.7 | 238 | 0.2 | 32 | 7 | 2 | 42 | 169 | 21 | <0.1 | 39 | 102 | 369 |
| Carson-1 #3 (1/6/1998) | 16.7 | 168 | 0.2 | 44 | 12 | 3 | 47 | 164 | 23 | 62 | 58 | 105 | 398 |
| Carson-1 #4 (1/6/1998) | 16.7 | 69 | 0.2 | 86 | 21 | 4 | 74 | 204 | 112 | 112 | 199 | 117 | 835 |
| Wilmington-1 #1 (4/24/1999) | 20.8 | 279 | 0.1 | 50 | 16 | 7 | 106 | 134 | 213 | <0.1 | 12 | 123 | 371 |
| Wilmington-1 #2 (4/25/1999) | 20.8 | 238 | 0.2 | 124 | 27 | 6 | 130 | 135 | 337 | 59 | 11 | 175 | 1,153 |
| Wilmington-1 #3 (4/25/1999) | 20.8 | 168 | <0.2 | 214 | 47 | 9 | 346 | 173 | 907 | 50 | 27 | 240 | 2,129 |
| Wilmington-1 #4 (4/25/1999) | 20.8 | 69 | 0.1 | 282 | 96 | 13 | 457 | 142 | 1,209 | 288 | 121 | 221 | 3,688 |
| Wilmington-1 #5 (4/24/1999) | 20.8 | 37 | <0.2 | 85 | 31 | 7 | 145 | 197 | 233 | 140 | 103 | 203 | 1,089 |
| Wilmington-2 #1 (4/21/1999) | 23.0 | 290 | <0.1 | 3 | 2 | 5 | 195 | 377 | 56 | <0.1 | 7 | 653 | 39 |
| Wilmington-2 #2 (2/18/1999) | 23.0 | 230 | <0.1 | 35 | 24 | 13 | 499 | 450 | 513 | <0.1 | 57 | 1,578 | 407 |
| Wilmington-2 #3 (2/21/1999) | 23.0 | 165 | <0.1 | 20 | 7 | 4 | 102 | 180 | 72 | <0.1 | 23 | 266 | 177 |
| Wilmington-2 #4 (4/21/1999) | 23.0 | 119 | <0.1 | 143 | 67 | 16 | 492 | 308 | 1,012 | 29 | 117 | 557 | 1,266 |
| Wilmington-2 #5 (2/18/1999) | 23.0 | 37 | <0.1 | 761 | 363 | 31 | 2,604 | 202 | 5,232 | 595 | 162 | 732 | 6,905 |
| LWEB-1 (3/29/2001) | 19.0 | 411 | 0.1 | 11 | 3.47 | 3.8 | 156 | 392 | 18.5 | 1 | 8.7 | 372 | 120 |
| LWEB-2 (3/29/2001) | 19.0 | 304 | 0.2 | 15.9 | 2.73 | 2.5 | 61.5 | 144 | 18.8 | 25.3 | 10 | 138 | 191 |
| LWEB-3 (3/28/2001) | 19.0 | 204 | 0.4 | 17.9 | 3.24 | 2.7 | 55.8 | 159 | 24.8 | 0.2 | 13 | 132 | 226 |
| LWEB-4 (3/27/2001) | 19.0 | 162 | 2.6 | 88.8 | 24 | 6.2 | 72.9 | 139 | 213 | 57.9 | 31 | 109 | 962 |
| LWEB-5 (3/26/2001) | 19.0 | 125 | 0.2 | 238 | 57.3 | 7.8 | 98.6 | 148 | 619 | 62.7 | 109 | 110 | 2,530 |
| LBCH-1 (8/27/2003) | 21.4 | 360 | <0.1 | 6.2 | 3.03 | 4.8 | 206 | 503 | 22.9 | 3 | 6.3 | 785 | 77.2 |
| LBCH-2 (8/26/2003) | 21.4 | 198 | 0.1 | 13.5 | 4.08 | 3.5 | 107 | 181 | 74.4 | 1.2 | 4.6 | 238 | 171 |
| LBCH-3 (8/26/2003) | 21.4 | 143 | <0.1 | 12.8 | 4.43 | 3.2 | 97.1 | 177 | 67.6 | 4 | 3.5 | 223 | 185 |
| LBCH-4 (8/25/2003) | 21.4 | 110 | 0.2 | 463 | 174 | 21 | 615 | 145 | 2,100 | 278 | 113 | 419 | 4,860 |
| 370-AJ (6/08/2005) | 21.0 | 66 | - | 295 | 109 | 12 | 438 | 129 | 1,420 | 184 | 78 | 198 | 2,770 |
| 370-AH (6/08/2005) | 21.0 | 20 | - | 454 | 335 | 34 | 1,440 | 200 | 3,810 | 391 | 167 | 361 | 4,650 |
| LBPC-1 (4/03/2001) | 24.2 | 366 | <0.1 | 9.57 | 4.63 | 5.8 | 259 | 492 | 21.4 | 3.6 | 15 | 1,100 | 134 |
| LBPC-2 (4/04/2001) | 24.2 | 244 | <0.1 | 6.55 | 7.18 | 11 | 422 | 614 | 337 | 1.4 | 17 | 1,150 | 97.5 |
| LBPF-1 (4/24/2002) | 27.0 | 332 | 0.1 | 17.8 | 30.5 | 26 | 1,500 | 1,230 | 1,650 | - | 127 | 8,400 | 734 |
| LBPF-2 (4/24/2002) | 27.0 | 102 | 0.1 | 519 | 1,220 | 272 | 10,800 | 289 | 19,900 | 2,640 | 82 | 4,130 | 8,500 |
Table 2.
Summary parameters and description of well water for this study.
Table 2.
Summary parameters and description of well water for this study.
| Well ID | Stratigraphic unit 1 | Chemical composition 2 | Change in chemical composition (1998–2011) 3 | Chloride range 4 | Stable isotope 5 | Relative age of water 6 | Comment |
|---|
| Huntington Park #1 | Bent Spring | Ca-HCO3 | unchanged | low | N | old | Native water of good quality; end member for flow system |
| Huntington Park #2 | Harbor | Ca-HCO3 | unchanged | low | N | old | Native water of good quality; end member for flow system |
| Carson-1 #1 | Upper Wilmington | Na-HCO3 | unchanged | low | N | old | Native water of good quality; source of recharge similar to Huntington Park |
| Carson-1 #2 | Upper Wilmington | Na/Ca-HCO3 | unchanged | low | N | old | Native water of good quality; source of recharge similar to Huntington Park |
| Carson-1 #3 | Harbor | Ca/Na-HCO3 | unchanged | low | N | old | Native water of good quality; source of recharge similar to Huntington Park |
| Carson-1 #4 | Pacific | Ca/Na-HCO3 | mixing | low | N | old | Gradual decrease in TDS since initial sampling; [Cl] from 210 to ~40 mg L−1 |
| Wilmington-1 #1 | Upper Wilmington | Na-Cl | unchanged | low | N | old | Possible enhanced lateral movement due to intense nearby pumping |
| Wilmington-1 #2 | Upper Wilmington | Ca/Na-Cl | mixing | medium | N | old | Possible enhanced lateral movement due to intense nearby pumping |
| Wilmington-1 #3 | Upper Wilmington | Na/Ca-Cl | mixing | medium | I-S-N | recent | Inland from Dominguez Gap Seawater Barrier Project; contains mixture of native water, seawater, and imported water from overlying unit |
| Wilmington-1 #4 | Harbor | Na-Cl | variable | medium | I | recent | Likely mixture of imported and seawater |
| Wilmington-1 #5 | Pacific | Ca/Na-Cl | variable | low | I | recent | Likely mixture of imported and seawater |
| Wilmington-2 #1 | Pliocene B | Na-HCO3 | variable | low | N | old | Isotopically light water recharged during Pleistocene |
| Wilmington-2 #2 | Pliocene A | Na-Cl | mixing | medium | S | old | Principally isotopic light water (similar to Wilm2 #1); localized saline unit attributed to partial mixing with an oil-field brine |
| Wilmington-2 #3 | Lower Wilmington | Na-Cl/HCO3 | variable | low | N | old | Native, fresh, sodium-bicarbonate water |
| Wilmington-2 #4 | Upper Wilmington | Na-Cl | mixing | medium | I-S-N | recent | Significant improvement in TDS likely a result of more effective injection; [Cl] decreased from ~1000 to 290 mg L−1 |
| Wilmington-2 #5 | Harbor | Na-Cl | mixing | high | S-I | recent | Some imported water is present, though masked by seawater intrusion. Significant improvement in TDS likely a result of more effective injection; [Cl] decreased from ~5200 to 2600 mg L−1 |
| LWEB-1 | Pliocene A | Na-HCO3 | unchanged | low | N | old | Isotopically light water recharged during Pleistocene |
| LWEB-2 | Upper Wilmington | Na-HCO3 | mixing | low | N | old | Geochemistry suggests subtle reactions or long-term pumping effects |
| LWEB-3 | Upper Wilmington | Na-HCO3 | variable | low | N | old | Native, fresh, sodium-bicarbonate water |
| LWEB-4 | Bent Spring | Ca-Cl | variable | low | N | old | Native, fresh, sodium-bicarbonate water |
| LWEB-5 | Harbor | Ca-Cl | variable | low | N | old | Native, fresh, sodium-bicarbonate water |
| LBCH-1 | Lower Wilmington | Na-HCO3 | unknown | low | N | old | Isotopically light water recharged during Pleistocene |
| LBCH-2 | Upper Wilmington | Na-HCO3 | unknown | low | N | old | Isotopically light water recharged during Pleistocene |
| LBCH-3 | Upper Wilmington | Na-HCO3 | unknown | low | N | old | Isotopically light water recharged during Pleistocene |
| LBCH-4 | Bent Spring | Na/Ca-Cl | unknown | low | N-S | recent | |
| 370-AJ | Harbor | Na/Ca-Cl | unknown | medium | N-S | recent | |
| 370-AH | Dominguez | Na-Cl | unknown | high | N-S | recent | |
| LBPC-1 | Pliocene B | Na-HCO3 | unknown | low | N | old | Isotopically light water recharged during Pleistocene |
| LBPC-2 | Pliocene A | Na-HCO3/Cl | unknown | medium | N | old | Isotopically light water recharged during Pleistocene |
| LBPF-1 | Pliocene A | Na-Cl/HCO3 | unknown | medium | N | old | Old seawater, distinct major ion composition and trace element ratios |
| LBPF-2 | Bent Spring | Na-Cl | unknown | high | S | old | Groundwater consisting mostly of seawater |
5.2. Tritium
The tritium data provide insight as to the relative age or “old”
versus “new” groundwater in our study. Tritium (
3H; t
1/2 = 12.4 years) is the only radioactive isotope of hydrogen and while it is naturally present only in minute (<<1%) quantities, it is also produced as a fission product in nuclear weapons tests and nuclear power reactors. The convention for reporting
3H concentrations is the tritium unit (TU), which equals 3.2 pCi L
−1 (7.104 dpm L
−1). As tritium is naturally incorporated into the water molecule and its abundance is only affected by radioactive decay,
3H serves as a useful tracer for identifying recently recharged water. A pre-fallout (pre-1952) background
3H abundance in southern California coastal precipitation was ~2 TU [
44]. Beginning in 1952,
3H was released into the atmosphere, reaching a maximum in 1963 [
45]. A reconstructed Los Angeles County precipitation tritium concentration curve [
6] identifies a narrow 1963 peak at ~700 TU that rapidly decreased to <100 TU by 1970. As a consequence, without consideration for complex mixing scenarios, groundwater with a
3H value less than <1 TU may be considered “older” water that was recharged prior to 1952. Conversely, groundwater with a tritium content >1 TU can be interpreted as “recent” water being wholly or partially recharged post-1952. Along the coast, such interpretation may be more complicated as recent seawater may provide another source of tritium.
Figure 3.
(A) Chloride versus Na+ (except LBPF-2) and (B) SO42− versus Ca2+.
Figure 3.
(A) Chloride versus Na+ (except LBPF-2) and (B) SO42− versus Ca2+.
Of the 31 groundwater samples analyzed for tritium (average
3H value = 4.3 TU), seven samples had a
3H concentration >1 TU and of these, three had
3H >10 TU (
Table 3); each of these wells perforated the Pacific and Harbor sequences. The large number of low or less than measureable (0.1 TU) tritium values indicates that most sampled groundwater in the Dominguez Gap region appears to be older water (pre-1952). Notable exceptions include wells close to the coast (Wilmington-1 #4, Wilmington-1 #5, and Wilmington-2 #5) that are directly influenced by recent seawater intrusion and the seawater barrier injection wells that may introduce additional, substantial
3H as a result of complex mixing scenarios (
Table 2;
Figure 2).
Table 3.
Select stable and radiogenic isotope data for wells sampled in the study site. Note: pmc = percent modern carbon.
Table 3.
Select stable and radiogenic isotope data for wells sampled in the study site. Note: pmc = percent modern carbon.
| Well ID | δ18O | δD | 3H | δ13CDIC | 14C |
|---|
| (‰) | (‰) | (TU) | (‰) | (pmc) |
|---|
| Huntington Park #1 | −7.32 | −47.5 | <0.1 | −13.6 | 83.7 |
| Huntington Park #2 | −7.23 | −47.3 | <0.1 | −13.5 | 83.5 |
| Carson-1 #1 | −7.33 | −48.4 | 0.1 | −12.4 | 27.6 |
| Carson-1 #2 | −7.27 | −46.6 | <0.1 | −12.3 | 43.6 |
| Carson-1 #3 | −7.30 | −47.3 | <0.1 | −14.2 | 56.1 |
| Carson-1 #4 | −7.12 | −47.0 | 0.1 | - | - |
| Wilmington-1 #1 | −7.29 | −46.8 | <0.1 | −15.8 | 29.6 |
| Wilmington-1 #2 | −7.13 | −46.0 | <0.1 | −18.4 | 44.5 |
| Wilmington-1 #3 | −7.34 | −49.4 | 1.6 | - | - |
| Wilmington-1 #4 | −9.77 | −77.5 | 19 | - | - |
| Wilmington-1 #5 | −9.58 | −73.3 | 11.9 | - | - |
| Wilmington-2 #1 | −8.73 | −59.7 | <0.1 | −0.3 | 2.5 |
| Wilmington-2 #2 | −8.63 | −55.8 | <0.1 | −0.3 | 5.2 |
| Wilmington-2 #3 | −7.84 | −50.6 | <0.1 | −15.0 | 14.4 |
| Wilmington-2 #4 | −7.96 | −51.3 | 1.5 | - | - |
| Wilmington-2 #5 | −7.57 | −57.7 | 16.9 | - | - |
| LWEB-1 | −9.17 | −62.7 | <0.1 | 6.3 | 1.8 |
| LWEB-2 | −7.72 | −51.1 | 0.1 | −15.8 | 24.1 |
| LWEB-3 | −8.07 | −53.2 | <0.1 | −18.9 | 14.1 |
| LWEB-4 | −7.32 | −48.4 | <0.1 | −14.3 | 42.8 |
| LWEB-5 | −7.10 | −47.4 | <0.1 | −13.9 | 55.1 |
| LBCH-1 | −9.39 | −64.0 | <0.1 | 4.7 | 3.5 |
| LBCH-2 | −8.37 | −55.1 | 0.1 | −10.6 | 8.8 |
| LBCH-3 | −8.15 | −53.6 | <0.1 | −16.0 | 9.8 |
| LBCH-4 | −6.86 | −45.9 | 1.8 | −16.0 | 61.4 |
| 370-AJ | −7.12 | −49.9 | 1.1 | - | - |
| 370-AH | −6.76 | −47.3 | 0.9 | - | - |
| LBPC-1 | −9.23 | −61.1 | 0.2 | 3.1 | 2.5 |
| LBPC-2 | −7.54 | −49.2 | <0.1 | −12.7 | 4.3 |
| LBPF-1 | −7.47 | −47.1 | <0.1 | −6.4 | 0.8 |
| LBPF-2 | −0.42 | −3.65 | <0.1 | −12.3 | 48.5 |
5.3. Isotopic Composition of Oxygen (δ18O) and Hydrogen (δD)
The behavior of stable oxygen (δ
18O) and hydrogen (δD) isotopes in groundwater can provide insight into the geochemical character, origin, and transport phenomena of groundwater [
8]. Reporting convention for both isotopes is expressed in terms of relative difference, per mill (‰), from the Vienna Standard Mean Ocean Water (VSMOW) value. In general, the predominant source of precipitation is from evaporation of seawater, and as a result, the observed global composition of δ
18O and δD in rainwater is linearly expressed as the global meteoric water line (GMWL; δD = 8δ
18O + 10‰; [
46,
47]).
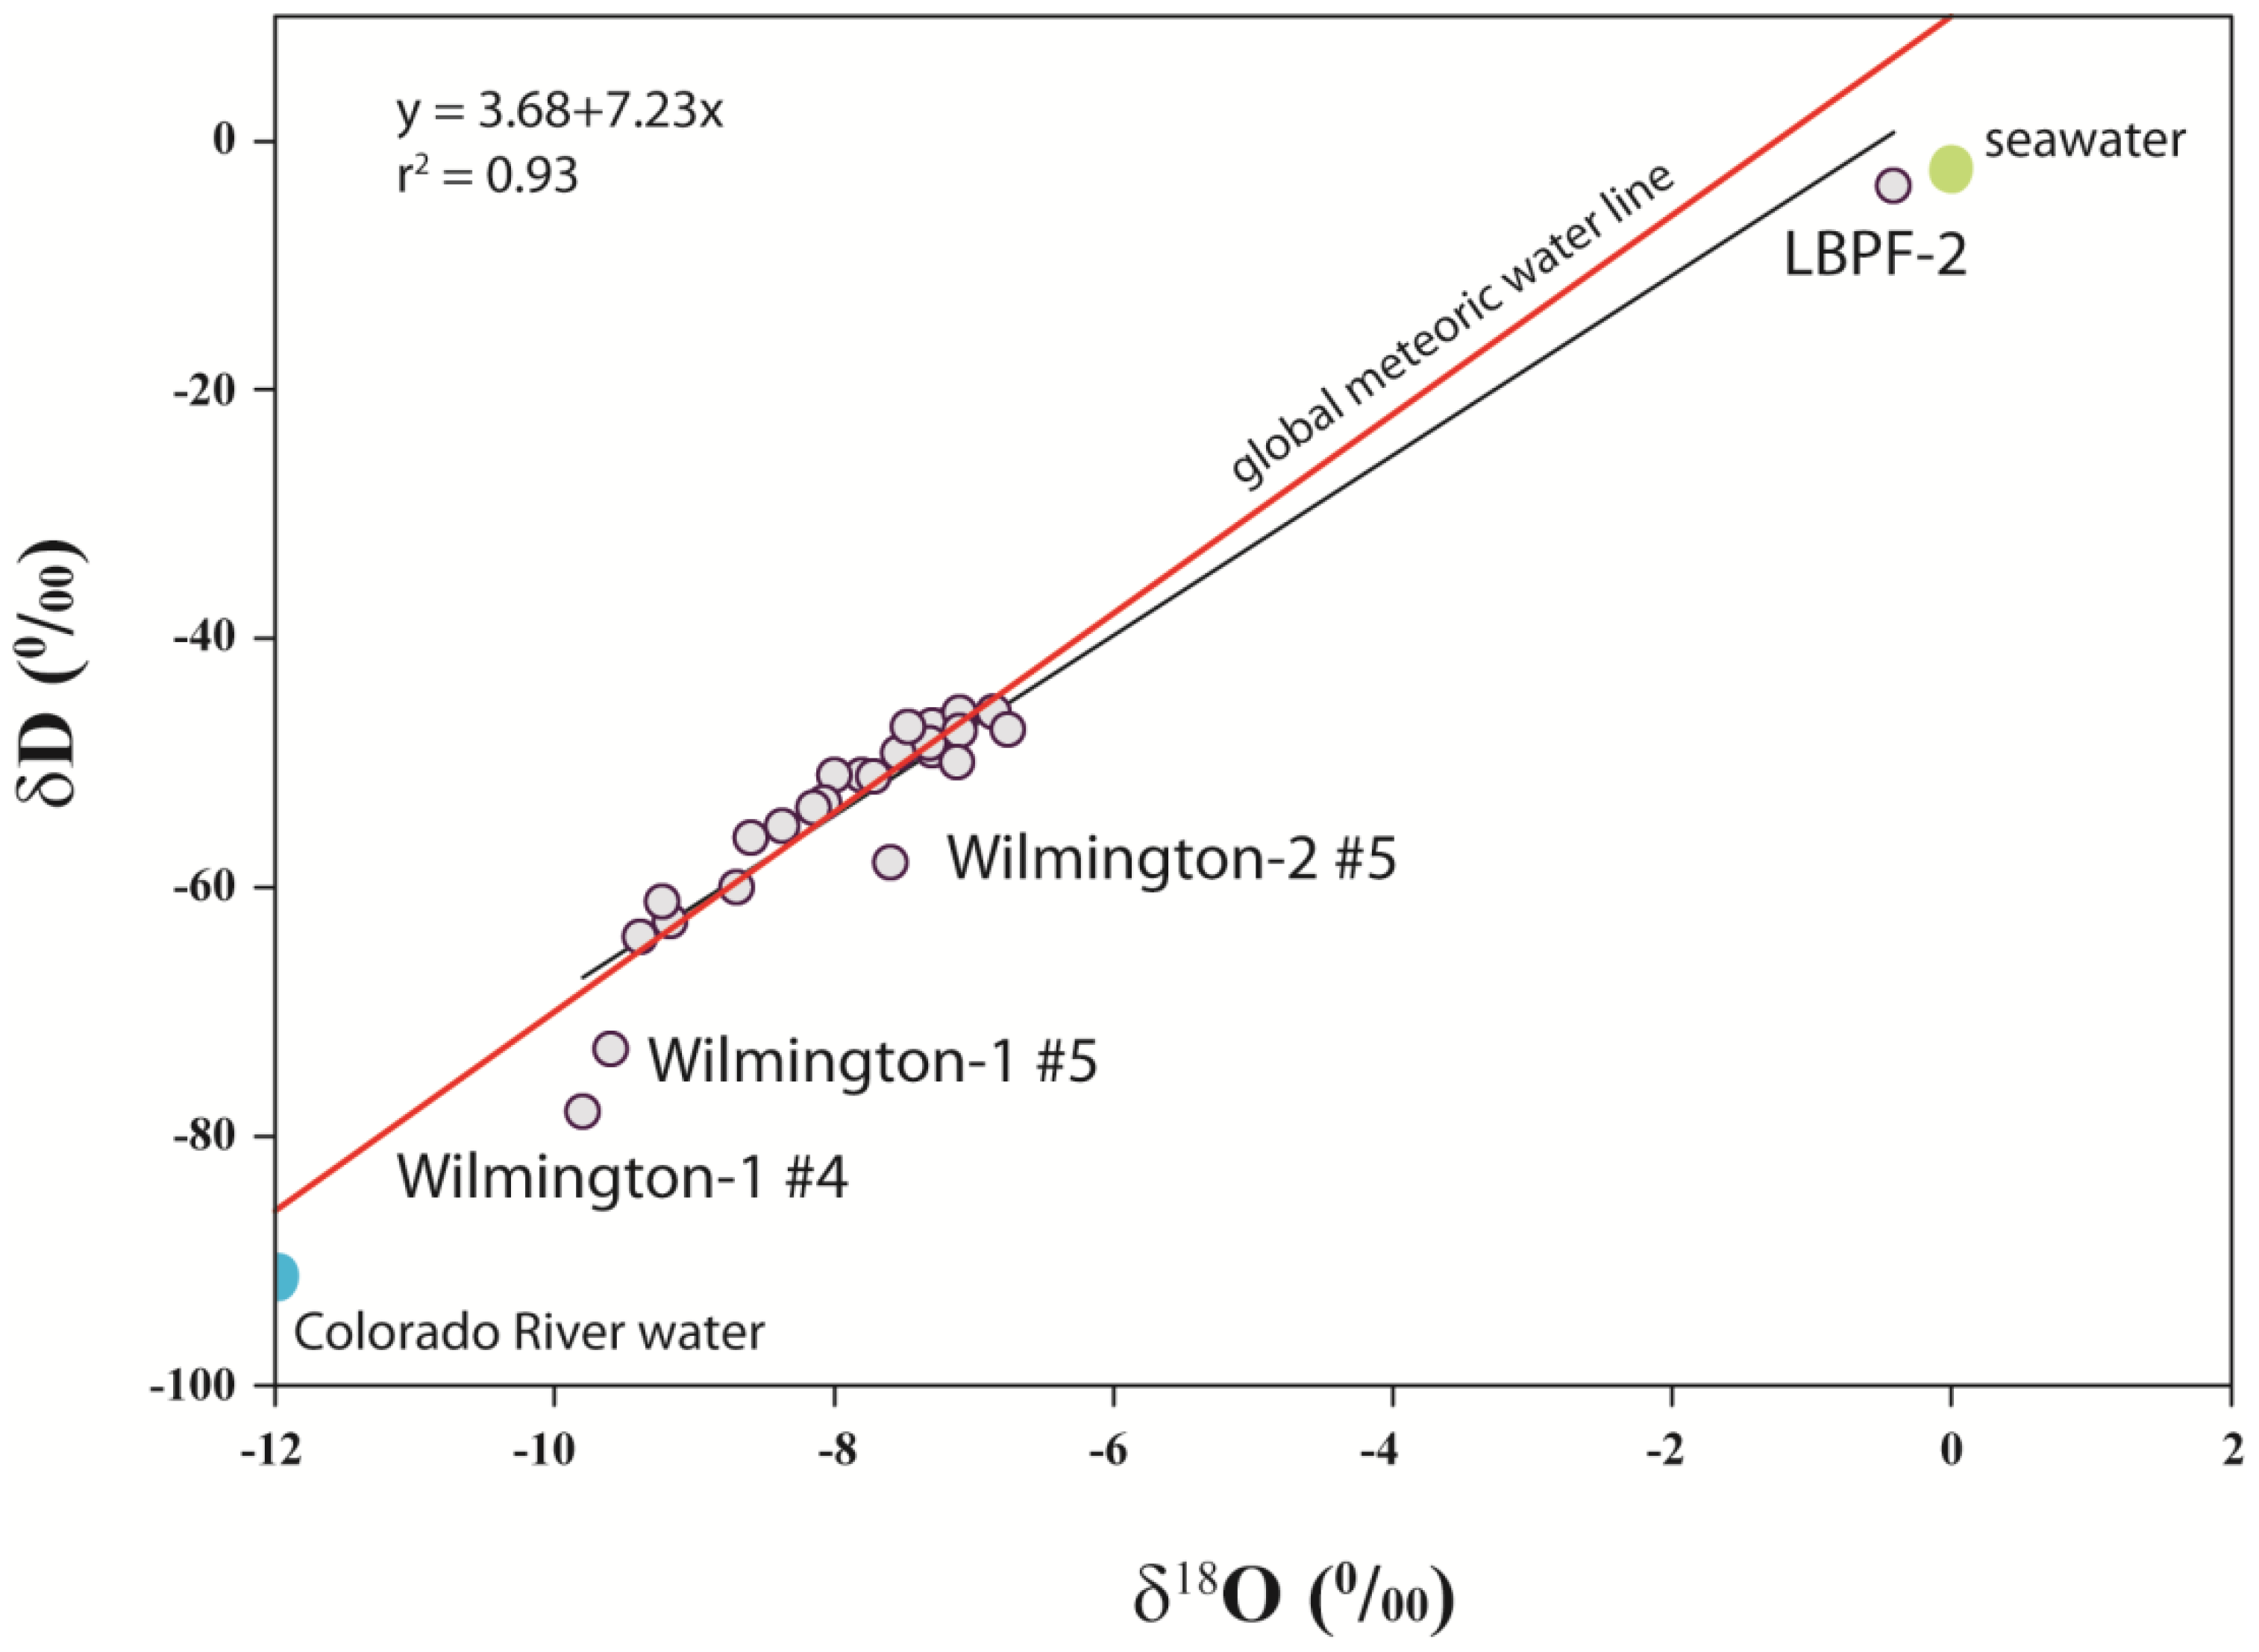
In the 31 groundwater samples, the δ
18O composition ranged from −0.42‰ (LBPF-2) to −9.77‰ (Wilmington-1#4), while the δD composition varied between −3.65‰ (LBPF-2) to −77.5‰ (Wilmington-1#4) (
Table 3). A plot of δD
versus δ
18O (
Figure 4) indicates a strong linear relationship (
R2 = 0.93), with a slope of 7.2—close to that of the global meteoric water line (GMWL; slope = 8). Notable exceptions of groundwater (
i.e., Wilmington-1#4; Wilmington-2 #5) that influence such a shift below the GMWL include isotopically heavier water that likely consists of a recent mixture of saline (e.g., seawater) and imported fresh water [
4]. Lighter δD values (<−50‰), observed in some groundwater samples (e.g., LBPF-1,2, Wilmington-1#1-3, Huntington Park 1,2, Carson-1#1-4, 370-AJ, 370-AH, LWEB-4,5) may identify older groundwater with a isotopically unique signature.
Figure 4.
δD versus δ18O in selected groundwater samples from the study area. The global meteoric water line is per Craig (1961). Regression results include all groundwater data. Water recharged from Los Angeles and Montebello Forebays has a δ18O signature of−7.5‰to−6.7‰and−9.5‰to−8.0‰, respectively, and is isotopically distinct from non-native, seawater, and oil-field brine values.
The composition of δD and δ
18O in precipitation may also be influenced by local air mass and vapor trajectories, changes in evaporation, and isotope exchange processes below the cloud base [
10,
47]. Thus, climatic variations may be recorded in the composition of δ
18O and δD in groundwater [
12]. In LBPF-2, where the Cl
− concentration approaches a seawater-like value (
Figure 4), both δ
18O and δD isotopic compositions are highly enriched (heavy) (−0.42‰ for δ
18O and δD for −3.65‰) compared to other well waters (−6.76 to −9.77‰ for δ
18O and −45.9 to −77.5‰ for δD). The isotopic composition of the well waters, coupled with the major ion chemistry, implies variable mixing with recent seawater. In addition, isotopically lighter water with low Cl
− content has also been attributed to Colorado River water [
6] that is used as a source of injection water at the barrier wells [
48]. Observed high Cl
− concentrations along with enriched δ
18O reveal non-native inputs from seawater and/or oil-field brines (
Table 2).
5.4. Isotopic Composition of δ13C in Dissolved Organic Carbon (DIC)
Dissolved inorganic carbon (DIC = [CO
2aq] + [HCO
3−] + [CO
32−]) is generally produced in groundwater by the dissolution of CO
2 during plant (
i.e., C
3 and/or C
4) respiration, the microbial decomposition of organic matter, and the direct dissolution of carbonate minerals [
49]. The composition of δ
13C, expressed as per mill (‰) relative to the VPDB (Vienna PeeDee Belemnite) standard, provides a useful tracer to assess the relative contribution of C from these various sources. Under an open CO
2 system, the groundwater δ
13C
DIC should approach ~9‰ by simple hydrolysis reactions of soil CO
2 alone [
7]. Conversely, if the groundwater is closed to soil CO
2, then the δ
13C
DIC should approach values of about −13‰. In groundwater that is strongly reducing and sulfate-poor [
50], the composition of δ
13C
DIC can increase to values in excess of 30‰ as a result of methanogenesis [
51]. Observed saturation calculations for portions of the study area, and elsewhere in the basin, indicate that calcite should precipitate.
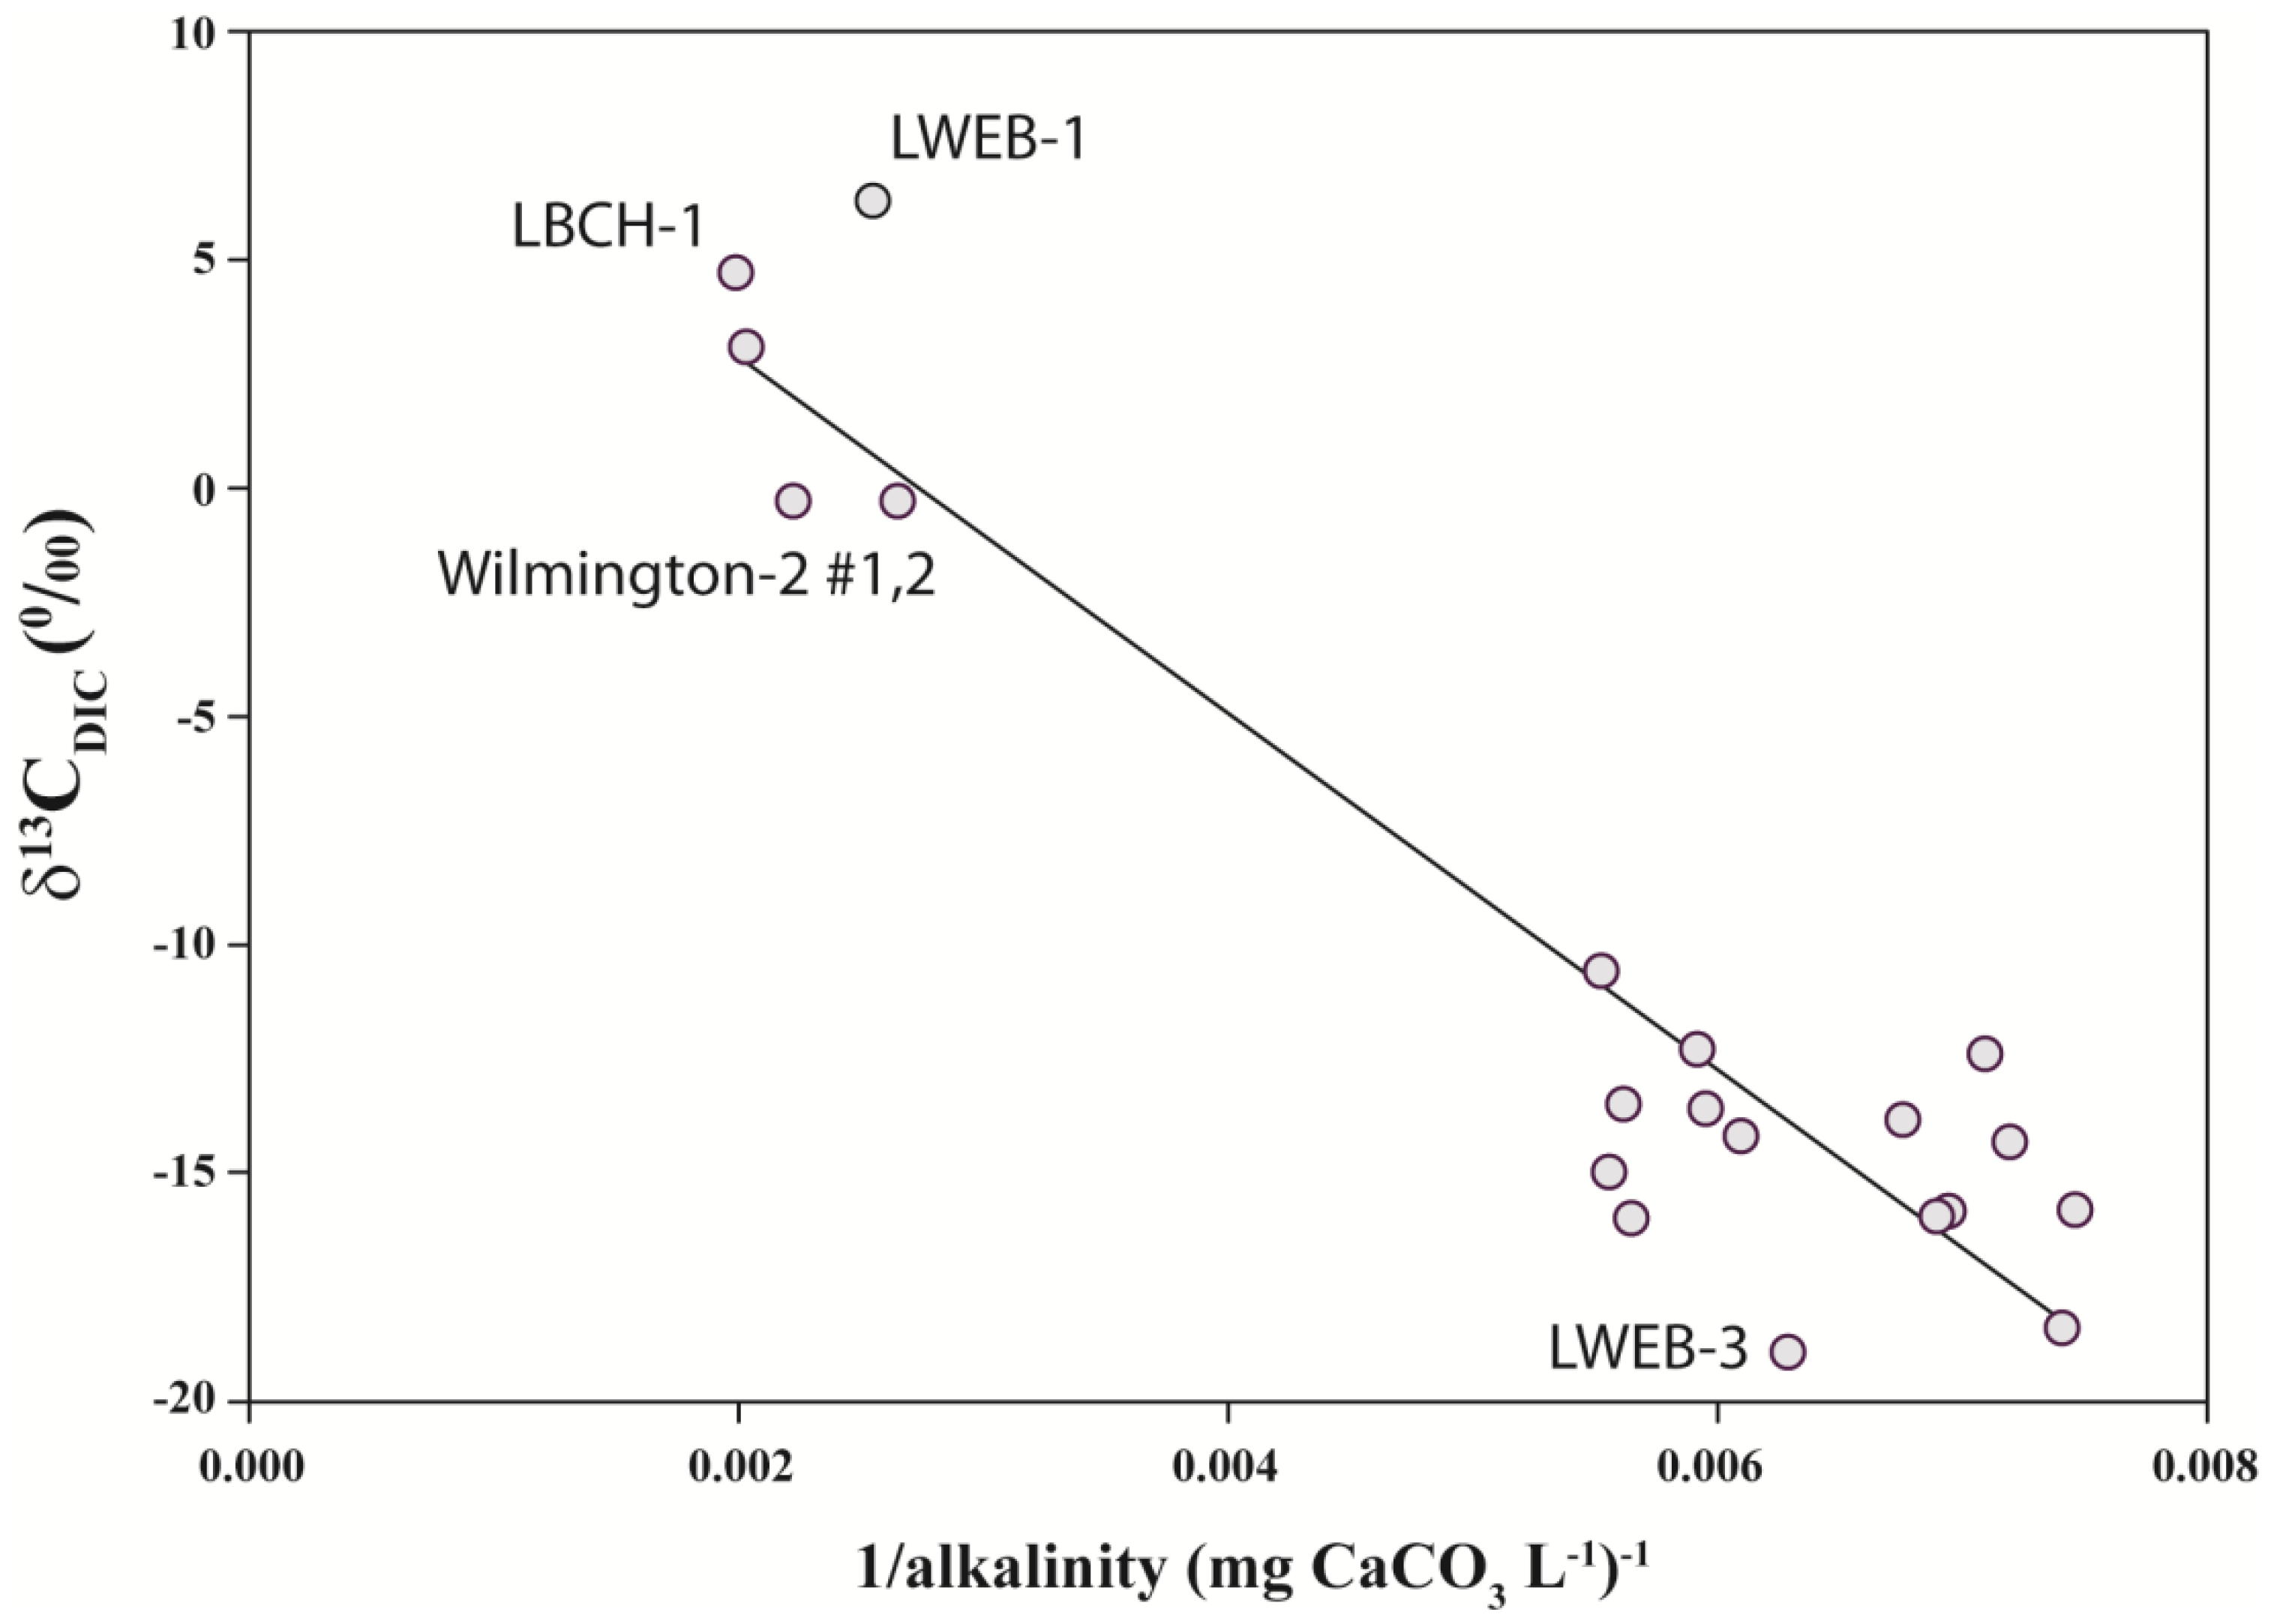
In this study, the groundwater δ
13C in dissolved inorganic carbon ranged from −18.9 (LWEB-3) to 6.3‰ (LWEB-1) (
Table 3), which reflects the contribution of different DIC sources and/or the evolution from an open to a closed system. Wells sampled for this study, with the exception of 370-AH and possibly Wilmington-1#5 appear to respond within a confined system. Three deep samples (LWEB-1, LBCH-1, LBPC-1) contain δ
13C
DIC values >0‰ and very little SO
42−, which would suggest a unique carbon source, such as from an incomplete bacterially-mediated methanogenic pathway [
52]. There have been a number of studies indicating a linear relationship between δ
13C
DIC and 1/dissolved inorganic carbon (DIC) [
49,
52,
53,
54,
55]. In lieu of direct dissolved inorganic carbon measurements alkalinity (expressed as CaCO
3) can serve as a proxy for DIC, under the condition that CO
2 remains constant [
56]. If one excludes values from wells closest to the coast and down-gradient from the PCH Fault (e.g., LBPC-2, LBPF-1,2) there is a good correlation (
R2 = 0.88) between δ
13C
DIC and 1/alkalinity (
Figure 5). Such a trend, which implies more than simple carbonate mineral dissolution, is expected in a complexly mixed coastal aquifer undergoing chemical evolution [
11,
13,
57].
Figure 5.
δ13CDIC versus 1/alkalinity (excluding wells closest to the coast; LBPC-2, LBPF1,2).
Figure 5.
δ13CDIC versus 1/alkalinity (excluding wells closest to the coast; LBPC-2, LBPF1,2).
5.5. Carbon-14 (14C)
To assess the relative age of select groundwater samples,
14C (
t½ = 5730 years) was also determined. Natural
14C is mainly produced in the atmosphere by interaction of cosmic ray derived secondary neutrons with
14N. Carbon-14 derived age results are often expressed as percent modern carbon
14C (pmc) by comparing the
14C activity of a sample to the known activity of an oxalic acid standard. Carbon-14 age data are generally interpreted within the context of a geochemical reactions/evolution model that can account for the various sources and sinks of carbon [
58].
In the Los Angeles County groundwater samples, the percent modern carbon (pmc) exhibited a wide range from 0.8 pmc (LBPF-1) to 83.7 pmc (Huntington Park #1) (
Table 3) with an average value of ~30 pmc. Assuming an initial
14C value of 90 pmc [
4], the corresponding groundwater age estimates may extend from recent to beyond 20 kyr before present and suggest that some well water undergoes deep circulation of native water through multiple aquifer systems. Age estimates, however, are not corrected for potential exchange reactions of carbon within the aquifer, and thus may not reflect the true age of the groundwater. The observed variations in the percentage of modern
14C indicate that the groundwater system is comprised of complex mixtures of diverse waters. A plot of δ
13C
DIC versus14C (
Figure 6) indicates that in samples with <10 pmc, δ
13C
DIC values fluctuated from −16‰ to +6‰, while in samples with >10 pmc, the δ
13C
DIC values ranged from −12‰ to −18‰. Select groundwaters (e.g., Wilmington 2-1, LWEB1,2, LBCH1-3, and LBPC1,2) that likely were recharged during Pleistocene, are also isotopically light. Nonetheless,
14C data confirm complex water mixing and transport scenarios involving multiple aquifer systems that reside within a tectonically active geologic framework.
Figure 6.
δ13CDIC versus percentage of modern 14C in groundwater samples from Los Angeles Basin.
Figure 6.
δ13CDIC versus percentage of modern 14C in groundwater samples from Los Angeles Basin.
5.7. Concentrations and Activity Ratios of 222Rn and Ra Isotopes
Ra isotopes can provide unique information regarding the production of U/Th series radionuclides in groundwater and reveal where significant transformations in adsorption or parent element distribution can occur along a groundwater flow path [
62,
63]. Values for Ra partitioning coefficients and retardation factors can also be obtained from the Ra isotopes but only by assuming that
222Rn provides a reasonable proxy for the recoil production rates of radium.
The concentrations of
222Rn (
t½ = 3.825 days) ranged from 142,000 dpm m
−3 (LWEB-2) to 442,000 dpm m
−3 (370-AJ) (average
222Rn = 260,000 dpm m
−3), which are expectedly the highest values observed as compared to other members of U- and Th-series radionuclides reported here (
Table 5). The large
222Rn concentrations are the result of radon’s inert character as a noble gas and its resulting inability to participate in any scavenging reactions. The concentration of
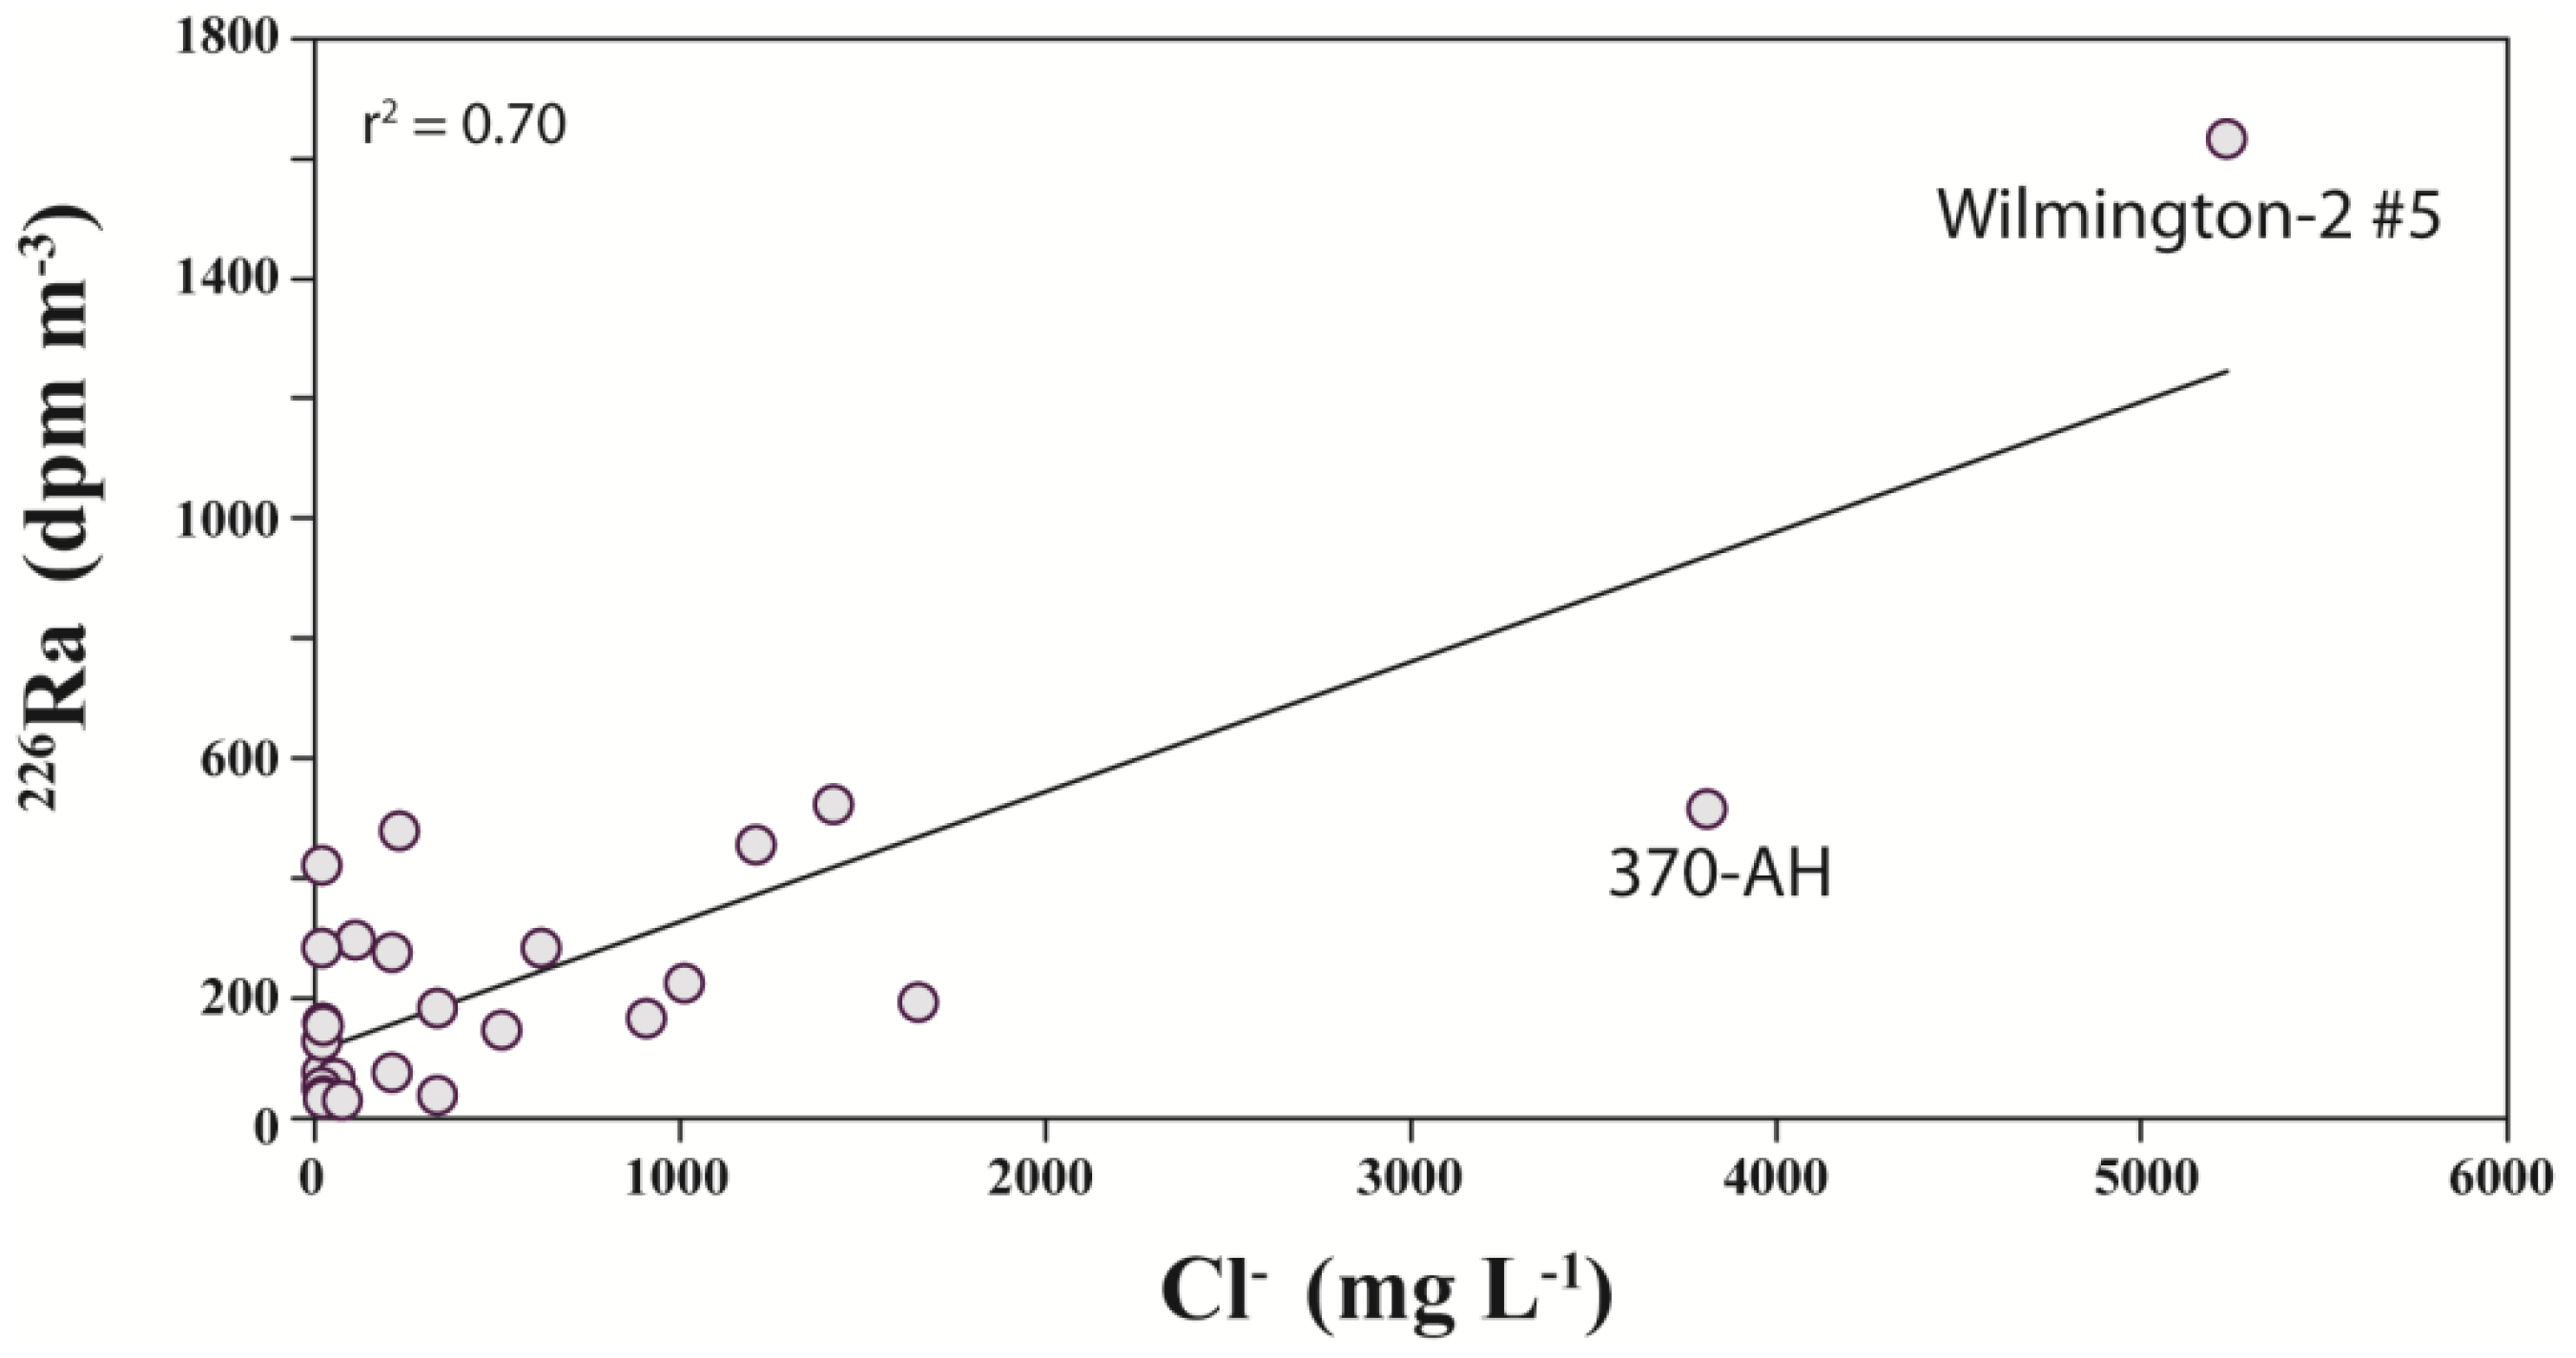
226Ra (
t½ = 1600 years) varied between 29 dpm m
−3 (Wilmington-2#3) and 1632 dpm m
−3 (Wilmington-2#5) (average
226Ra = 257 dpm m
−3), which is ~2–4 orders of magnitude lower than the
222Rn activities. Rn-222 is a direct measure of
226Ra (direct radiogenic parent of
222Rn) in the host rocks as well as a measure of the relative emanation efficiency from the host rock [
64]. A plot of
226Ra activity as a function of Cl
− concentration is shown in
Figure 7. Elevated Ra follows an increase in Cl
− and is attributed to solubilization of chloride complexes and/or through displacement from clays by ion exchange and desorption reactions.
Figure 7.
Ra-226 activity (dpm m−3) versus Cl− concentration.
Figure 7.
Ra-226 activity (dpm m−3) versus Cl− concentration.
Table 5.
Activities (dpm m−3) of dissolved 222Rn and four Ra isotopes in select wells from within the study area.
Table 5.
Activities (dpm m−3) of dissolved 222Rn and four Ra isotopes in select wells from within the study area.
| Well ID | 222Rn | 223Ra | 224Ra | 228Ra | 226Ra |
|---|
| (dpm m−3) | (dpm m−3) | (dpm m−3) | (dpm m−3) | (dpm m−3) |
|---|
| Huntington Park #1 | - | 147.4 | 2,138.8 | 457 ± 25 | 421 ± 9 |
| Huntington Park #2 | - | 44.1 | 1,720.4 | 306 ± 24 | 159 ± 7 |
| Carson-1 #1 | - | 26.2 | 844.6 | 172 ± 15 | 76 ± 4 |
| Carson-1 #2 | - | 35.6 | 2,270.7 | 311 ± 19 | 128 ± 5 |
| Carson-1 #3 | - | 56.5 | 1,976.2 | 353 ± 23 | 154 ± 6.7 |
| Carson-1 #4 | - | 109.8 | 3,310.2 | 694 ± 32 | 296 ± 8 |
| Wilmington-1 #1 | - | 3.8 | 111.9 | 199 ± 16 | 76 ± 4 |
| Wilmington-1 #2 | - | 11 | 296.6 | 511 ± 26 | 183 ± 6 |
| Wilmington-1 #3 | - | 9.1 | 284.4 | 452 ± 19 | 166 ± 5 |
| Wilmington-1 #4 | - | 73.4 | 1,392.2 | 825 ± 35 | 455 ± 9 |
| Wilmington-1 #5 | - | 16 | 466.9 | 654 ± 30 | 479 ± 10 |
| Wilmington-2 #1 | - | 14.7 | 792.2 | 173 ± 17 | 66 ± 4 |
| Wilmington-2 #2 | - | 23.4 | 2,903.1 | 177 ± 17 | 145 ± 6 |
| Wilmington-2 #3 | - | 4.9 | 1,813.5 | 378 ± 18 | 29 ± 1 |
| Wilmington-2 #4 | - | 4.3 | 2,254.6 | 553 ± 27 | 225 ± 7 |
| Wilmington-2 #5 | - | 204.5 | 3,918.8 | 2,716 ± 85 | 1,632 ± 18 |
| LWEB-1 | 244,000 ± 39,000 | 3.4 | 170 | 84 ± 9 | 51.6 ± 5.0 |
| LWEB-2 | 142,000 ± 47,000 | 4.1 | 115 | - | - |
| LWEB-3 | 242,000 ± 47,000 | 13.5 | 277 | 83 ± 10 | 36.7 ± 4.4 |
| LWEB-4 | 202,000 ± 23,000 | 60.6 | 1,285 | 581 ± 17 | 275 ± 7 |
| LWEB-5 | 195,000 ± 36,000 | 55.9 | 1,301 | 826 ± 21 | 282 ± 7 |
| LBCH-1 | 217,000 ± 11,000 | 2.9 | 95 | 53.6 ± 9.1 | 31.1 ± 4.2 |
| LBCH-2 | 418,000 ± 27,000 | 9.5 | 152 | 55.2 ± 8.6 | 29.2 ± 4.0 |
| LBCH-3 | 336,000 ± 75,000 | 18 | 690 | - | - |
| LBCH-4 | 388,000 ± 39,000 | 151.4 | 11,351 | - | - |
| 370-AJ | 442,000 ± 39,000 | 52.9 | 765 | 1,269 ± 24 | 522 ± 9 |
| 370-AH | 347,000 ± 58,000 | 49.2 | 2,976 | 2,944 ± 58 | 515 ± 10 |
| LBPC-1 | 160,000 ± 24,000 | 22.2 | 294 | 826 ± 21 | 282 ± 7 |
| LBPC-2 | 223,000 ± 46,000 | 10 | 138 | 86 ± 12 | 38 ± 4.6 |
| LBPF-1 | 172,000 ± 20,000 | 24.5 | 1,022 | 631 ± 23 | 192 ± 6.5 |
| LBPF-2 | 173,000 ± 11,000 | 54.5 | 4,489 | - | - |
The concentration of
223Ra (
t½ = 11.4 days) varied between 2.9 dpm m
−3 (LBCH-1) and 204.5 dpm m
−3 (Wilmington 2#5) (mean
223Ra = 42 dpm m
−3), while the concentrations of
224Ra (
t½ = 3.66 days) and
228Ra (
t½ = 5.75 years) varied between 95 dpm m
−3 (LBCH-1) and 11,351 dpm m
−3 (LBCH-4) (mean
224Ra = 1665) dpm m
−3 and 54 dpm m
−3 (LBCH-1) and 2944 dpm m
−3 (370-AH) (mean
228Ra = 606 dpm m
−3), respectively. The
223Ra/
226Ra activity ratio (AR) varied between 0.02 and 0.37 (
Table 6), with a mean value of 0.18, a value substantially higher than the expected value of 0.046. Because
223Ra and
226Ra are both generated after three α decays, groundwater should have a
223Ra/
226 Ra activity ratio similar to the host rock (
235U/
238U) activity ratio of 0.046. Higher
223Ra/
226Ra activity ratio may be observed in groundwater after a recharge or precipitation event, as
226Ra, due to its longer half-life, will not yet have reached a steady state concentration [
16,
65,
66].
Table 6.
Dissolved activity ratios (AR) of 228Ra/226Ra, 224Ra/228Ra, 224Ra/223Ra, 224Ra/222Rn, and 223Ra/226Ra, as well as the model-derived parameters: Ω, k1, k2, and Rf in select wells.
Table 6.
Dissolved activity ratios (AR) of 228Ra/226Ra, 224Ra/228Ra, 224Ra/223Ra, 224Ra/222Rn, and 223Ra/226Ra, as well as the model-derived parameters: Ω, k1, k2, and Rf in select wells.
| Well ID | 228Ra/226Ra | 224Ra/228Ra | 224Ra/223Ra | 224Ra/222Rn | 223Ra/226Ra | Ω224 | Ω228 | k1 | k2 (min-1) | Rf |
|---|
| AR | AR | AR | AR (× 10−4) | AR | (× 10−4) | (× 10−4) | (min−1) | (× 10−4) | (× 103) |
|---|
| LWEB-1 | 1.61 ± 0.23 | 2.04 ± 0.23 | 50.7 ± 5.7 | 7.0 ± 1.2 | 0.065 ± 0.009 | 4.9 | 2.4 | 0.53 | 1.3 | 4.1 |
| LWEB-2 | | | 28.1 ± 3.1 | 8.1 ± 2.7 | - | 5.4 | - | - | - | |
| LWEB-3 | 2.25 ± 0.38 | 3.34 ± 0.43 | 20.5 ± 2.3 | 11.4 ± 2.3 | 0.367 ± 0.058 | 8.8 | 2.6 | 0.21 | 0.56 | 3.8 |
| LWEB-4 | 2.11 ± 0.08 | 2.21 ± 0.13 | 21.2 ± 2.4 | 63.8 ± 8.1 | 0.220 ± 0.023 | 50 | 23 | 0.05 | 1.1 | 0.5 |
| LWEB-5 | 2.93 ± 0.10 | 1.57 ± 0.09 | 23.3 ± 2.6 | 66.7 ± 12.8 | 0.198419 | 57 | 36 | 0.06 | 2.3 | 0.3 |
| LBCH-1 | 1.72 ± 0.38 | 1.78 ± 0.32 | 32.5 ± 3.6 | 4.4 ± 0.3 | 0.094 ± 0.016 | 2.9 | 1.7 | 1 | 1.7 | 5.9 |
| LBCH-2 | 1.89 ± 0.39 | 2.76 ± 0.45 | 16.0 ± 1.8 | 3.7 ± 0.3 | 0.325 ± 0.055 | 2.4 | 0.88 | 0.85 | 0.74 | 11.5 |
| LBCH-3 | - | - | 38.2 ± 4.3 | 20.5 ± 4.7 | - | - | - | - | - | |
| LBCH-4 | - | - | 74.9 ± 8.4 | 293 ± 33 | - | - | - | - | - | |
| 370-AJ | 2.43 ± 0.06 | 0.60 ± 0.03 | 14.5 ± 1.6 | 17.3 ± 1.7 | 0.101 ± 0.010 | 15 | 25 | - | - | |
| 370-AH | 5.72 ± 0.16 | 1.01 ± 0.05 | 60.5 ± 6.8 | 86 ± 15 | 0.096 ± 0.010 | 73 | 72 | 1.7 | 121 | 0.1 |
| LBPC-1 | 2.93 ± 0.10 | 0.36 ± 0.02 | 13.3 ± 1.5 | 18.4 ± 2.9 | 0.079 ± 0.008 | 18 | 52 | - | - | |
| LBPC-2 | 2.26 ± 0.42 | 1.61 ± 0.24 | 13.9 ± 1.6 | 6.20 ± 1.3 | 0.262 ± 0.041 | 3.5 | 2.2 | 1 | 2.1 | 4.8 |
| LBPF-1 | - | - | 41.7 ± 4.7 | 59.5 ± 7.5 | 0.127 ± 0.013 | 41 | 26 | 0.08 | 2.1 | 0.4 |
| LBPF-2 | - | - | 82.4 ± 9.2 | 259 ± 21 | - | 204 | - | 0.006 | - | |
The
224Ra/
228Ra activity ratios provide a measure of the adsorption and desorption rate constants for radium [
15,
21]. Within host rocks that are in secular equilibrium,
224Ra/
228Ra = 1. The
224Ra/
228Ra activity ratios in the groundwater samples (
Table 6) varied between 0.36 (LBPC-1) and 3.34 (LWEB-2). While in general the fresh groundwater
224Ra/
228Ra ARs fall in a reasonably narrow range (0.5–2.0; [
15,
60,
67]), but much higher values have also been observed [
61]. Typically, higher
224Ra/
228Ra ARs occur in groundwaters where steady state conditions have not yet been reached or in transitional coastal groundwater systems that are variably affected by seawater mixing [
38]. In these groundwater samples (e.g., LBCH-2, LWEB-1,4,3), observed elevated
224Ra/
228Ra ARs may identify waters that have recently been mixed with seawater.
Due to their short and similar half-lives (
t½ = <4 days), the activities of
224Ra and
222Rn are expected to be in steady state in most groundwater. From the host rock
232Th/
238U activity ratio,
224Ra/
222Rn activity ratios can be used to calculate recoil and sorption rate constants [
21]. The observed
224Ra/
222Rn activity ratios (
Table 6) varied between 1.34 × 10
−5 to 3.9 × 10
−4 (average = 1.25 × 10
−4) and agree well with other reported values (0.2–4.4 × 10
−4; [
15,
60,
67]). The measured range in
224Ra/
222Rn activity ratios reflects the natural variability of these radionuclides in this groundwater system. The activity ratio of the two longest lived Ra isotopes,
228Ra/
226Ra, provides a measure of the relative recoil rates of radionuclides from two decay series [
21]. The observed
228Ra/
226Ra activity ratios (
Table 6) ranged between 1.1 and 5.7 (average = 2.3). Because
226Ra is the product of three α decays, while
228Ra is produced by one single α decay,
226Ra may be more mobile than
228Ra, resulting in lower
228Ra/
226Ra activity ratios. Differences in the activity ratios can be attributed to variations in the distribution of U and Th in host rocks.
5.8. Adsorption-Desorption Rate Constants and Retardation Factors
The production rates for Ra isotopes were calculated using
222Rn as the recoil flux monitor and is based on the relation [
15]:
where
Fi and
Fr are the recoil supply rates of Ra isotopes (
224Ra and
228Ra) and
222Rn to the groundwater respectively;
Qi and
Qr are the production rates of Ra isotopes and
222Rn in the aquifer solids; and ε is the rate of recoil supply of
224Ra and
228Ra relative to the
222Rn recoil supply. The term ε depends on where the radionuclide is positioned in the decay series, the α particle energy released during its production, and the scavenging capability of its immediate radiogenic parent. The value of ε can vary from a steady state value of ~1.5, if all the
226Ra recoiled into the groundwater remains in solution, to 0.86 if all the recoiled
226Ra is adsorbed onto the aquifer grain surfaces [
15]. For the derivation of
Fi and
Fr, we assumed a ε value of 1.0.
The calculated values of Ω
224, Ω
228,
k1,
k2, and
Rf are given in
Table 6. The adsorption rate constants (
k1) calculated based on the
224Ra and
228Ra concentrations varied between 0.006 to 1.70 min
−1, with an average value of 0.55 min
−1 and co-varied positively (
R = 0.71,
n = 7) with Na
+ concentration if one excludes the three highest Na
+ values (LBPF-1,2, Wilmington-2#5). This observation is intriguing, as one might expect an inverse correlation, as higher Na
+ would imply more Na
+ available for exchange, and thus, longer Ra residence time (or smaller
k1 values). More studies need to be conducted to validate this observation. The corresponding residence times, calculated for an irreversible adsorption model (1/
k1) ranged from 0.59 to 20.0 min (average = 6.62 min). The desorption rate (
k2) constant varied between 0.56 and 121 × 10
−4 min
−1, with a mean value of 14.8 × 10
−4 min
−1. The corresponding average residence time with respect to desorption was expectedly much greater. Faster sorption (
k1) of Ra injected into the water and slower desorption (
k2) from the host rock has been previously documented [
15,
17,
18,
67]. This range in values is in contrast with the values reported for subsurface brines, where
k1 and
k2 values are typically comparable [
16,
68]. As
k1 is always much greater than
k2 for these groundwater samples, the ratio
k1/
k2 can be used as a measure of the retardation factor,
Rf [
15], which here ranged from 0.1 to 11.5 × 10
3 (average = 3.5 × 10
3). Such
Rf values are on the same order of magnitude as has been reported for other groundwater systems [
15,
16,
60,
67].


