1. Introduction
Headwater streams constitute over two-thirds of the cumulative drainage length of river basins [
1,
2,
3,
4], and most of the headwater areas in the United States are covered by forests [
5]. By constituting such a large proportion of waterways, and having the ability to affect such a large percentage of US freshwater resources, forested headwaters are crucial sites for the storage and processing of nutrients and organic matter [
6,
7]. Stream metabolism reflects the primary productivity and community respiration of a stream, both of which can affect and/or be affected by the availability of nutrients, and, in the case of community respiration, by the availability of organic matter [
6], making stream metabolism useful for insights into nutrient and organic matter dynamics. The trophic status, food web, and impairment status of a water body can all be investigated through stream metabolism [
8,
9,
10,
11]. Stream metabolism has been measured
in situ for over 50 years [
12,
13,
14], and there has been a recent increase in the frequency of research focused on using functional methods, such as measuring stream metabolism, to answer various questions about ecosystem status [
6,
15]. Even with this rise in the number of stream metabolism studies, many have not been specific to low-gradient headwater streams [
16,
17], headwater streams being those broadly classified by Vannote
et al., as those of the 1st, 2nd, or 3rd order. The prevailing theory, put forth by Vannote
et al. [
18], is that primary production in headwaters constitutes a small proportion of overall metabolism, and that these systems derive most of their energy from allochthonous input. The metabolic studies that have taken place either partially or fully in headwaters have been mostly limited to moderate or high gradient streams and perennial flow [
16,
19,
20]. Little is known about metabolic processes of headwater streams in low-gradient watersheds with commonly stagnant flow. Furthermore, the majority of the research has been conducted outside of the US Gulf coastal plain, with few studies, such as that conducted by Mulholland
et al. [
8], situated in this geographically unique ecoregion.
Land usage within a watershed can alter stream metabolism by changing the sources of organic matter in the stream channel [
21]. Various forestry management activities have the potential to affect the ecosystems of adjacent streams [
22,
23]. Timber harvesting can potentially introduce fresh slash into water bodies [
24,
25], often resulting in increases in community respiration, an example of which was reported by Clapcott and Barmuta [
23] where logging was found to stimulate heterotrophic process. Forestry practices such as timber harvest may also increase nutrient runoff [
26], possibly contributing to stream eutrophication. Eutrophication can directly increase the production and biomass of both autotrophic and heterotrophic communities, and indirectly increase heterotrophic production when autotrophic increases provide a larger carbon source in the form of decayed algae—all of which result in changes to primary production and community respiration [
27]. Sediment additions from in-roads through forested tracts, and from timber harvesting, can affect both primary production and community respiration by altering stream light availability and nutrient conditions [
8,
23]. In addition, timber harvesting can change shade conditions along streams, increasing opportunities for instream photosynthesis and thus elevating primary productivity [
21,
22,
23,
28]. The reduction in shade can further affect streams by elevating water temperature, which influences both community respiration and, less strongly, primary productivity [
29].
Consideration of these potential influences of forestry activities on stream ecosystems is especially important for land managers in the state of Louisiana, USA, as nearly 50% of the state, known by many for its vast waterways and wetlands, is forested [
30]. These forests are critical for the Louisiana economy as the timber industry is the state’s second largest manufacturing employer [
30]. In 2000, the Louisiana Forestry Association, the Louisiana Department of Environmental Quality, and the Louisiana Department of Agriculture and Forestry developed a manual of recommended forestry best management practices (BMPs) for Louisiana [
30] in an attempt to reduce potential negative impacts caused by forestry activities on stream water quality. These BMPs are a set of guidelines for minimizing surface erosion, sediment, nutrient and organic matter runoff, and for maintaining streamside conditions. Studies have shown that forestry BMPs in other U.S. southern states can be effective at minimizing water quality degradation [
31], although most have measured effectiveness using physical and/or chemical water quality parameters that are biased toward the short-term, variable conditions existing at the time of sampling [
32]. While the ecosystem protection afforded by BMPs has been assessed using biotic indicator species [
32,
33], to our knowledge there have been no studies using stream metabolism to investigate the effects of timber harvesting under current Louisiana BMPs.
In this study we monitored continuous dissolved oxygen (DO) concentrations over a four-year period in a 2nd-order, forested headwater stream with a low-gradient channel, rich organic substrate, and frequent stagnant flow. The study aimed to determine whether a timber harvest with Louisiana’s current BMPs would significantly alter stream metabolism.
2. Methods
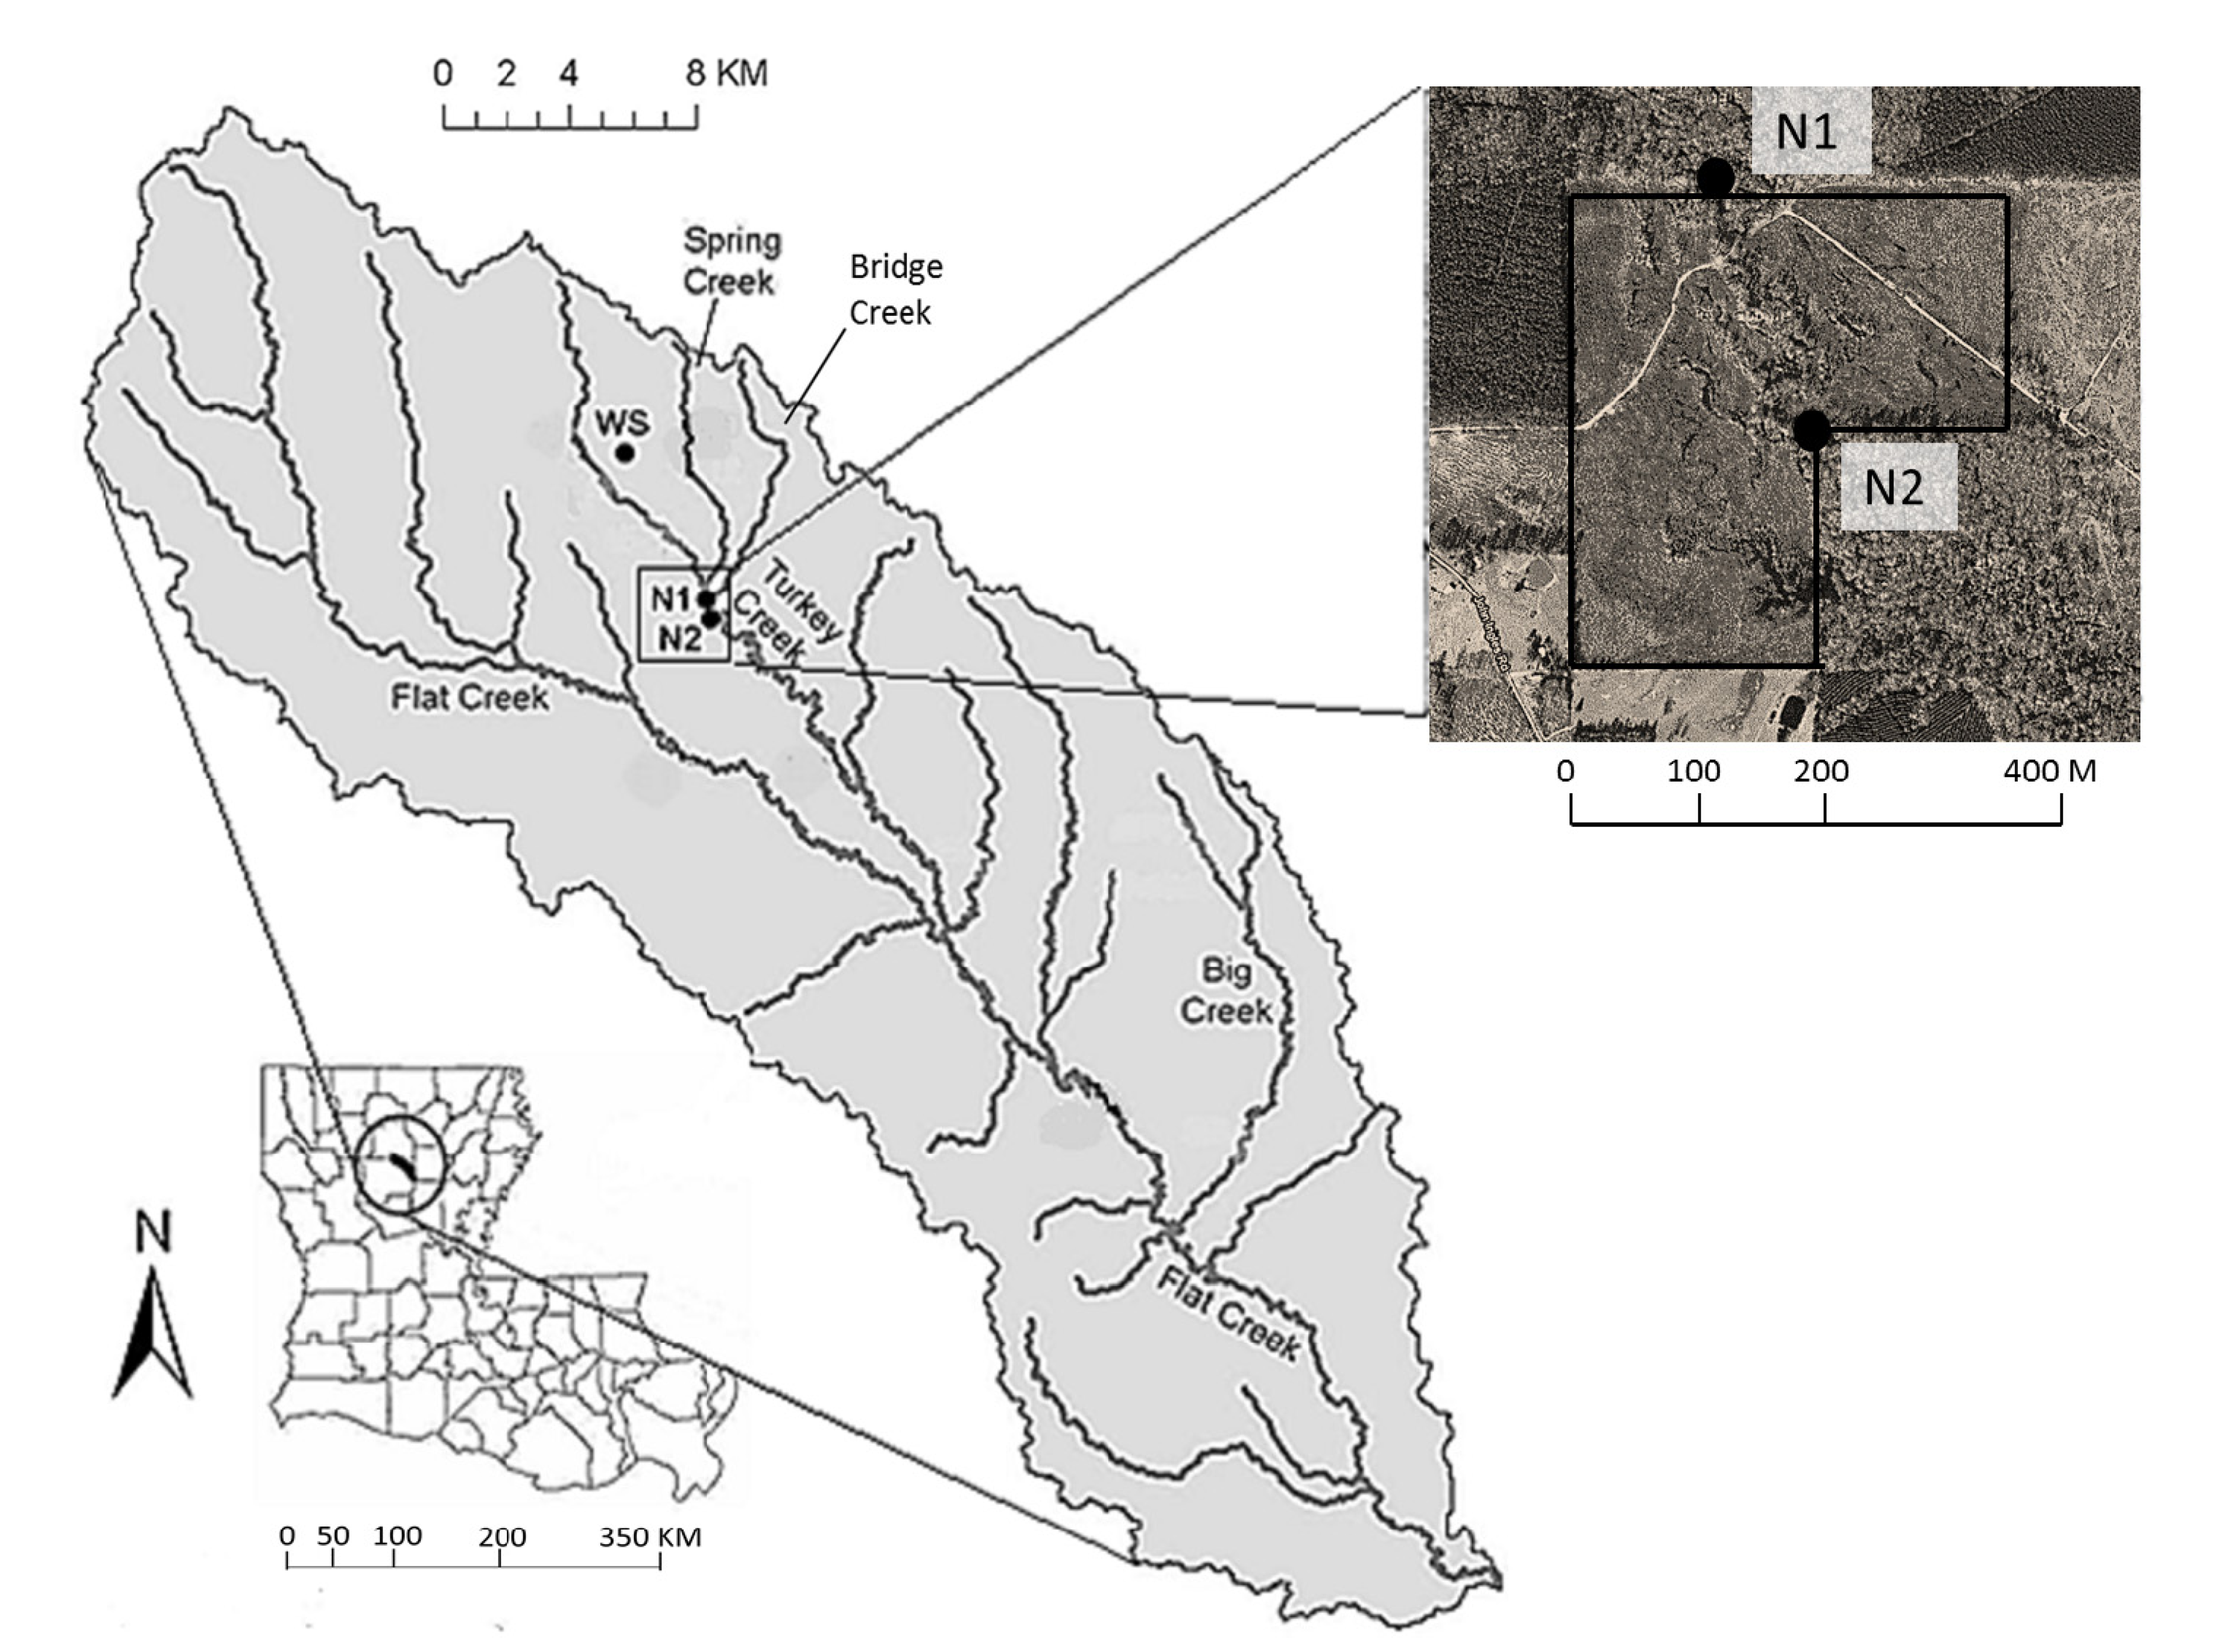
This study was conducted on Turkey Creek, a 2nd-order stream in central Louisiana, USA (latitude 32°6'26.46'' N, longitude 92°27'35.20'' W), that drains an area of approximately 3400 ha within the Flat Creek watershed (
Figure 1). The area has a flat topography with a slope gradient < 0.5%, and the stream has organic-rich substrates. Land use is mainly forestry (61% of the total watershed area) and rangeland (21%) in the Flat Creek Watershed. Forest type is a mix of hardwood and evergreen, with loblolly pines (
Pinus taeda) comprising the majority of the evergreens. The region is characterized by a warm, humid, subtropical climate, with an annual mean temperature of 18.2 °C (ranging from 8.0 °C in January to 27.4 °C in July) and an annual mean precipitation of 1508 mm (ranging from 91 mm in September to 158 mm in December) (data from 1971 to 2000; obtained from the National Climatic Data Center’s Winnfield 2W Coop Station, located 23 km southwest of the study area). As part of a related hydrological study in the Flat Creek watershed, Saksa [
34] estimated annual evapotranspiration to be around 80%–90% of annual precipitation.
Figure 1.
Geographical location of the Flat Creek watershed in Winn Parish, Louisiana, USA, and the study sites (labeled N1 and N2). A closer image of N1 and N2 is also shown (taken from Google Map), with the sites above (N1) and below (N2) the harvested pine stand (outlined in black). Also pictured is the weather station (WS).
Two YSI 6920 V2 water quality monitoring probes (Yellow Springs Instruments, Yellow Springs, OH, USA) were deployed in June 2006 at an upstream and a downstream location (N1 and N2, respectively), approximately 500 m apart along Turkey Creek, to record stream DO concentrations, temperature, and depth at 15-min intervals. The elevations of N1 and N2 were 43.8 m and 42.6 m, respectively, creating a gradient of about 0.2%. The drainage areas of N1 and N2 were 33.8 km
2 and 34.2 km
2. Mean wetted widths (and standard deviations) of the stream were 3.3 ± 0.6 m at N1, 4.4 ± 2.2 m at N2, and mean depths were between 0.5 ± 0.2 m and 0.6 ± 0.2 m at both sites. Stream data were continuously recorded until September 2010, during which time monthly site visits were made for probe calibration and cleaning. Monthly water samples were taken at both sites for field turbidity measurements (Turbidimeter 2100Q, Hach Company, Loveland, CO, USA) and analyzed for concentration of total suspended solids (TSS) at the Louisiana State University Agriculture Chemistry Laboratory. A HOBO weather station (Onset Computer Corporation, Bourne, MA, USA) was installed in the watershed (
Figure 1) to record continuous meteorological data including rainfall and air temperature at 15-min intervals. A 45 ha commercial tract of loblolly pines was clear cut harvested in late summer-early fall of 2007 between the N1 and N2 sites.
All of Louisiana’s current timber harvest BMPs [
30] were implemented for the harvest, including maintaining streamside management zones (SMZs) with a basal area of 11.4 m
2 ha
−1 along perennial stream channels (keeping a minimum of 15.2 m distance from the stream, as per BMP guidelines for perennial streams <6.1 m wetted width), minimizing stream crossings, limiting equipment within SMZs, constructing water bars and lateral ditches, reconstructing haul roads, restoring stream crossings, and removing slash and logging debris from stream channels. To prevent damage caused by the timber harvest from occurring to the water quality probes, they were removed from 15 September to 17 October 2007. As part of related research [
35], post-harvest canopy cover (%) was measured using a convex densiometer at eight random points between 8 and 150 m upstream of N1, and also at eight random points between 8 and 150 m upstream of N2. The measurements at and slightly upstream of N1 averaged 83.4%, while measurements at and slightly upstream of N2 averaged 70.7%.
2.1. Metabolic Calculations
A single-station method [
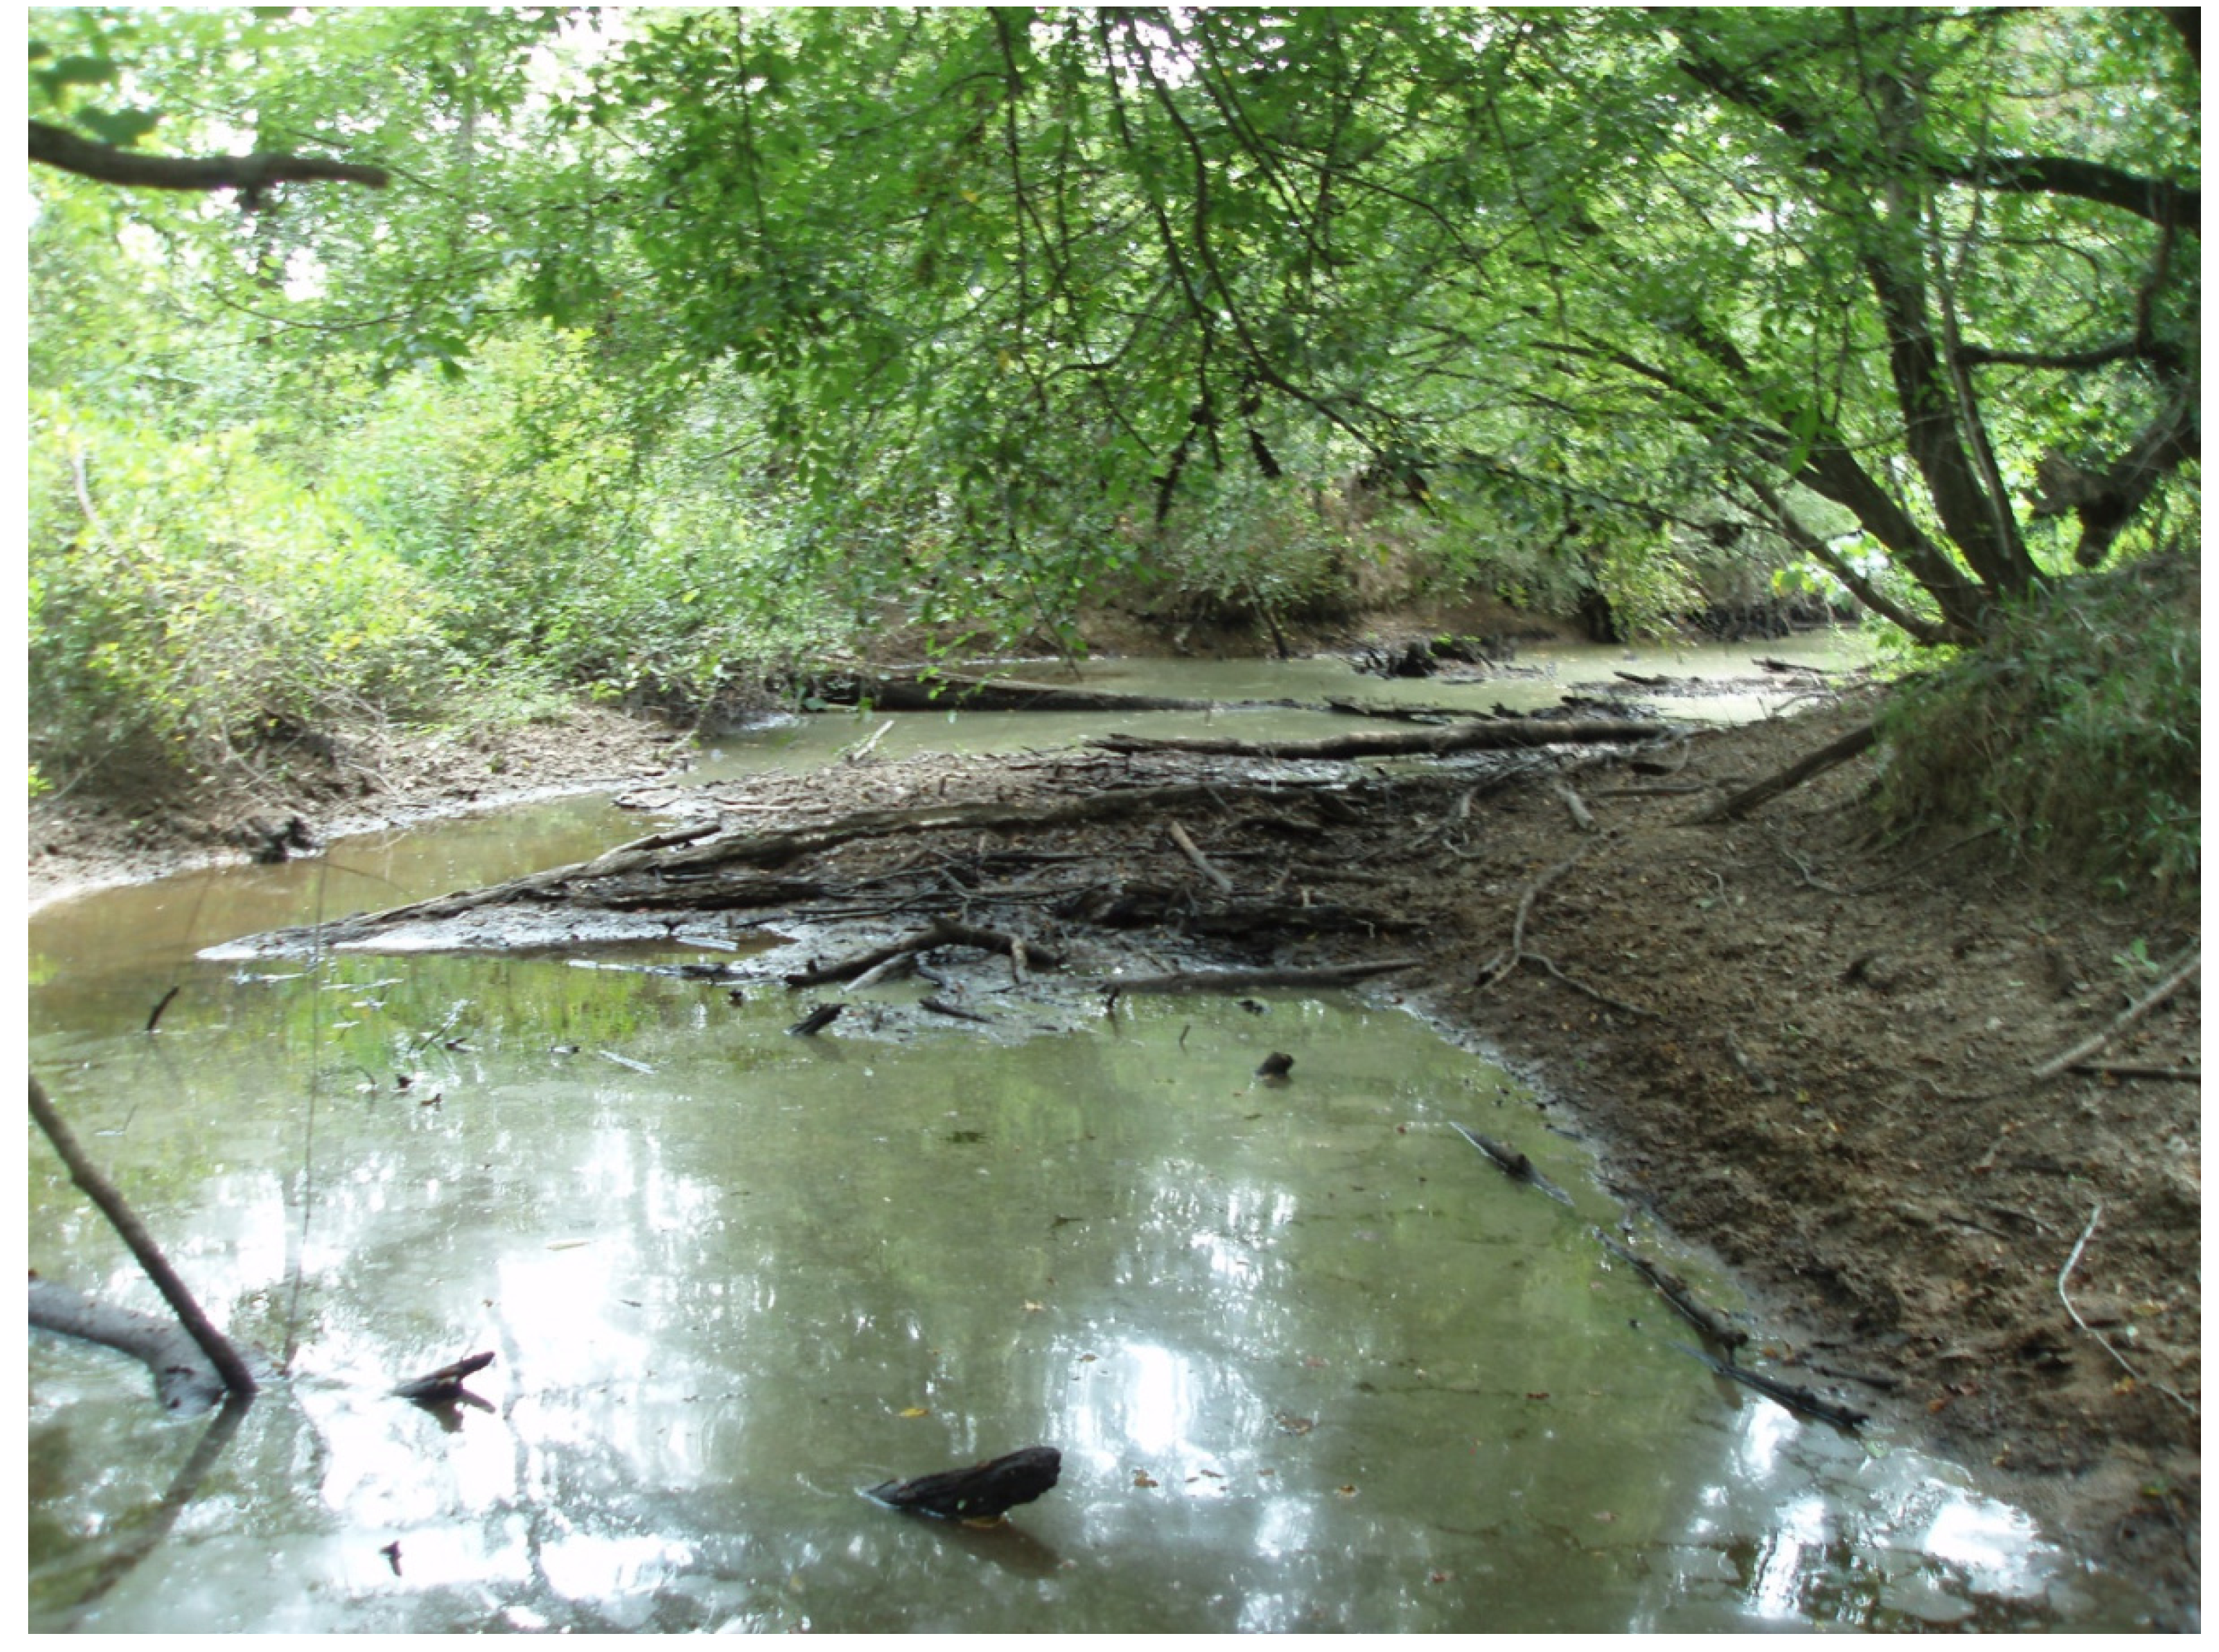
36] was used to calculate stream metabolism individually at sites N1 and N2. Under baseflow conditions, the stream appeared to be stagnant (
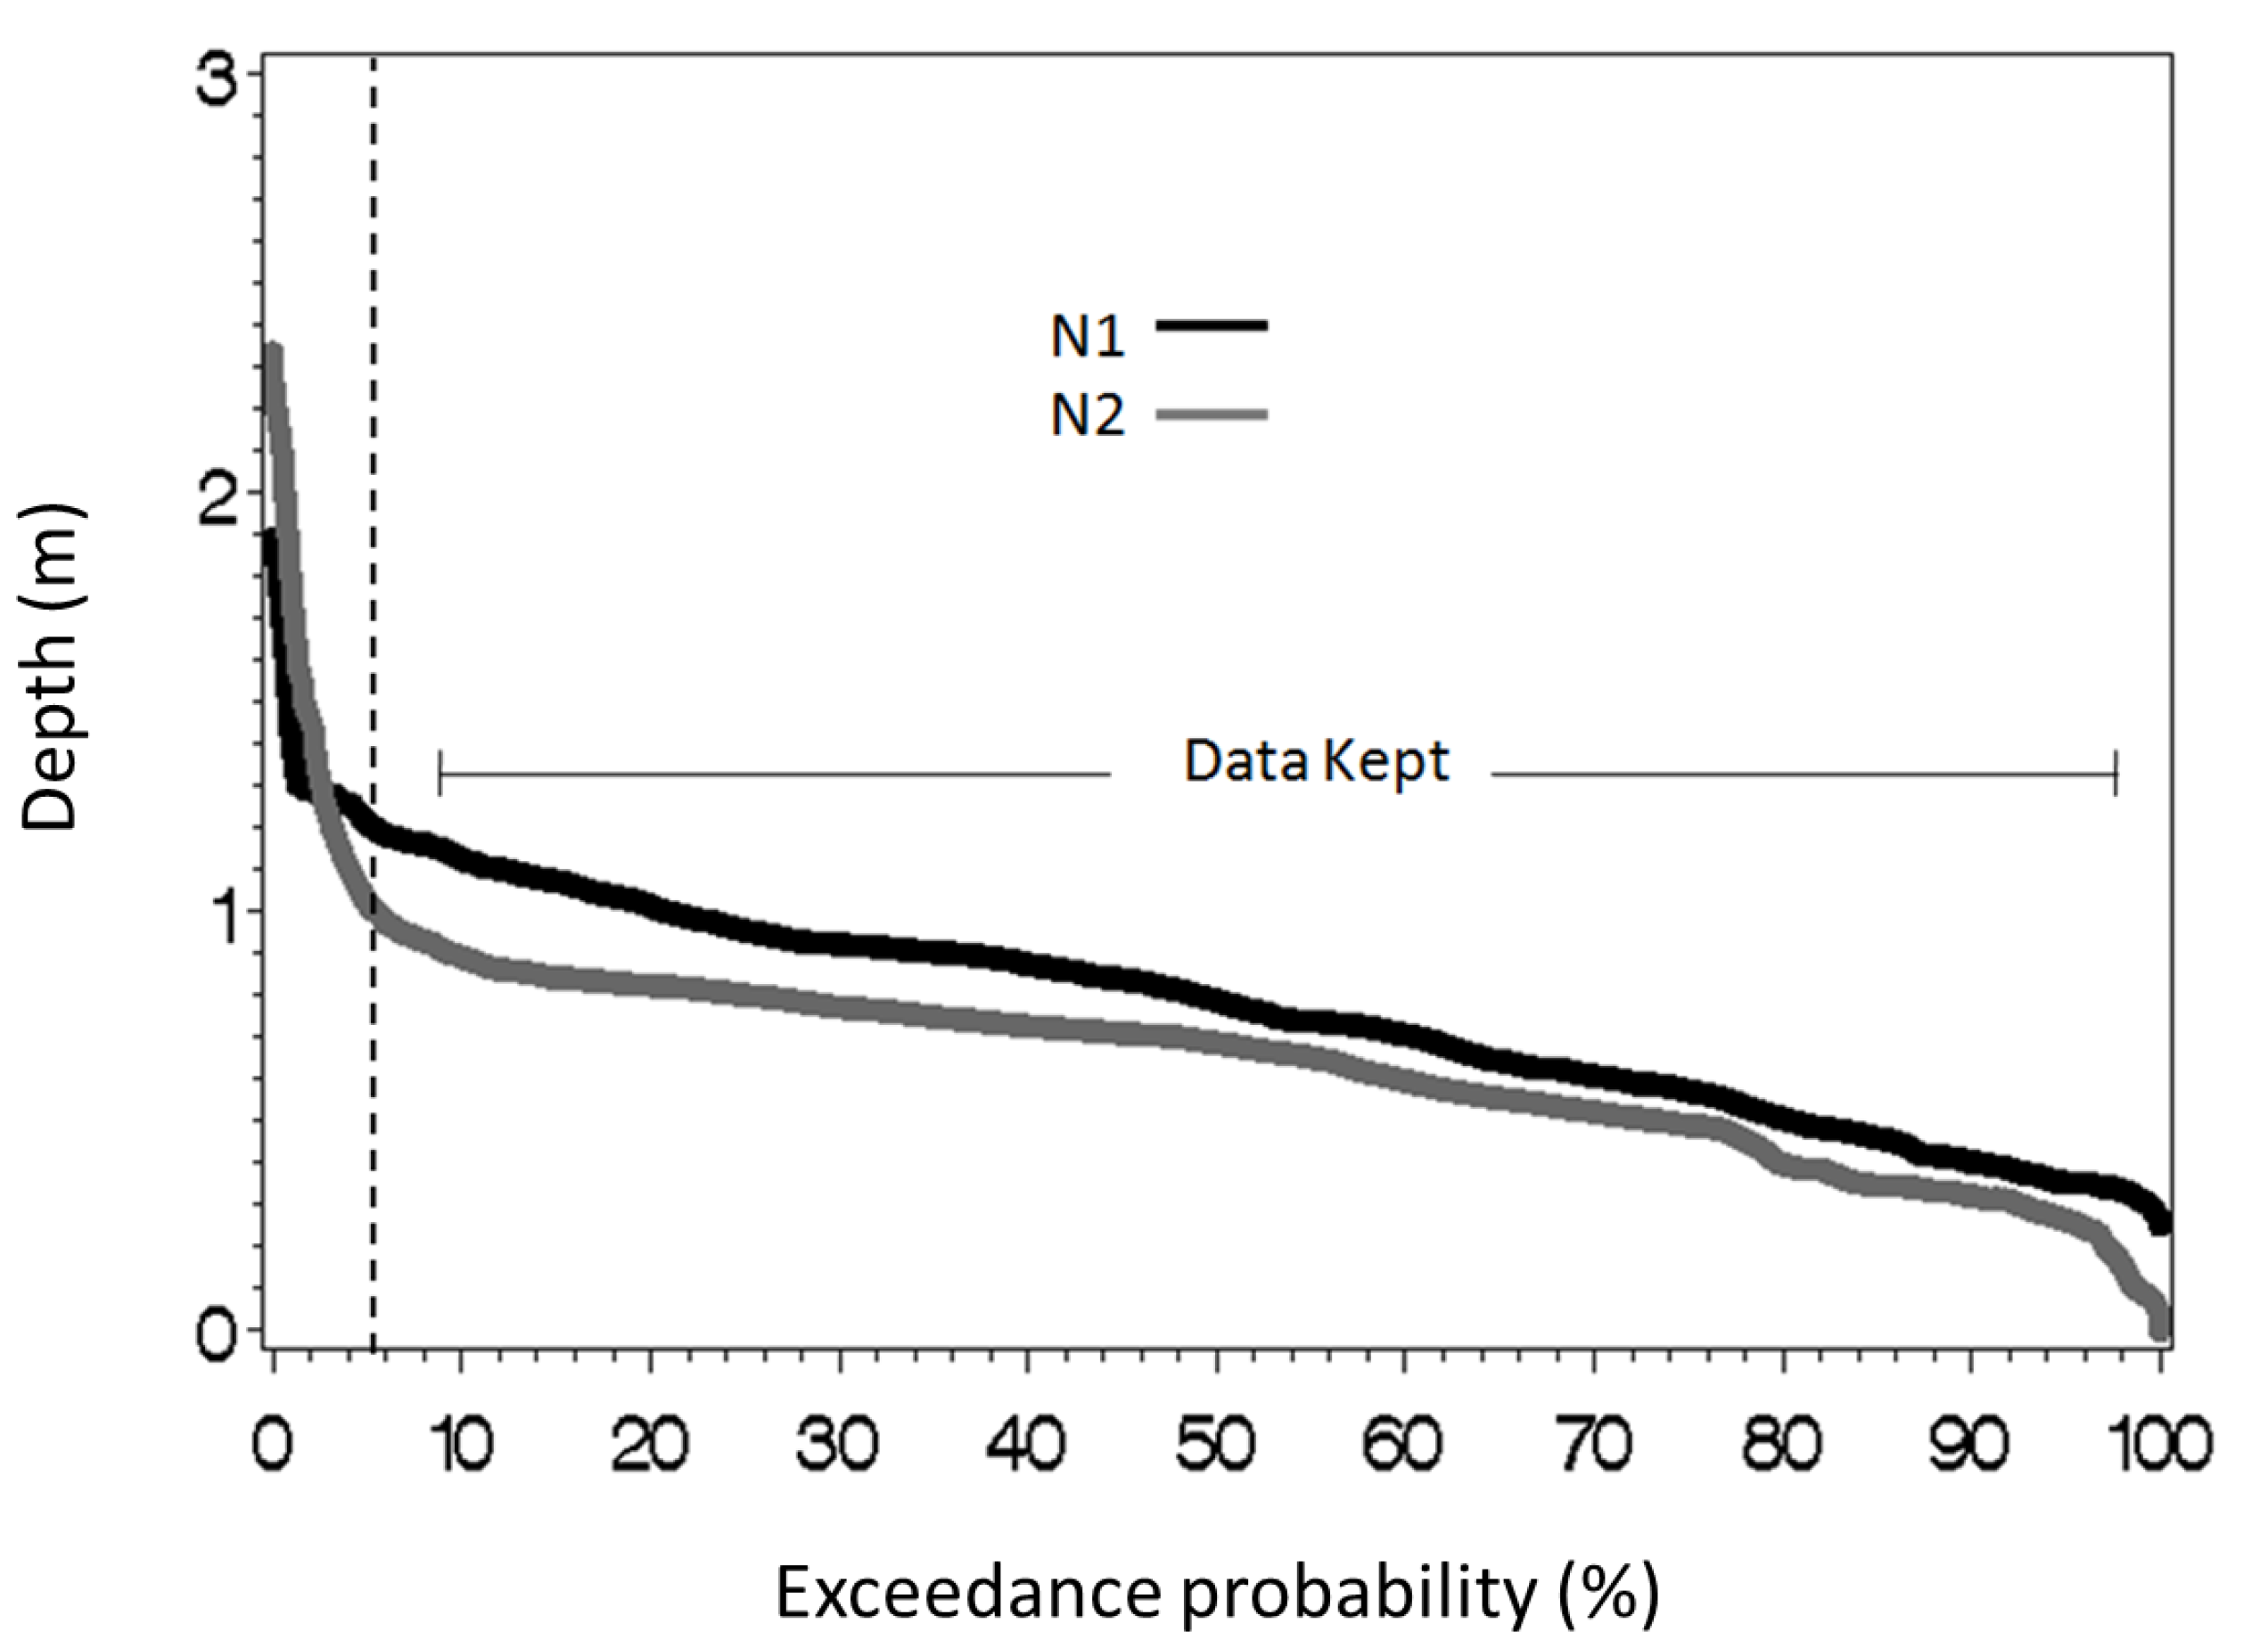
Figure 2); For example, during the low flow periods in 2009 and 2010—which constitutes 95% of the time (
Figure 3)—average stream velocities for N1 and N2 were 0.56 cm s
−1 and 1.73 cm s
−1, and 0.68 cm s
−1 and 0.53 cm s
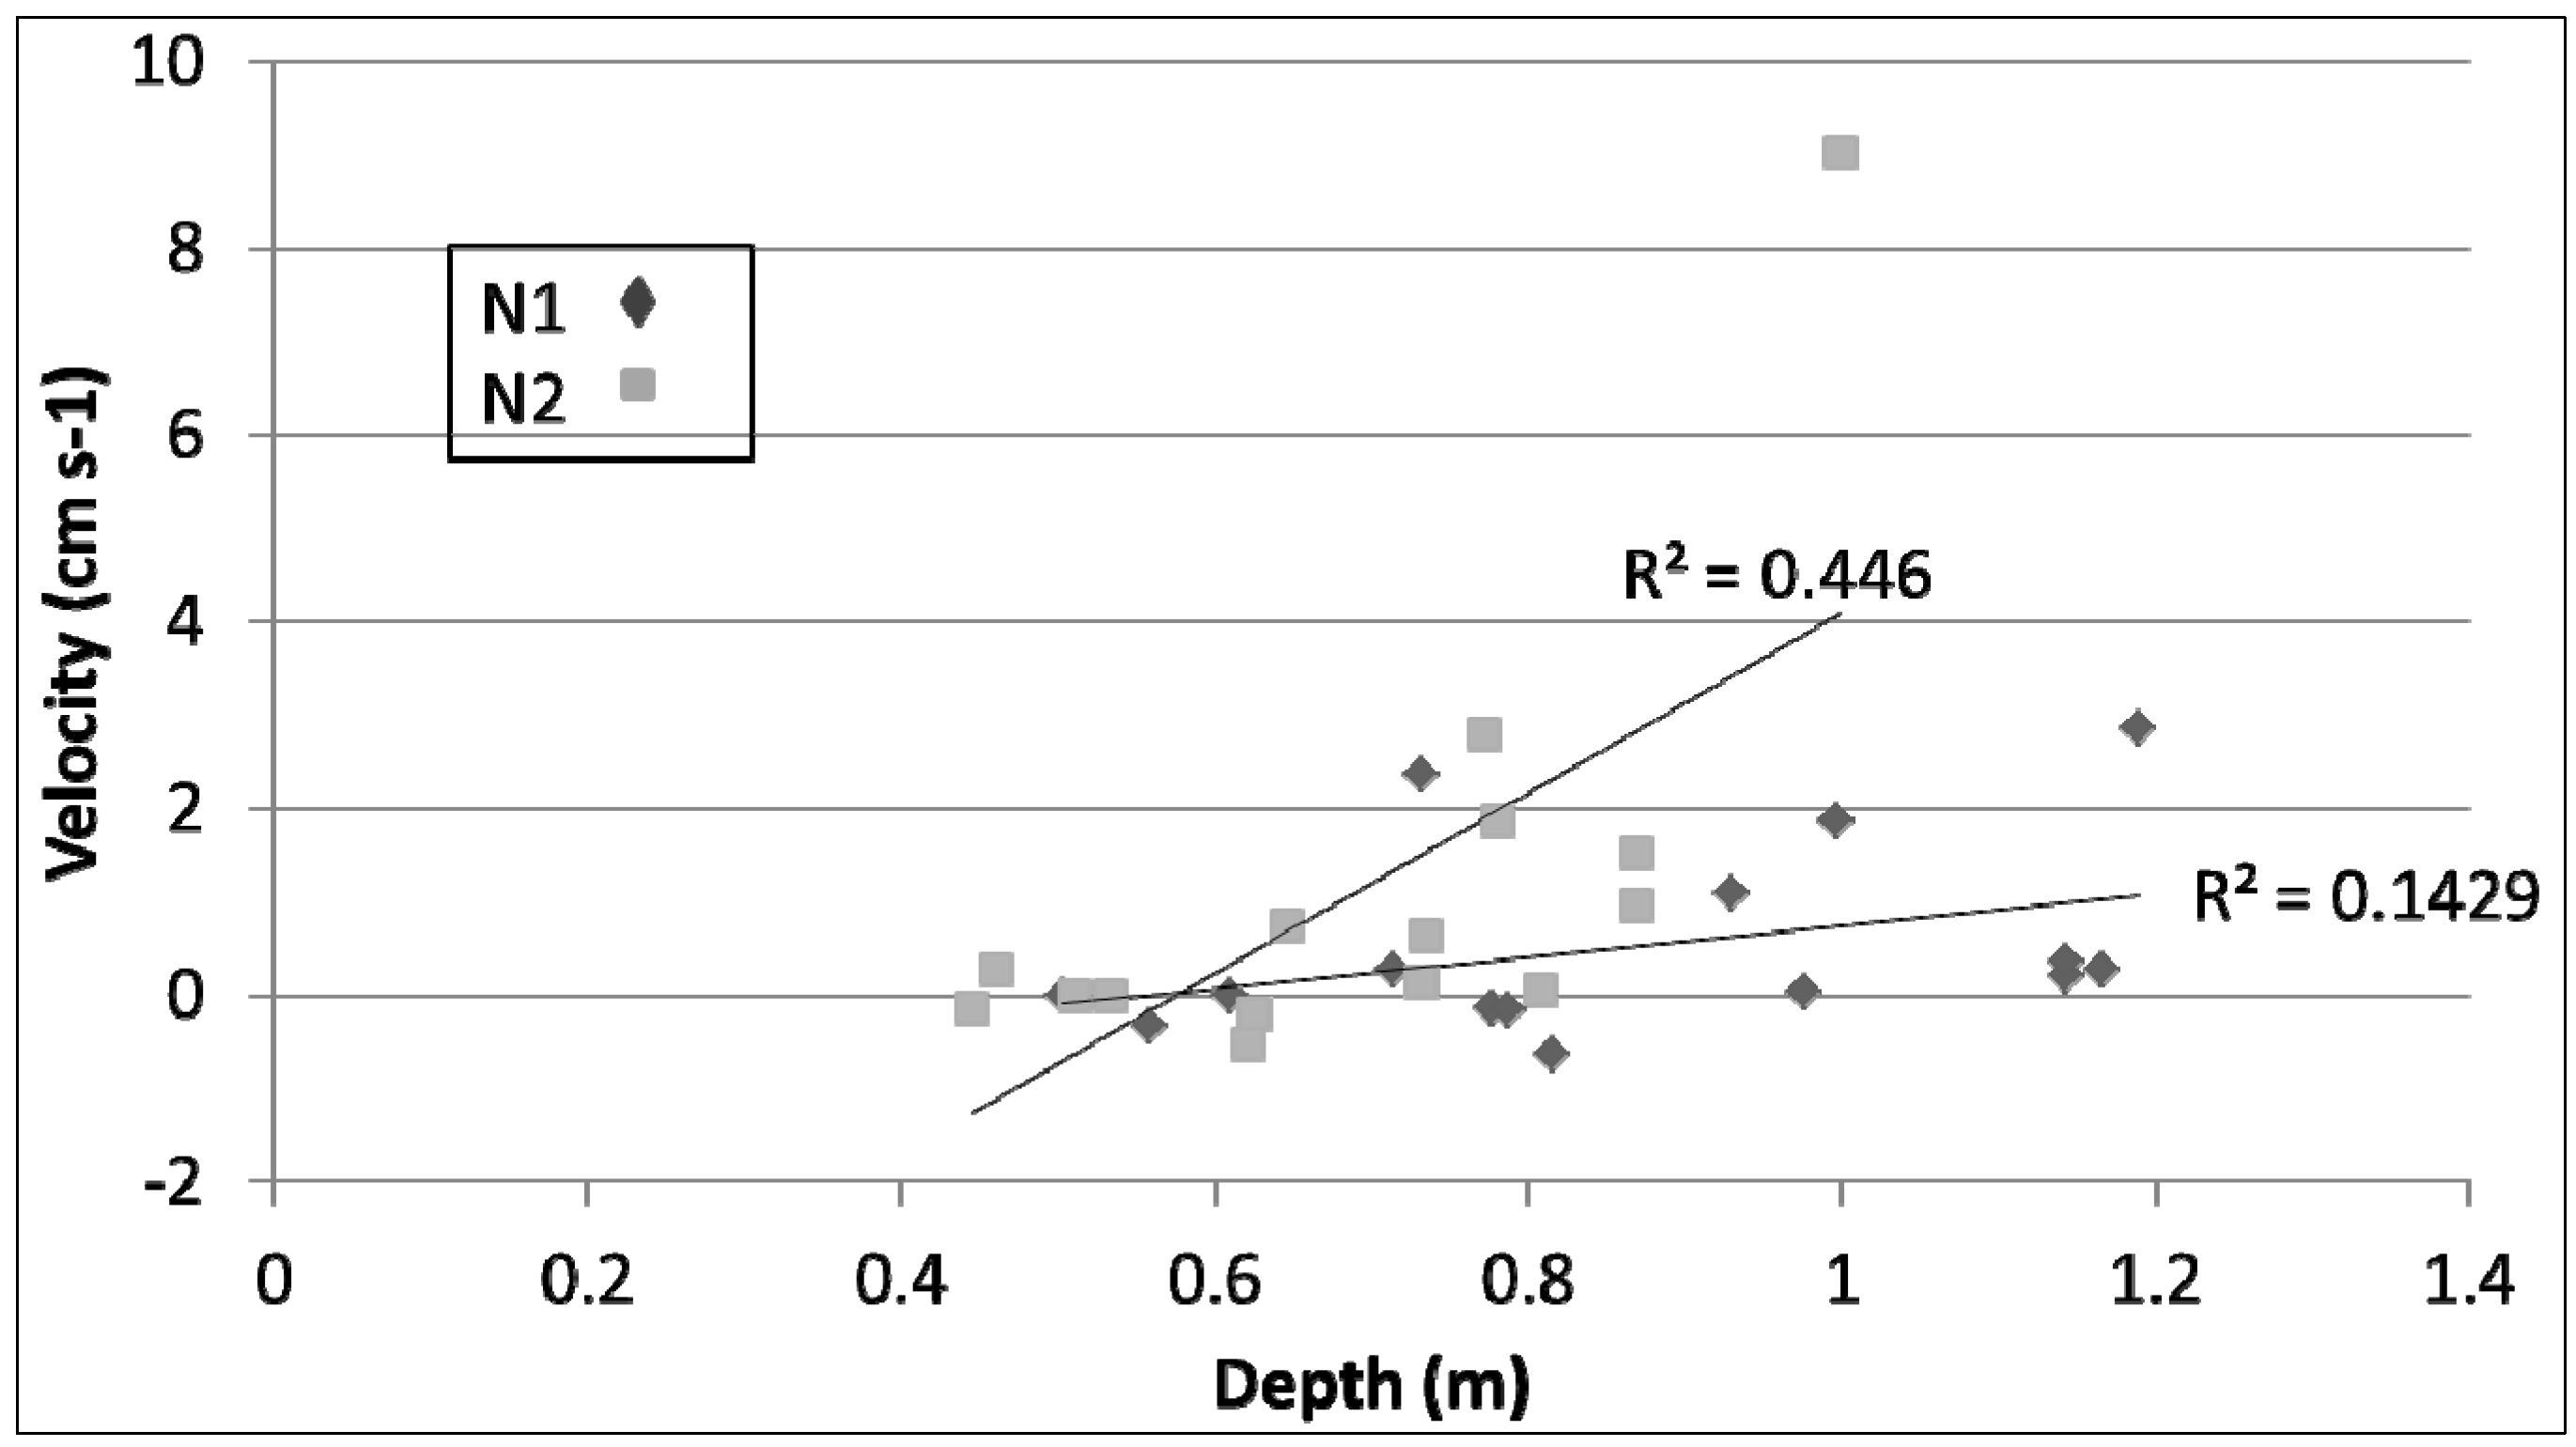
−1, respectively. All but one monthly velocity measurement were under 3 cm s
−1, with a number of measurements falling below 0 cm s
−1, and the corresponding depths for the velocities were all less than 1.2 m at N1 and N2 (
Figure 4). Reaeration is strongly influenced by turbulent mixing [
37], and because of the low velocities in a stream with a relatively moderate cross sectional area (approximately 3.5 m in width by 0.5 m in depth), we assumed the reaeration coefficient to be zero,
i.e., disregarding stream reaeration caused by water movement. We acknowledge that neglecting the coefficient may result in lower estimation of metabolic rates, as some studies have shown that CO
2 exchange occurs between the atmosphere and still water in lakes [
38] and river backwater [
39]. The primary purpose of our study is to investigate potential harvest effect on stream metabolism, rather than give a precise quantification of metabolic rates. We applied the same calculation for both the upstream and downstream sites. Therefore, any inaccuracies should be equivalent at the sites and be canceled, which allows us to test for the effect of the 2007 timber harvest conducted between these sites. In an attempt to improve the accuracy of our calculation, we have created exceedance-probability curves based on all 15-min stream depth data points for both sites, and DO measurements from the top 5% of depth readings were removed (
Figure 3). The assumption behind this is that greater depths correspond to higher stream velocities [
40], and by taking out the DO recorded at the highest depths we could limit inaccurate calculations of metabolism that might come from discounting the reaeration coefficient. The equations below were taken, with slight modification, from Cornell and Klarer [
41].
Net Ecosystem Productivity (
NEP, g O
2 m
−2 day
−1) was calculated by summing the change in
DO (Δ
DO) between two measurement points for the photoperiod and multiplying by the average depth (m) of that day as follows:
Photoperiod was determined to the minute using a website which determined the sunrise/sunset times [
42] for the nearby town of Sikes, Louisiana.
Figure 2.
Photo of Turkey Creek, a 2nd-order stream in north-central Louisiana showing typical low-gradient, meandering flow, and high organic conditions.
Figure 2.
Photo of Turkey Creek, a 2nd-order stream in north-central Louisiana showing typical low-gradient, meandering flow, and high organic conditions.
Figure 3.
Exceedance-probability curves based on all depths (m) recorded (15-min increments; from 2006 to 2010) at N1 (black) and N2 (gray). The vertical, dashed line represents the 5% mark that was used to discard high-flow data. All data taken at depths to the left of this line were omitted.
Figure 3.
Exceedance-probability curves based on all depths (m) recorded (15-min increments; from 2006 to 2010) at N1 (black) and N2 (gray). The vertical, dashed line represents the 5% mark that was used to discard high-flow data. All data taken at depths to the left of this line were omitted.
Figure 4.
Relationships between measured stream velocity and sonde depth for both N1 and N2.
Figure 4.
Relationships between measured stream velocity and sonde depth for both N1 and N2.
Hourly respiration (
HR; g O
2 m
−2 h
−1) was calculated by summing the flux of the
DO during the nighttime, when no photosynthesis occurs, multiplying by the average depth of that night, and then dividing by the number of hours in that night:
Gross primary productivity (
GPP; g O
2 m
−2 day
−1) measures total photosynthesis, while taking into account the
HR during the photoperiod, to approximate system metabolism. This was calculated as follows:
Community respiration (
CR; g O
2 m
−2 day
−1) was calculated using the
HR rate and extrapolating it over both the photoperiod and the nighttime hours:
A comparison of the systems’ productivity to respiration was done through the
P/
R ratio, which took
GPP and divided by
CR:
Whenever the calculated
HR or
GPP was less than zero, or anytime
NEP was greater than
GPP, that datum was deleted. These instances probably were not accurate measurements of ecosystem processes, and could have been due to confounding factors such as instrumental error [
41,
43] or low levels of
DO, allowing for the small decrease in concentration overnight to be overshadowed by low levels of reaeration (the majority of all measurements at N1 were below 1 mg L
−1). The occurrence of at least one of these inaccurate measurements, either at one or both locations, caused us to exclude 78.6% of calculated daily metabolic rates. This resulted in 56 days in the pre-harvest period, and 80 days in the post-harvest period to statistically analyze for harvest-induced metabolic differences.
2.2. Statistical Analysis
Two-way ANOVAs with interaction were used to compare calculated daily metabolic rates, TSS, and turbidity from the two sites (N1 and N2), as well as to compare these variables between the pre- and post-harvest periods. These ANOVAs were implemented as a mixed model with an unstructured covariance matrix to account for serial measurements over time (the unstructured covariance matrix was selected after comparison with alternative matrices such as 1st-order autoregressive). Using the Statistical Analysis Software package SAS [
44], PROC MIXED statements were run for these ANOVAs, with a CLASS statement of site (N1 or N2) and harvest (pre or post), a MODEL statement for each variable equal to harvest, site, and (harvest × site), and a RANDOM statement of month (an attempt to eliminate seasonal variation from these tests for harvesting effect). An additional direct comparison of the pre- to post-harvest relationships between upstream and downstream monthly averages of
GPP was made by regressing pre-harvest N1
GPP against pre-harvest N2
GPP, post-harvest N1
GPP against post-harvest N2
GPP, and using analyses of covariance to test for significant differences between the slope and y-intercept of these two lines. To explore seasonal influences, tests of fixed effects (SAS PROC GLIMMIX; negative binomial and log combination) were run on each variable from the reference site, N1. To test for any effects water temperature might have had on daily metabolic rates at the upstream reference site N1, we compared each variable by linear regression against daily-averaged water temperature. All statistical analyses were performed using the Statistical Analysis Software package SAS.
3. Results
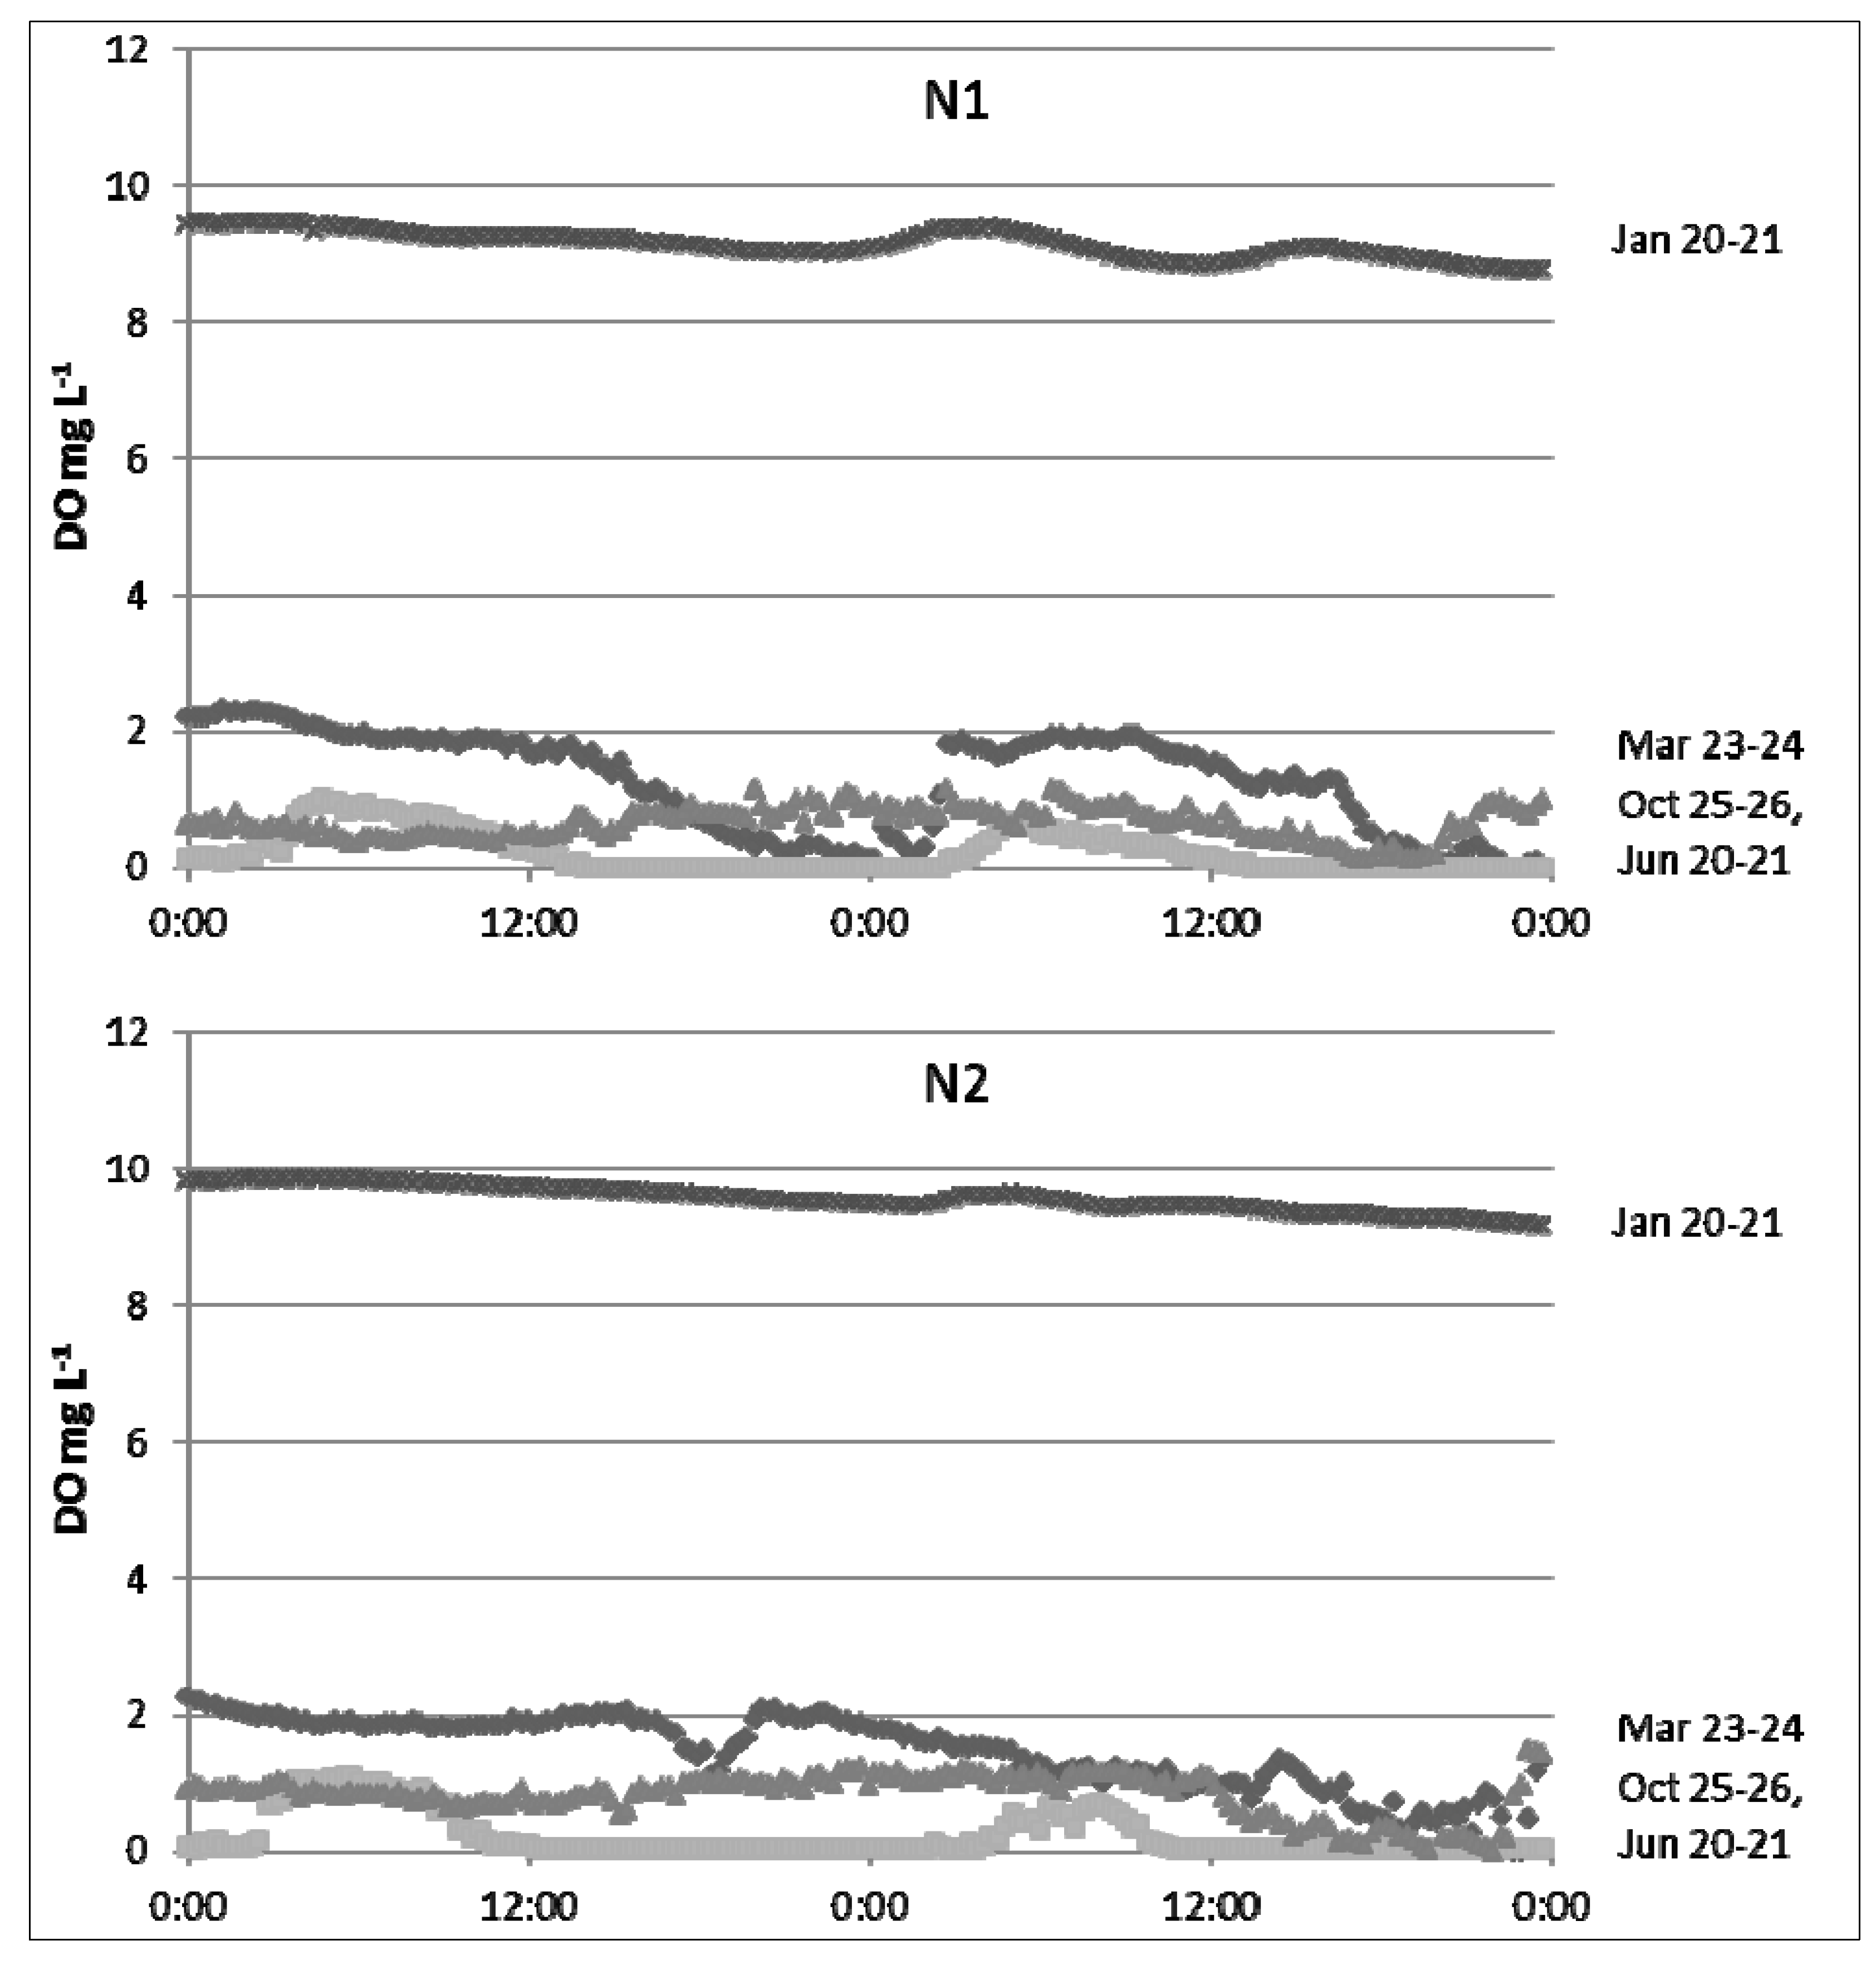
During the study period from 2006 through to 2010, monthly air temperature in the Flat Creek watershed averaged 17.8 °C, ranging from 4.6 °C (February 2010) to 28.6 °C (July 2008), and annual rainfall totaled 1301, 893, 1266, 1269, and 833 mm, respectively. Water temperatures of this subtropical stream fluctuated from 4 °C to 34 °C at the upstream reference site, N1. However, the majority of recorded stream temperatures (>75%) ranged between 10 and 25 °C at this site. Turkey Creek
DO concentrations and the daily timing of
DO minimums and maximums changed seasonally (
Figure 5), but concentrations were usually below 5 mg L
−1 (>70% of measurements).
3.2. Timber Harvest Impact
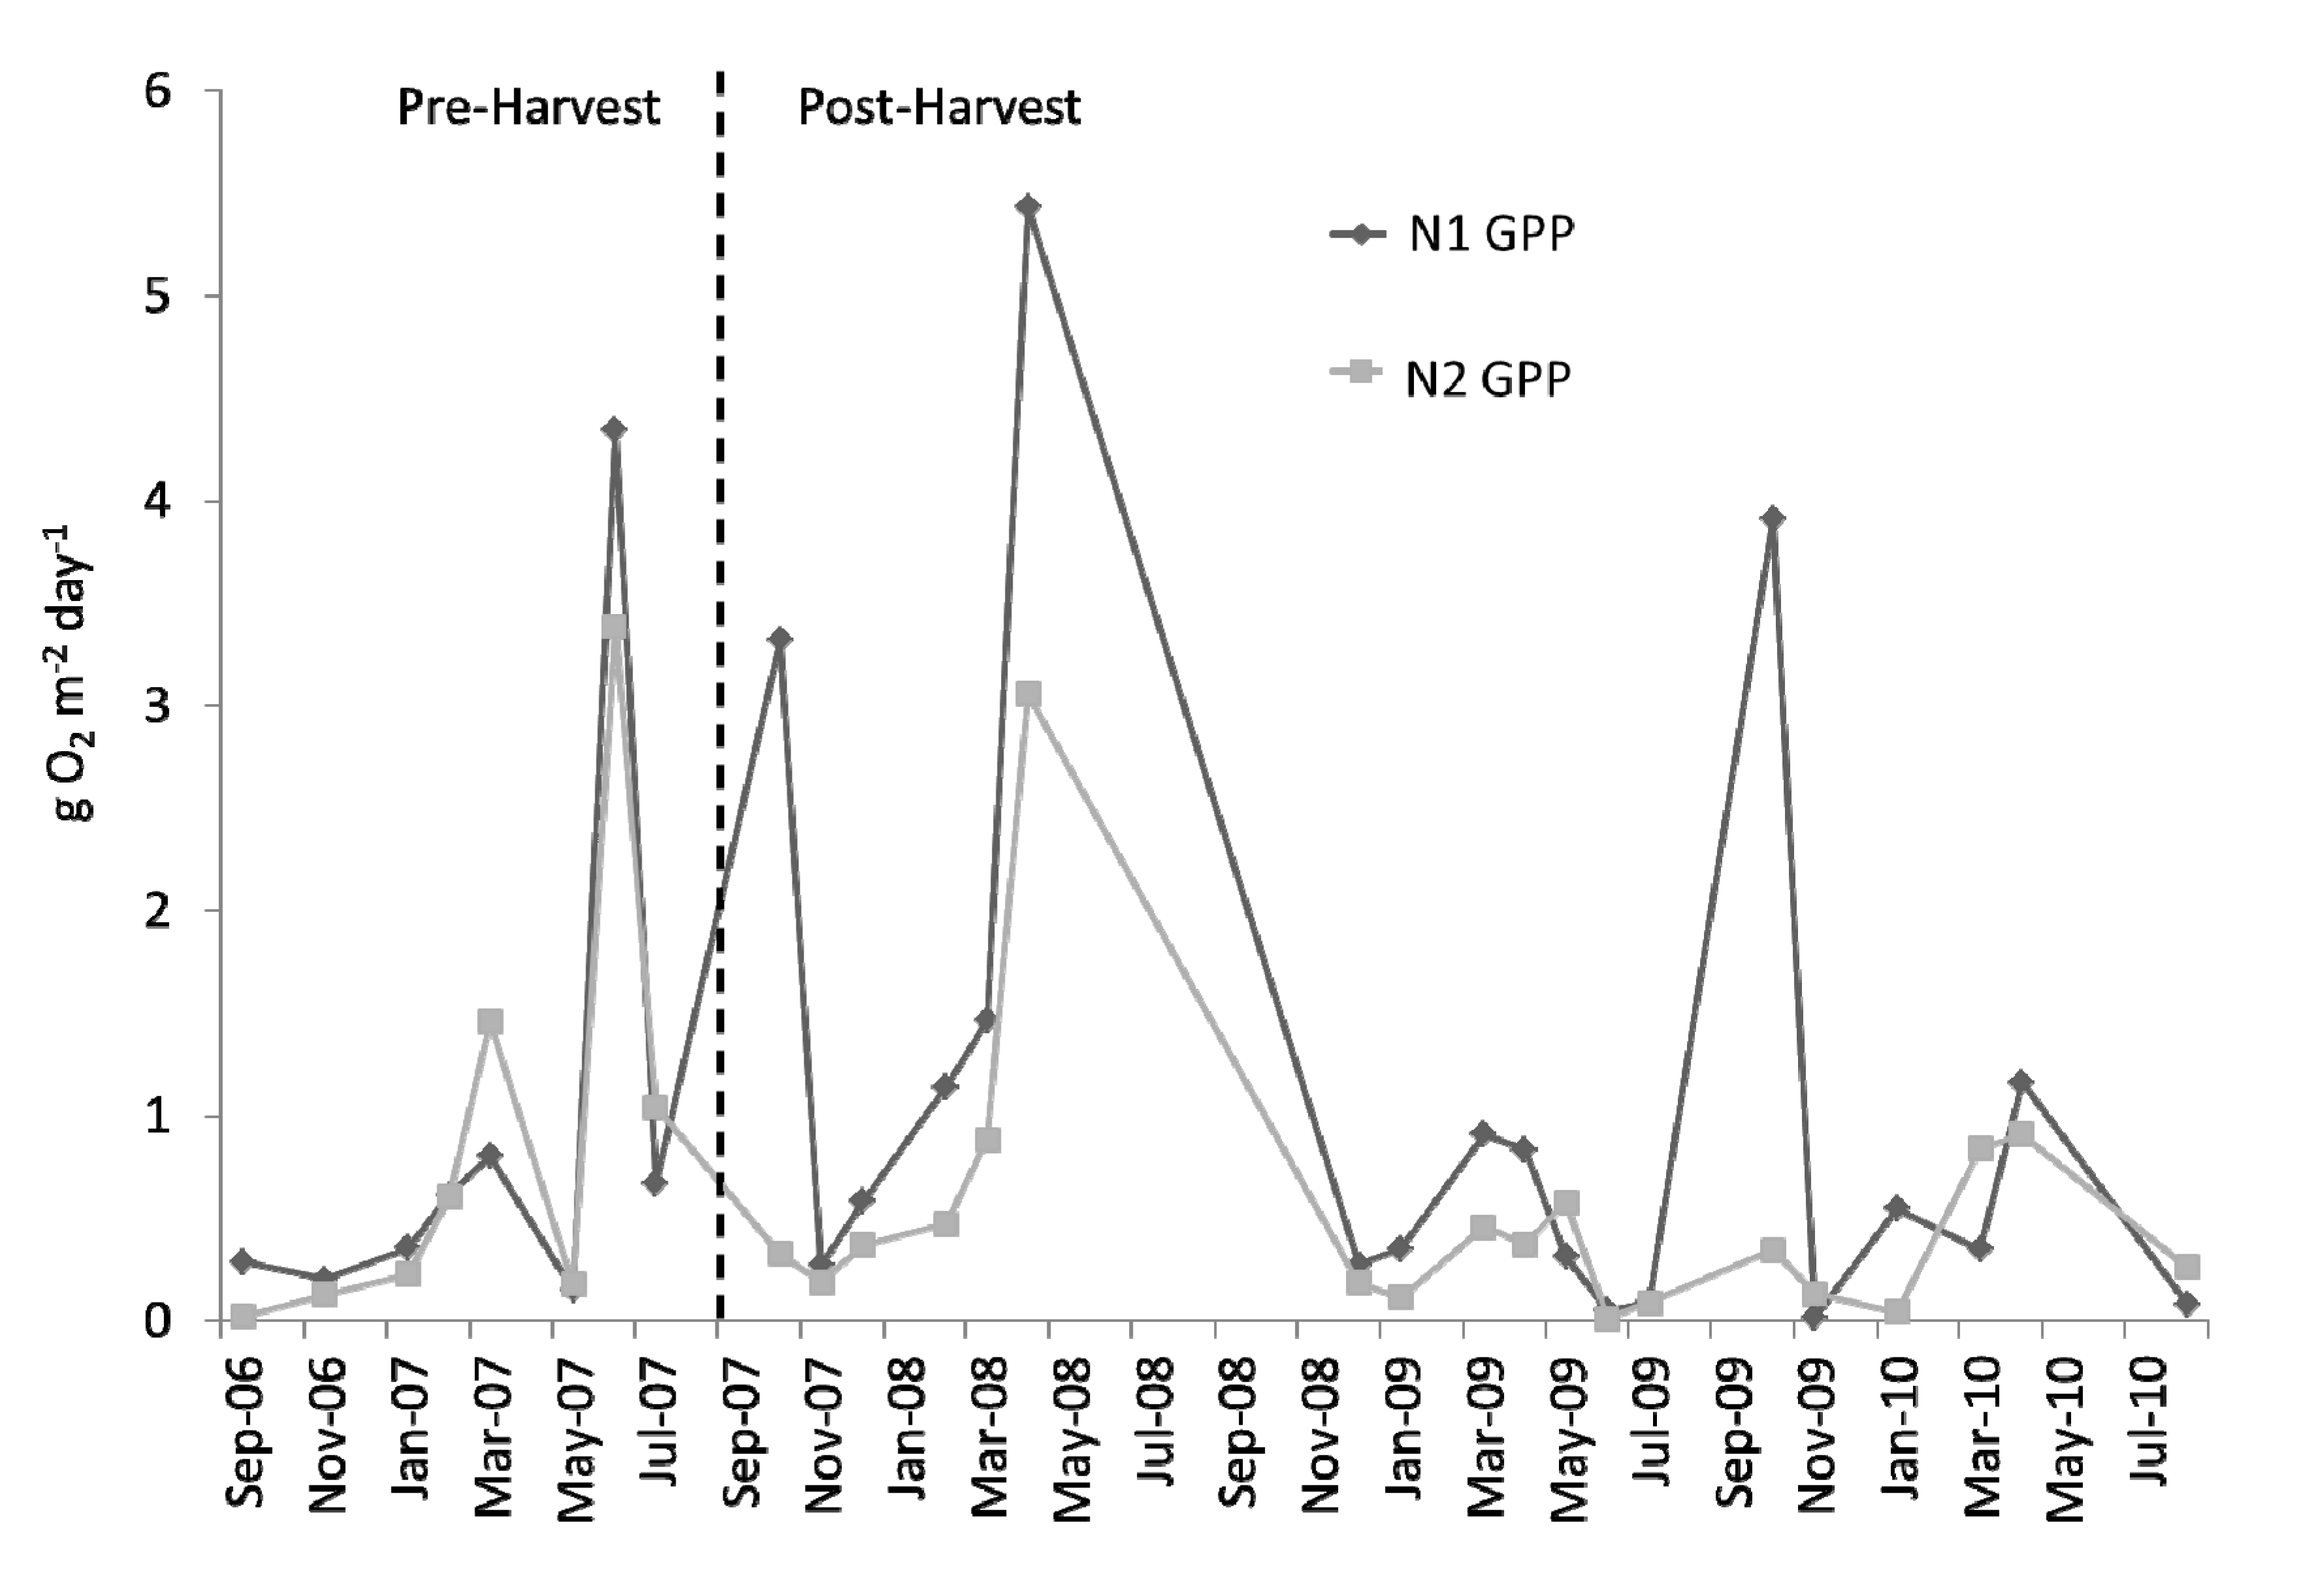
When viewing the monthly means of calculated
GPP before the harvest, there was little apparent separation between N1 and N2 (
Figure 6). There appears to be a greater separation, with higher monthly averages of GPP more often occurring at N1 than at N2, during the post-harvest. Mean monthly rates of
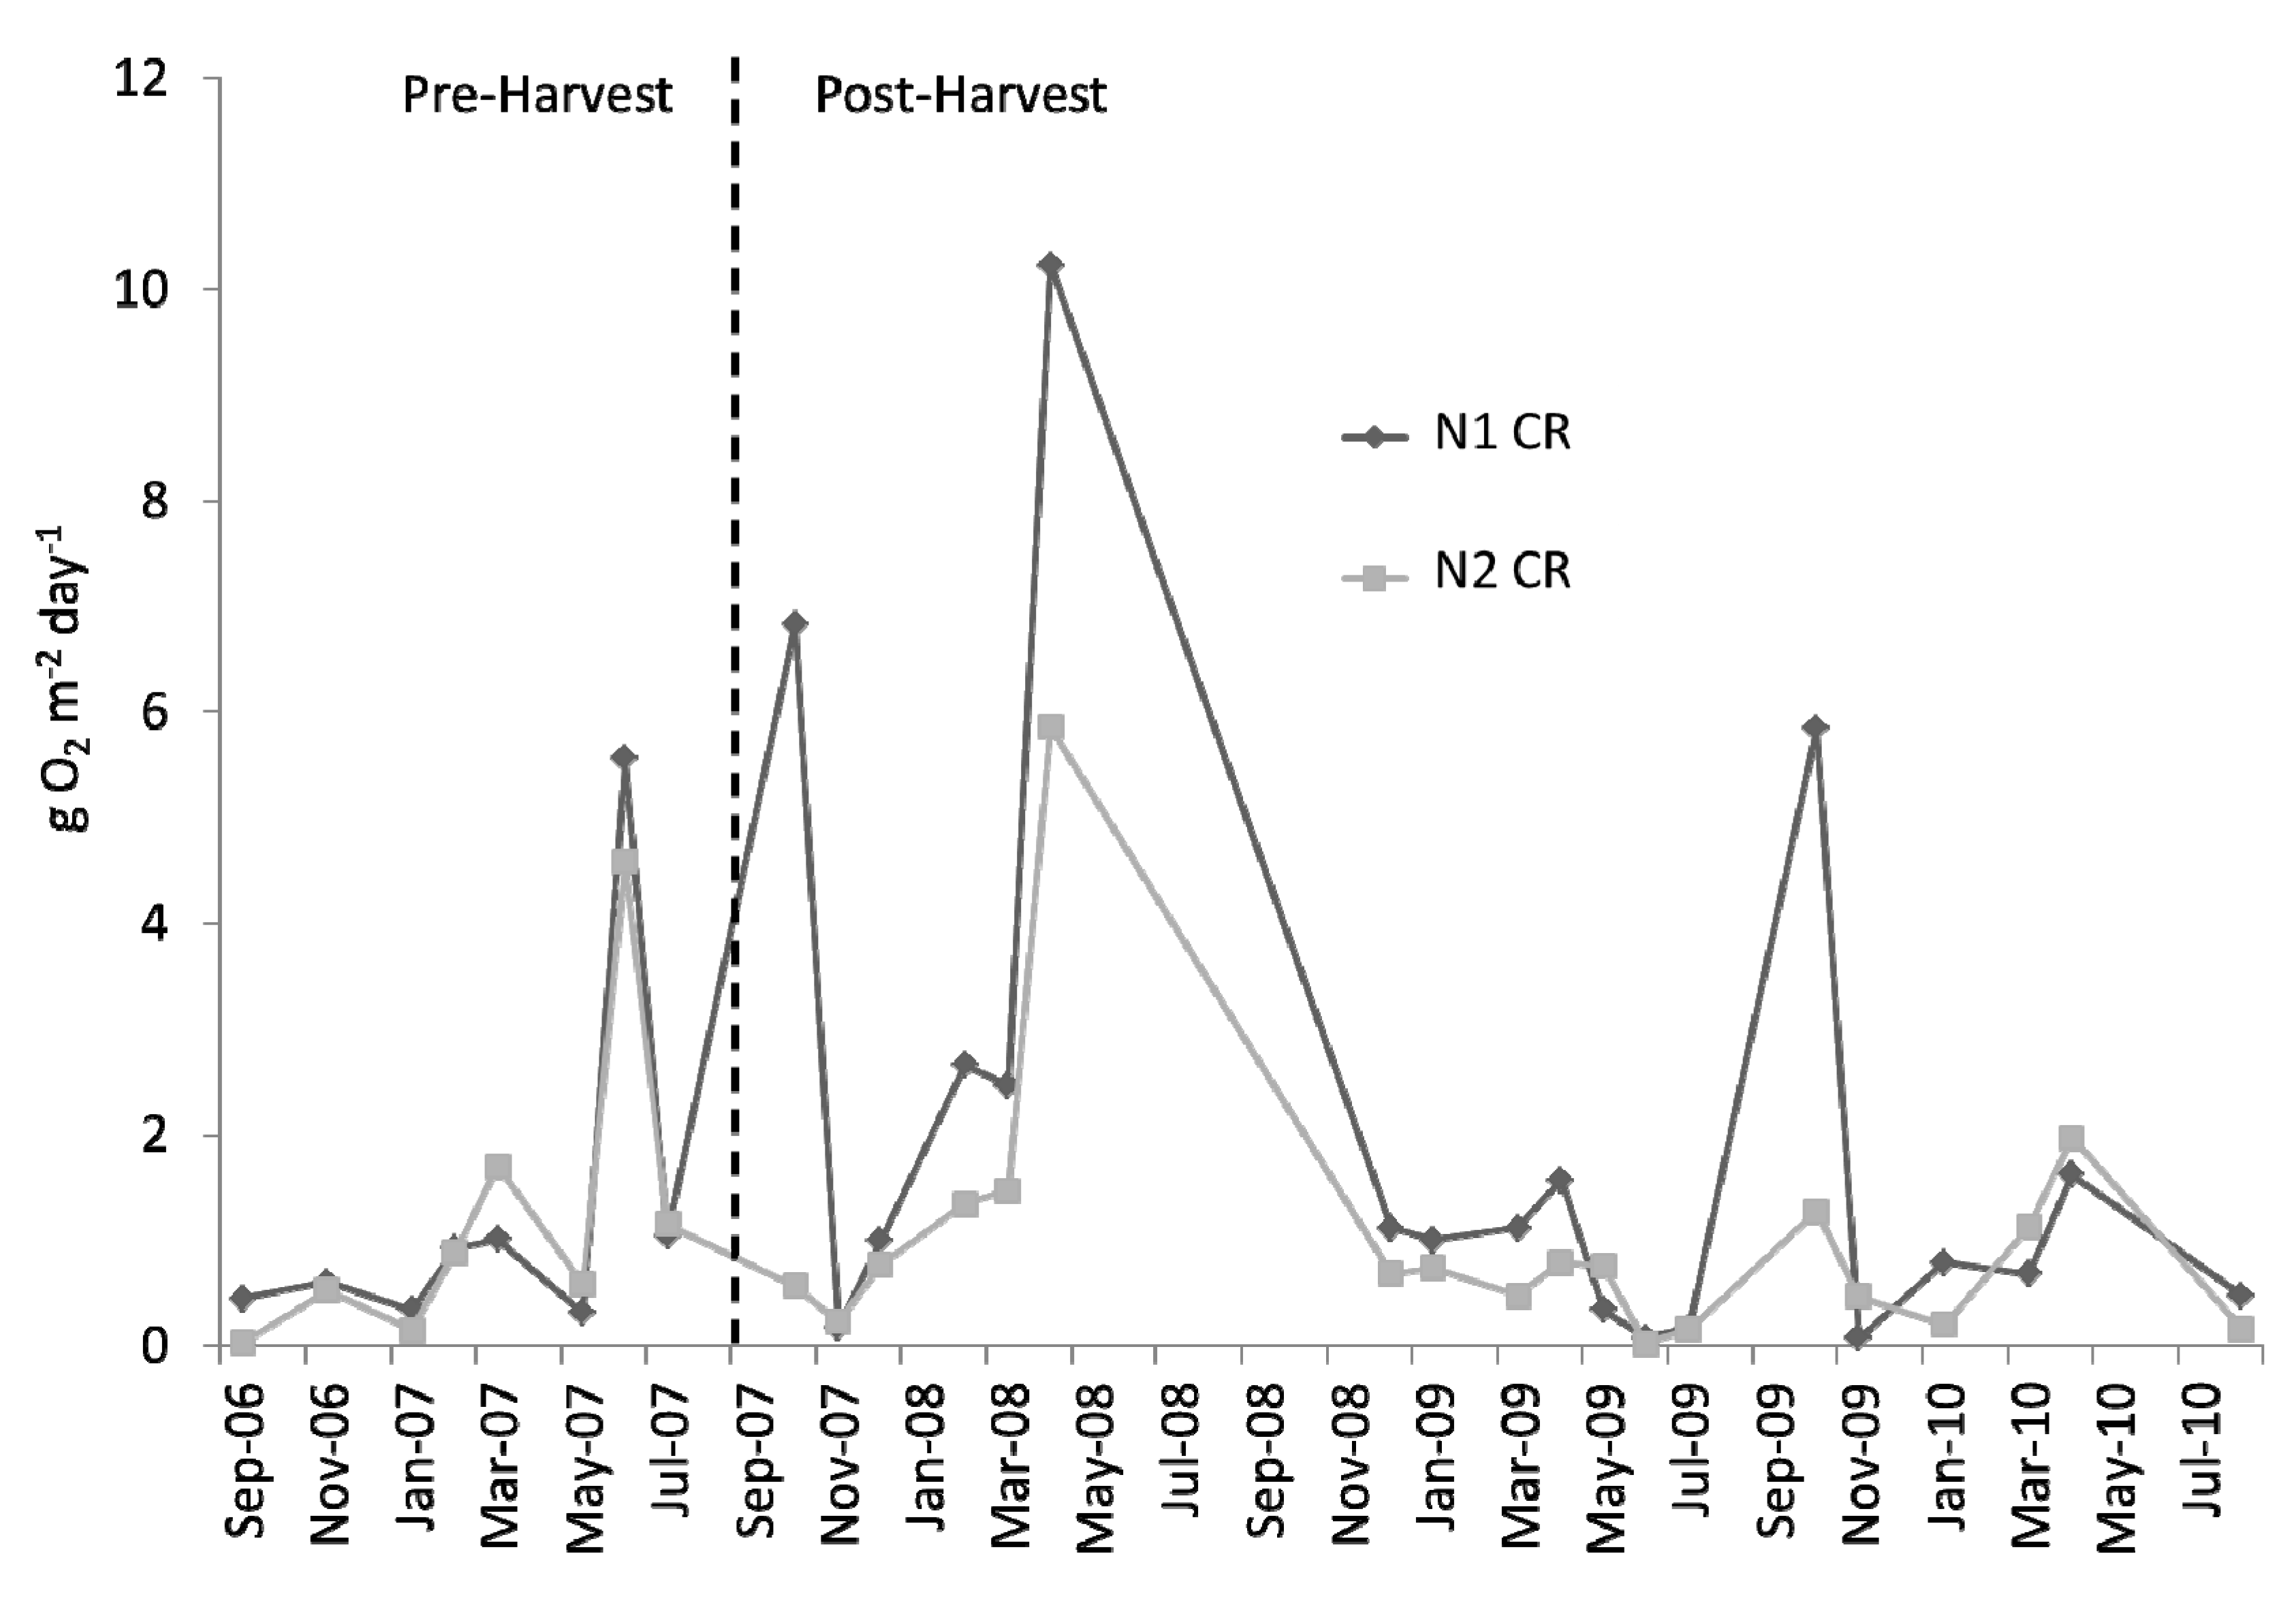
CR also seemed to be quite similar during the pre-harvest, with the same apparent downstream decrease observed during the post-harvest (
Figure 7).
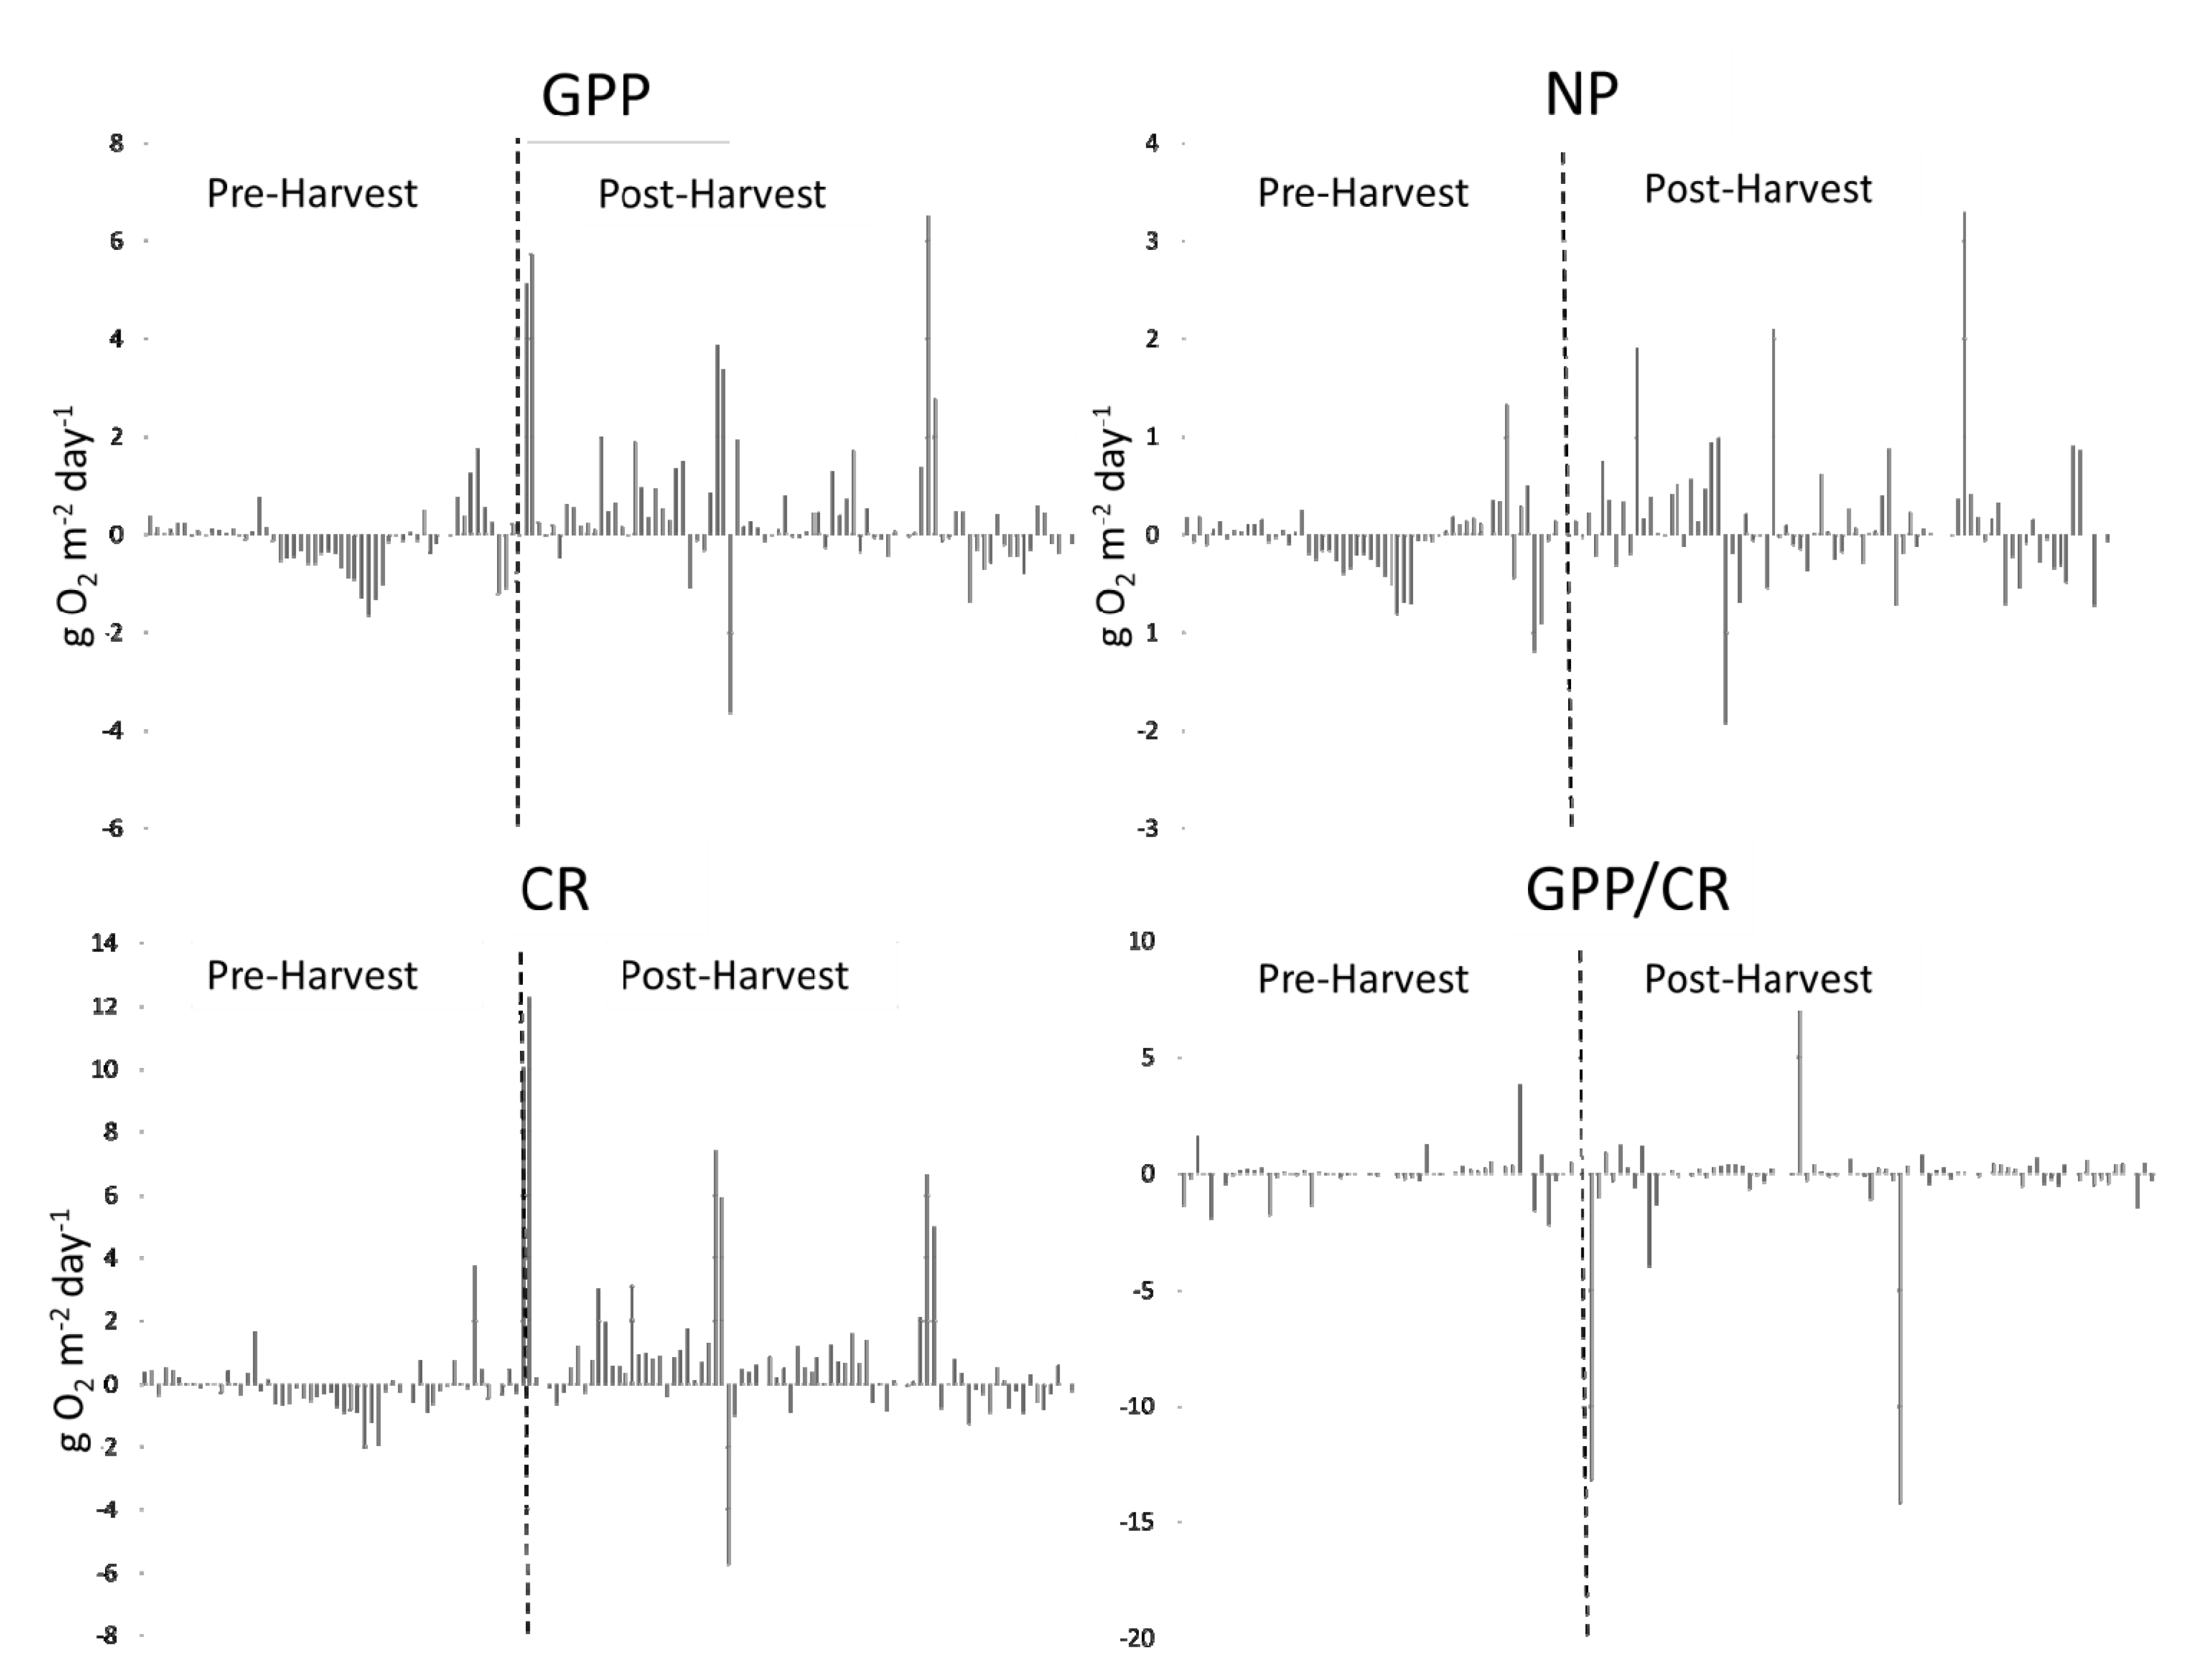
Although there were apparent decreases at N2 relative to N1 in both
GPP and
CR, we did not find these to be significant harvest-induced changes; nor were there significant harvest-caused changes in
NEP or
GPP/CR (
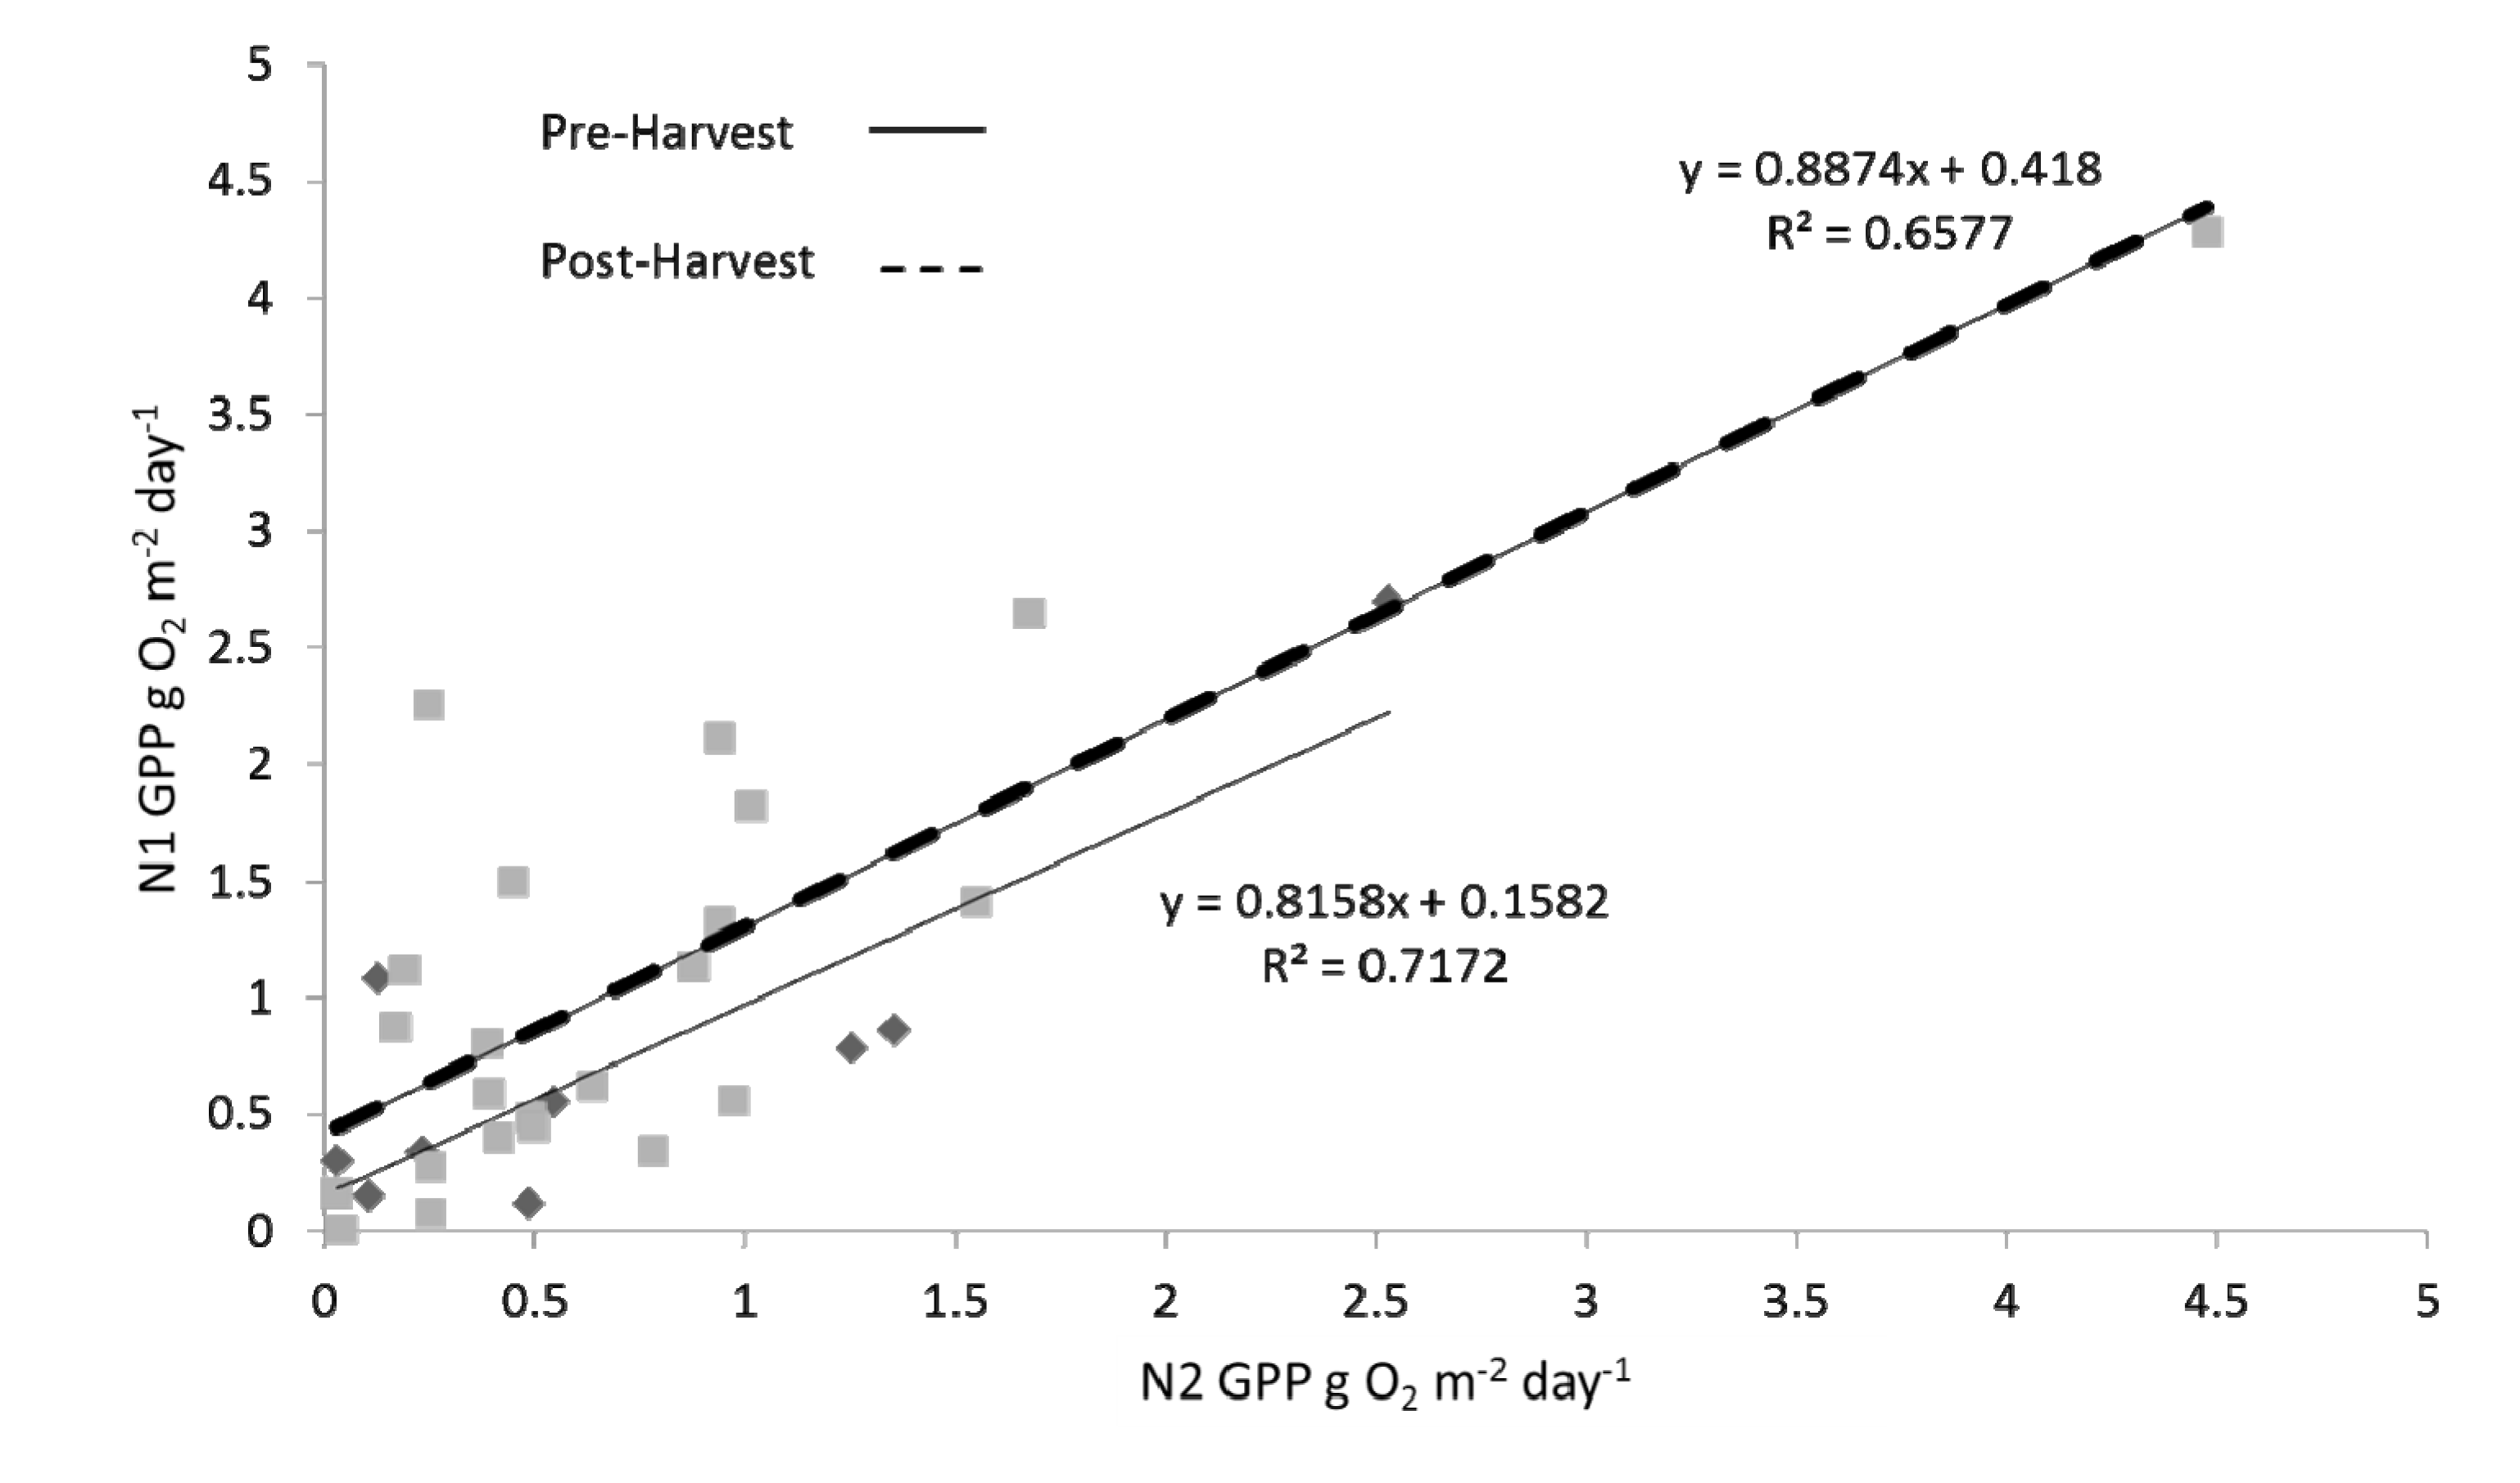
Table 1). A direct comparison of the pre- to post-harvest relationships between upstream and downstream monthly averages of
GPP also resulted in a finding of no significant difference between the two time periods (
Figure 8; ANCOVA; slope ρ = 0.798, y-intercept ρ = 0.165). Relative differences between
GPP,
CR,
NEP, and
GPP/
CR from both N1 and N2 can be compared pre- and post-harvest (
Figure 9).
Figure 6.
Time series of monthly averaged gross primary productivity (GPP; g O2 m−2 day−1) at N1 and N2 over the study period. Harvest is indicated by the vertical, dashed line.
Figure 6.
Time series of monthly averaged gross primary productivity (GPP; g O2 m−2 day−1) at N1 and N2 over the study period. Harvest is indicated by the vertical, dashed line.
Figure 7.
Time series of monthly averaged community respiration (CR; g O2 m−2 day−1) at N1 and N2 over the study period. Harvest is indicated by the vertical, dashed line.
Figure 7.
Time series of monthly averaged community respiration (CR; g O2 m−2 day−1) at N1 and N2 over the study period. Harvest is indicated by the vertical, dashed line.
Table 1.
Means and standard deviations of gross primary productivity (GPP, g O2 m−2 day−1), community respiration (CR, g O2 m−2 day−1), net ecosystem productivity (NEP, g O2 m−2 day−1), and the productivity/respiration ratio (GPP/CR) during both the pre- and post-harvest at N1 and N2 (pre-harvest n = 56 for all variables, post-harvest n = 80 for all variables). Listed p-values taken from the interaction between site (N1 compared with N2) and harvest (pre- compared to post-) (Two-way ANOVAs with interaction; α = 0.05).
| Metabolic Parameters | Pre-Harvest | Post-Harvest | p |
|---|
| N1 | N2 | N1 | N2 |
|---|
| Mean | Std | Mean | Std | Mean | Std | Mean | Std |
|---|
| GPP | 0.99 | 1.99 | 1.03 | 1.71 | 1.34 | 2.61 | 0.88 | 2.07 | 0.352 |
| CR | 1.41 | 3.38 | 1.35 | 2.65 | 2.30 | 4.48 | 1.55 | 3.60 | 0.451 |
| NEP | 0.26 | 0.69 | 0.33 | 0.64 | 0.25 | 0.87 | 0.12 | 0.50 | 0.242 |
| GPP/CR | 0.98 | 1.23 | 1.02 | 1.13 | 0.74 | 1.19 | 1.02 | 2.45 | 0.548 |
Figure 8.
Monthly means of GPP rates (g O2 m−2 day−1) from N1 regressed against monthly means of GPP rates from N2 for both pre-harvest (solid line; diamonds) and post-harvest (dashed line; squares) periods. Differences between the two regression lines, both in slope and in y-intercept, were tested using analyses of covariance; slope ρ = 0.798, y-intercept ρ = 0.165.
As was the case with metabolic rates, monthly turbidity measurements in Turkey Creek were not significantly altered by the timber harvest (pre-harvest means: 23.57 ± 21.8 NTU at N1 and 24.51 ± 15.3 NTU at N2; post-harvest means: 20.58 ± 14.0 NTU at N1 and 23.43 ± 15.0 NTU at N2) (two-way ANOVA with interaction; p = 0.772). Likewise, monthly total suspended solids measurements were not significantly changed by the timber harvest (pre-harvest means: 36.62 mg L−1 ± 40.6 mg L−1 at N1 and 38.24 mg L−1 ± 54.2 mg L−1 at N2; post-harvest means: 18.33 mg L−1 ± 18.8 mg L−1 at N1 and 27.52 mg L−1 ± 43.1 mg L−1 at N2) (two-way ANOVA with interaction; p = 0.632).
Figure 9.
Differences between metabolic variables (N1, N2) over the duration of the study. Pre-harvest and post-harvest data are separated by a vertical, dashed line.
Figure 9.
Differences between metabolic variables (N1, N2) over the duration of the study. Pre-harvest and post-harvest data are separated by a vertical, dashed line.
3.3. Non-Timber Harvesting Factors
The regression tests between daily average water temperature and metabolic rates at N1 resulted in the following: GPP (n = 136, ρ = 0.002, R2 = 0.071), CR (n = 136, ρ = 0.003, R2 = 0.063), NEP (n = 136, ρ = 0.683, R2 = 0.001), and GPP/CR (n = 136, ρ = 0.556, R2 = 0.003).
At N1, mean GPP was significantly lower in winter (December–February; 0.503 g O2 m−2 day−1) than in spring (March–May; 1.046 g O2 m−2 day−1), summer (June–August; 1.202 g O2 m−2 day−1), and fall (September–November; 1.140 g O2 m−2 day−1), and there were no other significant differences among these seasons (Test of fixed effects, negative binomial and log combination; p = 0.006). At this reference site, mean CR was significantly lower in winter (0.863 g O2 m−2 day−1) than in spring (1.609 g O2 m−2 day−1), but not significantly lower than in summer (1.582 g O2 m−2 day−1) or fall (1.564 g O2 m−2 day−1) (Test of fixed effects, negative binomial and log combination; p = 0.023). Neither NEP nor GPP/CR means differed significantly by season (tests of fixed effects, negative binomial and log combination; α= 0.05).
4. Discussion
The single-station method has been widely used in stream metabolism calculation and is proved to be suitable for stream reaches that do not include large differences in metabolism [
45]. In this study, we originally attempted to calculate the reaeration coefficient using the nighttime regression method developed by Hornberger and Kelly [
46] and expounded by Izagirre
et al. [
45]. The method calls for plotting the nighttime decrease in DO against the oxygen saturation deficit. When fitted to the linear trend of these data, the regression line enables an estimate of both the reaeration coefficient and CR. However, the method ultimately proved unsuccessful for our stations because of unrealistically high values of NEP. We also considered calculating the reaeration coefficient using the delta method described by Chapra and Di Toro [
14], and McBride and Chapra [
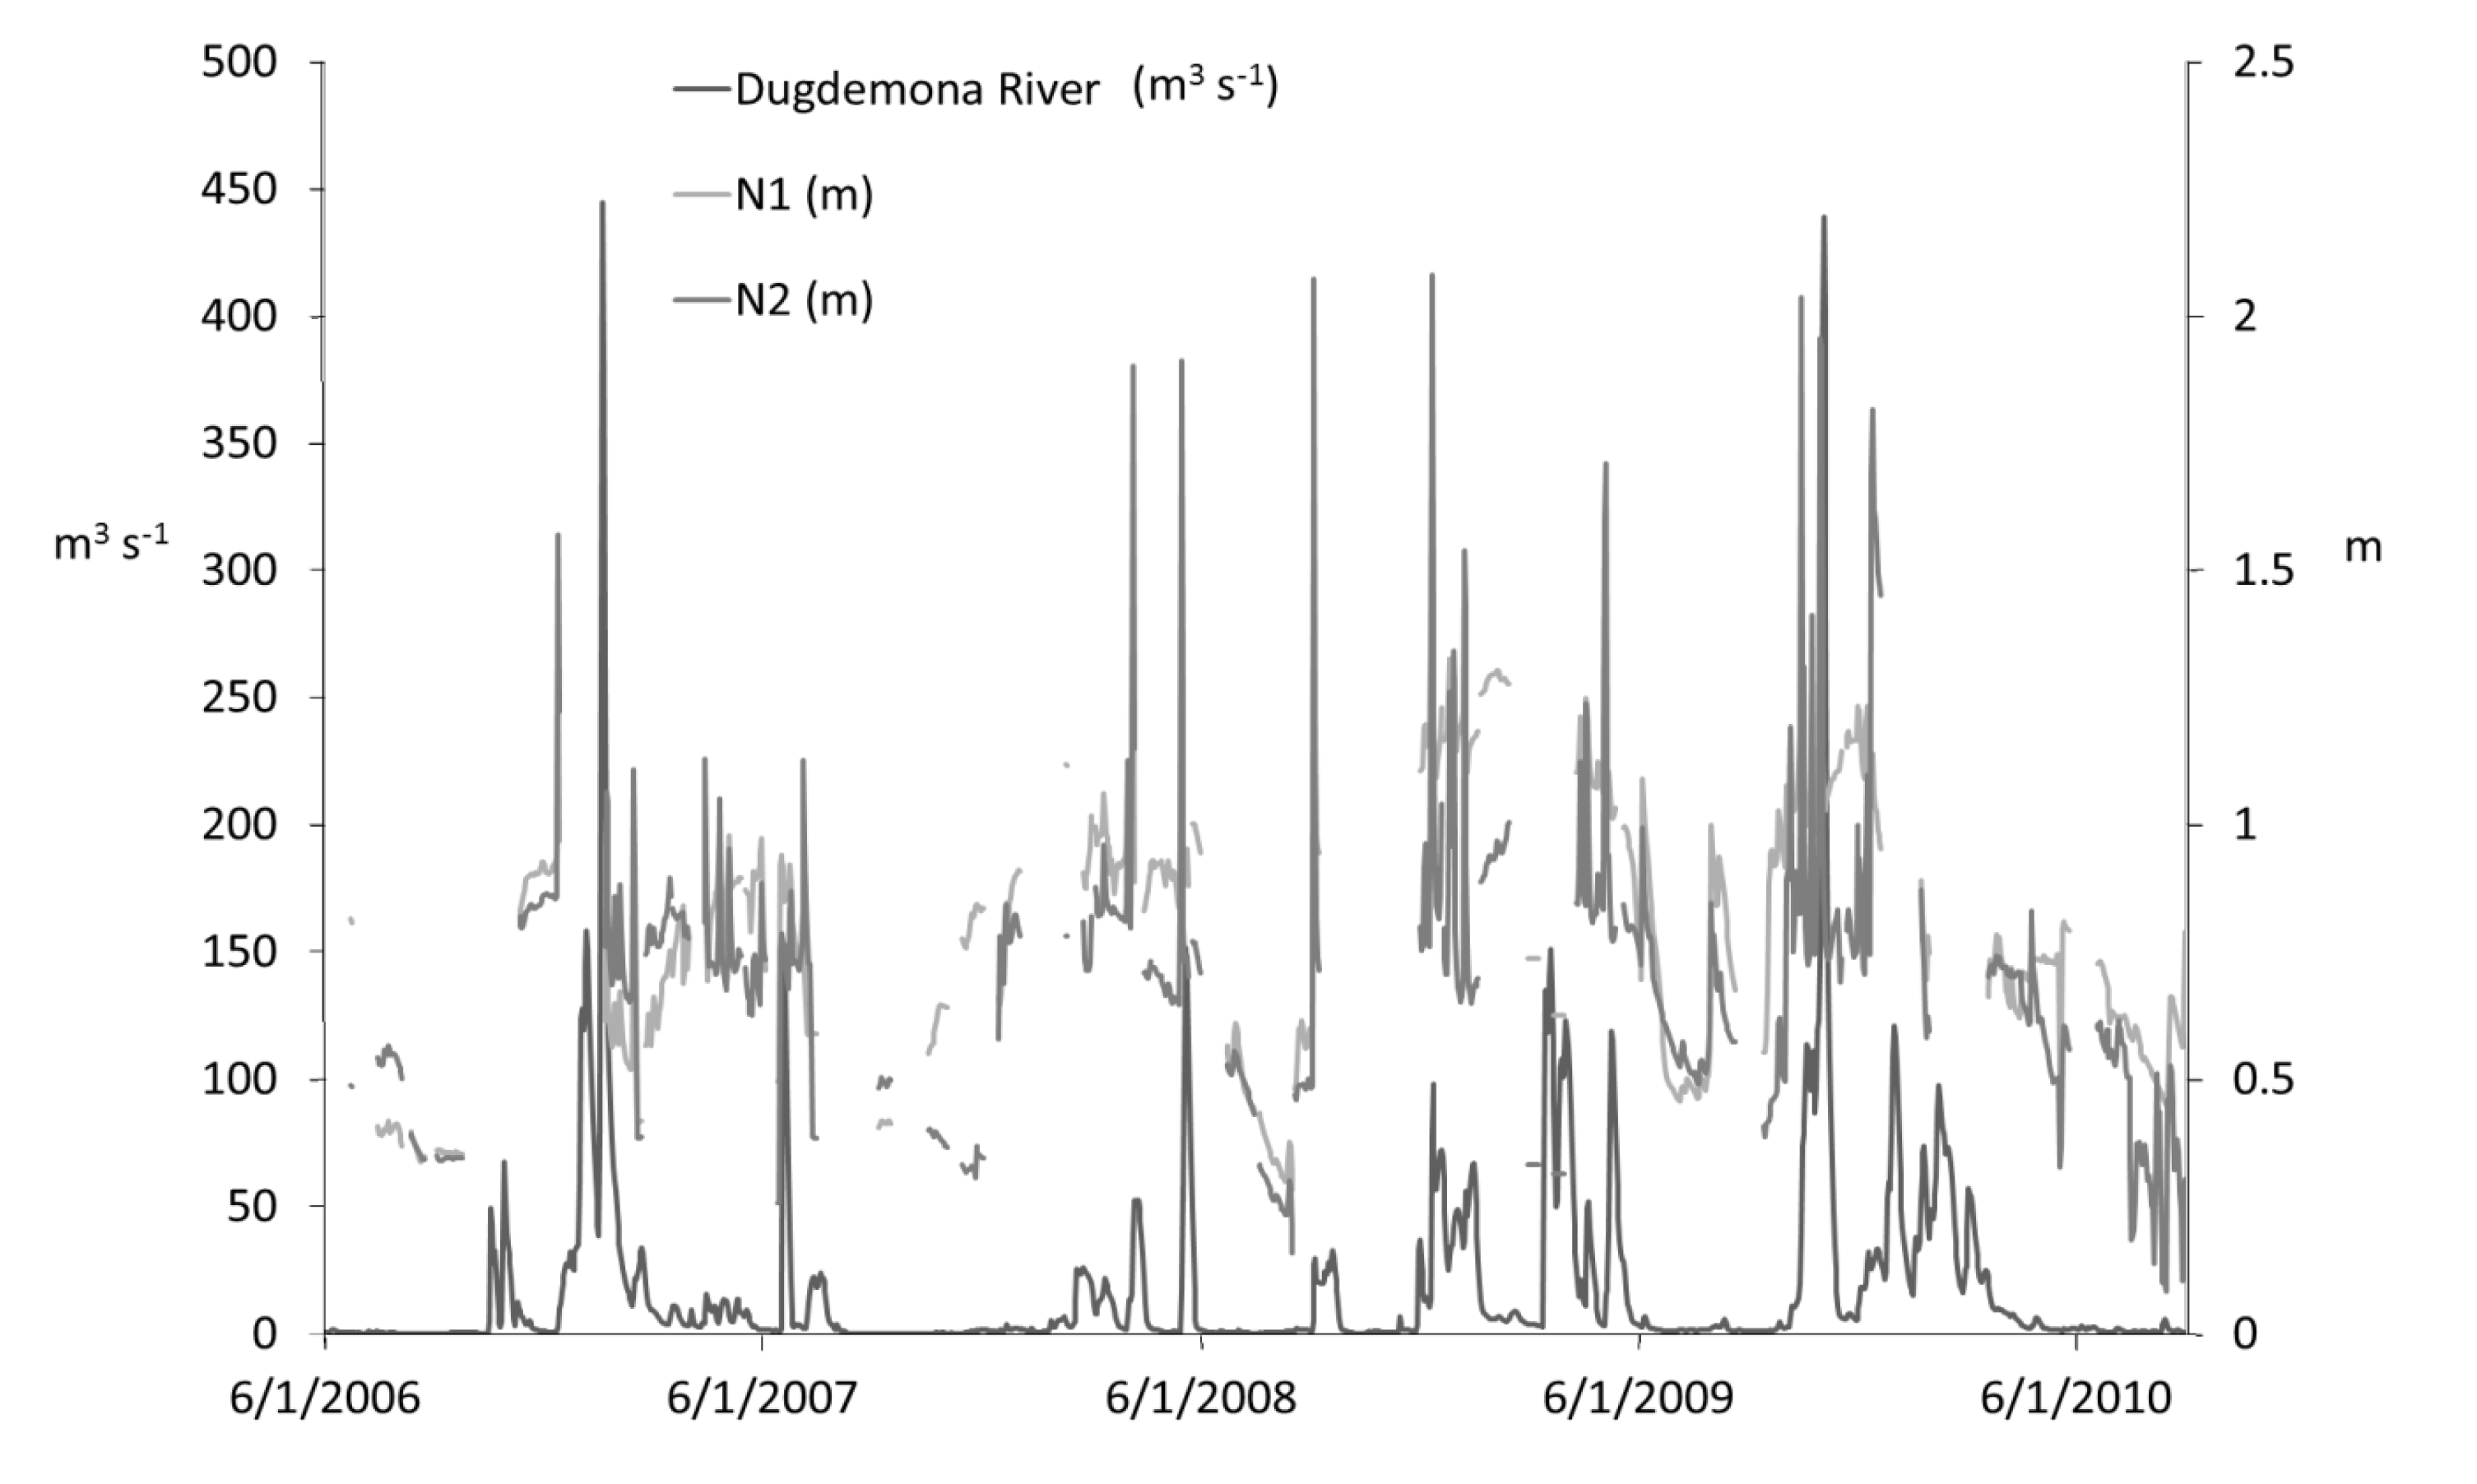
47]. This method uses reaeration rate as a function of photoperiod length and the time from solar noon to minimum DO deficit, which for this method to work, should occur sometime before sunset. In our study, the minimum DO deficit at the upstream site (N1) fell between solar noon and sunset only about 30% of the time, while the minimum DO deficit at the downstream site (N2) fell between solar noon and sunset closer to 40% of the time. Other possible methods were discounted due to unavailability of measurements of any tracer gas or daily discharge. Though we did not have daily discharge at sites N1 and N2, a comparison of mean daily depths at each site can be made with the mean daily discharge from a USGS gaging station on the nearby Dugdemona River (latitude 31°56'13.44'' N, longitude 92°36'11.22'' W), approximately 23.5 km south-east of our study site, over the four-year study period (
Figure 10). This again shows that cutting higher-depths should also eliminate days with the highest stream velocity (discharge is directly proportional to velocity), and therefore reaeration.
Figure 10.
Time series of mean daily discharge (m3 s−1) at the Dugdemona River USGS gaging station (approximately 23.5 km south-east of our study site; latitude 31°56'13.44'' N, longitude 92°36'11.22'' W), along with mean daily depths (m) at sites N1 and N2 from June 2006 to August 2010.
Figure 10.
Time series of mean daily discharge (m3 s−1) at the Dugdemona River USGS gaging station (approximately 23.5 km south-east of our study site; latitude 31°56'13.44'' N, longitude 92°36'11.22'' W), along with mean daily depths (m) at sites N1 and N2 from June 2006 to August 2010.
Any error from the discounting of reaeration is assumed to have equally affected both N1 and N2 metabolic calculations, and given that the goal of this study was to test for stream metabolic changes from a timber harvest with Louisiana’s current BMPs, we believe this method allowed for accurate testing of timber-harvesting effect. Additionally, the stream in our study had extremely low velocity throughout much of the year, and therefore, utilization of
DO data only from the low flow period minimized the error in calculating stream metabolism without considering reaeration from water movement. A similar approach was used in calculating metabolism for estuaries [
41], and for wetlands [
48].
4.2. Timber Harvesting Effect
In their investigation of disturbance effects on stream metabolism, Mulholland
et al. [
8] found that as catchment disturbance level increases (in %),
GPP and
CR decrease. The streams studied in Fort Benning, Georgia, are highly similar to Turkey Creek in climate (humid subtropical), topography (low gradient), and stream substrate (highly organic). In their study, intensive erosion from US Army training areas and unpaved roads contributed the most to water quality degradation, burying benthic organic matter and creating low organic matter-containing, unstable bottom sediments. In observing specific road construction regulations and leaving an SMZ of 11.4 m
2 ha
−1 (with a minimum width of 15.2 m from the stream) in accordance with Louisiana’s current BMPs, the 2007 Turkey Creek timber harvest acted to prevent similarly high levels of sediment runoff [
53] like those seen at the Fort Benning sites. The results from this study indicate that logging using current BMPs had modest, if any, impact on the metabolism of Turkey Creek.
Young
et al. [
54] proposed a three-level impairment scale for streams and river: (1) in “good health” when
GPP is in the range of 0.8 to 4.0 g O
2 m
−2 day
−1 and
CR is in the range of 1.5 to 5.5 g O
2 m
−2 day
−1; (2) in “satisfactory health” when
GPP is <0.8 or 4.0 to 8.0 and
CR 0.7 to 1.5 or 5.5 to 10.0; and (3) in “poor health” when
GPP >8.0 and
CR <0.7 or >10.0 g O
2 m
−2 day
−1 [
43]. According to metabolic averages at both N1 and N2, and based on this impairment scale, the Turkey Creek system in our study can be considered to have been in good health, both before and after the timber harvest. However, without the ability to incorporate reaeration, our ability to make assumptions regarding overall stream health is limited. In addition,
DO concentrations below 5 mg L
−1 for more than 70% of the time should be taken into account when considering impairment.
4.3. Non-Timber Harvest Influences
CR can be influenced by water temperature [
29,
55]. Demars
et al. [
29] found a strong positive correlation between
CR and temperature, concluding that with a 5 °C warming in global temperature, increased
CR would lead to a near doubling of global stream carbon emissions to the atmosphere. Unlike the findings of Demars
et al. [
29], no particularly strong correlation between daily averages of water temperature and rates of
CR at our study site was found, although this may be due to the very different climatic and stream morphological conditions; our study area is characterized by a humid subtropical climate, while the study by Demars
et al. [
29] was conducted in a cold tundra region. Central Louisiana has a mild winter and the temperature of Turkey Creek is mostly between 15 and 25 °C throughout the year. The effect of temperature on our observed rates of
CR cannot be separated from seasonal physical and chemical variations (e.g., leaf emergence, nutrient fluctuations) as Demars
et al. [
29] were able to do by having simultaneous data from both a cold stream and a stream influenced by geothermal heat.
In addition to the possible temperature effects,
CR has been shown to be influenced by dissolved organic carbon, and organic carbon bound up in the benthic stream sediment [
55]. In a study investigating sediment respiration in the Hubbard Brook Experimental Forest, Hedin [
55] found that both water temperature and water column dissolved organic carbon played roles in determining rates of respiration, though neither was as influential as the type of organic carbon in the benthos. Hedin [
55] found that forested streams generally acquire their organic matter from woody debris and other terrestrial inputs that lead to a higher fiber content and a slower breakdown than in systems that receive most of their organic carbon from autochthonous production, such as lakes and estuaries. Our results agree with his findings, as there appeared to be high quantities of woody debris in the stream channel of Turkey Creek (field observations), although rates of
CR were relatively low (≤2 g O
2 m
−2 day
−1 for 81% of the time at N1 and 87% of the time at N2
CR).
Other studies have found that seasonal effects play a role in determining rates of
GPP and
CR [
56,
57]. In a Danish river metabolism study conducted by Mahlon
et al. [
56], productivity varied seasonally much in the same way that our results showed; annually, the authors reported minimum rates of primary productivity in the winter, with the maximum occurring in early summer. Their study also found fall and spring to be “transitional periods” between the highest productivity, in the summer, and the lowest, in the winter. A study by Uehlinger [
57] found that seasonal effects could account for as much as 50% of metabolic variation. Mean rates of
CR and
GPP in Turkey Creek peaked in the spring and summer, respectively. This range of months, from March through August, has a greater photoperiod than September through February in the northern hemisphere. Another factor possibly acting alone or in conjunction with daylight hours would be water temperature, although the correlation between daily-averaged water temperature and metabolic rates was not seen in Turkey Creek.


