4.1. Hydrochemical Characteristics
Analysis of the 13 hydrochemical variables of phreatic water in the study area is summarized in
Table 1. The water samples were weakly alkaline, with a pH range of 7.71–8.38. Concentrations of the principal ions varied greatly, with coefficients of variation varying from 0.4 to 1.9, especially Na
+, Mg
2+, SO
42− and Cl
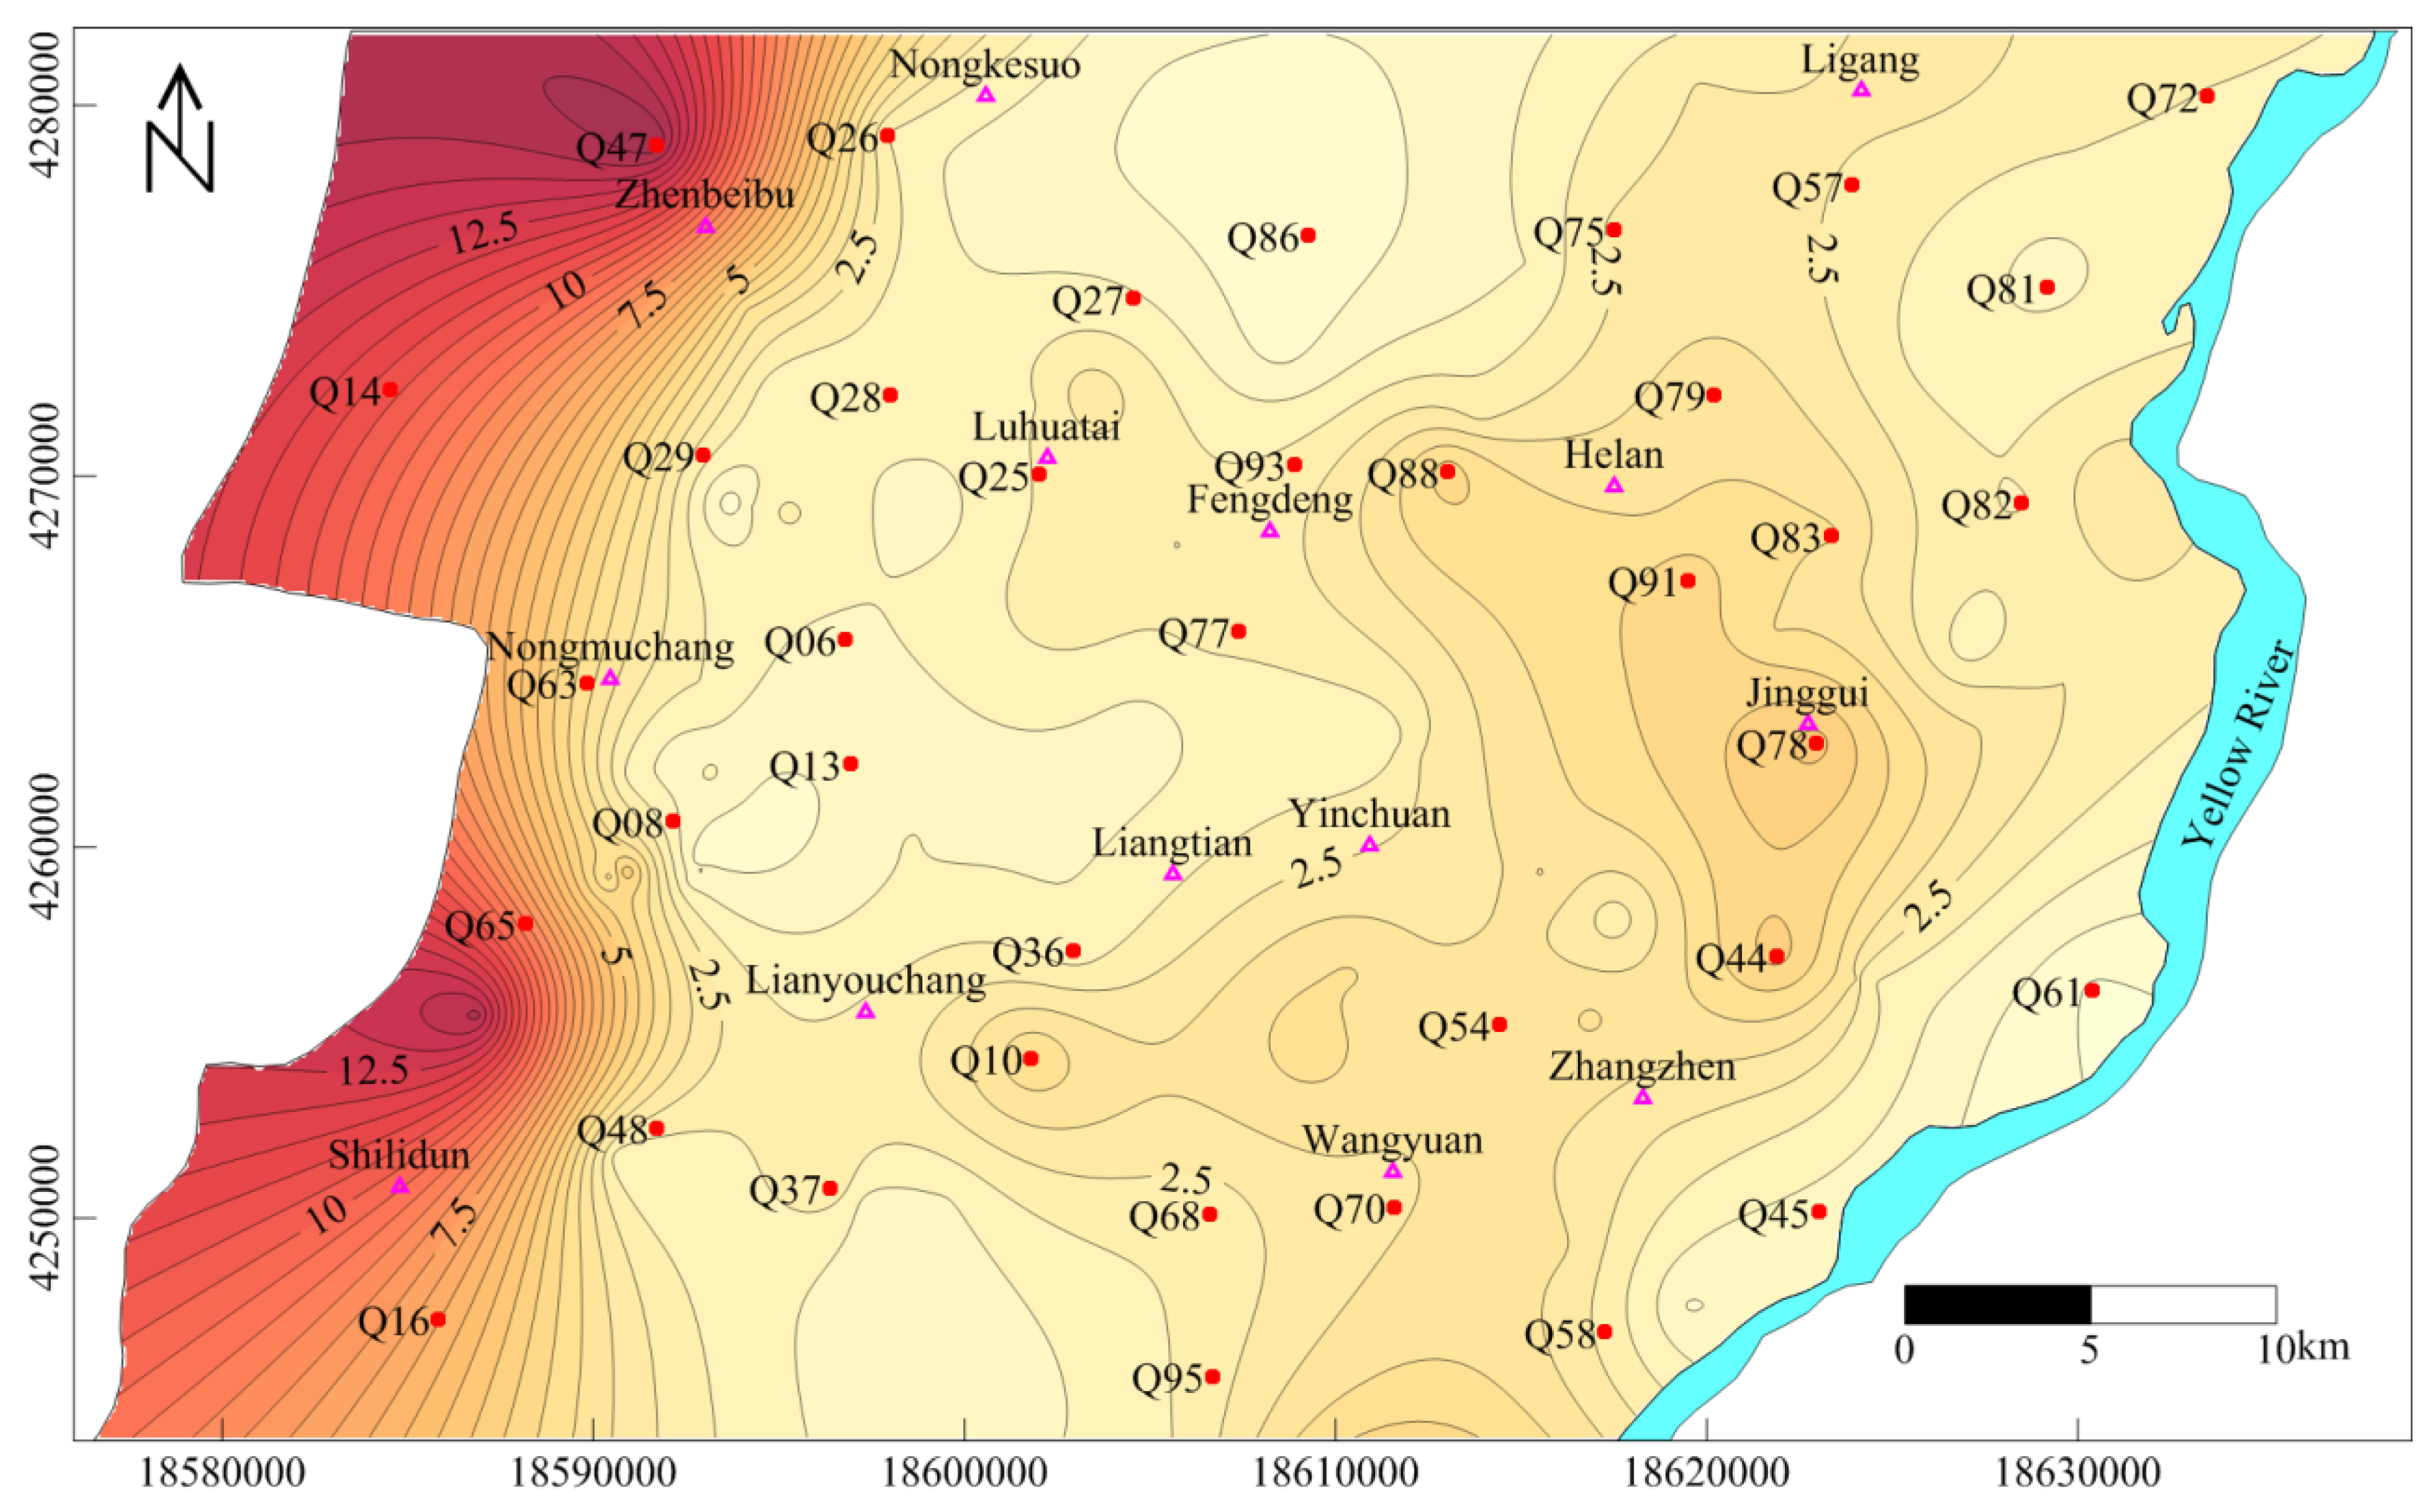
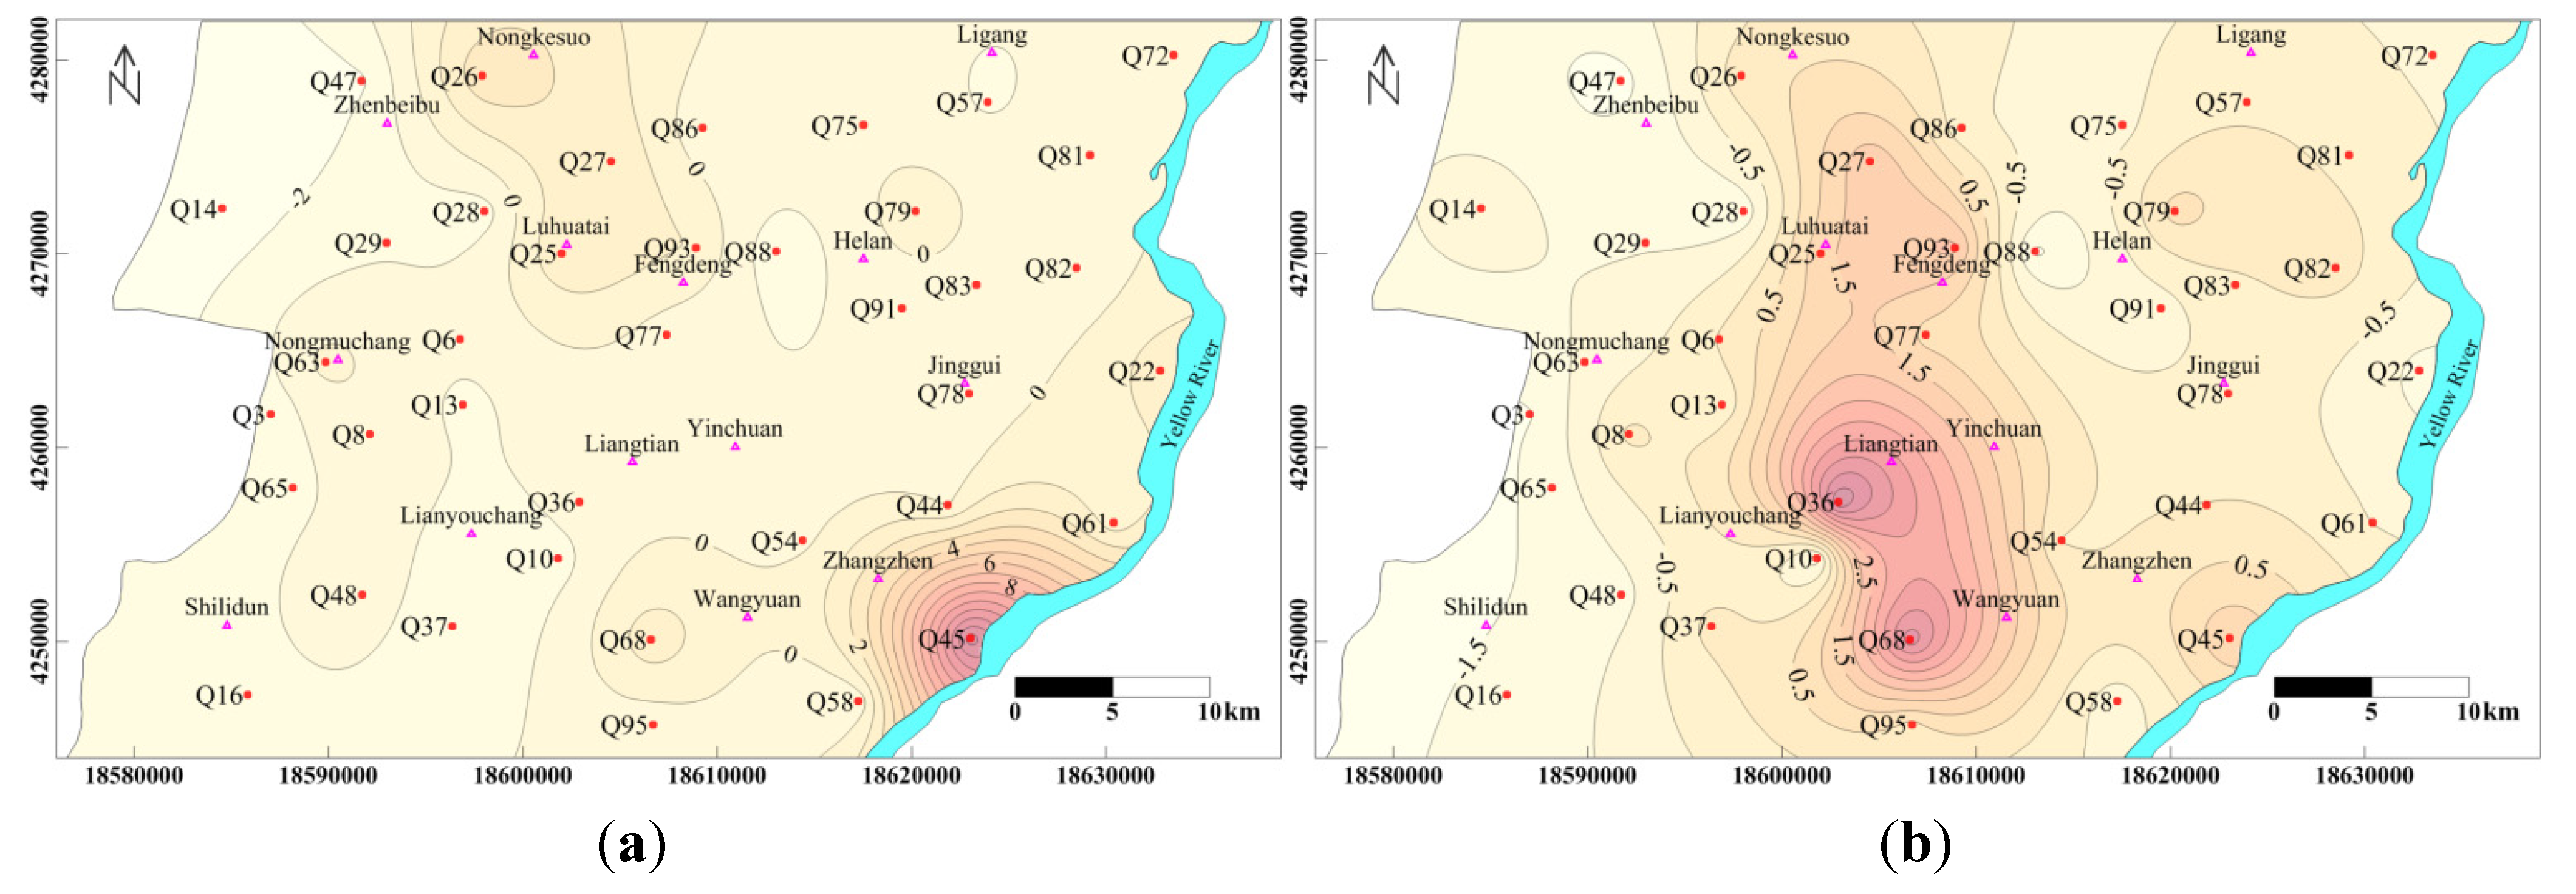
−. For example, the concentration of TDS varied from 272 to 5664 mg/L (mean 1065 mg/L). Measures of all major ions exceeded China’s acceptable limits for groundwater quality (Bureau of Quality and Technical Supervision of China 1994). Most samples from the central and eastern parts of the study area had high TDS values above 1000 mg/L, along the Yellow River (
Figure 5a), indicating they are unsuitable for drinking. TH measured as CaCO
3 varied from 146 to 2845 mg/L, (mean 509 mg/L), and exceeded 450 mg/L in most areas (except the west and small parts of the central study area), suggesting very hard water that is unsuitable for drinking (
Figure 5b). Generally, the groundwater from the samples at higher elevation contained mostly Ca
2+ and HCO
3−, and the concentrations of Na
+, SO
42− and Cl
− increased at lower elevations due to mineral dissolution along the paths of groundwater flow [
5].
Table 1.
Descriptive statistics of hydrochemistry in Yinchuan, China.
Table 1.
Descriptive statistics of hydrochemistry in Yinchuan, China.
| Parameters | Phreatic water | Yellow river | National standard |
|---|
| Category | Minimum | Maximum | Mean | SD | CV | / | / |
|---|
| pH | 7.71 | 8.38 | 8.08 | 0.11 | 0.01 | 8.10 | 6.5–8.5 |
| TH | 146 | 2845 | 509 | 417 | 0.8 | 245 | 450 |
| TDS | 272 | 5664 | 1065 | 885 | 0.8 | 386 | 1000 |
| Ca2+ | 23.0 | 439.7 | 83.9 | 66.3 | 0.8 | 53.8 | _ |
| Mg2+ | 23.3 | 509 | 85.7 | 81.4 | 0.9 | 27.9 | _ |
| K+ | 1.5 | 17.0 | 4.9 | 3.4 | 0.7 | 3.0 | _ |
| Na+ | 24.0 | 860 | 181 | 167 | 0.9 | 43.0 | 200 |
| Cl- | 27.6 | 2592 | 222 | 406 | 1.8 | 55.2 | 250 |
| SO42+ | 35.2 | 986 | 214 | 184 | 0.9 | 83.6 | 250 |
| HCO3- | 220 | 1106 | 501 | 210 | 0.4 | 207 | _ |
| NO3- | 0.0 | 21 | 2.1 | 4.4 | 2.0 | _ | 20 |
| NH4+ | 0.0 | 1.0 | 0.1 | 0.2 | 4.1 | _ | 0.20 |
| F- | 0.1 | 1.2 | 0.3 | 0.2 | 0.9 | _ | 1 |
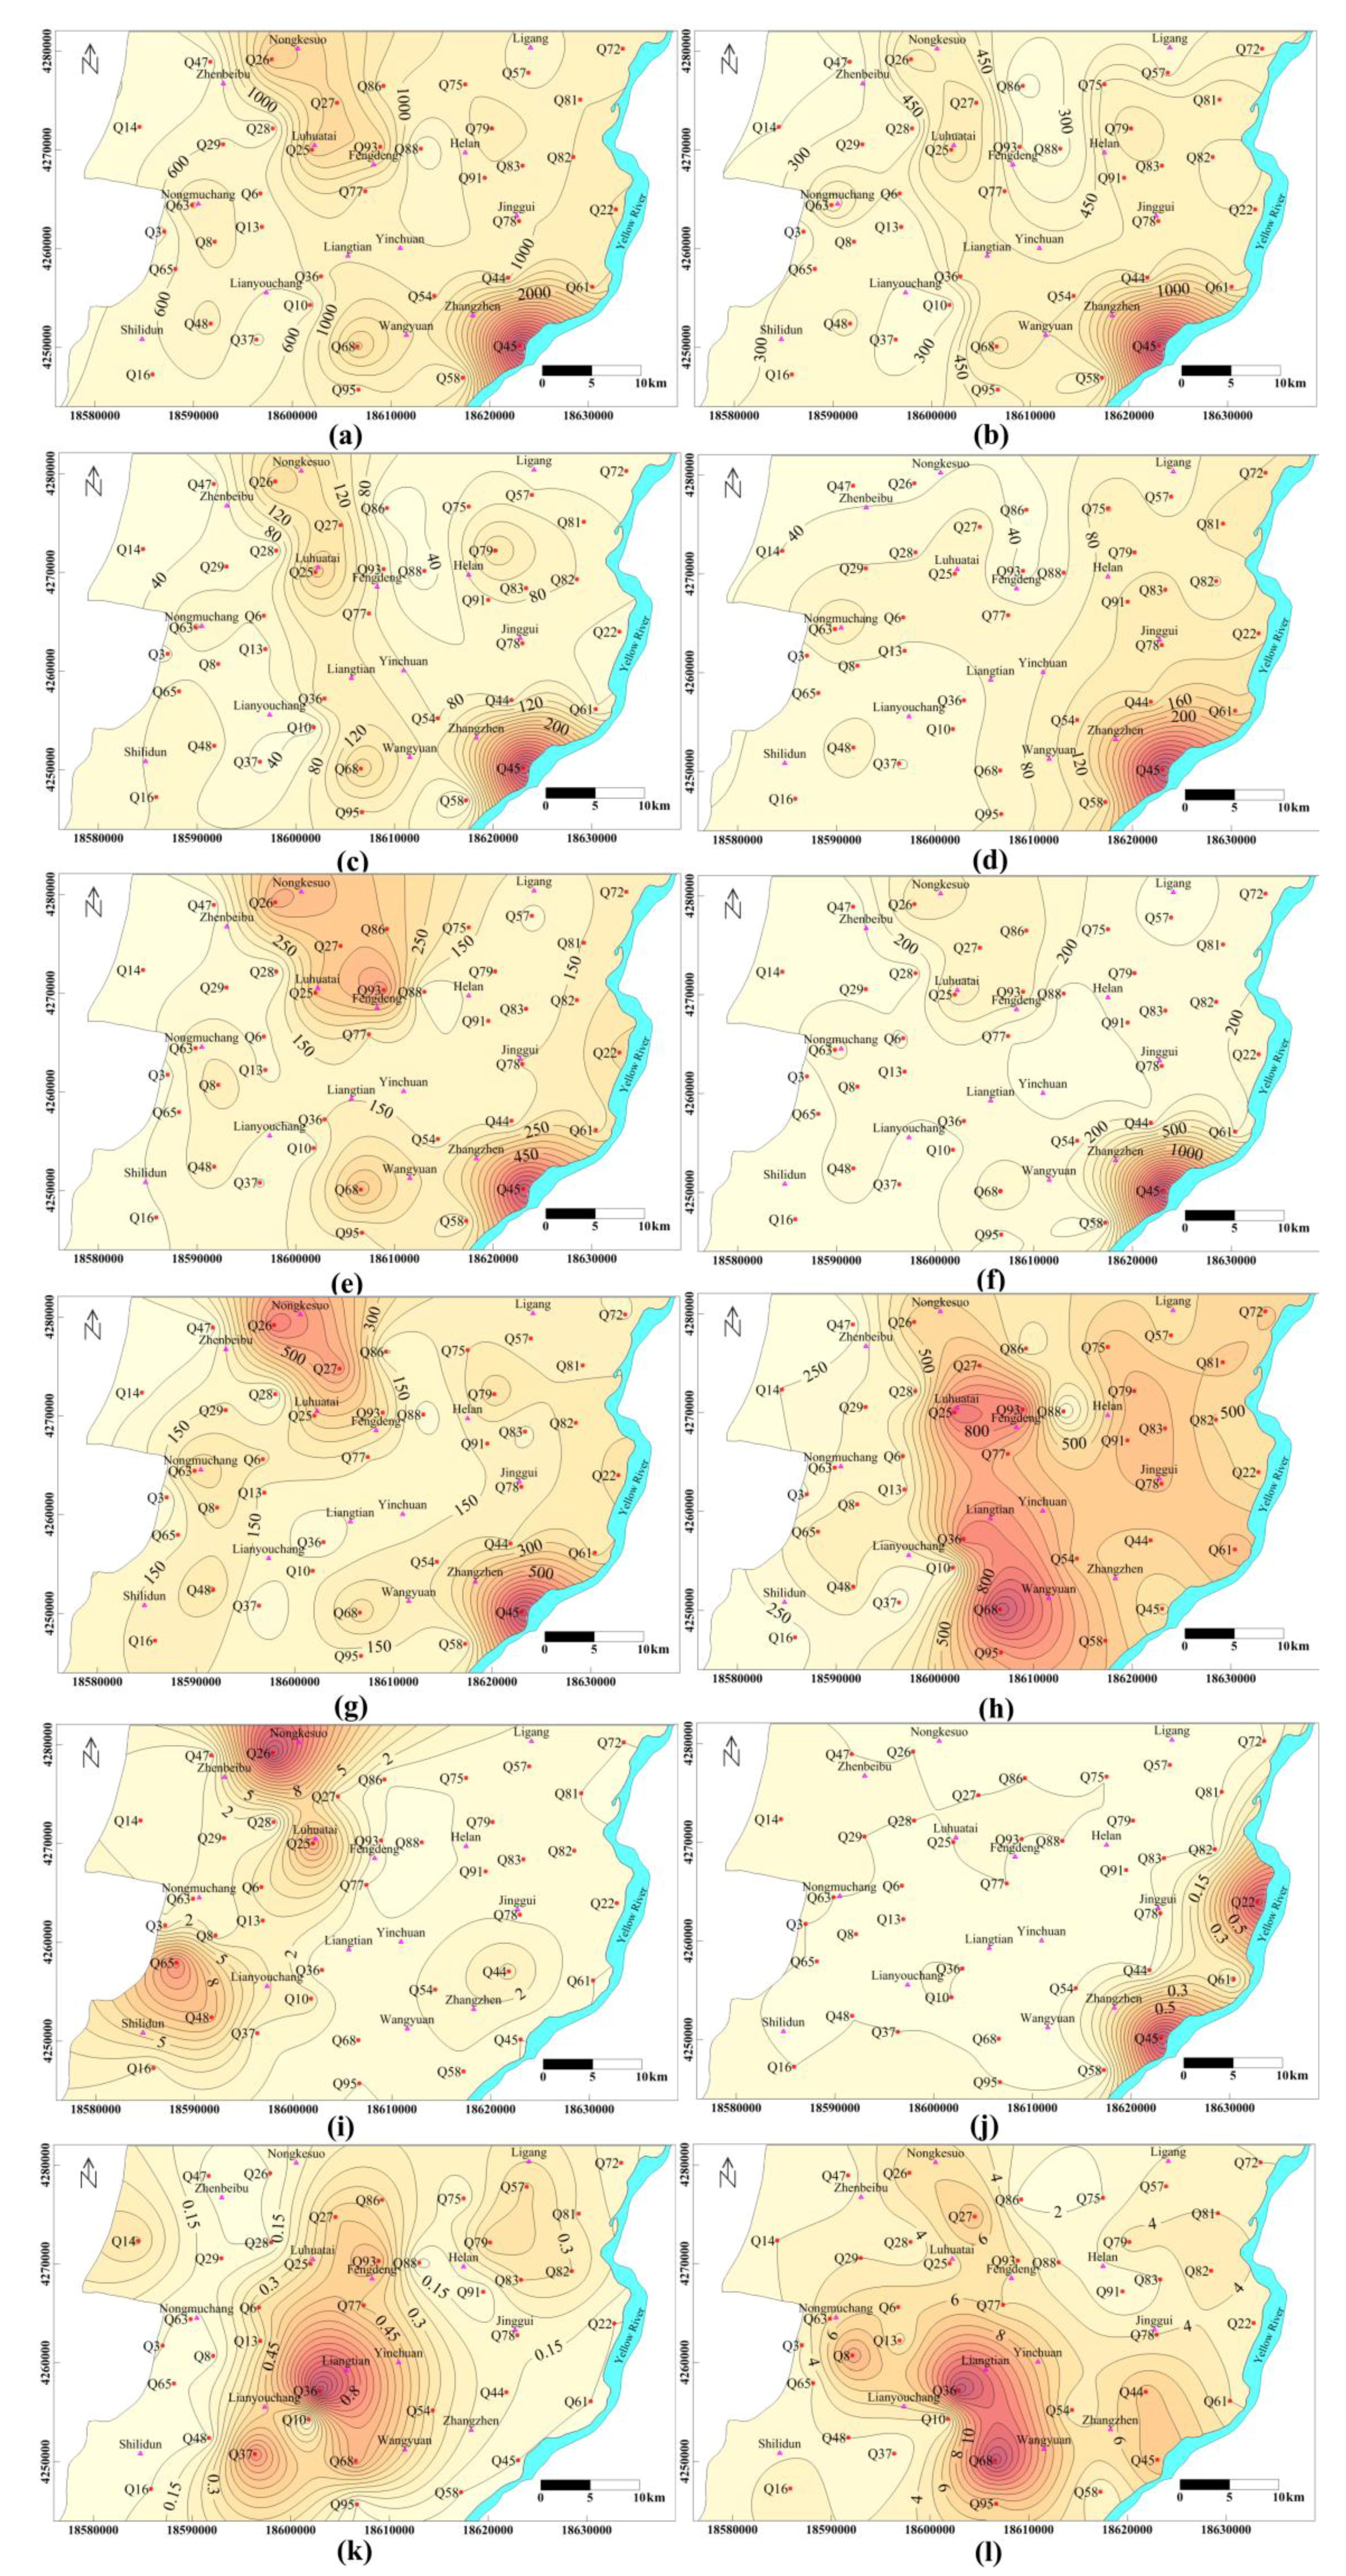
Figure 5.
Contour maps of hydrochemical measurements (mg/L) for phreatic water (a) TDS; (b) TH; (c) Mg2+; (d) Ca2+; (e) Na+; (f) Cl−; (g) SO42−; (h) HCO3−; (i) NO3−; (j) NH4+; (k) F−; (l) K+.
Figure 5.
Contour maps of hydrochemical measurements (mg/L) for phreatic water (a) TDS; (b) TH; (c) Mg2+; (d) Ca2+; (e) Na+; (f) Cl−; (g) SO42−; (h) HCO3−; (i) NO3−; (j) NH4+; (k) F−; (l) K+.
The spatial distribution of TH and Mg
2+ were similar (
Figure 5b,c), with higher values in the central and eastern areas. The spatial distribution of Ca
2+ increased from the southwest and northwest parts of the study area to the east (
Figure 5d). Na
+, SO
42− and Cl
− concentrations were higher (beyond the acceptable limits) in the vicinity of Luhuatai and Nongkesuo in the north, and Zhangzhen in the southeast, and lower in other parts of the study area (
Figure 5e,f,g). Unusually high concentrations were found at three sample points: Q26, Q27 and Q45. The distribution of SO
42− increased from the outer parts of the study area toward the center (
Figure 5g). Concentrations of HCO
3− increased gradually from west to east, forming four areas of high concentration near sites Q25, Q36, Q68 and Q93 in the central (
Figure 5h). NO
3− concentrations were relatively high in the vicinity of Shilidun and Luhuatai, beyond China’s acceptable limits in Nongkesuo (in the north), and lower in other parts of the study area (
Figure 5i). In contrast, NH
4+ concentrations were markedly higher in the banded areas along the Yellow River beyond the national limits for drinking water (
Figure 5j). F
− concentrations had a very different distribution, being highest in the center and northeast (
Figure 5k). Concentrations of K
+ increased from the southwest and northwest toward the center, peaking in the northeast (
Figure 5l).
Concentrations of nearly all major ions were highest near Q26, Q27 (in the north) and Q45 (in the southeast), which may have been caused by similar hydrogeochemical processes. Evaporation in this area is intense, and the groundwater depth is shallow at less than 2 m, while the extinction evaporation depth is 3 m; the amount of annual evaporation is 8 times that of precipitation [
5,
9,
12]. Furthermore, the decrease in ion concentrations at lower elevations may be attributed to leakage from canals and the seepage of irrigation water, which have very low concentrations of dissolved ions. Local activities such as sewage disposal and agricultural irrigation may further recharge the phreatic water levels, causing the quantity to change.
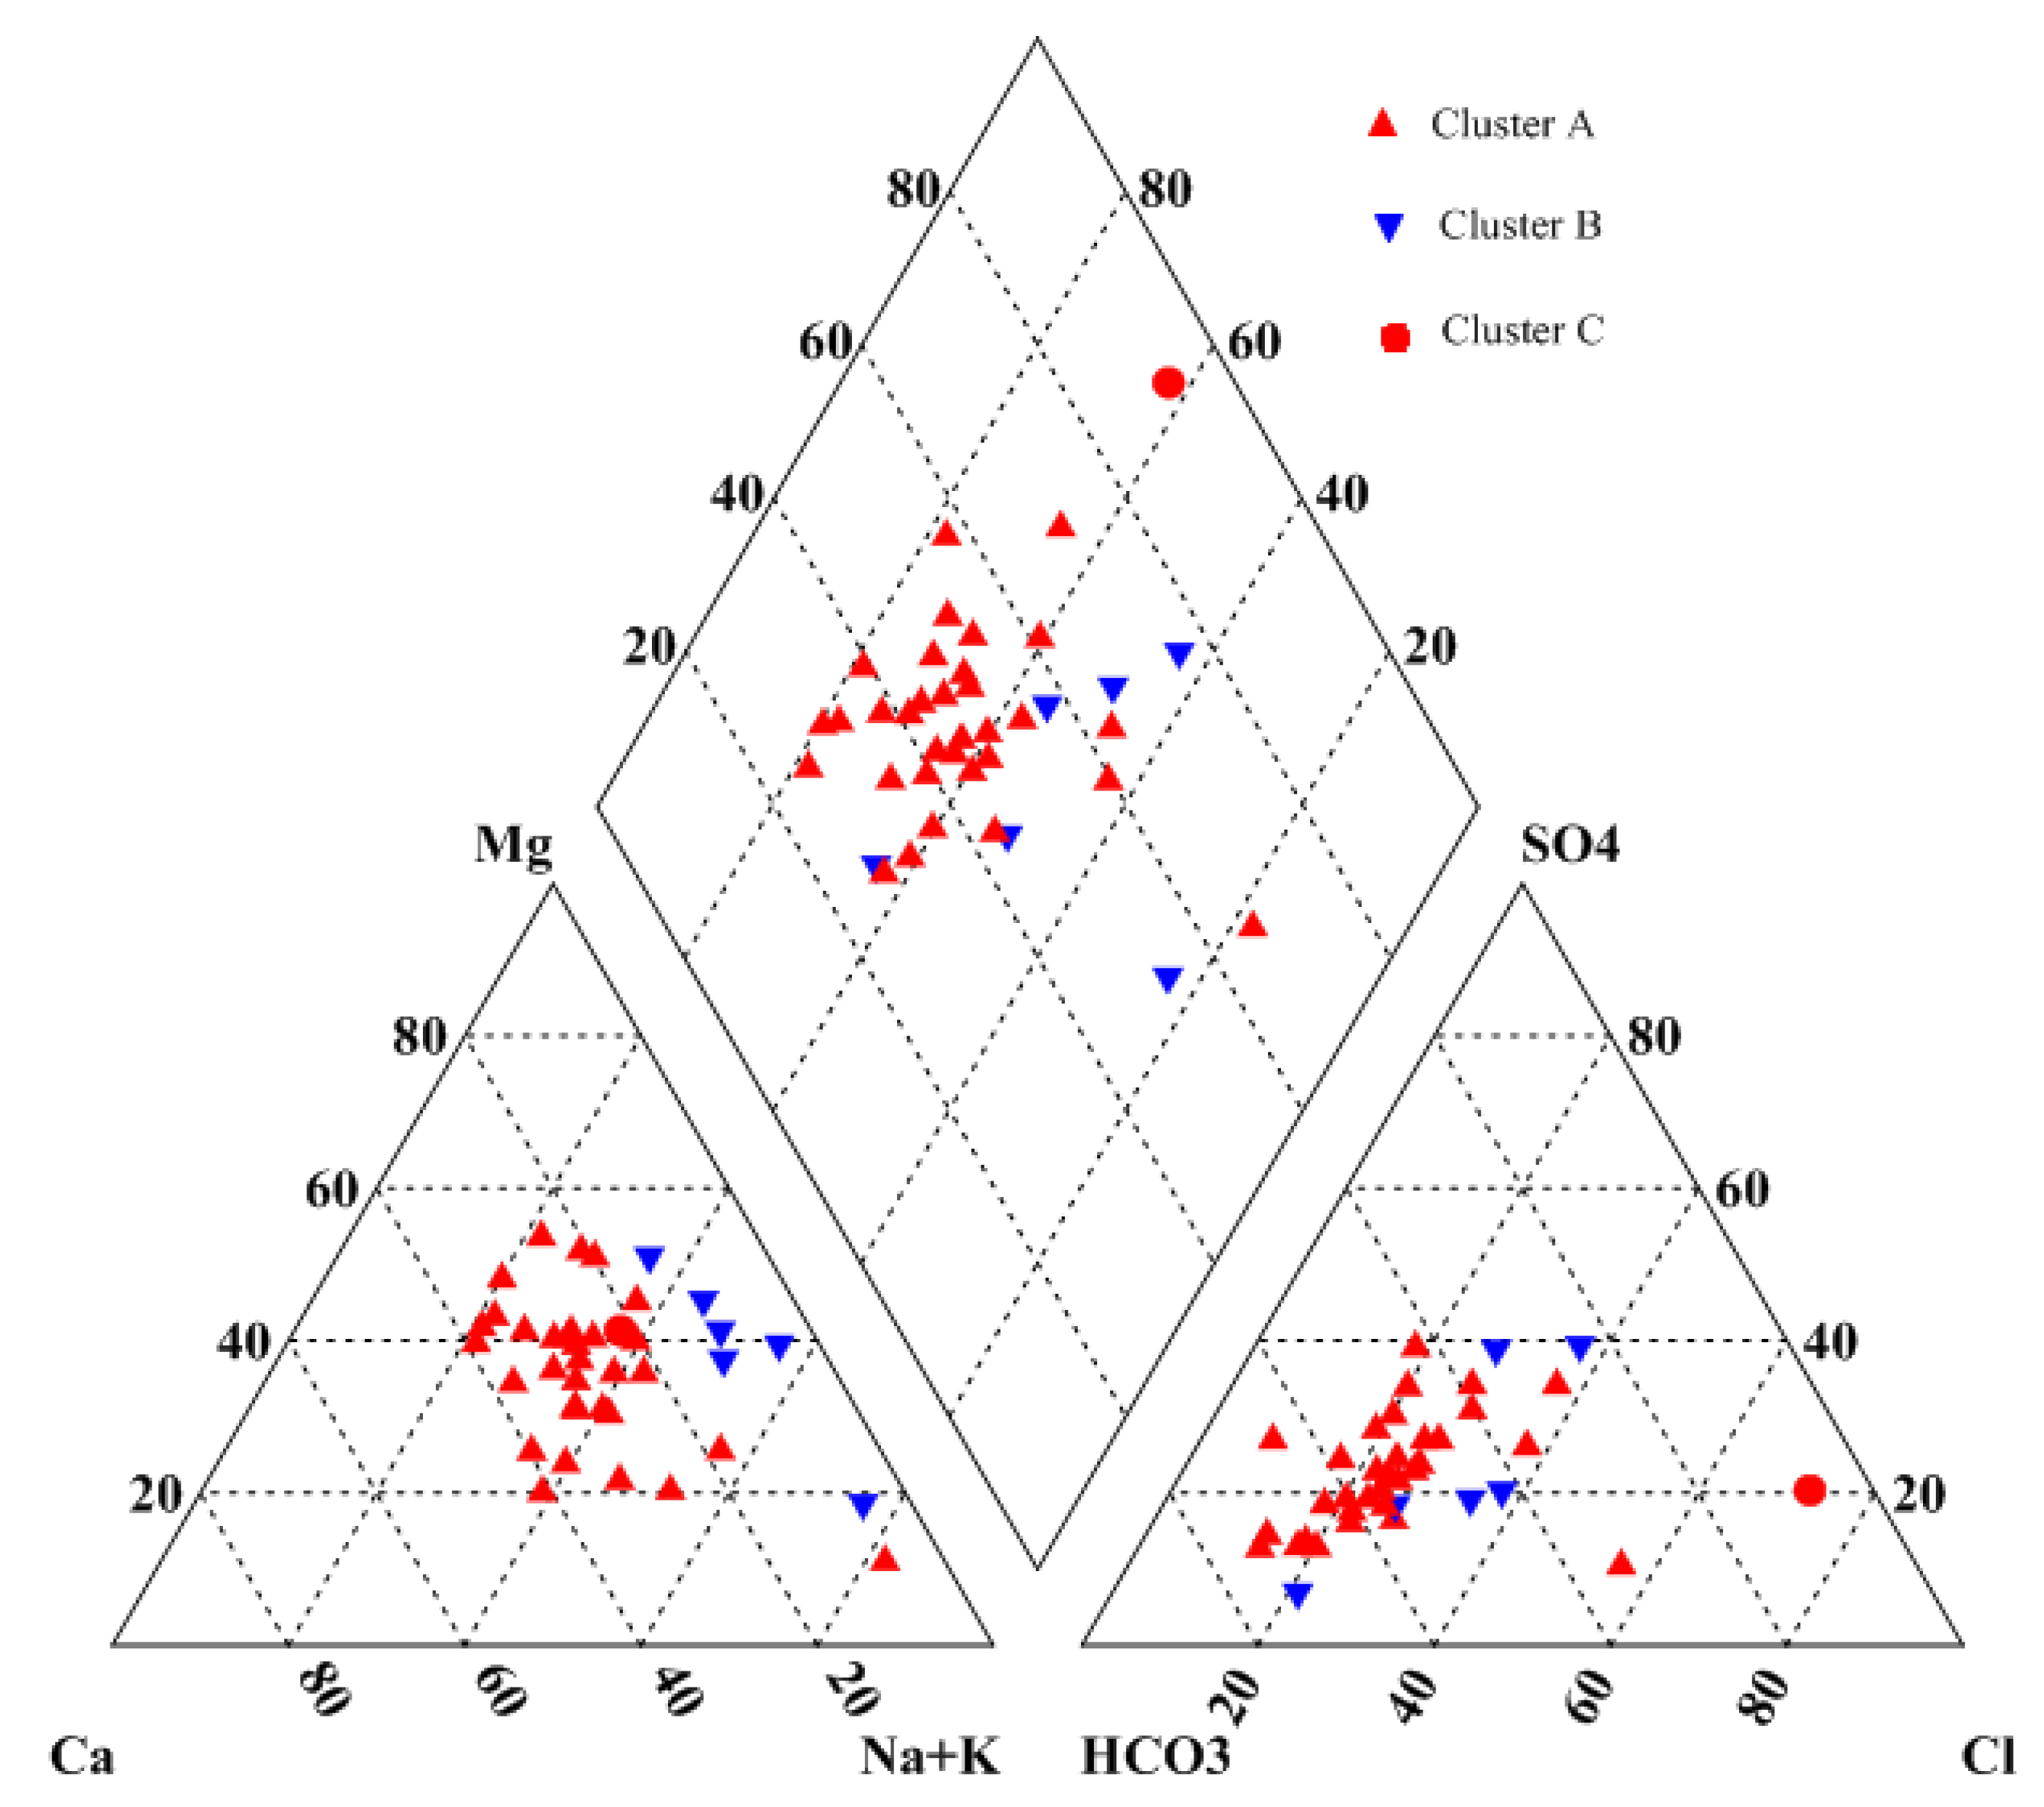
Piper trilinear diagrams are used commonly to identify hydrochemical patterns in ion data [
5,
19,
25]. In terms of cations, most samples were plotted in the central zone of the right delta-shaped region of our Piper diagram (
Figure 6), suggesting that some stations had sodium-type water while most were mixed-type. For anions, most samples were located in the left zone of the lower right delta-shaped region, indicating the dominance of bicarbonate-type water, while some stations had mixed-type.
Figure 6.
Piper diagram of phreatic water drawn with AquaChem 4.0.
Figure 6.
Piper diagram of phreatic water drawn with AquaChem 4.0.
4.2. Correlation among Parameters
The correlations among water-quality variables (
Table 2) allow us to distinguish several relevant hydrochemical relationships. Measures of the major ions and trace elements, except for K
+, HCO
3−, NO
3− and F
−, were significantly and positively correlated with TDS. Concentrations of Cl
−, SO
42−, Na
+ and Mg
2+ were related, with correlation coefficients (
r) ranging from 0.805 to 0.919, implying that there is possibly a common cause for an increase in these ions. Concentrations of Ca
2+ and Mg
2+ were strongly correlated with TH (
r = 0.928 and 0.953, respectively), which is intuitive as hardness is an approximate measure of Ca
2+ and Mg
2+. TH was also strongly correlated with SO
42−, (r = 0.809), and weakly correlated with HCO
3− (
r = 0.245), implying that TH is essentially a permanent hardness. As calcite and dolomite dissolve and precipitate, concentrations of Ca
2+ and Mg
2+ increase, and HCO
3− decreases, resulting in higher TH and lower TDS [
26]. The correlation of Ca
2+ with SO
42− was not as strong as that of Na
+ and Mg
2+, so the dissolution of gypsum cannot be assumed as a main source of Ca
2+ and SO
42−. Additional reactions involving Ca
2+, such as carbonate dissolution/precipitation and cation exchange, could account for the correlation with SO
42−.
Table 2.
Correlation matrix of the 13 physico-chemical water parameters. The values are the correlations coefficients (r).
Table 2.
Correlation matrix of the 13 physico-chemical water parameters. The values are the correlations coefficients (r).
| Catalog | pH | TH | TDS | Ca2+ | Mg2+ | K+ | Na+ | Cl− | SO42+ | HCO3− | NO3− | NH4+ | F− |
|---|
| pH | 1 | | | | | | | | | | | | |
| TH | −0.50 | 1 | | | | | | | | | | | |
| TDS | −0.57 | 0.935 | 1 | | | | | | | | | | |
| Ca2+ | −0.41 | 0.928 | 0.792 | 1 | | | | | | | | | |
| Mg2+ | −0.51 | 0.953 | 0.952 | 0.771 | 1 | | | | | | | | |
| K+ | 0.04 | 0.293 | 0.345 | 0.106 | 0.415 | 1 | | | | | | | |
| Na+ | −0.54 | 0.742 | 0.929 | 0.568 | 0.805 | 0.343 | 1 | | | | | | |
| Cl− | −0.62 | 0.941 | 0.955 | 0.846 | 0.919 | 0.216 | 0.839 | 1 | | | | | |
| SO42− | −0.58 | 0.809 | 0.907 | 0.641 | 0.861 | 0.277 | 0.851 | 0.817 | 1 | | | | |
| HCO3- | 0.17 | 0.245 | 0.347 | 0.106 | 0.332 | 0.557 | 0.438 | 0.109 | 0.227 | 1 | | | |
| NO3− | −0.27 | 0.00 | 0.126 | −0.19 | 0.163 | −0.033 | 0.173 | 0.044 | 0.344 | −0.02 | 1 | | |
| NH4+ | −0.41 | 0.688 | 0.657 | 0.719 | 0.591 | 0.046 | 0.556 | 0.73 | 0.55 | −0.054 | −0.11 | 1 | |
| F− | 0.243 | −0.06 | 0.013 | −0.22 | 0.071 | 0.551 | 0.092 | −0.06 | −0.11 | 0.443 | −0.16 | −0.17 | 1 |
Notably, the chemical reactions within a groundwater system are numerous and highly complex. Although correlation analysis is a useful tool, it can provide only a general insight into phreatic water hydrochemistry [
19]. To know more about the exact reactions taking place, more comprehensive analyses of aquifer mineralogy and groundwater flow are needed.
4.3. Principal Component Analysis (PCA)
A Bartlett’s sphericity test confirmed that the 13 variables were not orthogonal but rather were correlated (Bartlett χ2 = 1354, 78 df, p ≤ 0.001). This enables explanation of the variation in these hydrochemical data with a lower number of variables. Additionally, the Kaiser–Meyer–Olkin method (KMO) showed that the measure of sampling adequacy (MSA) was 0.623, indicating that the degree of correlation among the variables and the appropriateness of factor analysis was middling.
PCA considered the hydrochemical variables common to all 39 samples, including pH, TH, TDS, K
+, Na
+, Ca
2+, Mg
2+, HCO
3−, SO
42−, Cl
−, NH
4+, NO
3− and F
−. The correlation matrix of the 13 variables (standardized data) revealed several relevant hydrochemical relationships that can help to interpret the primary factors that have influenced current water chemistry in the region [
27]. Most variables were strongly correlated with more than one other component (
Table 2). In PCA, the correlations among the variables were used to estimate PCs with common associations and associated constituent loadings on PCs [
28]. To reduce the overlap between original variables in each PC, a varimax rotation was conducted [
17]. The total variance explained by each PC, their loadings, and eigenvalues are shown in
Table 3. Based on eigenvalues greater than 1, 4 PCs were extracted that accounted for 87.6% of the total variance in the original dataset (
Table 3). The first two PCs explained for most of the variance, at 53.7% and 14.6%, respectively. While PCs 3 and 4 explained 11.2% and 8.1%.
Table 3.
Loadings of variables on 4 Principal Components (PCs) of water quality measurements.
Table 3.
Loadings of variables on 4 Principal Components (PCs) of water quality measurements.
| Variable | PC1 | PC2 | PC3 | PC4 |
|---|
| TH | 0.97 | 0.04 | −0.04 | 0.07 |
| Cl− | 0.97 | 0.06 | 0.03 | −0.13 |
| TDS | 0.97 | 0.16 | 0.15 | 0.07 |
| Mg2+ | 0.93 | 0.21 | 0.16 | 0.08 |
| Ca2+ | 0.90 | −0.18 | −0.28 | 0.06 |
| SO42+ | 0.86 | 0.05 | 0.39 | 0.04 |
| Na+ | 0.84 | 0.25 | 0.27 | 0.09 |
| NH4+ | 0.77 | −0.13 | −0.25 | −0.20 |
| pH | −0.59 | 0.04 | −0.37 | 0.57 |
| F− | −0.12 | 0.92 | −0.13 | 0.04 |
| K+ | 0.24 | 0.79 | 0.03 | 0.26 |
| NO3− | 0.02 | −0.10 | 0.94 | −0.02 |
| HCO3− | 0.21 | 0.49 | 0.09 | 0.76 |
| Eigenvalue | 6.99 | 1.89 | 1.45 | 1.06 |
| % of Variance explained | 53.7 | 14.6 | 11.2 | 8.1 |
| % Cumulative variance | 53.7 | 68.3 | 79.5 | 87.6 |
PC1 was highly related to TH, Cl−, TDS, Mg2+, Ca2+, SO42− and Na+, indicating that these variables have common patterns. PC1 also had a strongly positive loading for NH4+, implying an effect of human activity (e.g., domestic sewage, chemical fertilizers, such as NH4HCO3, CO(NH2)2, NH4NO3, (NH4)2SO4, Ca(H2PO4)2 and KCl ) on phreatic water. Further, it had a moderately negative loading for pH, showing that samples with high TDS and much more SO42−, so pH will drop. This can be interpreted as a strong evaporation effect due to the drought climate in this area. Major ions, such as Na+, Mg2+, Ca2+, SO42− and Cl−, are important components of TDS and/or TH.
Due to the fact that the majority of discharge from the phreatic aquifer occurs by evaporation, large amounts of salts remain in the soil and accumulate in phreatic water, lowering its quality. Compounds whose solubility products are small (e.g., the solubility product K
sp of CaCO
3 is 4.96 × 10
−9 at 25 °C) can reach saturation and then precipitate [
26], so the main ions that remain dissolved in phreatic water are Mg
2+, Ca
2+, Na
+, SO
42−, and Cl
−. The loading of those ions on PC1 ranged from 0.84–0.97. As the concentration of K
+, Na
+, Ca
2+, Mg
2+, HCO
3−, SO
42− and Cl
− in the phreatic water gradually increases with TDS, groundwater will be under saturated with calcite, dolomite and gypsum, with respect to the solubility product. Therefore, we infer that PC1 reflected the strong evaporation effect, shallow groundwater sources, patterns of land use, and intensity of human activities in the Yinchuan region. Indeed, three parts of the region had high values of PC1: Luhuatai and Nongkesuo (in the north), and east of Zhangzheng along the Yellow River (
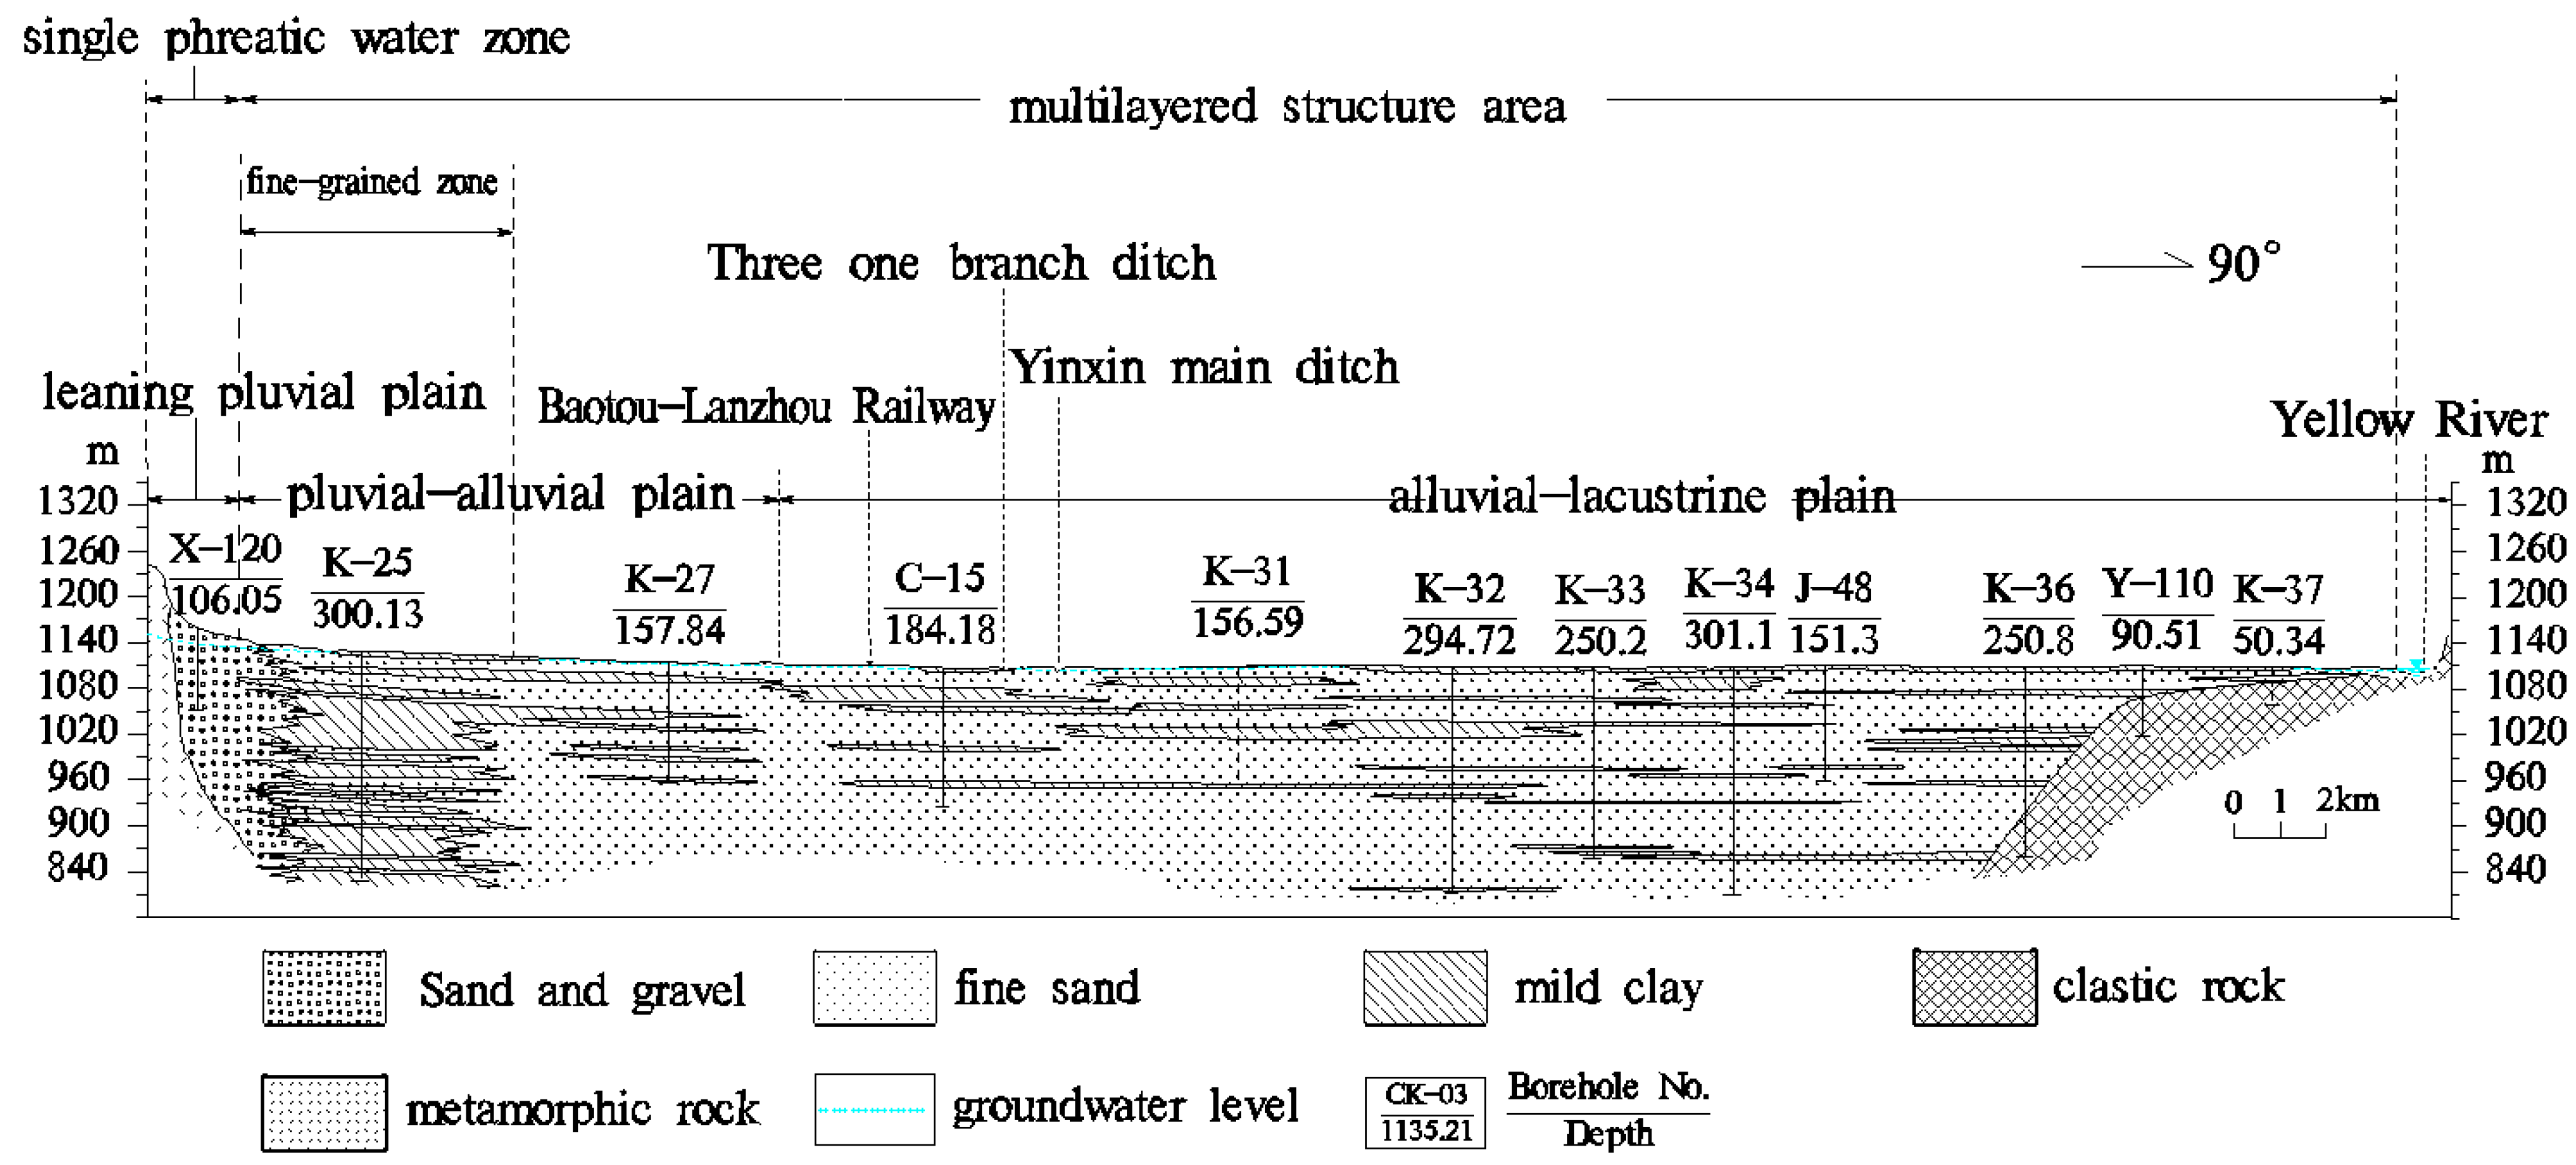
Figure 7a), in which groundwater starts at shallow depth (
Figure 4). In contrast, PC1 values were lower in the west, where larger groundwater depths are associated with less evaporation, so the water quality of phreatic water there is hardly affected by the external environment and human activities. The concentrations of ions there were also relatively lower and water type was relatively simpler, for example HCO
3-Mg, HCO
3-Mg.Ca and HCO
3-Mg.Na types.
Figure 7.
Spatial distribution of sampling stations by (a) PC1 scores and (b) PC2 scores.
Figure 7.
Spatial distribution of sampling stations by (a) PC1 scores and (b) PC2 scores.
Loadings on PC2 showed that F
− and K
− were most important for that component; in addition, the weak positive correlation of PC2 with HCO
3− represents dissolution of minerals that contain F
− and K
−. Sampling stations in the center of the study area and southeast of Zhangzhen had high PC2 scores, which were otherwise relatively small. This suggests that there is strong dissolution of minerals with F
− and K
− in the central area (
Figure 7b). The spatial pattern of PC2 scores was different from that of PC1,
i.e., the distribution of high PC2 scores was concentrated in the part of the study area with excessive exploitation of confined water (around Yinchuan City), where groundwater levels fluctuate greatly and the dissolution of mineral is common.
PC3 was greatly influenced by NO
3−, related to the use of nitrate fertilizers used in irrigation. For example, nitrate measured at sampling station Q26 (near Nongkesuo, in the north) was 21.47 mg/L, the highest NO
3− concentration that we found, significantly beyond Grade 3 of the water quality standards (
Table 1;
Figure 5j). The highest positive loading on PC4 was by HCO
3−, indicating an influence of the dissolution of carbonate minerals.


