1. Introduction
Permeable pavement systems have been used globally for over two decades as a Water Sensitive Urban Design (WSUD) control measure to reduce both peak stormwater flows and pollution loads [
1,
2,
3,
4]. WSUD is of a similar design philosophy to Low Impact Development (LID) in the US, and Sustainable Urban Drainage Systems (SUDS) in Europe. Permeable pavements significantly reduce stormwater runoff volumes compared to conventionally constructed pavements. They also support increased evaporation which aids in further reducing runoff and peak stormwater flows. They also filter the stormwater within the pavement structure removing pollutants and improving water quality [
1,
3,
5]. Stormwater treatment mainly takes place through the trapping of suspended solids during infiltration through the pavement structure [
6,
7,
8].
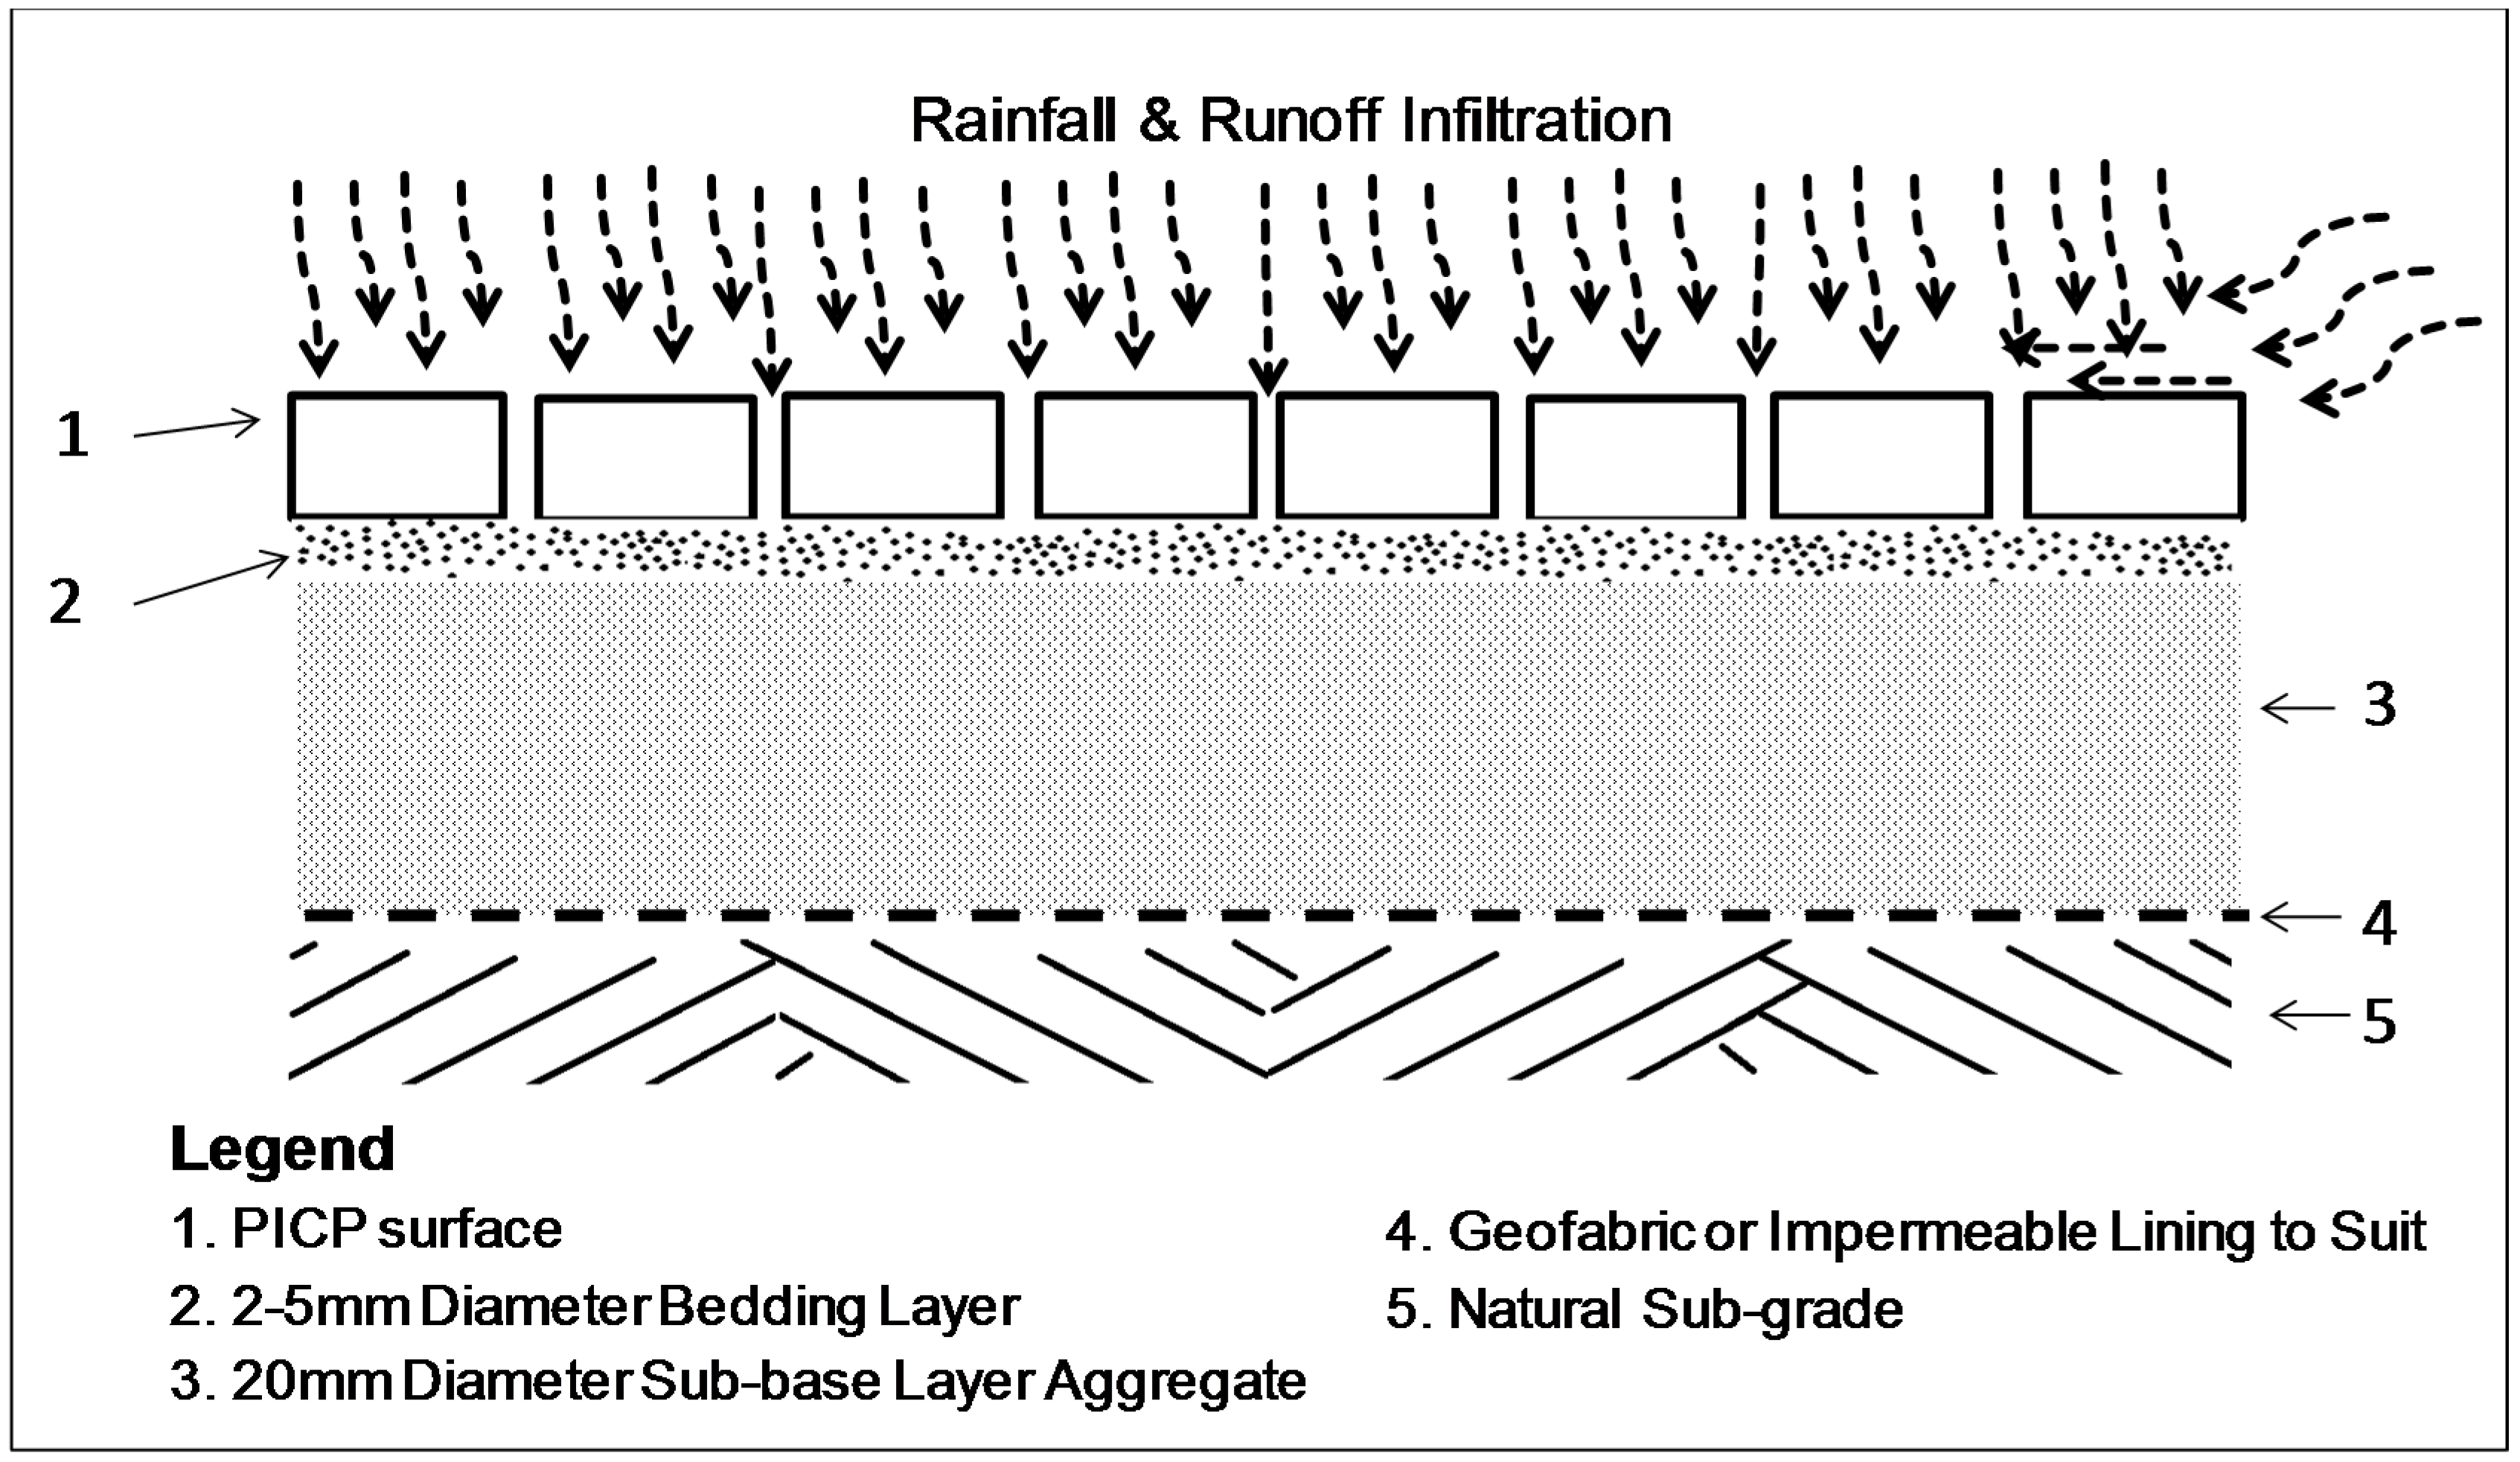
The majority of modular permeable pavement systems are Permeable Interlocking Concrete Pavements (PICPs) which consist of concrete blocks or pavers with open joints which allow infiltration between the pavers (
Figure 1). The stormwater infiltrates through the surface and bedding layers and then into the surrounding soil and groundwater, or discharged into conventional stormwater drainage.
Figure 1.
Typical Permeable Interlocking Concrete Pavement (PICP) structure.
Figure 1.
Typical Permeable Interlocking Concrete Pavement (PICP) structure.
The trapping of fine sediments is an important function of PICPs and the primary method of pollution removal. However, this process has also been shown to reduce the hydraulic performance of PICPs over time due to clogging [
1,
2,
7]. Although infiltration rates of newly installed pavements have been shown to be high [
9,
10,
11] these rates are known to diminish over time due to clogging, potentially leading to a decrease in useful lifespan, more maintenance and higher replacement costs [
12,
13]. Accelerated surface clogging can lead to more frequent maintenance intervals and increased costs. Previous research has demonstrated that clogging takes place in the spaces between and within the PICP structure, causing decreased infiltration capacity after several years [
2,
7,
9,
14]. Other reasons suggested for lower PICP infiltration rates over time include poor construction practices, lack of maintenance, and adverse environmental conditions such as dispersible soils or excessive tree litter at the PICP location [
1,
13,
15,
16].
Although some maintenance requirements have been recommended to reduce PICP clogging, such as vacuum sweeping or pressure washing [
2,
17,
18,
19], because they are a relatively new pavement technology, full maintenance requirements have yet to be specified across the full range of installation types and conditions. The lack of maintenance specifications for PICP systems has been highlighted as a possible factor limiting their wider use [
1,
15].
Monitoring changes in the PICP infiltration rate over time is the most common way to evaluate the long term performance of PICPs. Reduced PICP infiltration rates can indicate that clogging is occurring and pavement maintenance is required. However, measuring PICP infiltration rates has previously been difficult for a variety of reasons including the practical difficulties in applying existing testing methodologies, the amount of time taken to complete the existing methodology, the amount and type of specific equipment required to carry out the tests [
11,
20].
This paper presents results from a comparison between the standard methodology [
21], and a new PICP field infiltration test methodology developed at the University of the Sunshine Coast in Australia. Arising from industry demand, the new test methodology, Stormwater Infiltration Field Test (SWIFT), has been developed as a rapid, low cost, and simple method to estimate PICP infiltration rates and maintenance requirements. A series of iterative design steps were undertaken to optimise the performance of the stormwater infiltration field test (SWIFT) prior to the full testing and comparisons reported in this article. This involved testing a range of elements relevant to the methodology including the volume of water released used during the tests (volumes from 4 litres to 10 litres were evaluated), the height of water release (60 mm, 240 mm and 300 mm heights were tested), and three different plug diameters were evaluated (20 mm, 40 mm and 50 mm diameters).
It is anticipated that tests performed over time at the same location using the SWIFT method may be used to quantify reductions in PICP surface infiltration rates, thereby identifying whether maintenance is required to restore infiltration rates to predefined levels. Classification of the degree of blocking (
Table 1) was related to the categories suggested by Lucke and Beecham [
1]. The minimum European PICP infiltration capacity of 97.2 mm/h [
13,
22] is also listed in
Table 1 for reference purposes.
Table 1.
Categories of pavement blockage and associated infiltration rates.
Table 1.
Categories of pavement blockage and associated infiltration rates.
| Average Infiltration Rate (mm/h) | Blockage Category |
|---|
| >2000 | Unblocked |
| 30–2000 | Medium Blocked |
| <30 | Fully Blocked |
| 97.2 | Minimum European PICP Infiltration rate |
Approximate infiltration rates may be estimated from the number of bricks that are fully wetted by the SWIFT test. The SWIFT test has been developed to provide an estimate of PICP blockage directly at the point of measurement. However, because of the speed of the test, multiple measurements can be taken rapidly over large areas to determine an average blockage category rate of large pavement areas.
1.1. Description of the American Standard Testing and Materials (ASTM) C1781M-14a Single-Ring Infiltrometer Test (SRIT) Method [21]
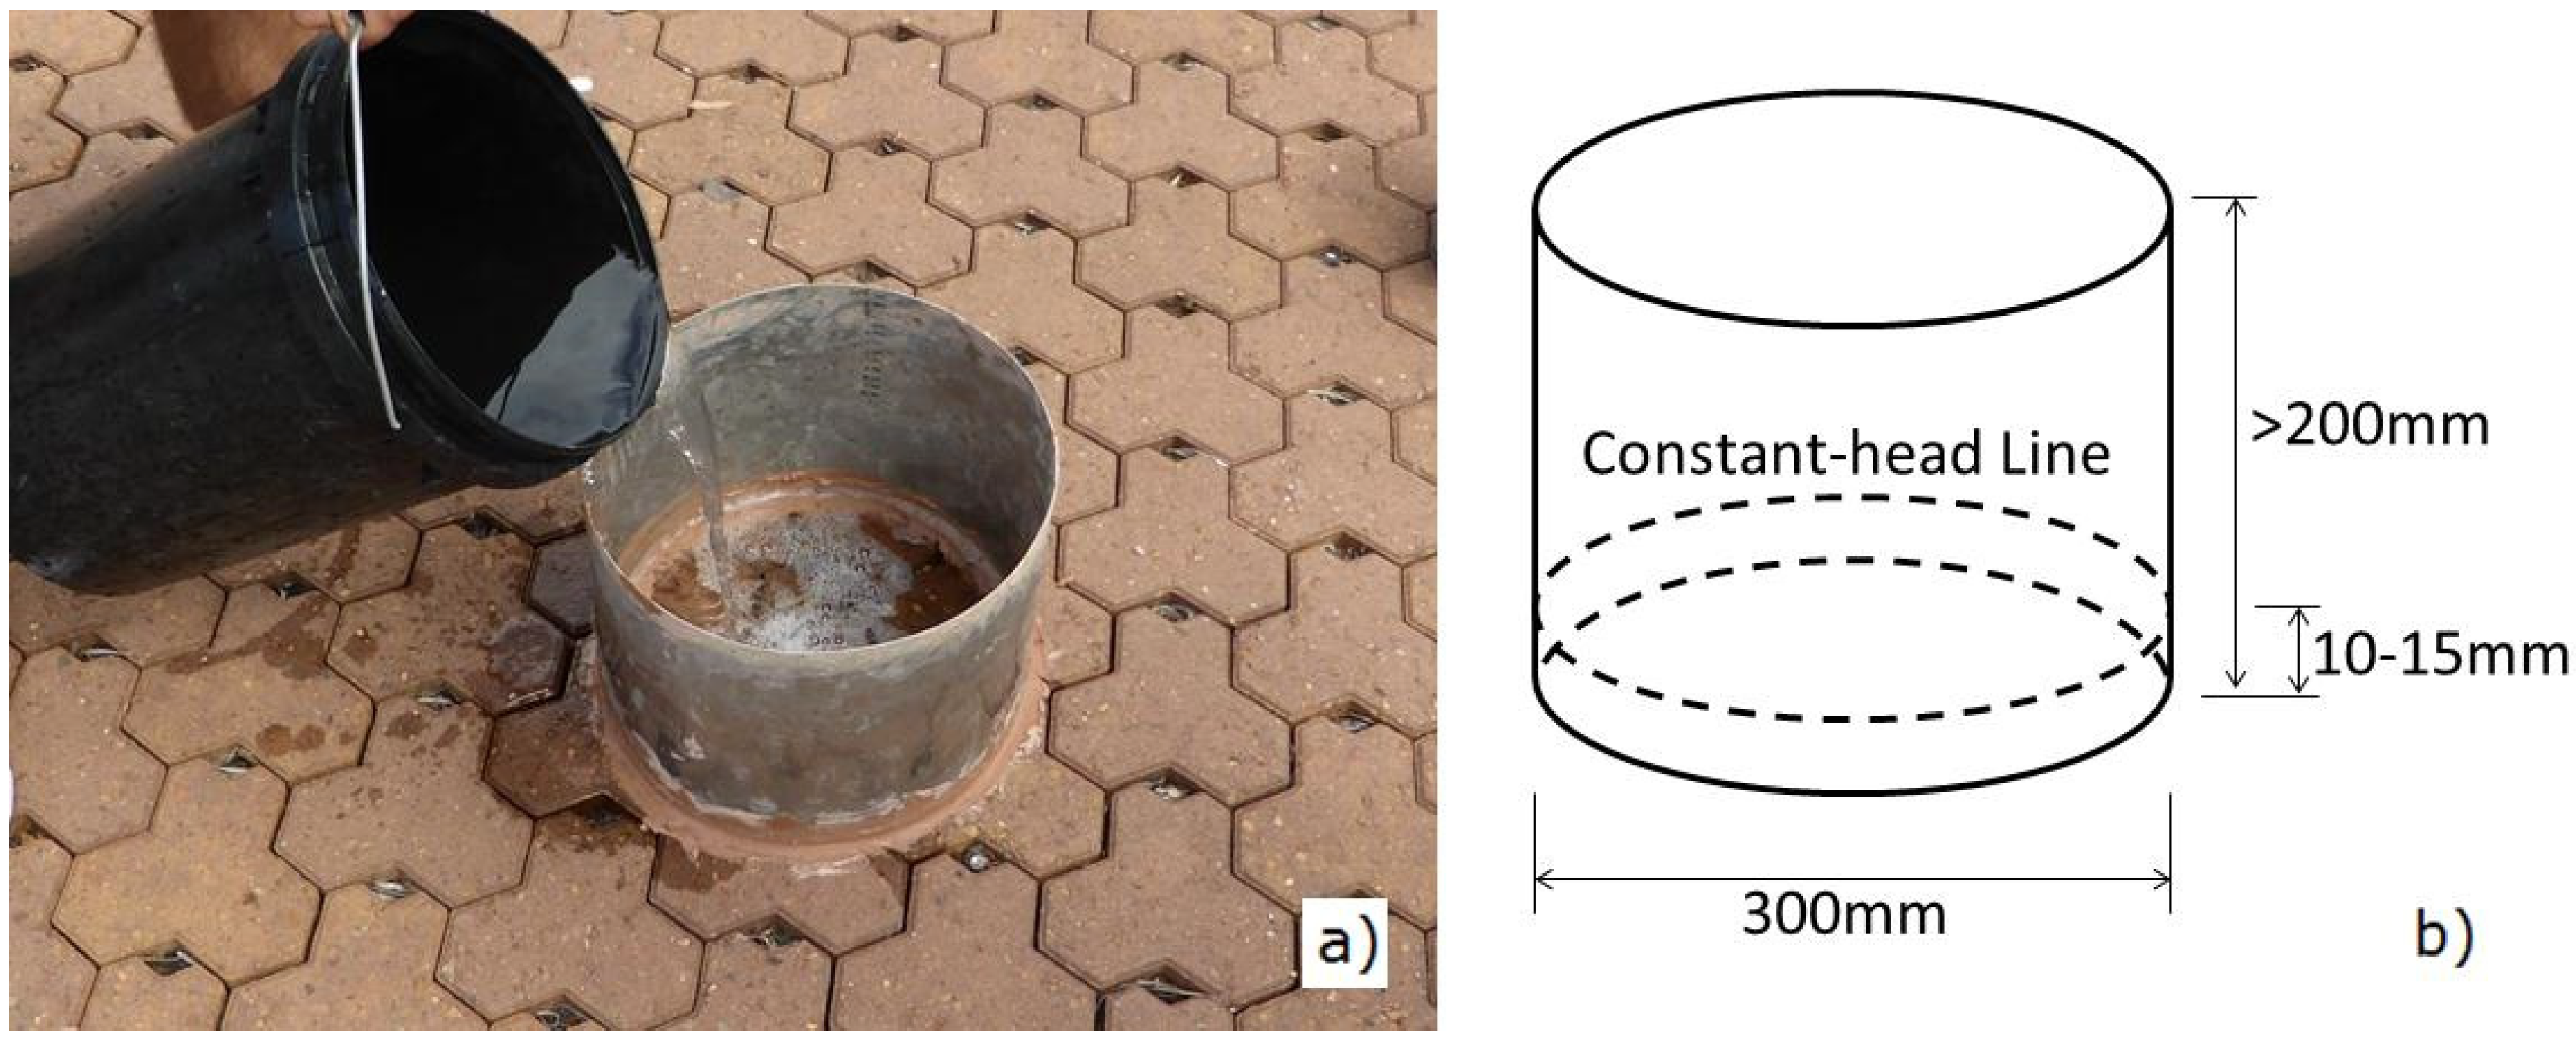
The standard field test used to measure infiltration through PICPs uses a single-ring infiltrometer test (SRIT—
Figure 2). As highlighted by Brown and Borst [
23], the ASTM (C1781M-14a) test method does not specify which part of a pavement surface should be tested. Therefore prior to testing and placement of test equipment, consideration of upslope contributing drainage areas should be made to ensure test results contain areas of likely blockage. The SRIT involves the following steps:
- i)
A 300 mm diameter ring is sealed to the PICP surface with plumbers’ putty to prevent lateral water flow;
- ii)
The surface to be tested should be pre-wet before any measurements are taken;
- iii)
Pre-wetting involves pouring 3.6 kg of water into the ring at a sufficient rate to maintain a constant head between two marked lines (between 10 and 15 mm from the base);
- iv)
The time taken for the water to fully infiltrate through the surface (from the time the water hits the surface to the time it is no longer visible on the surface) is recorded;
- v)
The elapsed time for pre-wetting test is recorded to the nearest 0.1 s;
- vi)
The actual SRIT test is performed by repeating steps (ii) and (iii) above using 3.60 kg of water if the pre-wetting time t duration is ≥30 s, otherwise 18 kg of water is used;
- vii)
Record the appropriate mass of water (M) and the elapsed SRIT test time (T); and
- viii)
Calculate the infiltration rate using Equation (1).
where
I = Infiltration rate (mm/h);
M = mass of infiltrated water (kg);
D = inner ring diameter (mm);
T = time required for water to infiltrate the pavement surface (s); and
K = constant value (4.58 × 10
9 in SI units).
Figure 2.
Single-Ring Infiltrometer Test (SRIT) used in this study. (a) SRIT during operation; (b) SRIT ring dimensions.
Figure 2.
Single-Ring Infiltrometer Test (SRIT) used in this study. (a) SRIT during operation; (b) SRIT ring dimensions.
1.2. Description of the Stormwater Infiltration Field Test (SWIFT) Method
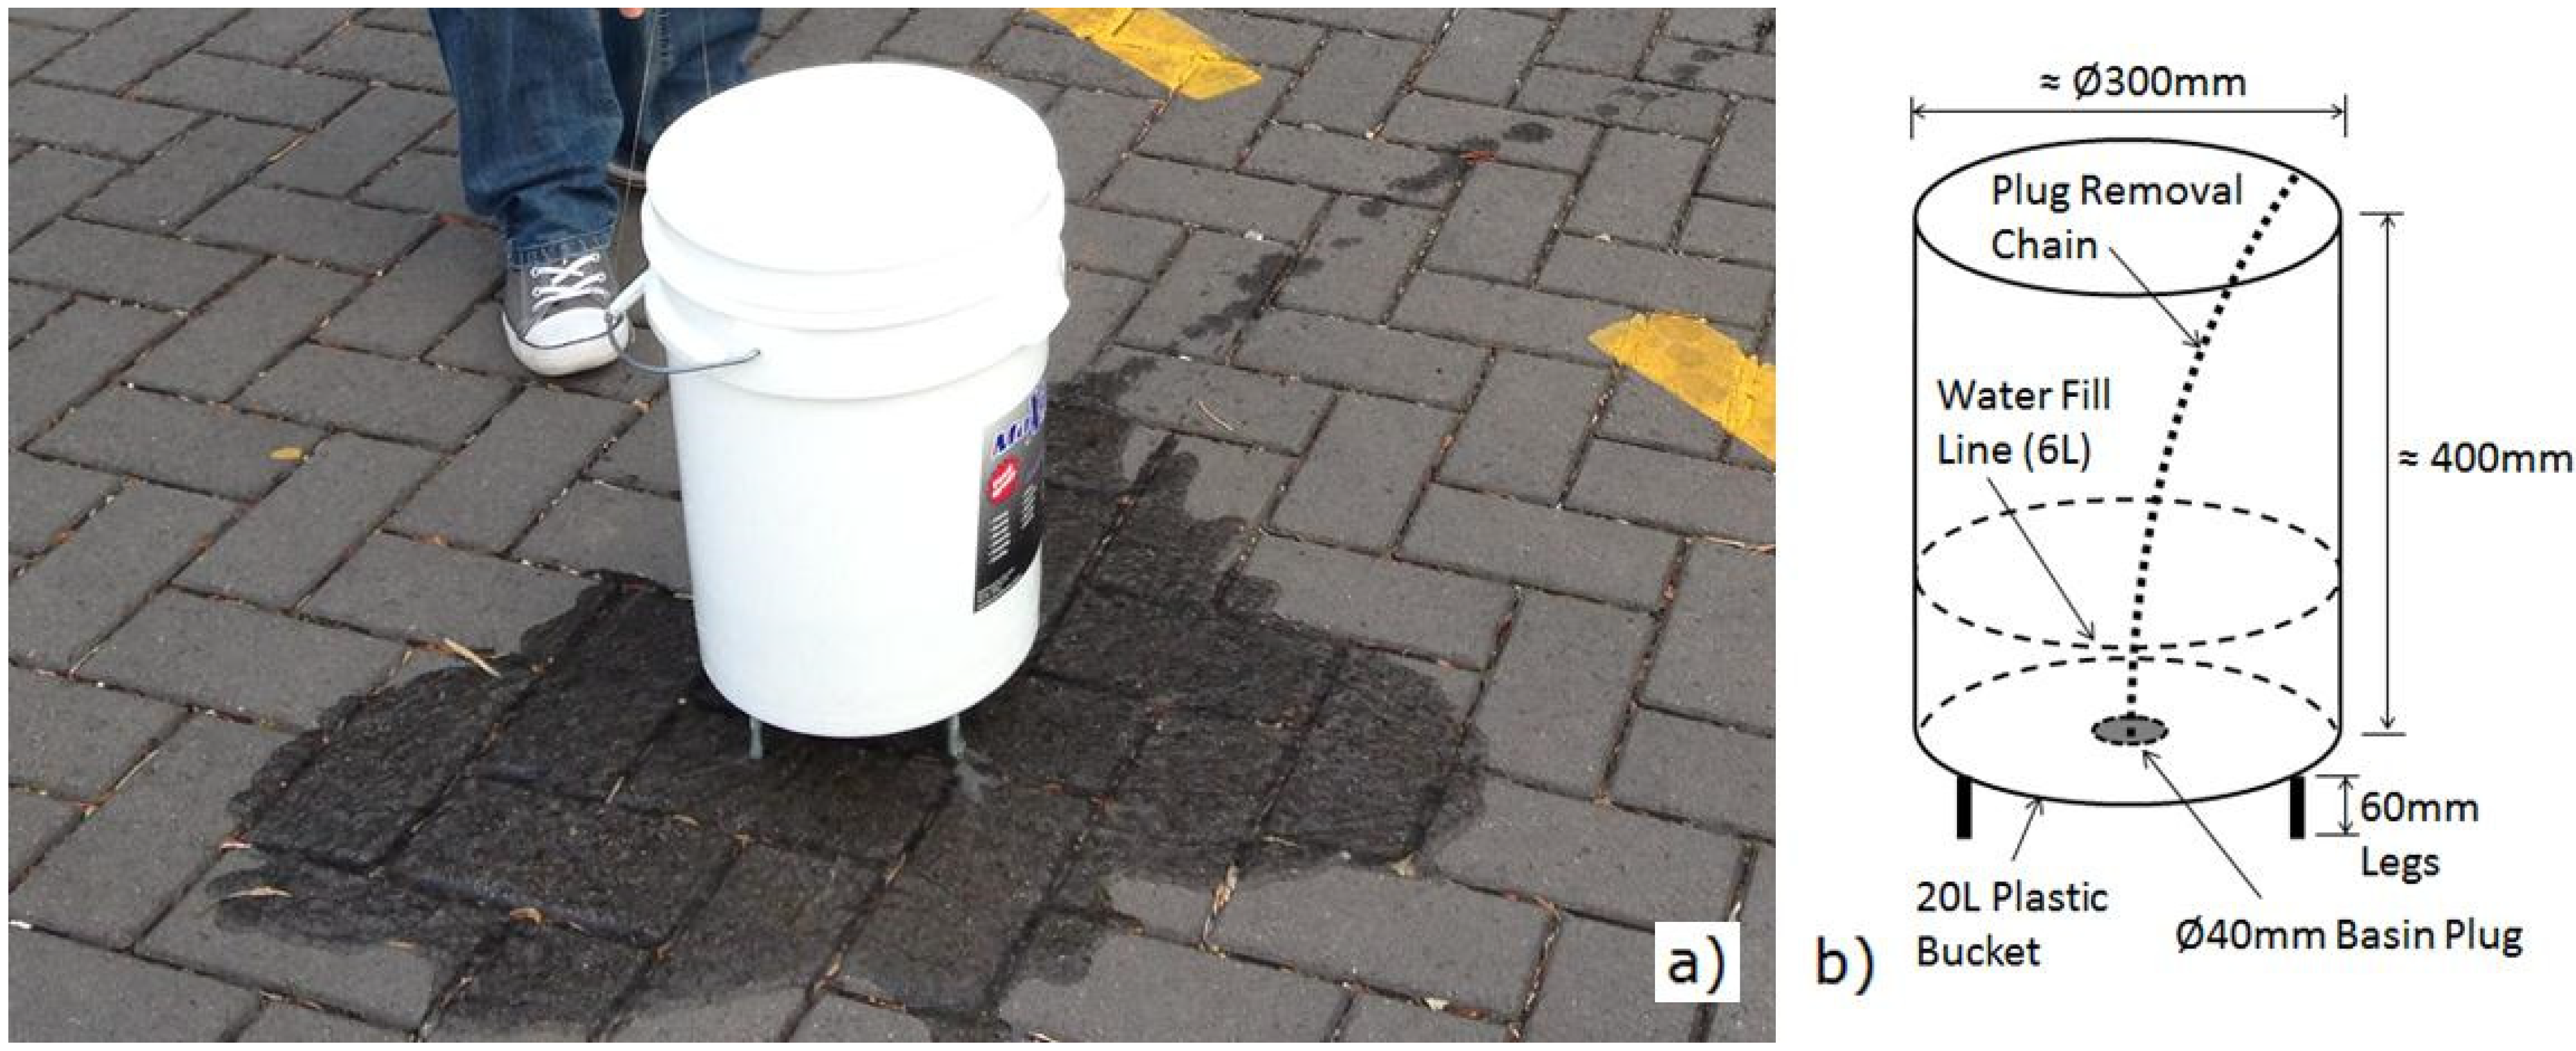
The SWIFT method uses a commonly available 20 L plastic bucket, with a 40 mm diameter hole cut into its base, to estimate PICP infiltration rates (
Figure 3). As the SWIFT test relies on counting the number of fully wetted bricks, no pre-wetting of the surface is required. If a test is to be repeated at precisely the same location, a minimum antecedent dry period of 24 h is recommended. The SWIFT infiltration estimation method involves the following steps:
- i)
Place bucket over one of the pavers of the surface to be tested so that the drainage hole is located directly above the centre of the paver;
- ii)
Insert plug into bucket drain hole (making sure it fits snuggly to prevent leaks) and fill bucket with 6 L of water;
- iii)
Remove plug using attached chain or rope and allow all water to flow out of the bucket and onto the paving surface. Remove SWIFT device;
- iv)
Count and record the number of individual bricks that are fully-wet across their entire surface (this step may be photographed for later analysis);
- v)
Estimate the average infiltration rate, and categorise the state of pavement blockage and maintenance requirements using the information in
Table 2 as a guide.
Figure 3.
Stormwater infiltration field test (SWIFT) Infiltrometer used in this study. (a) SWIFT in use; (b) SWIFT dimensions.
Figure 3.
Stormwater infiltration field test (SWIFT) Infiltrometer used in this study. (a) SWIFT in use; (b) SWIFT dimensions.
2. Experimental Methodology
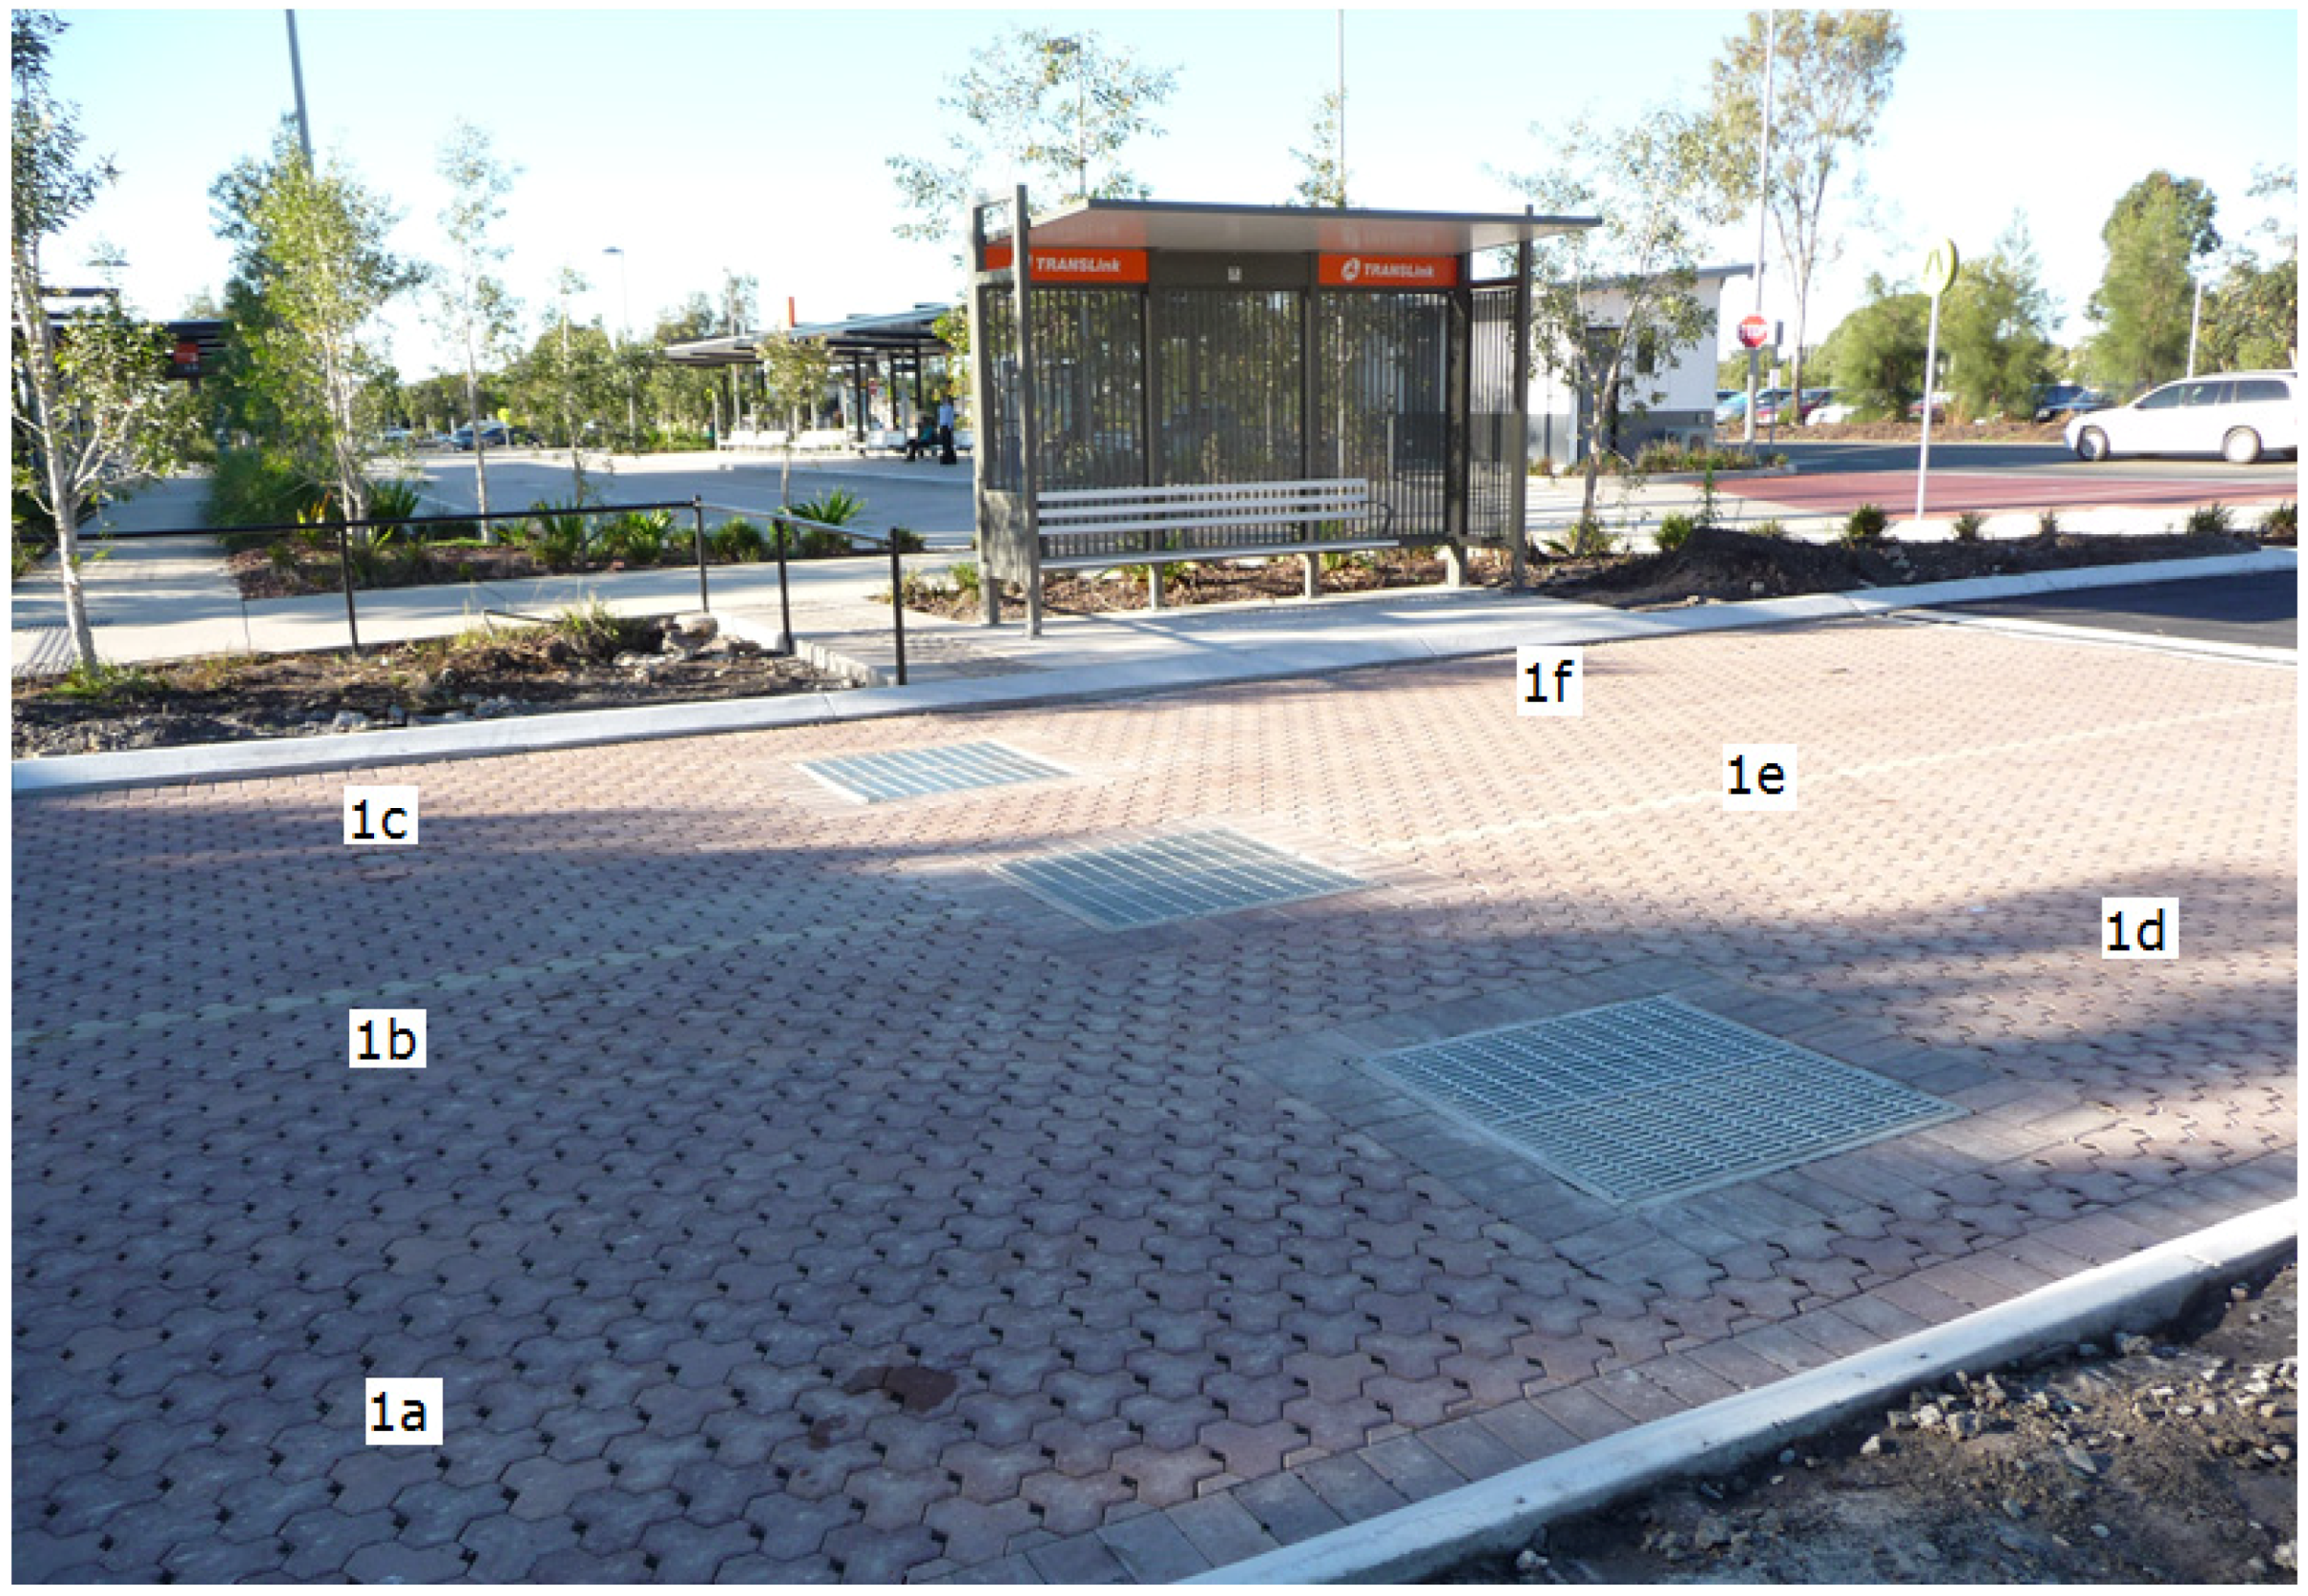
Field testing of both methodologies was carried out on a range of PICP pavement types, at three different PICP installations across the Sunshine Coast, Australia. The three installations were located at Sippy Downs (Site 1), Cotton Tree (Site 3) and Mary Cairncross Reserve, Maleny (Site 2), and incorporated a range of different construction techniques (
Figure 4 and
Figure 5). The test pavement at Site 1 was comprised of six sub-sites (1a–1f,
Figure 4) incorporating three different construction techniques, including varying aggregate sub-base depth layers, and different combinations of geotextile and impermeable layers. Geofabric liners were installed below the aggregate sub-base at Sites 1a and 4a and below the aggregate bedding layer at Sites 1–3. Site 1 was in effect six different pavements. Site 3 (
Figure 5b) was a suburban roadside carpark area of approximately 750 m
2. The construction of Site 3 included a 50 mm deep sand bedding layer and a geofabric liner between the sand and the sub-base aggregate.
Figure 4.
Six sub-site test locations at Site 1.
Figure 4.
Six sub-site test locations at Site 1.
Figure 5.
Site 2 (a) and Site 3 (b) PICP test locations.
Figure 5.
Site 2 (a) and Site 3 (b) PICP test locations.
The PICPs tested at Sites 1 and 3 were Ecotrihex
® pavers (
http://www.adbrimasonry.com.au/) with dimensions of 188 mm (L) × 92 mm (W) × 80 mm (H). These PICPs have apertures and spacing nibs that allow a close fit between pavers while maintaining a suitable joint width. The joints are typically filled with 2–5 mm bedding aggregate. The PICPs tested at Site 2 (
Figure 5a) were Hydrapave
TM pavers (
http://www.boral.com.au/) with dimensions of 230 mm (L) × 115 mm (W) × 80 mm (H). A geofabric liner was installed between the 2–5 mm bedding aggregate layer and the 250 mm deep sub-base aggregate at Site 2.
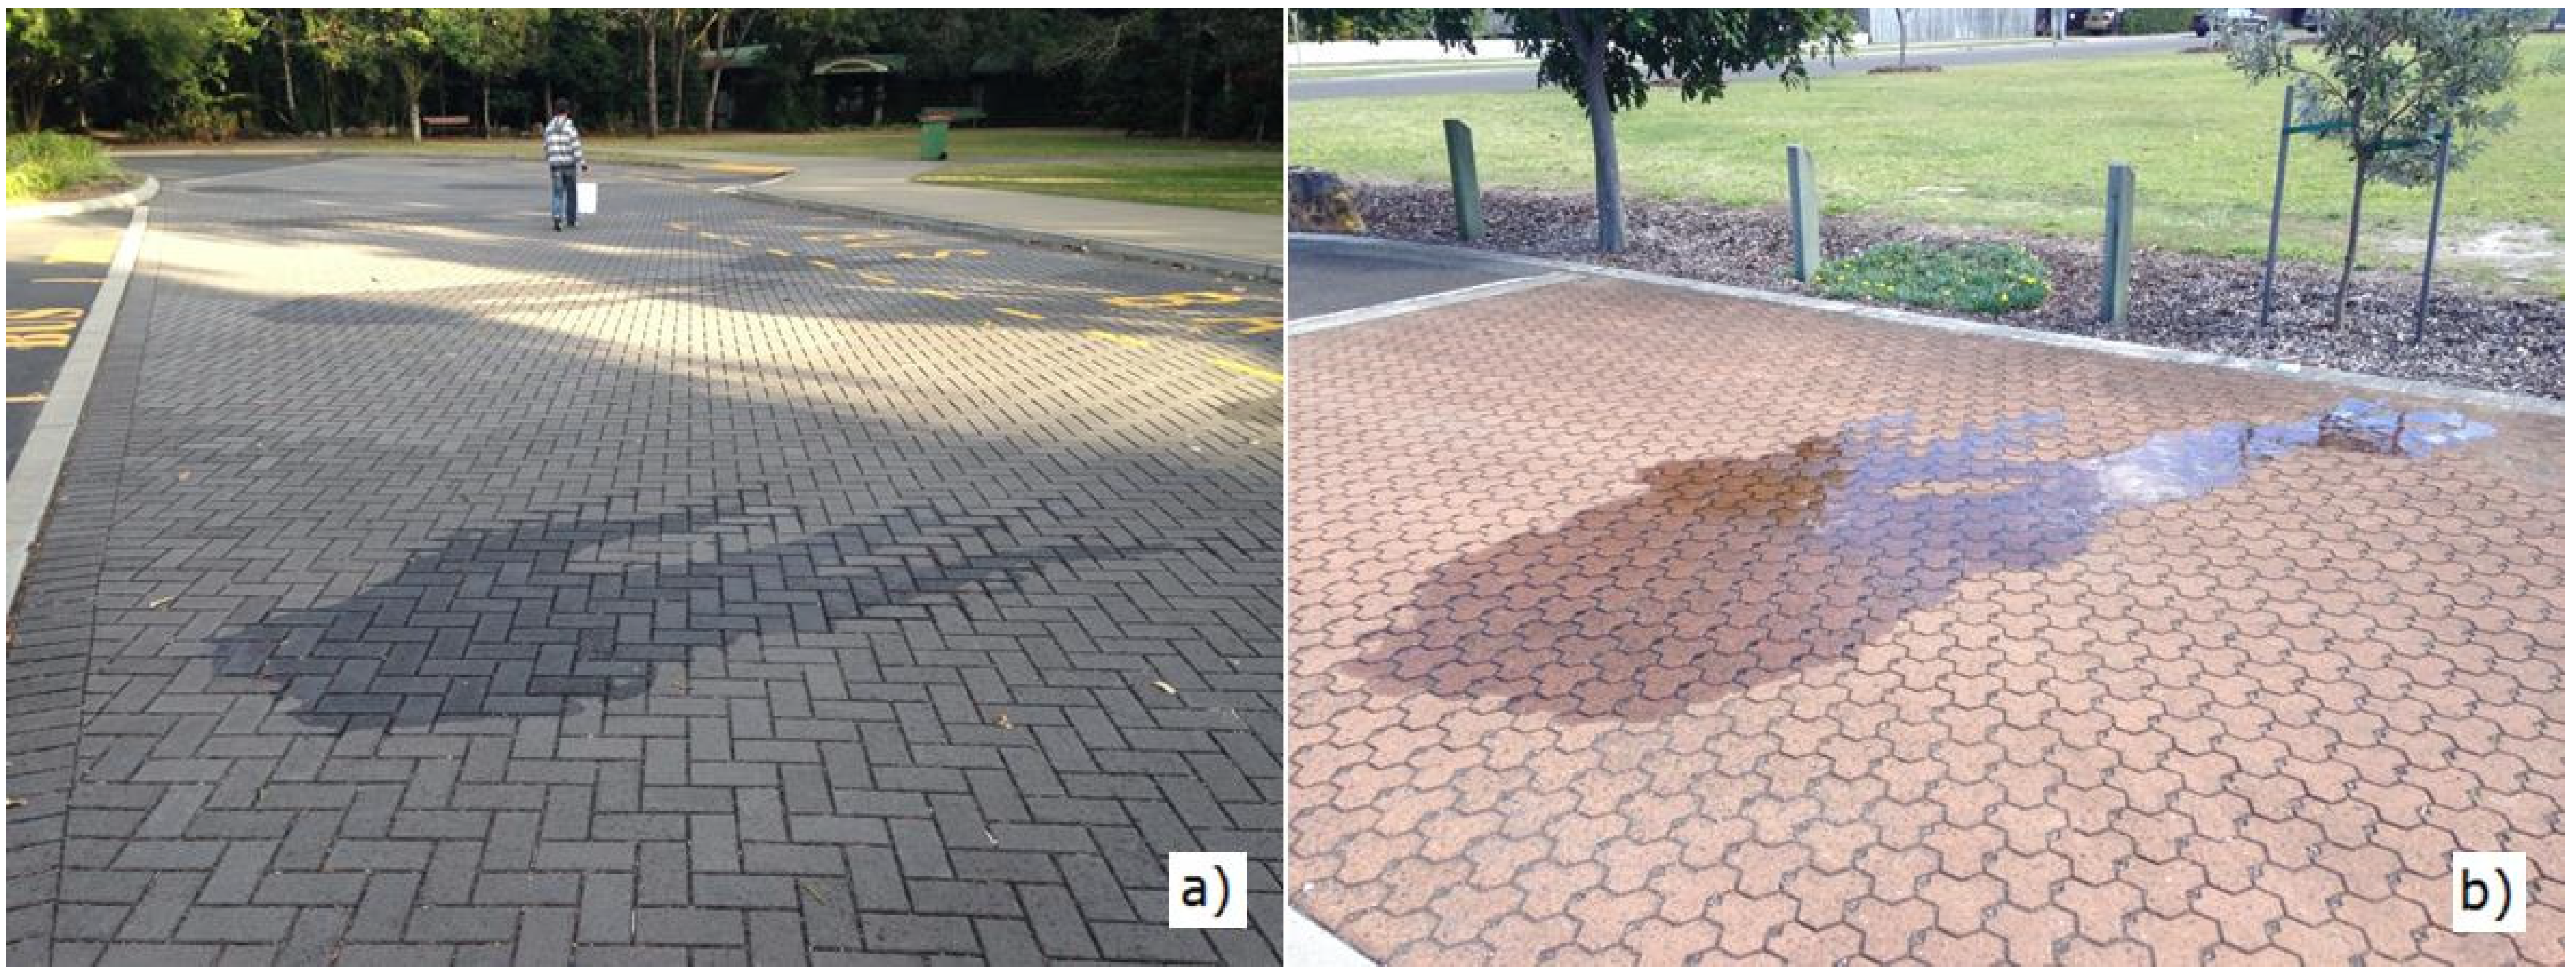
The two replicates of each test method (C1781M-14a and SWIFT) were carried out at precisely the same location at each site (
Figure 6). Replicate testing was undertaken on different days to ensure the PICP surface was dry to allow for the number of wet bricks to be counted.
Figure 6.
Photograph showing SWIFT water stain (30 Fully-wetted bricks) over the precise location previously tested using the SRIT methodology.
Figure 6.
Photograph showing SWIFT water stain (30 Fully-wetted bricks) over the precise location previously tested using the SRIT methodology.
Statistical Analysis
Replicate testing of pavements using both the standard SRIT and SWIFT methods provided scope for appropriate statistical analysis, and interpretation of any potential spatial or temporal variation. The potential variation in measurements between different field operators is also considered an important variable in the accuracy of any infiltrometer [
20]. To overcome this potential source of error all measurements were undertaken by at least two operators in this study. The average of these measurements was used in the analysis of the results.
Correlation analysis (Pearson product-moment correlation coefficient) was used as a measure of the linear correlation (dependence) between the observed infiltration rate measurements from the two methodologies. This gives a value between +1 and −1 inclusive, where 1 is total positive correlation, 0 is no correlation, and −1 is total negative correlation. The variability of the results observed using the two methodologies was tested with the coefficient of variation (CV), using the ratio of the standard deviation to the mean.
3. Results and Discussion
Figure 7 shows the surface infiltration results observed using the SRIT test with the number of wet bricks observed after the SWIFT test for each of the test locations on Sites 1 and 2. The results of 47 different test locations are shown on
Figure 7. An exponential trend line and its equation are also included on
Figure 7. These show a correlation coefficient between the data points and the trend line of 0.854 which is quite high and demonstrates a good correlation. The general trend shown in
Figure 7 is that as the surface infiltration rate decreases, the number of bricks wet by the SWIFT test increases. This result was anticipated and clearly demonstrates the feasibility of using the SWIFT test results to predict surface infiltration rates and potential maintenance requirements.
It was not possible to accurately measure the surface infiltration rates at Site 3 using the SRIT as the whole site was fully blocked. If the water level in the SRIT ring did not measurably decrease within the first 20 min of testing, the tests were discontinued and the sites were classified as fully blocked. It was thought that the reason Site 3 was fully blocked was because sand was used as the bedding layer instead of 2–5 mm aggregate. The small size of the sand between the PICP blocks appeared to become blocked very easily by sediment and organic particles. Using sand between PICPs is no longer recommended in any Australian PICP design guidelines.
The SWIFT test was still undertaken at the Site 3 test locations and the average number of wet bricks was 168 for these tests. Accordingly,
Figure 7 does not contain any test data from Site 3. Inputting a value of 168 into the
Figure 7 trendline equation produces an approximate infiltration rate of 5 mm/h (used in
Figure 8) which is consistent with being effectively fully blocked.
Figure 7.
Comparison of PICP infiltration rates using SRIT and SWIFT methods.
Figure 7.
Comparison of PICP infiltration rates using SRIT and SWIFT methods.
Figure 8.
Comparison of PICP infiltration rates (± Standard Deviation) using SRIT and SWIFT methods.
Figure 8.
Comparison of PICP infiltration rates (± Standard Deviation) using SRIT and SWIFT methods.
A correlation analysis (n = 58) was also undertaken and the Pearson’s Product-Moment Correlation Coefficient (Pearson’s r) between the SRIT and SWIFT test results was found to be −0.714. This value is further evidence of the strong relationship that exists between the results.
Infiltration rates observed using both the SRIT and SWIFT methods varied between sites (
Figure 8). Infiltration rates were substantially higher for all Site 1 tests compared with Sites 2 and 3. Average infiltration rates varied between 5 mm/h (calculated for Site 3) and 10,192 mm/h (Site 1d) using the SRIT.
Figure 8 again demonstrates that the number of fully wetted bricks increased with decreasing infiltration rates. At the sites with lower measured infiltration rates during operation of the SWIFT method, counts of the number of wetted bricks increased six-fold (mean values ranged between 23 and 120). This shows a clear inverse relationship between infiltration rates and number of wet bricks, as expected.
The variability of the tests, calculated using the coefficient of variation (CV) differed substantially between methods (average SRIT CV = 30.1%; average SWIFT CV = 14.7%). The calculated CV was generally higher for the SRIT method compared to the results observed using the SWIFT method. This suggests that overall, the SWIFT had a lower degree of variability between tests when compared to the SRIT, providing more consistent results across all sites. However, the CV results did vary between sites with high infiltration compared to those with low infiltration. The calculated CV (30.7%) of the SRIT method used on sites with high infiltration was similar to those with low infiltration (28.1%). The calculated CV of the SWIFT method used on sites with high infiltration (12.9%) was calculated to be substantially lower than sites with lower infiltration (20.2%).
The low variability in SWIFT test results combined with the strong correlation between methods used, suggest that the new method may be used on PICPs to broadly categorise the degree of PICP clogging, and quickly and reliably determine PICP maintenance requirements.
Using the results shown in
Figure 7, it was possible to relate the approximate number of wetted bricks expected from the SWIFT test to the infiltration rates and blockage categories listed in
Table 1. Previous research by Borgwardt [
7] investigated the reduction in PICP infiltration capacity over time. He found that the infiltration capacity of PICPs typically reduced exponentially to around 20% of the newly-installed infiltration rate after approximately 10 years in service. By combining Borgwardt’s [
7] results with those in
Figure 7, suggested PICP maintenance requirements were estimated based on the SWIFT test results. These are shown in
Table 2. It must be noted the maintenance intervals suggested in
Table 2 are indicative only and should only be used as a general guideline.
Table 2.
Suggested PICP maintenance requirements for SWIFT test results.
Table 2.
Suggested PICP maintenance requirements for SWIFT test results.
| SWIFT—No. of Fully Wetted Bricks | Blockage Category | Maintenance Requirements |
|---|
| Less than 29 | Unblocked | No maintenance required for foreseeable future |
| Between 29 and 133 | Medium Blocked | Plan for maintenance within next 1–3 years |
| More than 133 | Fully Blocked | Immediate maintenance required |
| European Comparison |
| More than 109 | Below Minimum European PICP Infiltration Rate | Immediate maintenance required |
There are several fundamental differences between the SRIT and SWIFT methods compared in this study. The SRIT method calculates an actual surface infiltration rate (in mm/h) by dividing units of volume by area and time. By comparison, the SWIFT method does not allow the calculation of an actual pavement infiltration rate, rather it results in a specific number of fully-wetted pavement blocks. The blockage category and the corresponding suggested maintenance requirements for the pavement are then determined using the guidelines listed in
Table 2. The SWIFT method was developed as a fast and convenient infiltration field test to assign broad infiltration categories to pavements in order to quickly determine pavement maintenance requirements. The SWIFT was not developed to determine PICP surface infiltration rates.
Secondly, the SRIT is conducted using the constant head (or sometimes the falling-head) method, and the SWIFT is conducted under little or no head (natural rainfall conditions). Infiltration rate tests involving artificial pressure heads are known to result in higher measured surface infiltration rates [
20,
24,
25]. The effects of the head differences was not relevant in this comparative study because the SWIFT results are not intended to be used to calculate an actual infiltration rate, but only to rapidly identify pavement maintenance requirements. Future testing of the SWIFT on pavements with a wide range of blockage categories will enable a more precise conversion of SWIFT results into estimated infiltration rates. A more detailed investigation of the effects of different PICP block shapes and open spaces is also planned.
There were also numerous practical and time-saving advantages in using the SWIFT method. The main advantage was in not having to use a sealant to try to avoid water leakage from the rings. Setting up the SWIFT device was therefore not time-consuming like other test methods, and the testing was fast and efficient. In addition, no post-test clean-up was required as no sealant was used. Including set-up time, the duration of each SWIFT test was approximately two minutes. Furthermore, all of the equipment used for conducting the SWIFT test was inexpensive, and easy to obtain and assemble.
Where the SRIT has the advantage of being an accurate test of surface infiltration rates of permeable pavements, it also requires access to specialised equipment and has a significant setup time. The rapid nature of the SWIFT methodology, and low variability in results, particularly on sites with high infiltration, suggest it may also be suitable for carrying out multiple tests on large sites. This could significantly increase the speed of testing over larger areas and enable a fast classification of the overall state of pavement clogging across numerous and large sites. This would also allow for a more effective and efficient maintenance planning process.
The study results and strong correlations between tests suggest that the assignment of clogging categories and maintenance requirements using the SWIFT testing methodology (
Table 2) may be an acceptable and reliable field test method for identifying the state of PICP clogging and for planning maintenance activities. The SWIFT test is a simple, fast and inexpensive way for asset managers and local government employees to quickly assess the maintenance requirements of PICP installations in the field. Although the SWIFT method still needs more research and evaluation to verify its suitability across a wide range of applications and
different pavement types, it has the potential to be accepted on a global scale as the new benchmark for PICP infiltration testing. Further research is currently underway.
4. Conclusions
Measurement of infiltration rates of PICPs has previously been problematic for a variety of reasons, including the practical difficulties in applying existing test methodologies, access to the specialised equipment required for testing, and the time taken to undertake each test. This study examined and compared the performance of two PICP surface infiltration rate measurement methods to estimate the degree of PICP clogging: the Single-Ring Infiltrometer Test (ASTM C1781M-14a) method, and a newly-developed field test, the stormwater infiltration field test (SWIFT) method.
This study found that the SWIFT was a reliable method for estimating the degree of clogging of PICPs, and as indicated through correlation analysis, provides comparable results to the SRIT. A strong correlation (Pearson’s r = −0.714) was found between results using the two methods. The new SWIFT methodology reliably categorised the degree of PICP clogging while successfully overcoming some of the problems with the more technical existing test methodology such as horizontal water leakage (use of sealant), unrealistic pressure heads, speed of test, and portability. The SWIFT also involves minimal setup costs, and is a device that is easily assembled from common items. The ease of conducting the test, and increased speed of testing when undertaking multiple tests, will reduce overall operator costs. The SWIFT test is a simple, fast and inexpensive way for asset managers and local government employees to quickly assess the maintenance requirements of PICP installations in the field.


