
Providing Evidence-Based, Intelligent Support for Flood Resilient Planning and Policy: The PEARL Knowledge Base

 ,
,  and
and 
Abstract
:
1. Introduction
- The Natural Water Retention Measures (NWRM) project aimed at collaboratively building knowledge and promoting best practice on Natural Water Retention Measures in Europe [9];
- The FP7 PREPARED project focused on developing advanced strategies for meeting climate related challenges of European and Worldwide Water and Sanitation Utilities [10]; and
2. Materials and Methods
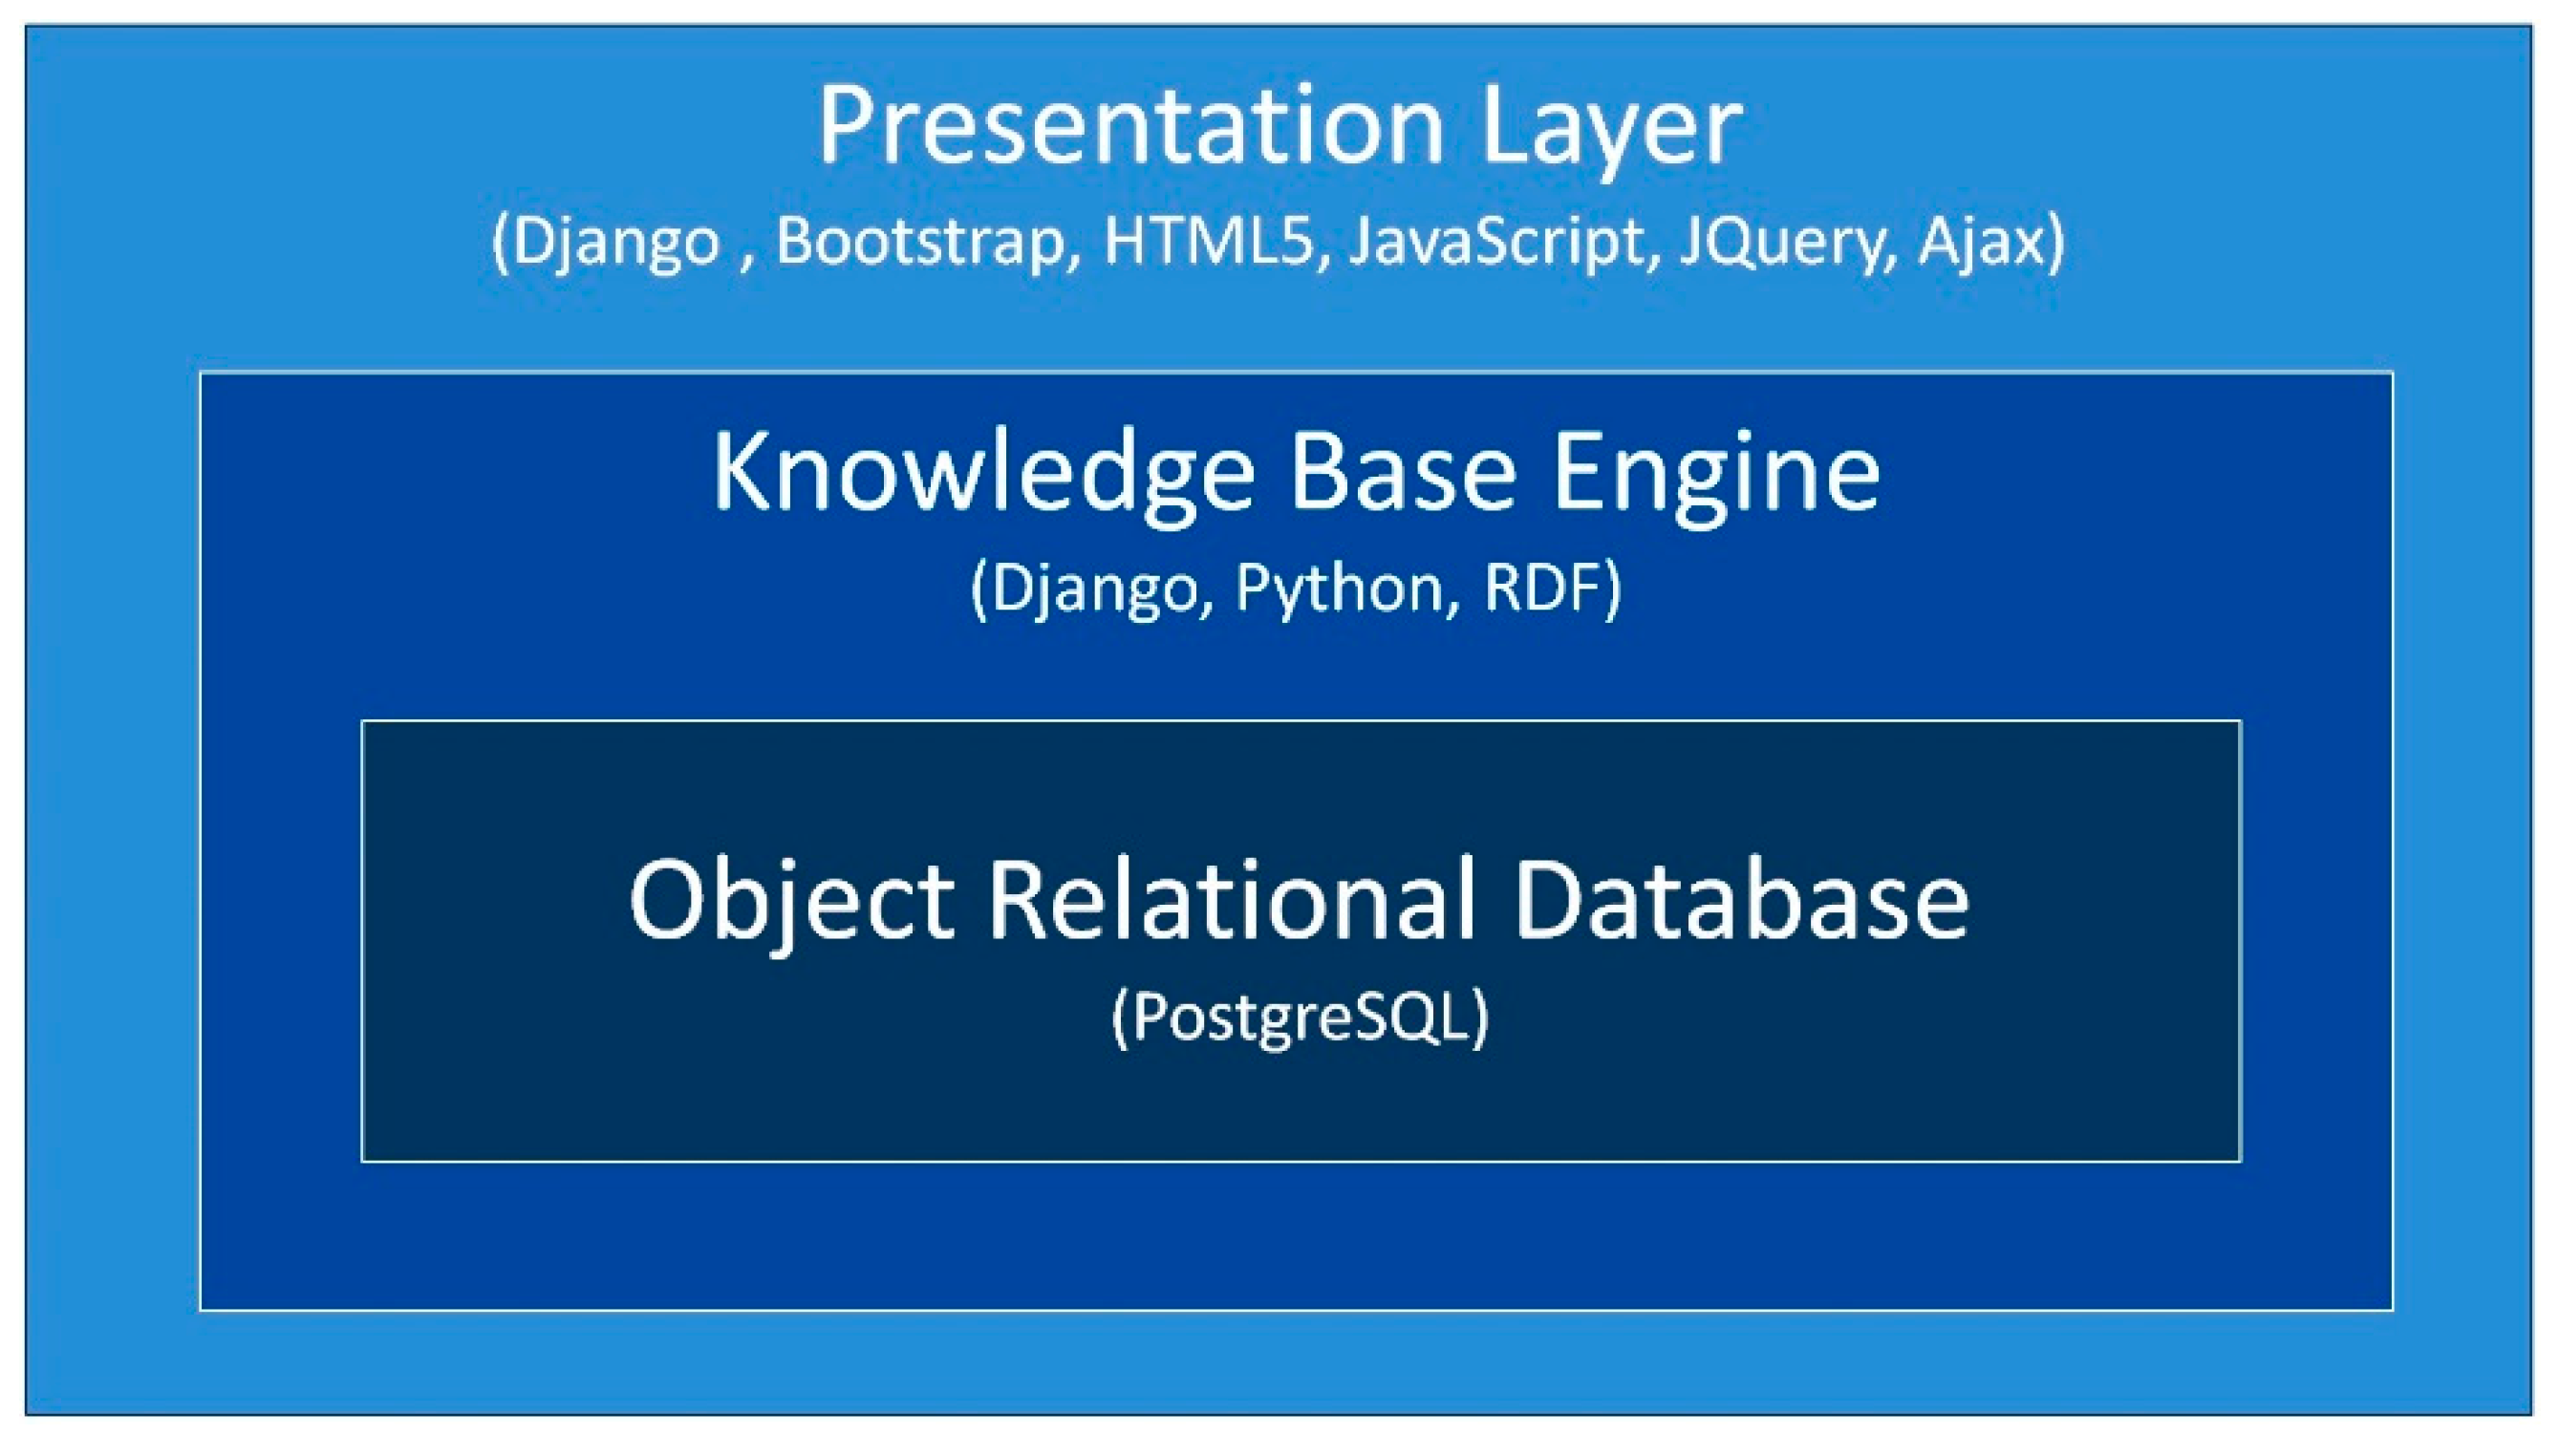
2.1. Developing the Knowledge Base
2.1.1. Back End Development
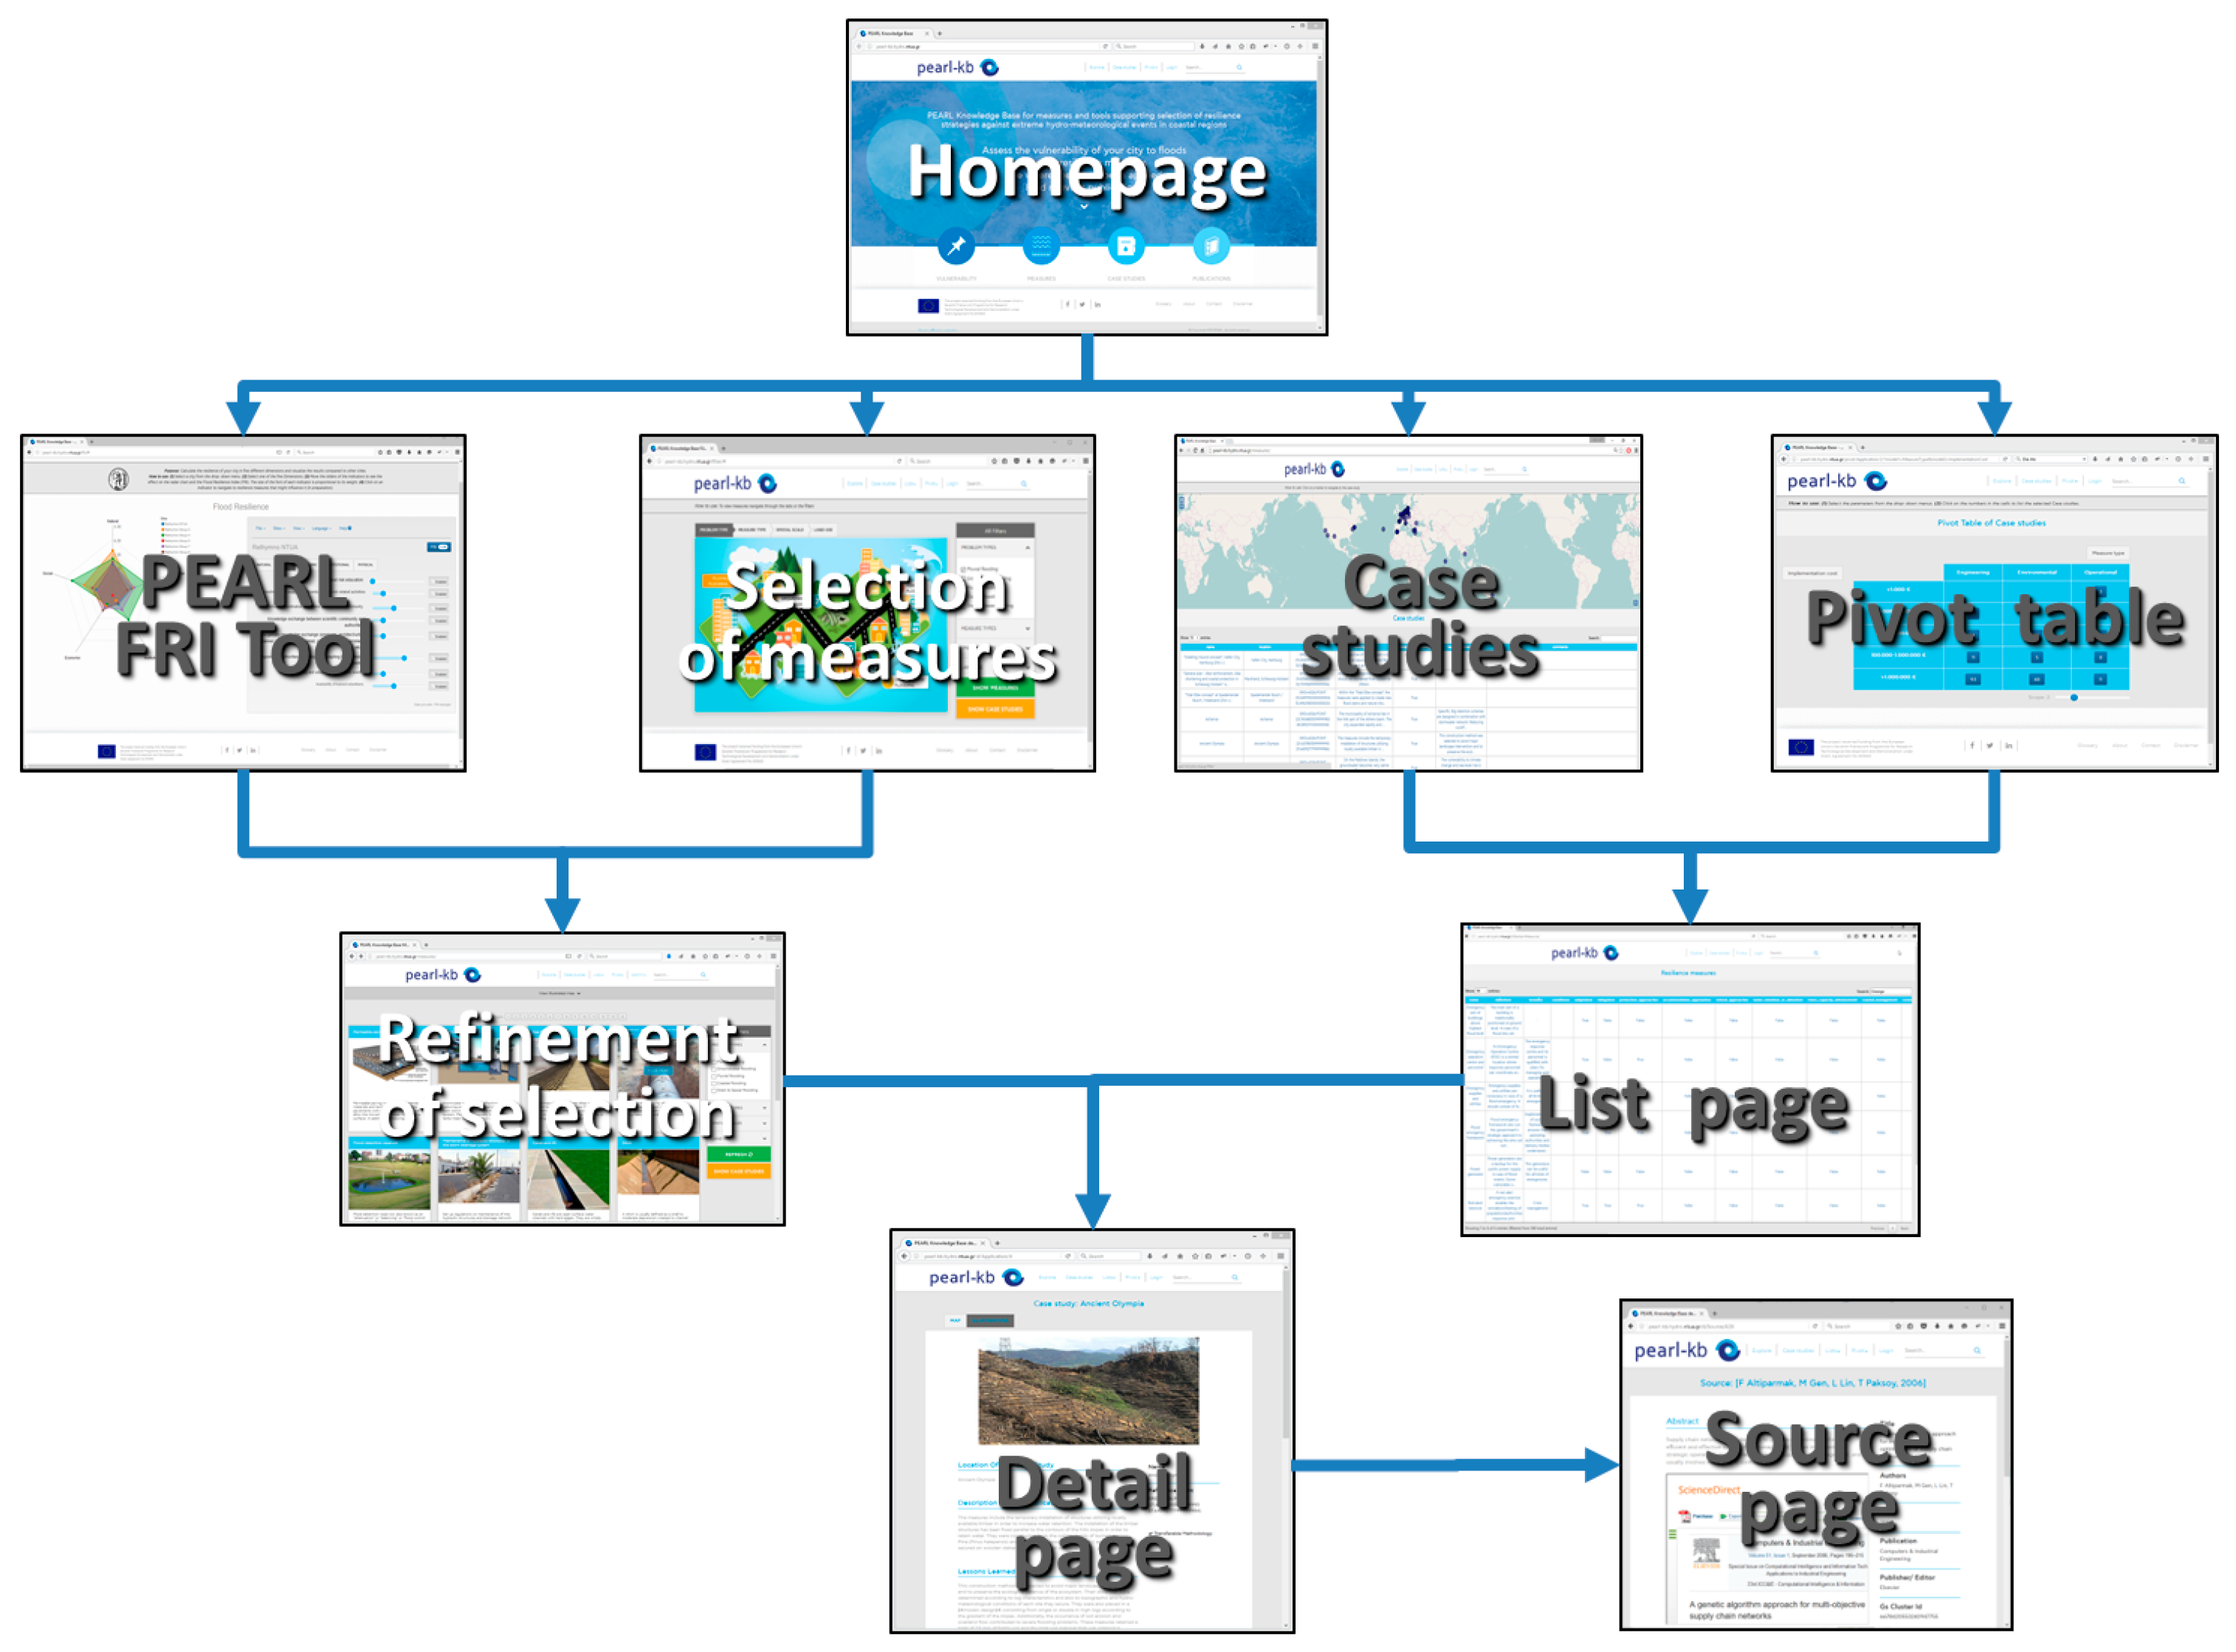
- Creation of lists of records from an arbitrary class, such as case studies or publication sources/
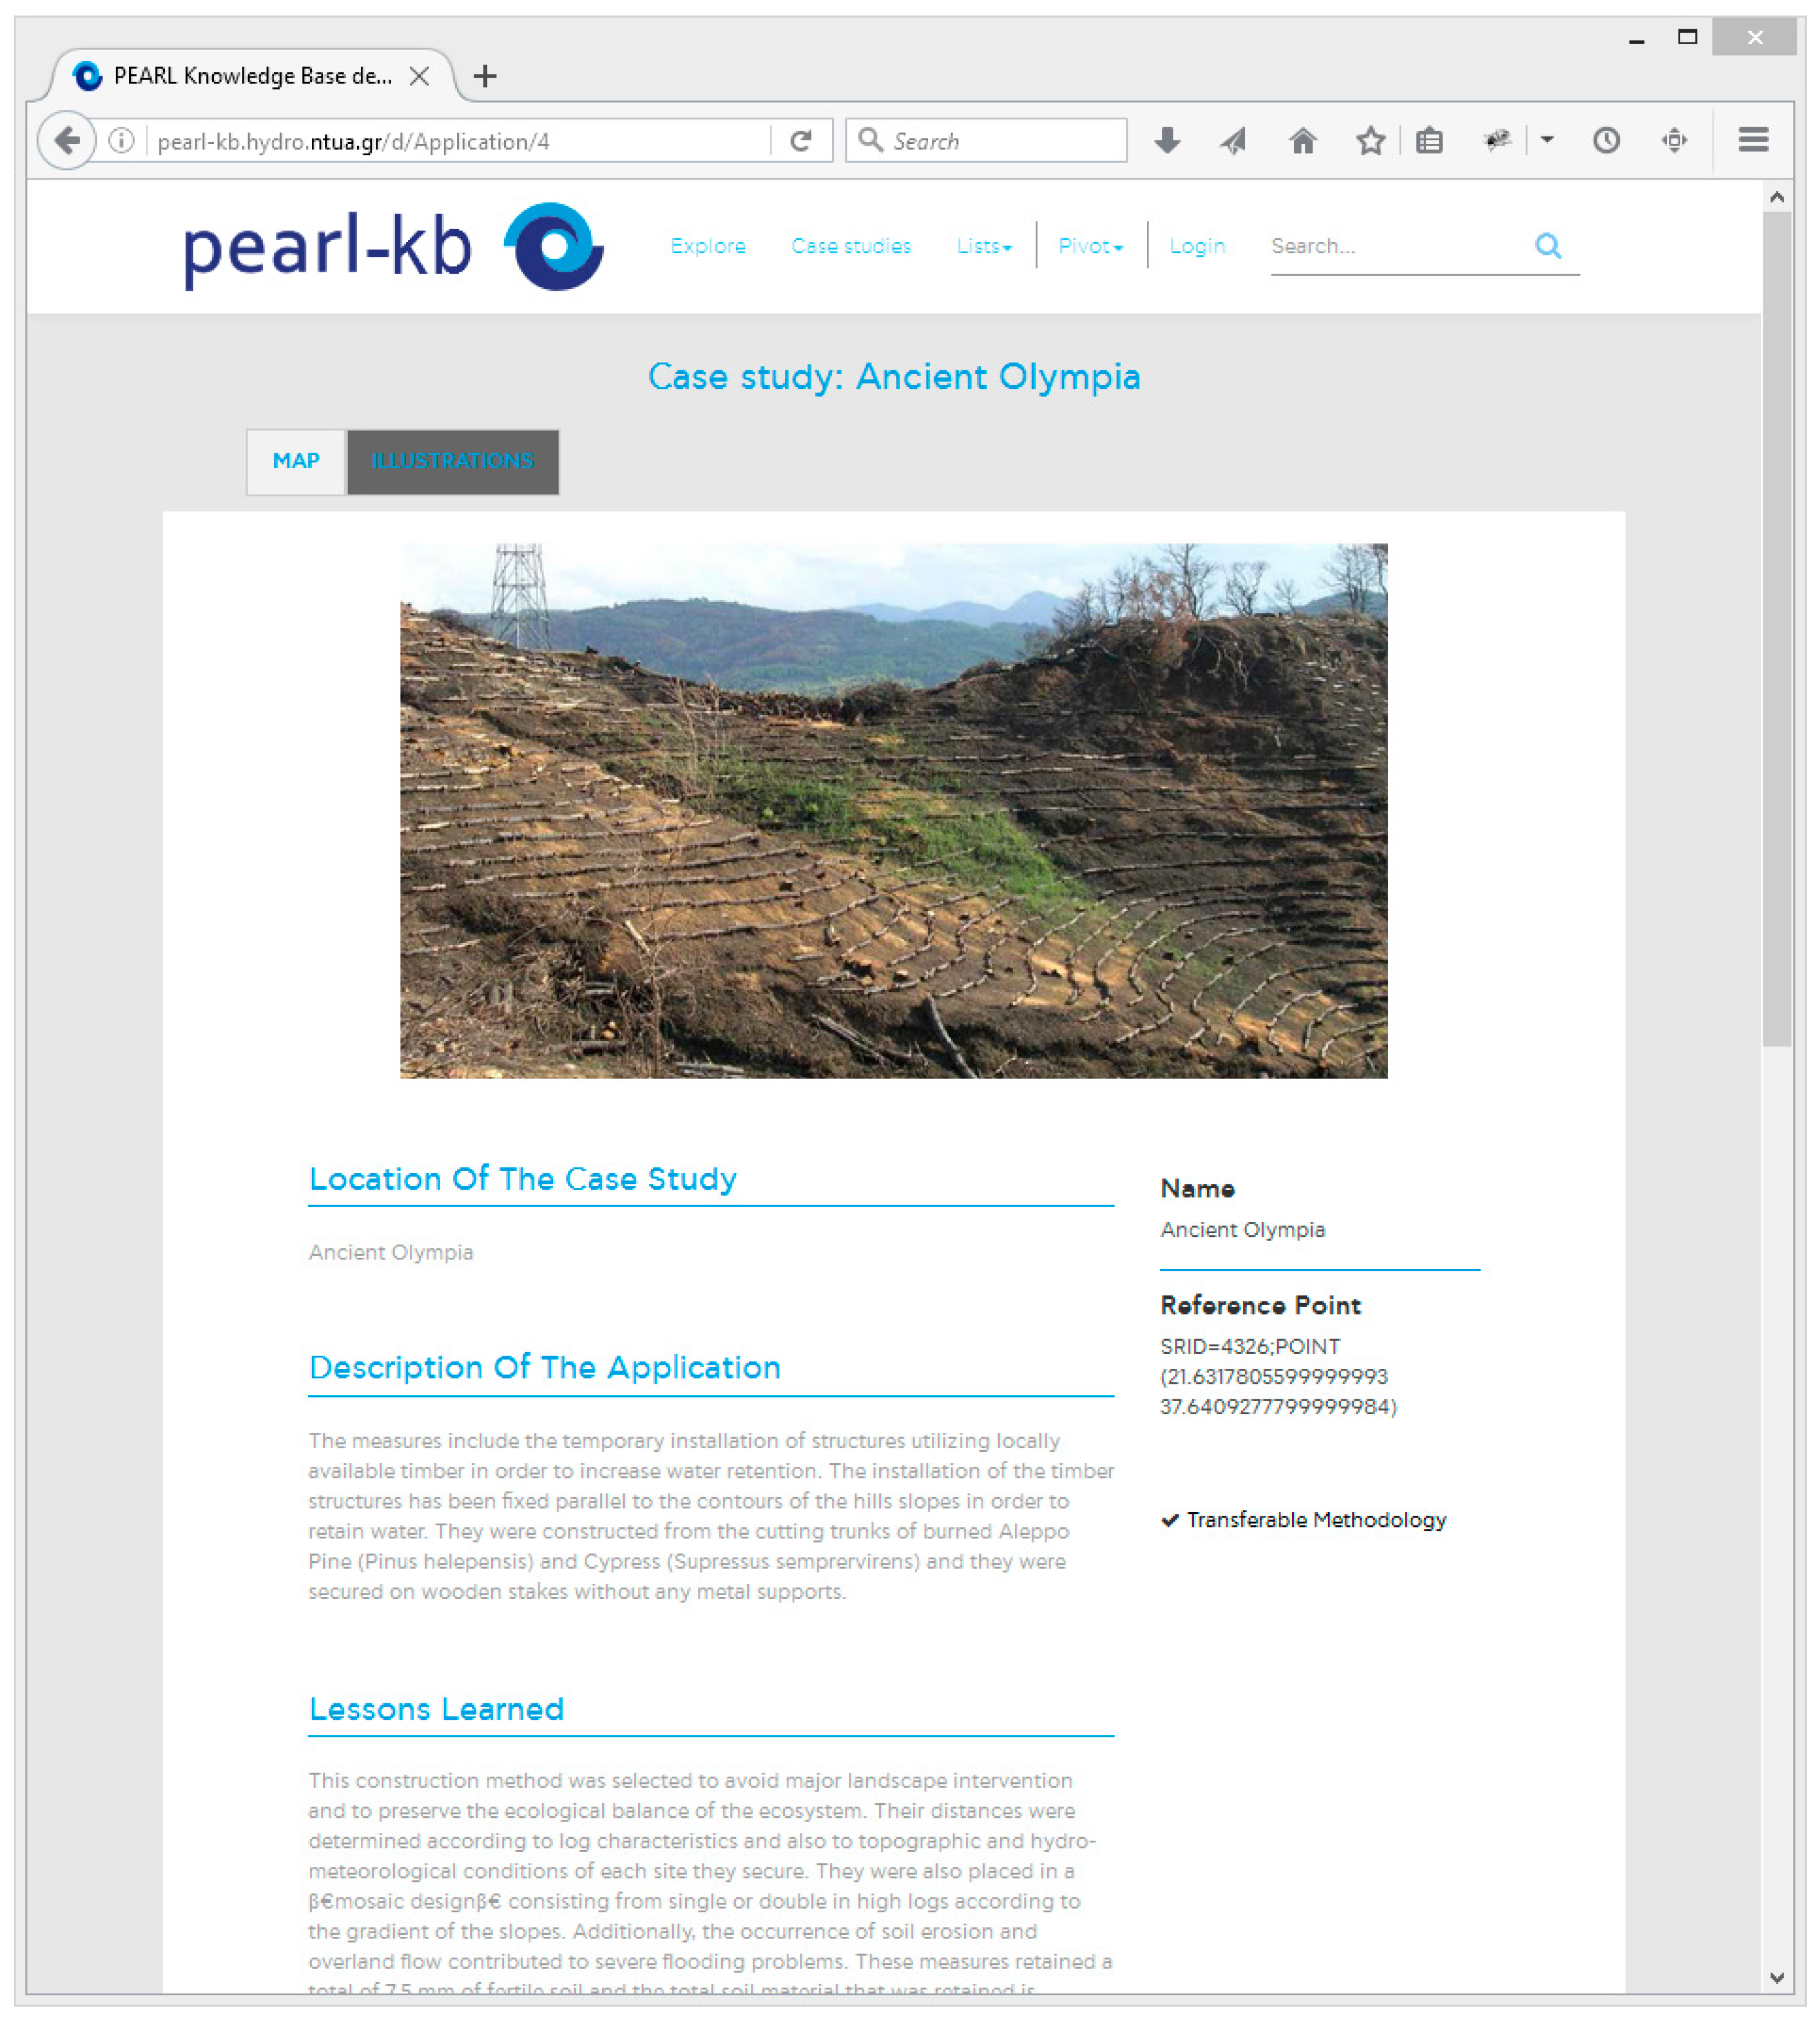
- Collection of detailed information for an arbitrary object, including its relations to other objects and, in the case of georeferenced objects, their location on the map.
- Textual search by applying approximate string matching.
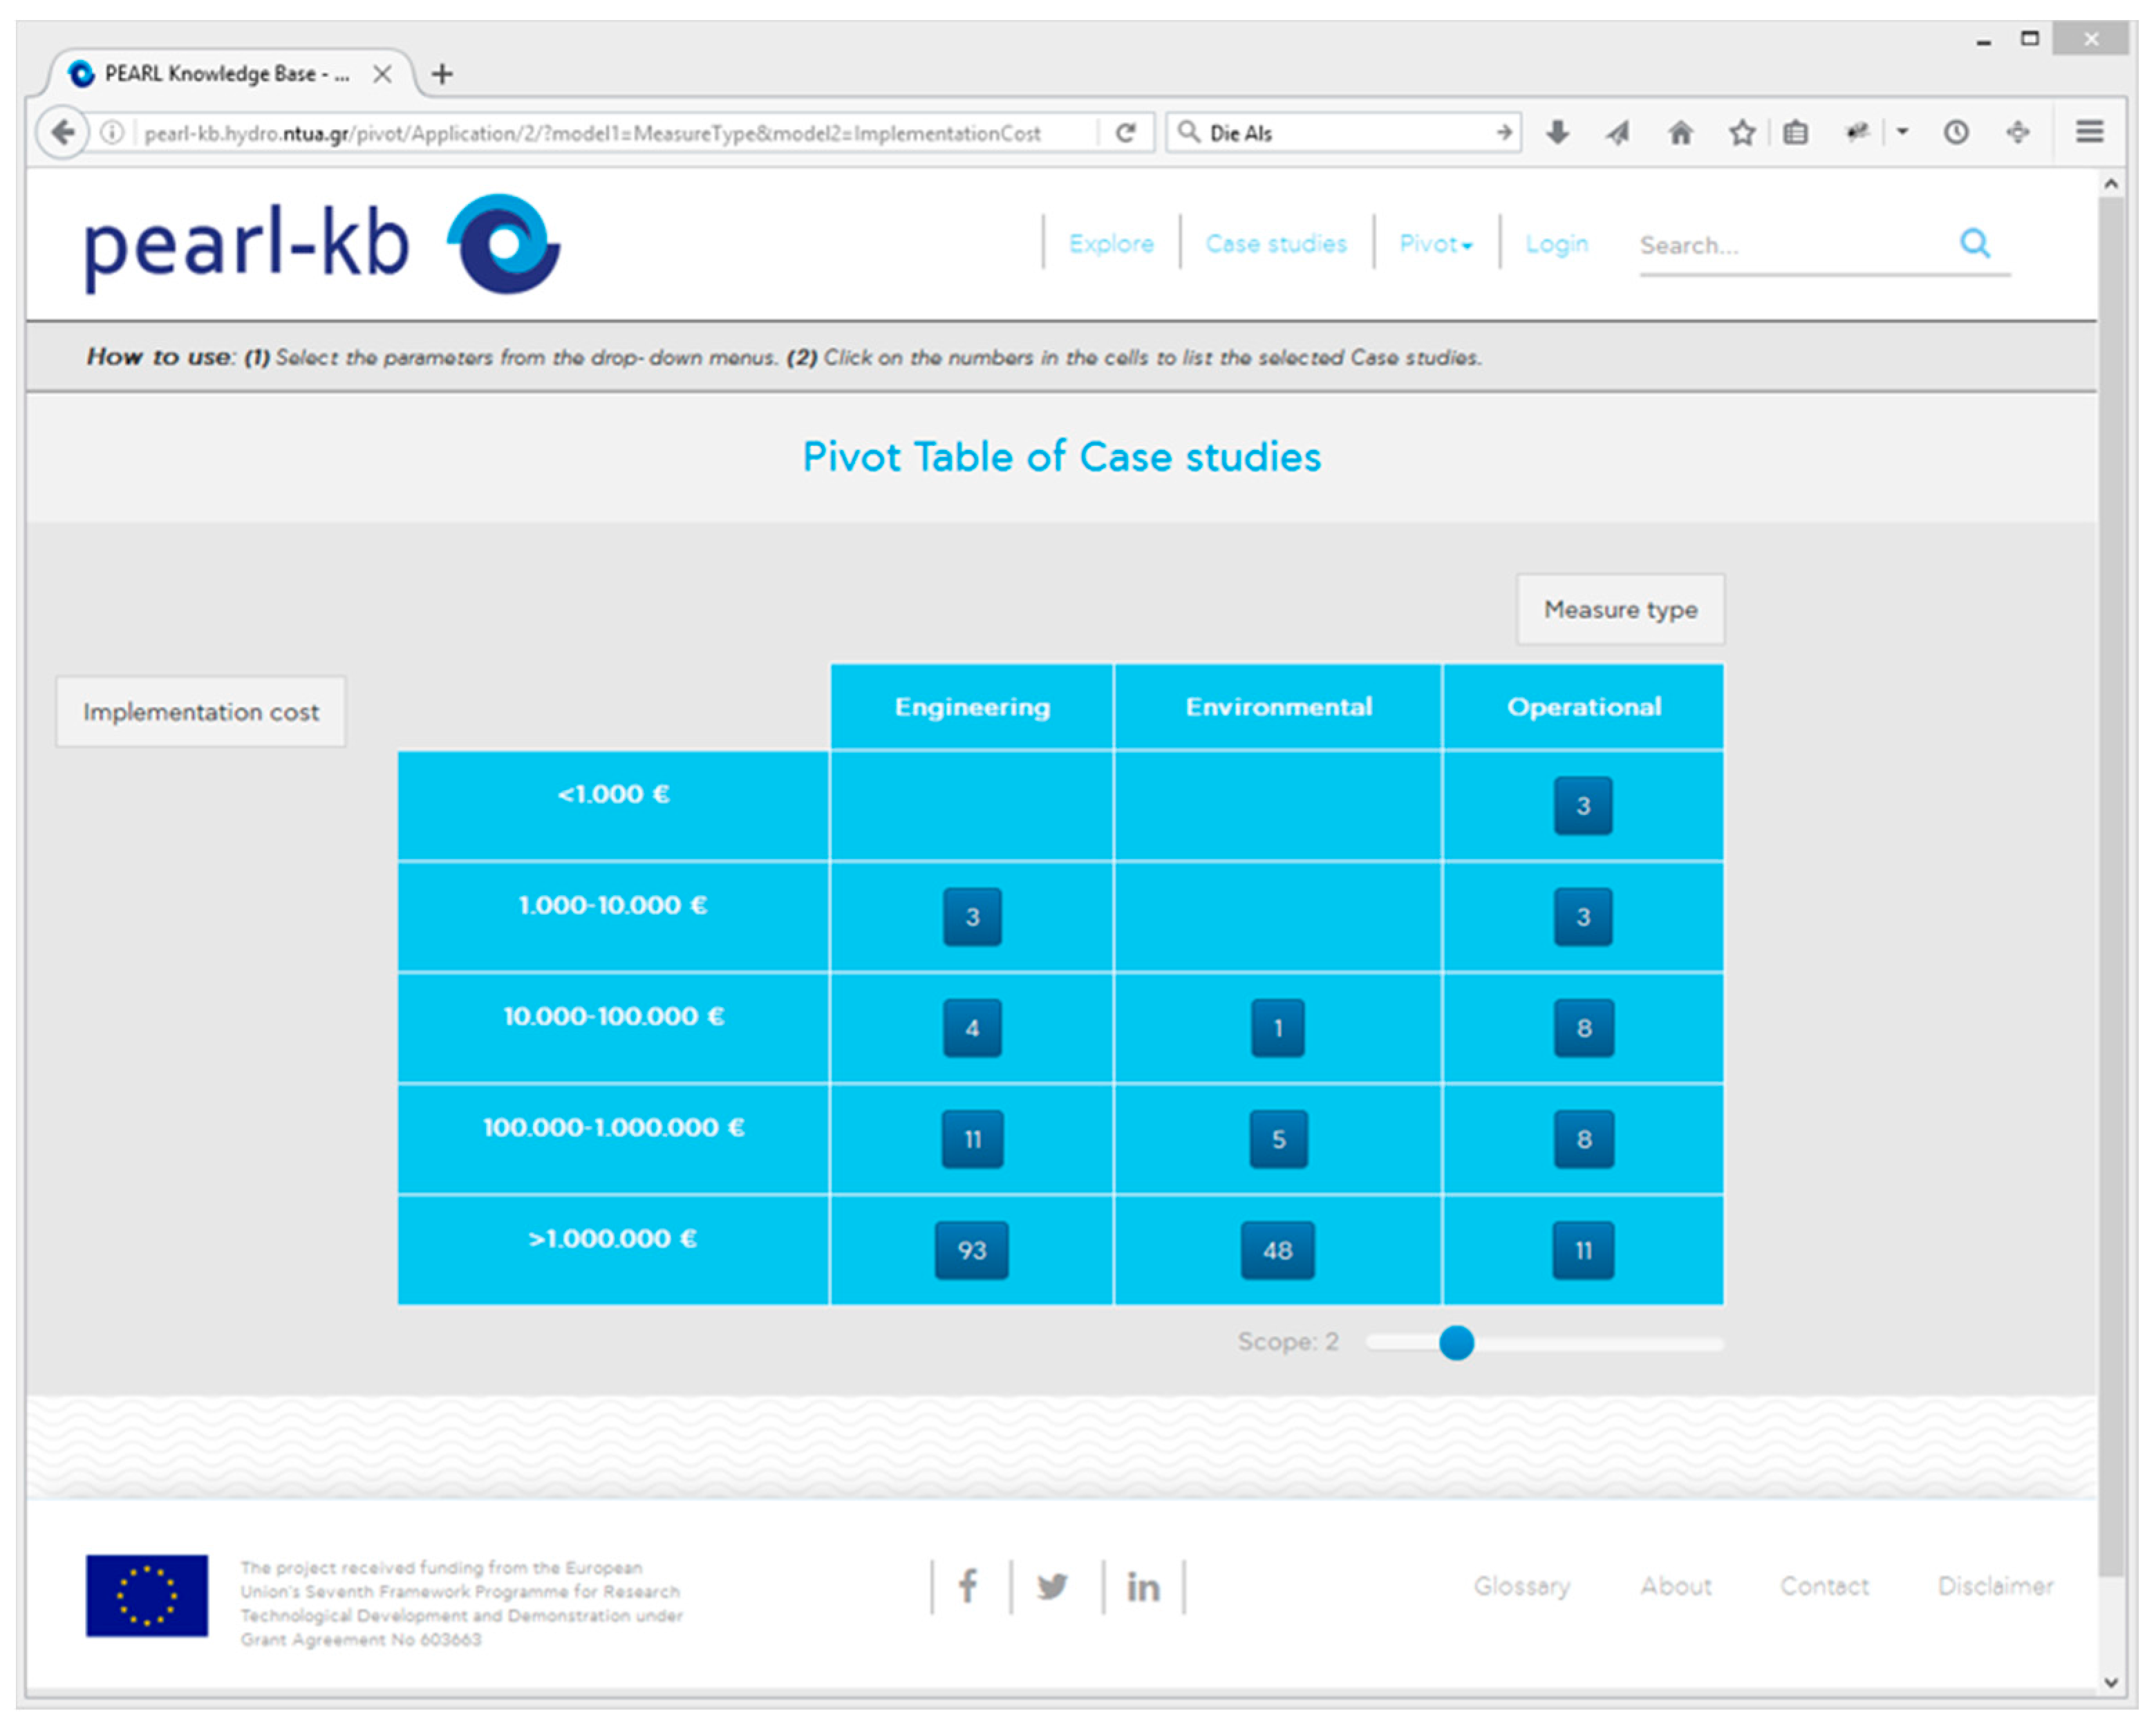
- Pivot table summarizing information from several tables of the database.
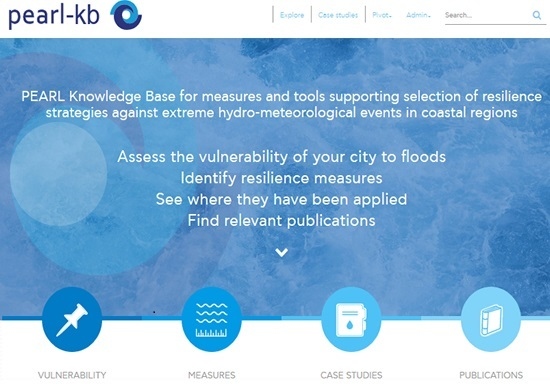
2.1.2. Front End Development
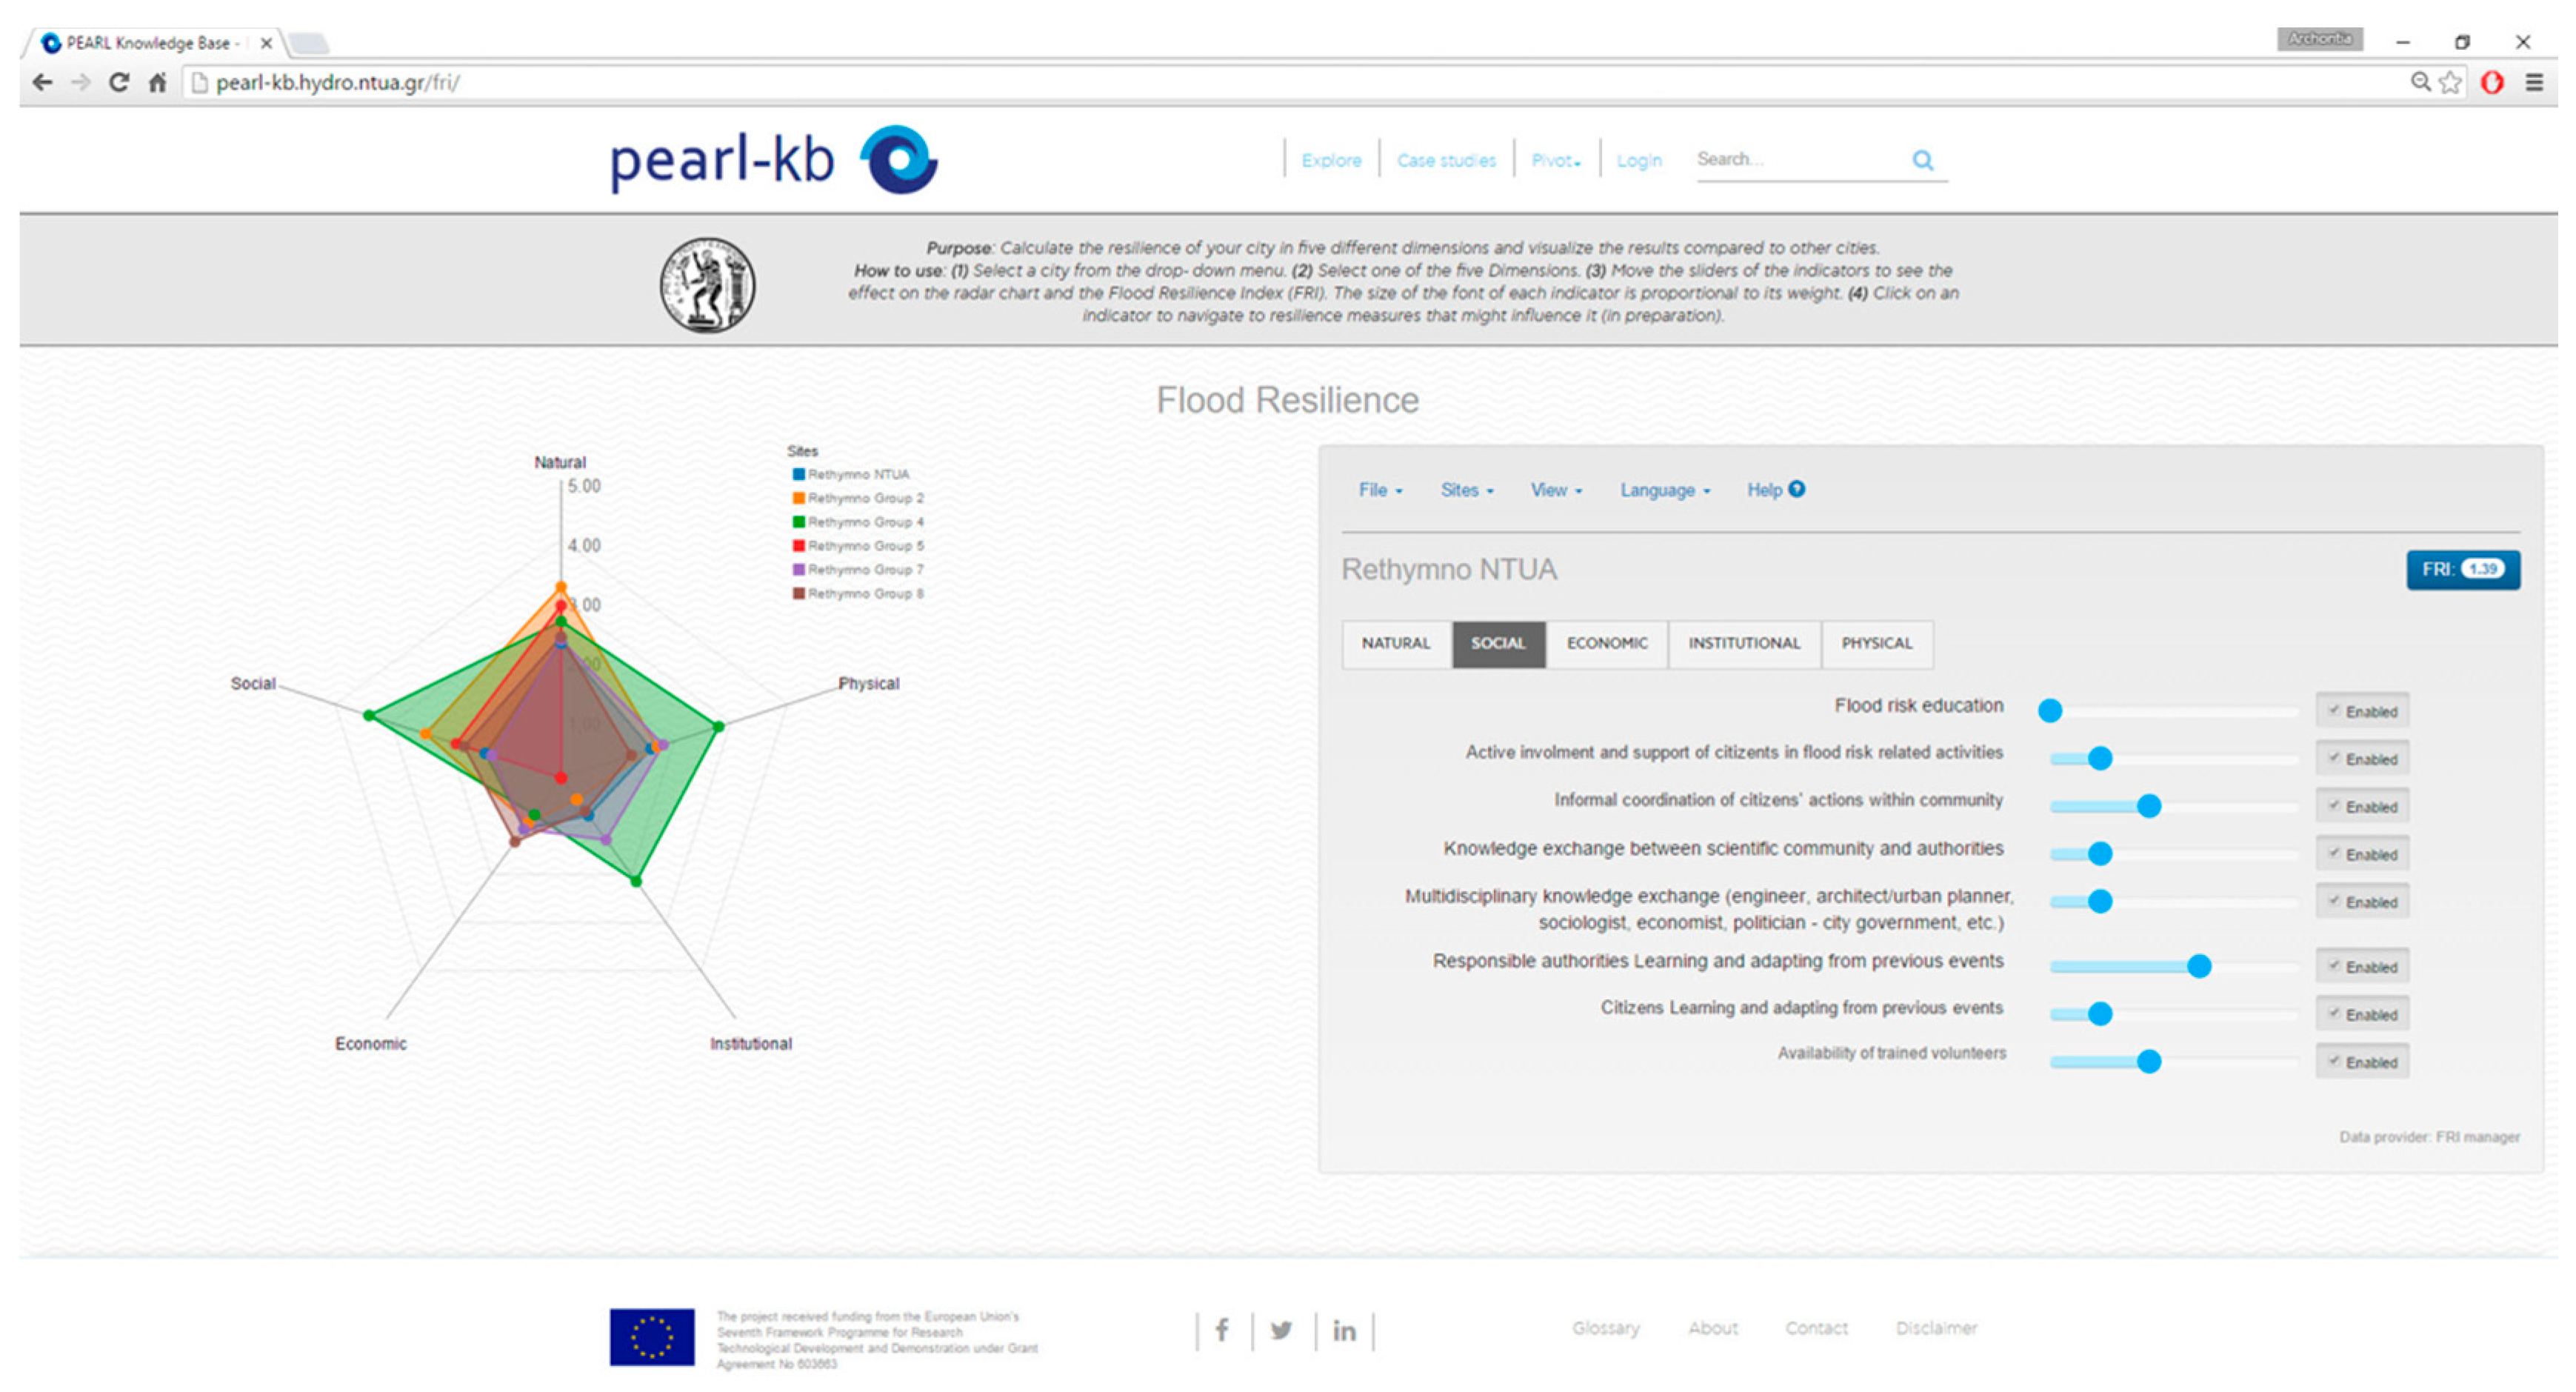
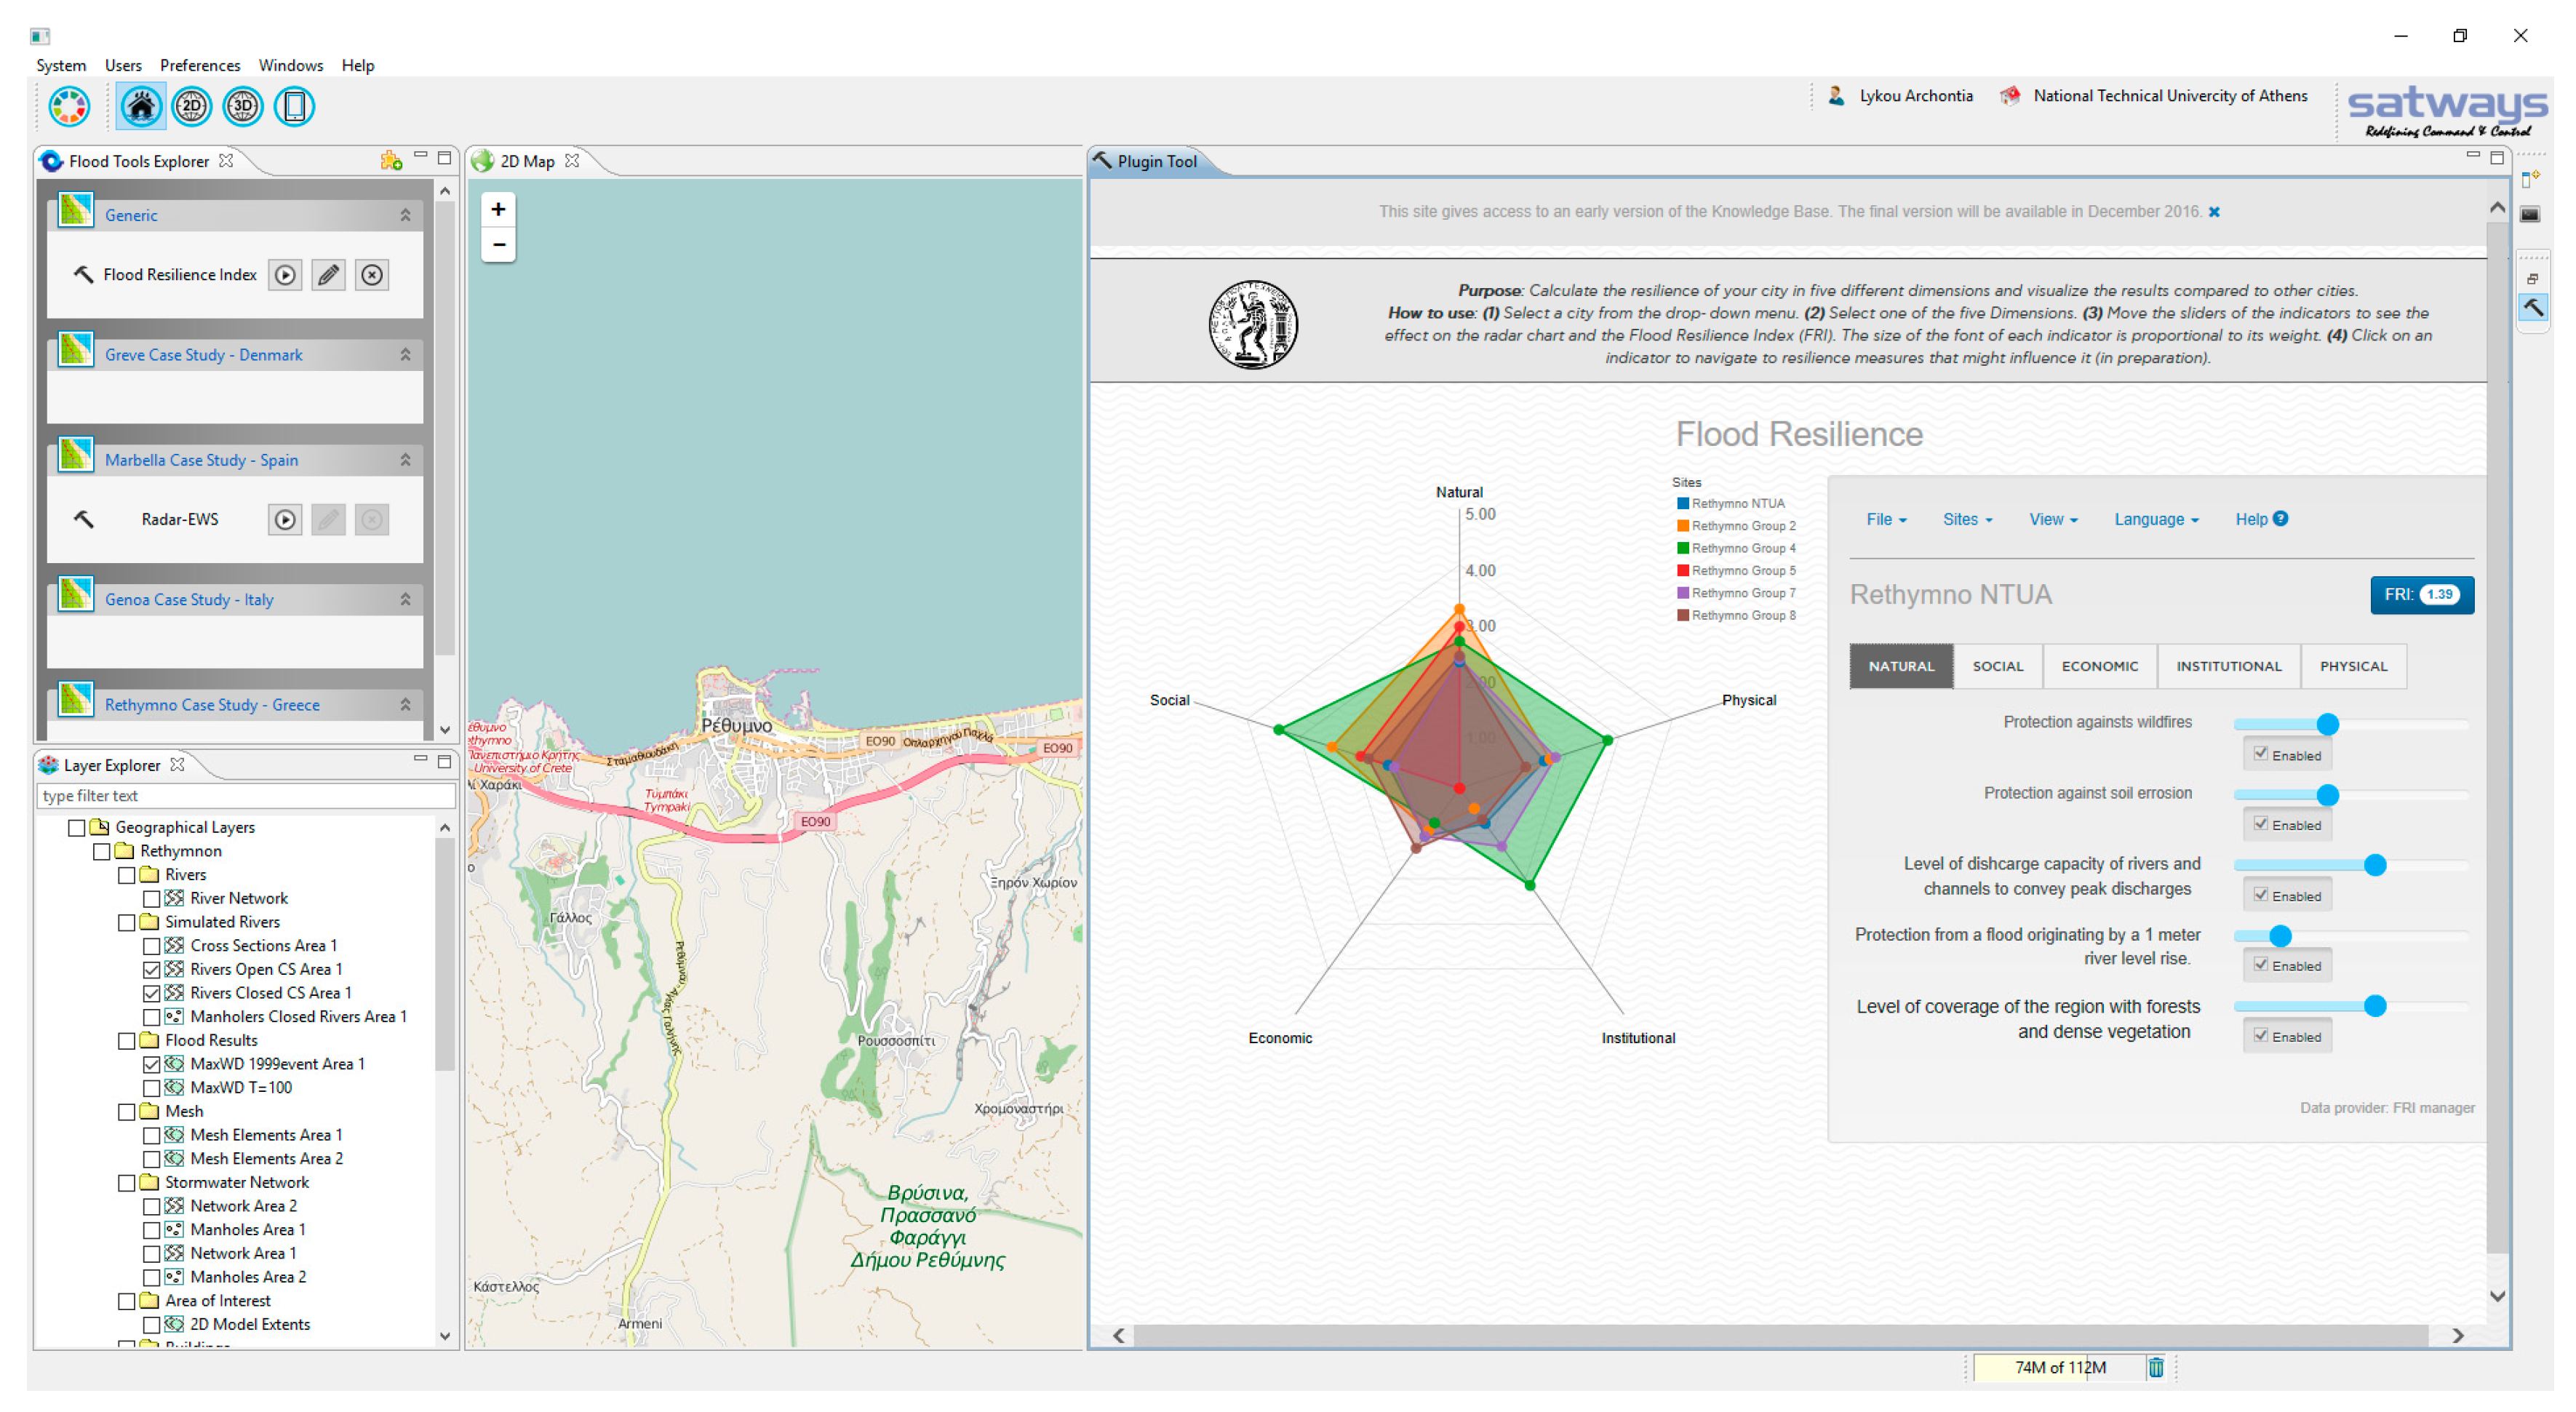
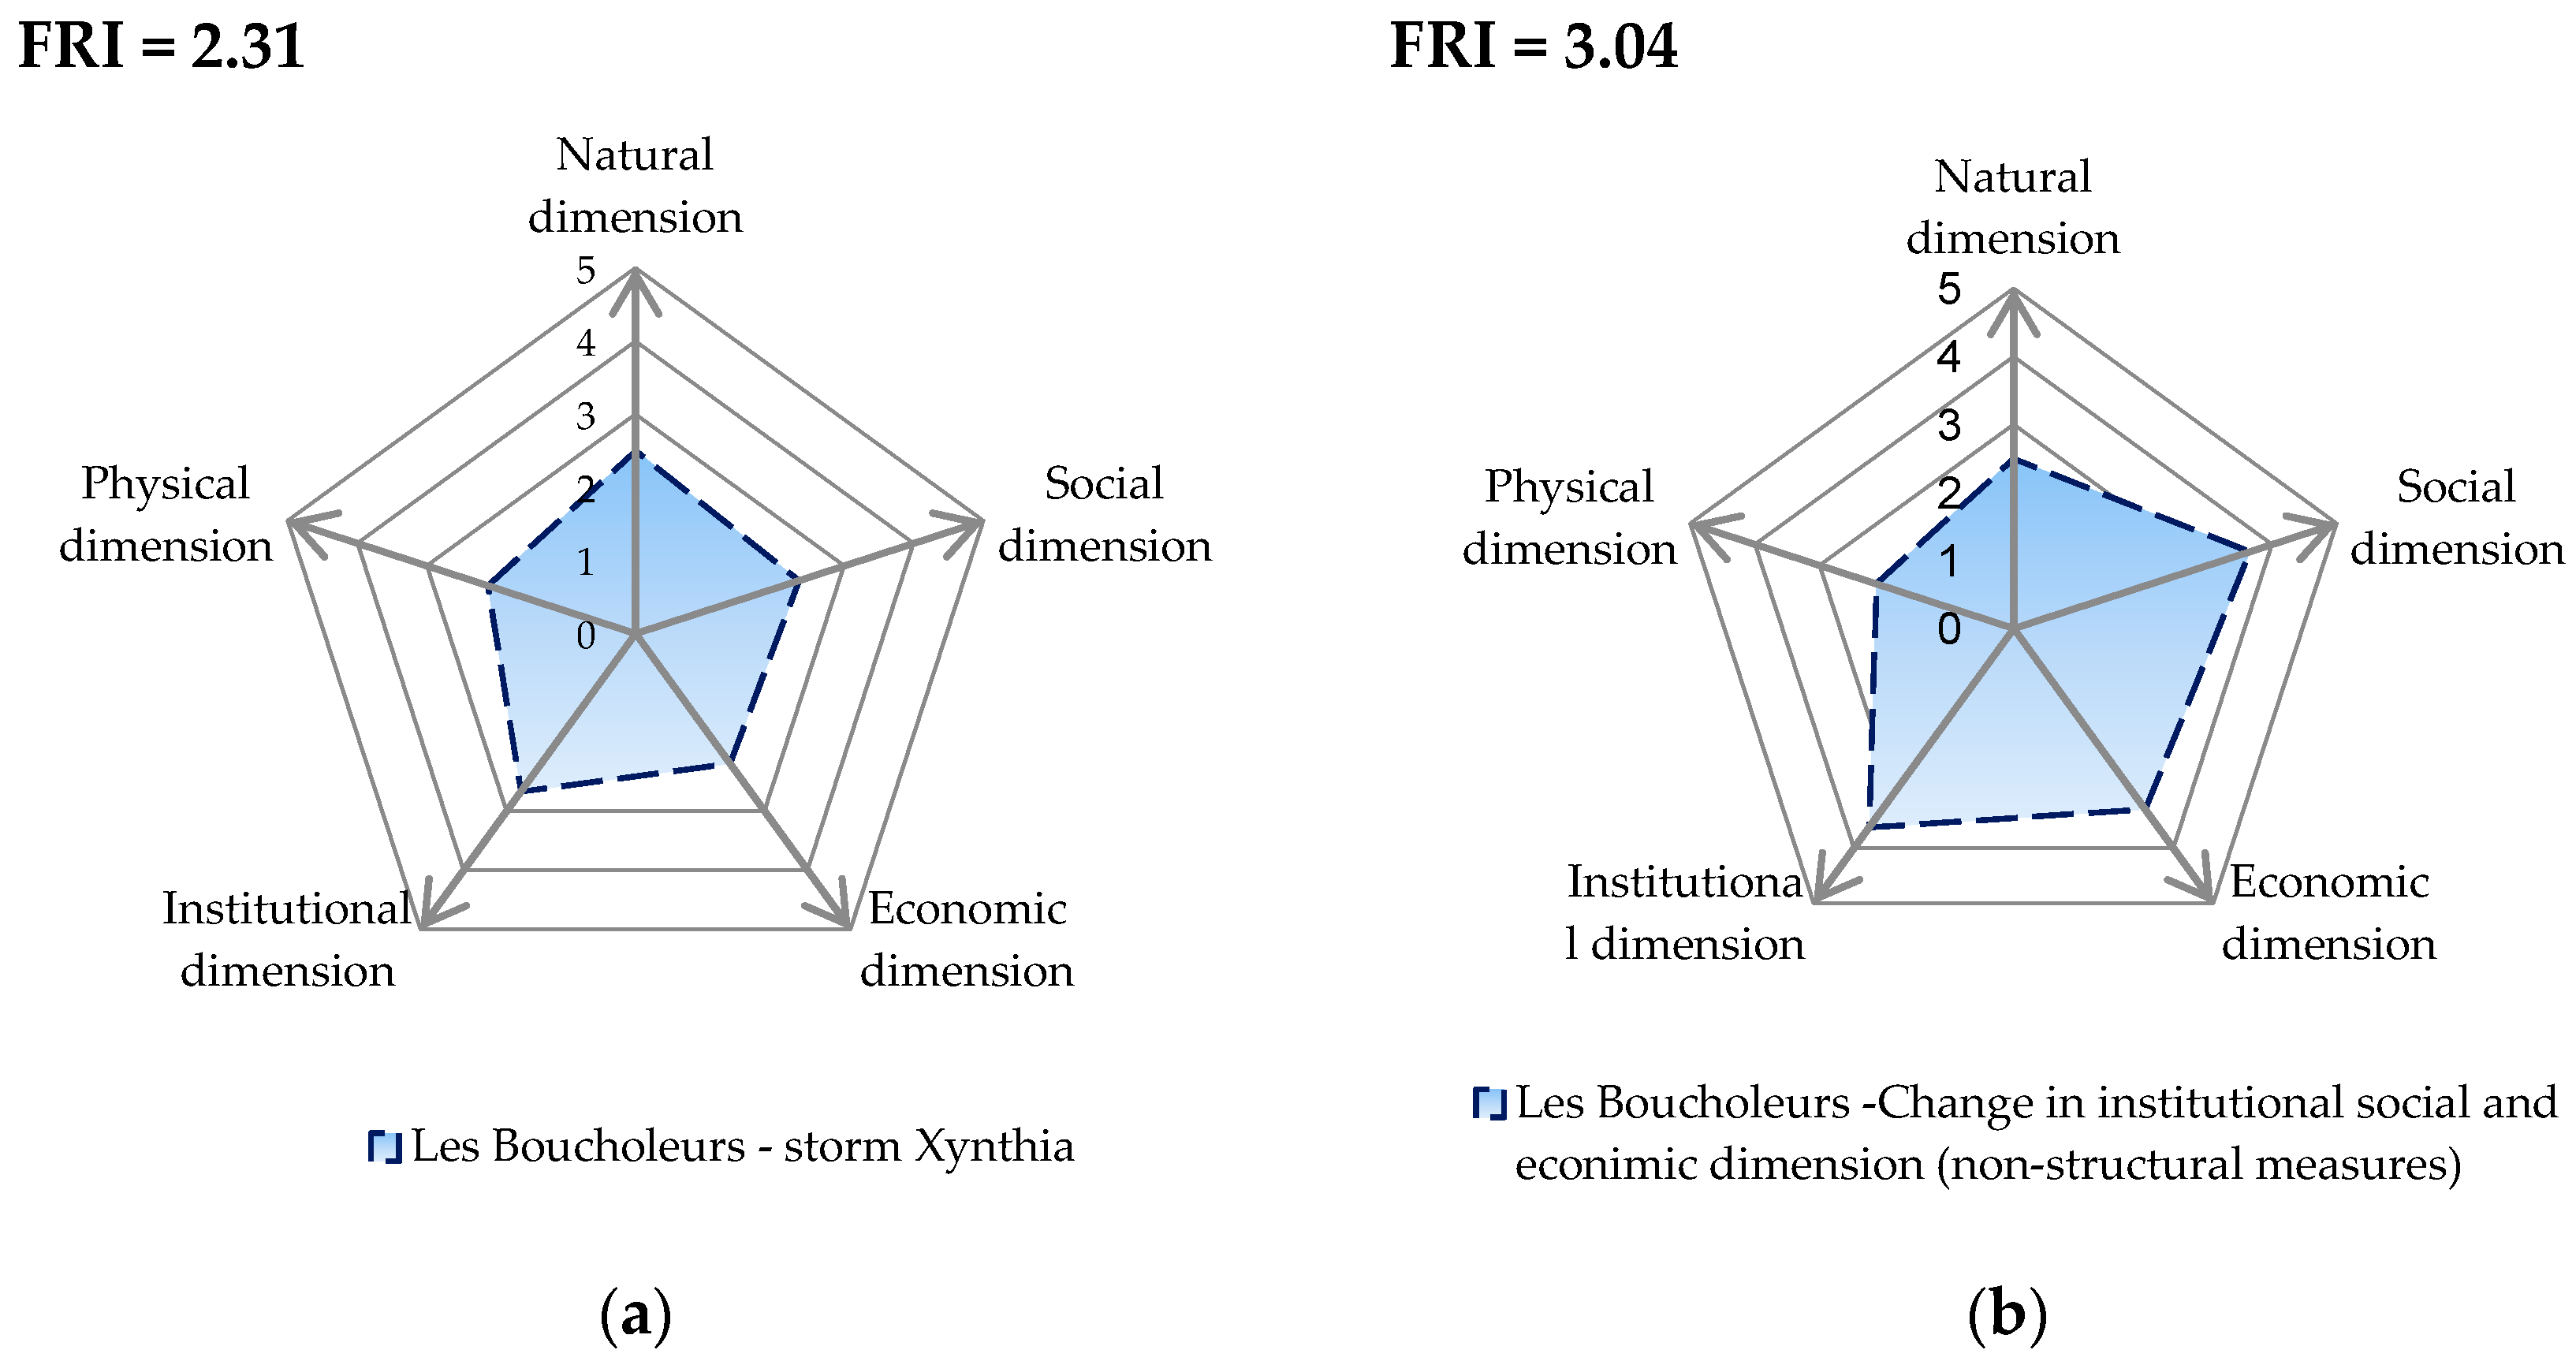
- Assess the resilience of their city to floods by calculating the Flood Resilience Index (FRI) and identifying dimensions and specific fields where the coastal region is particularly vulnerable (see Section 2.2).
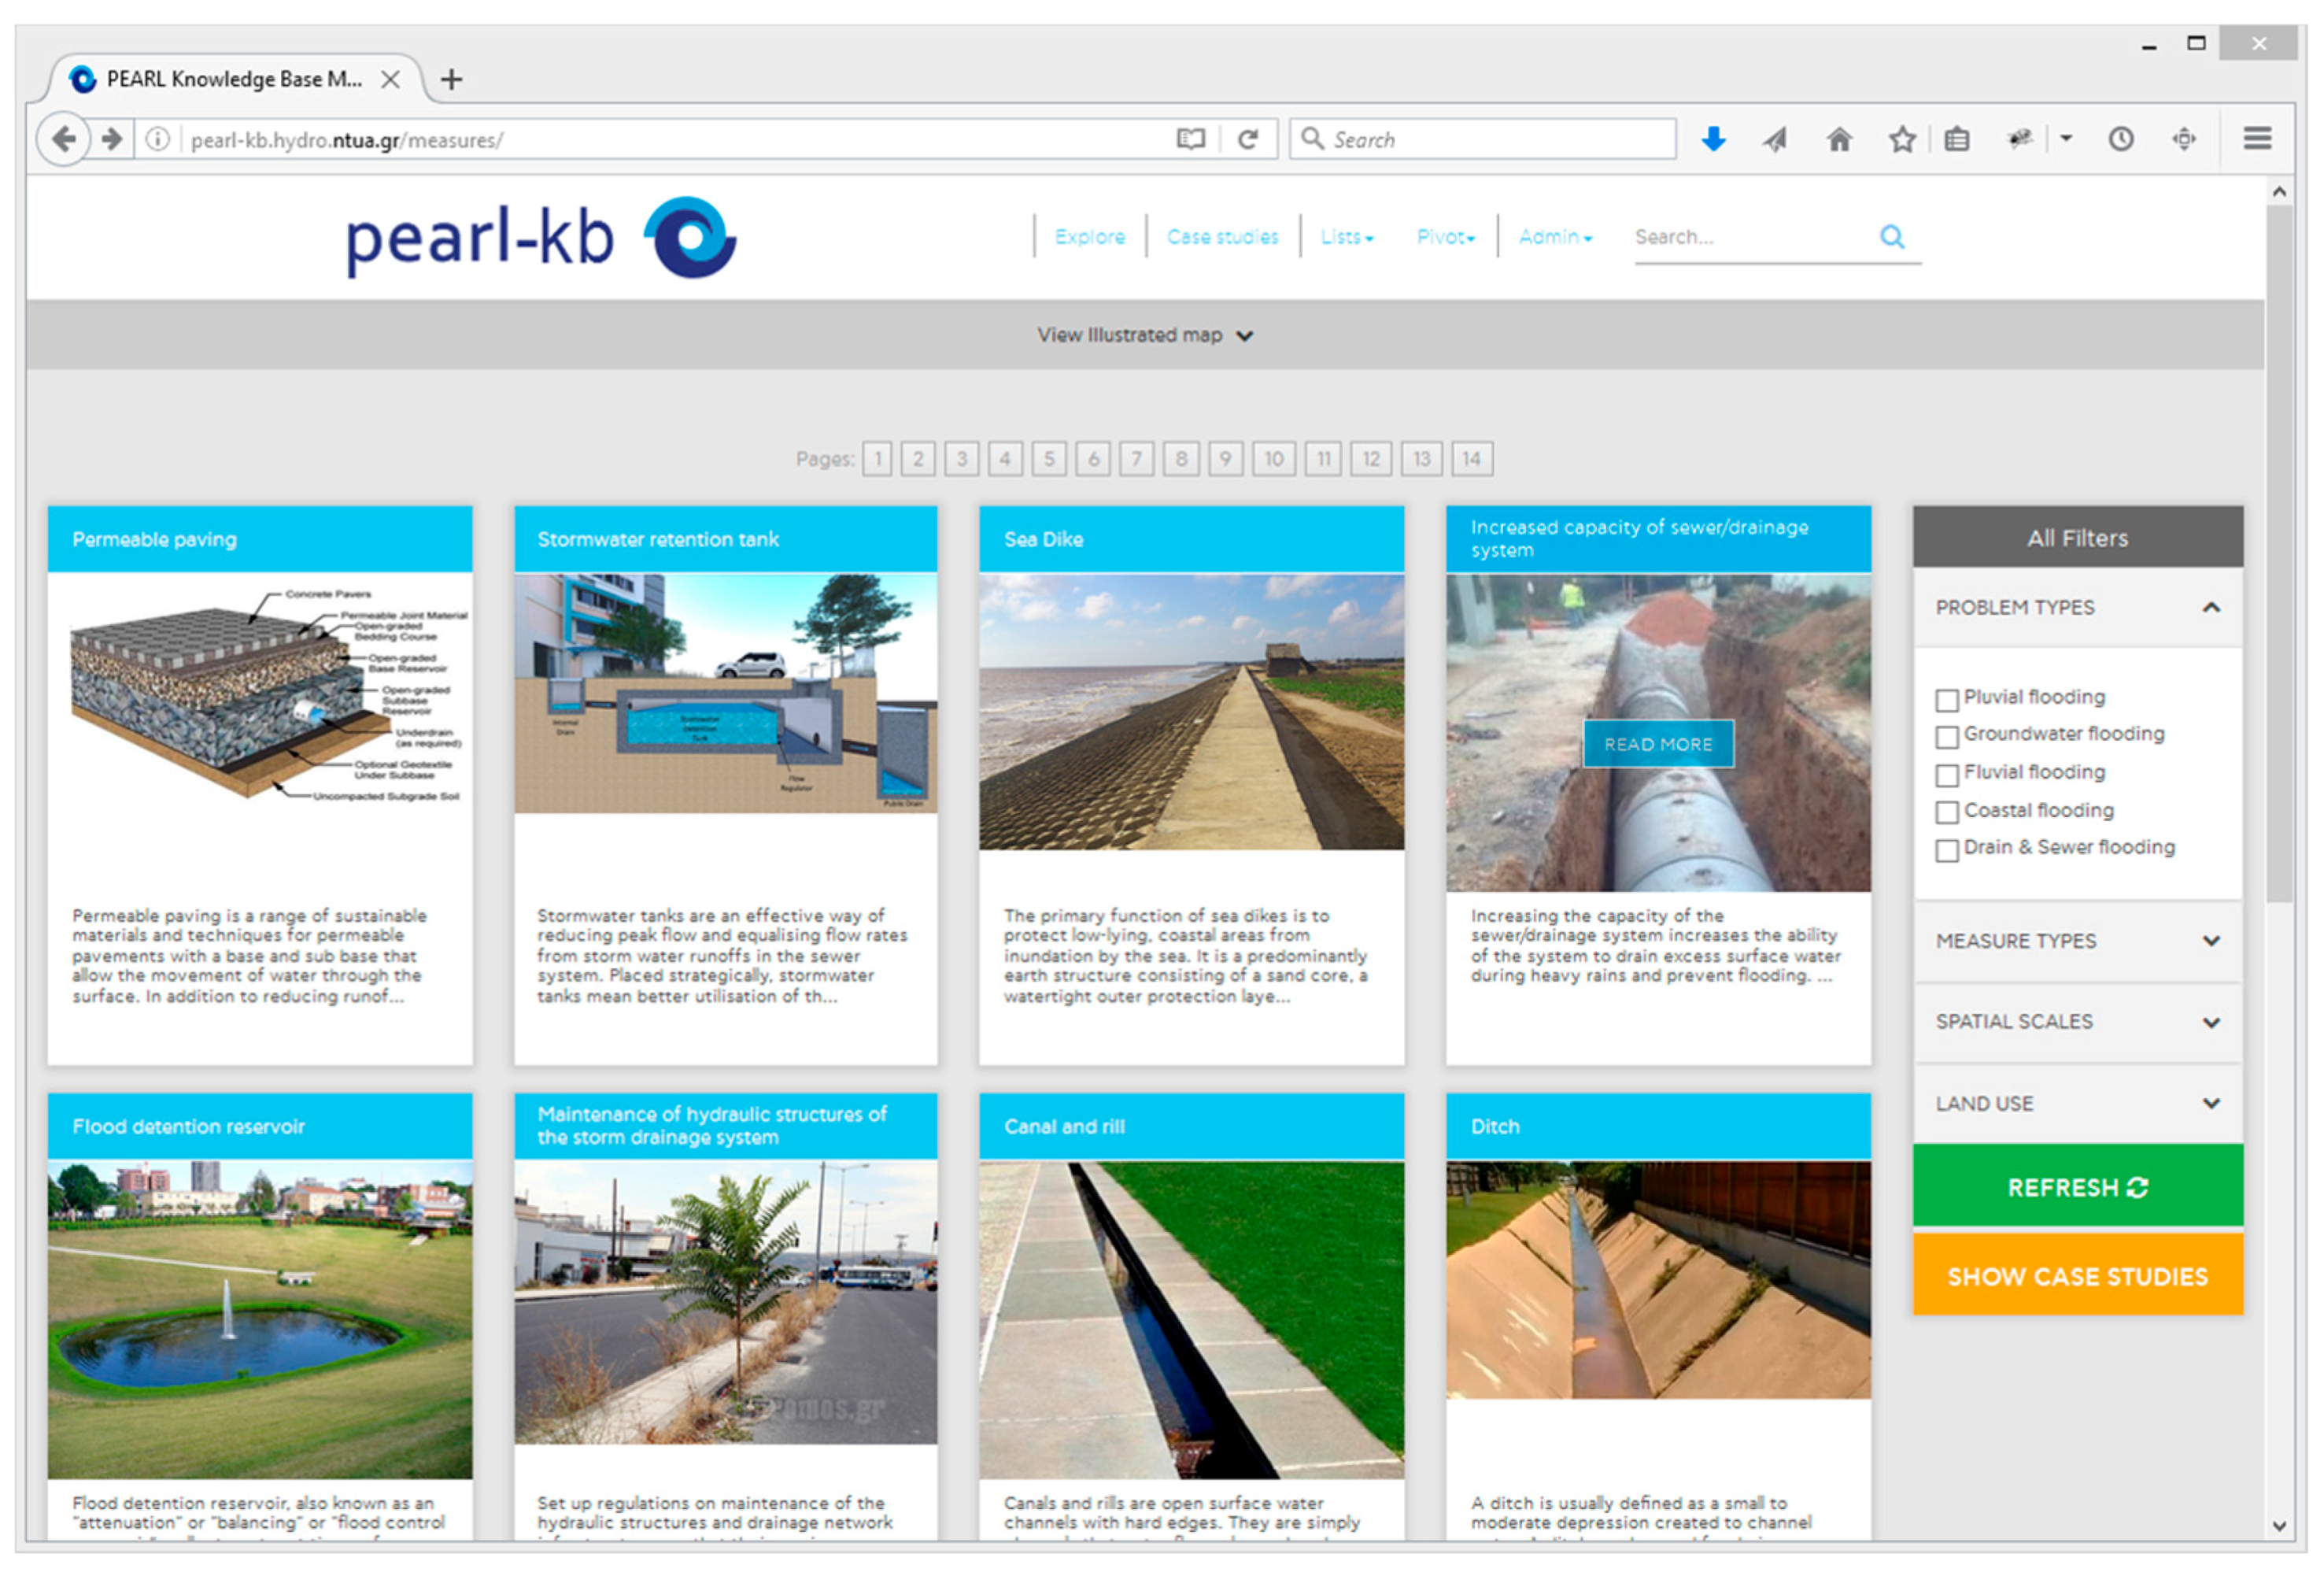
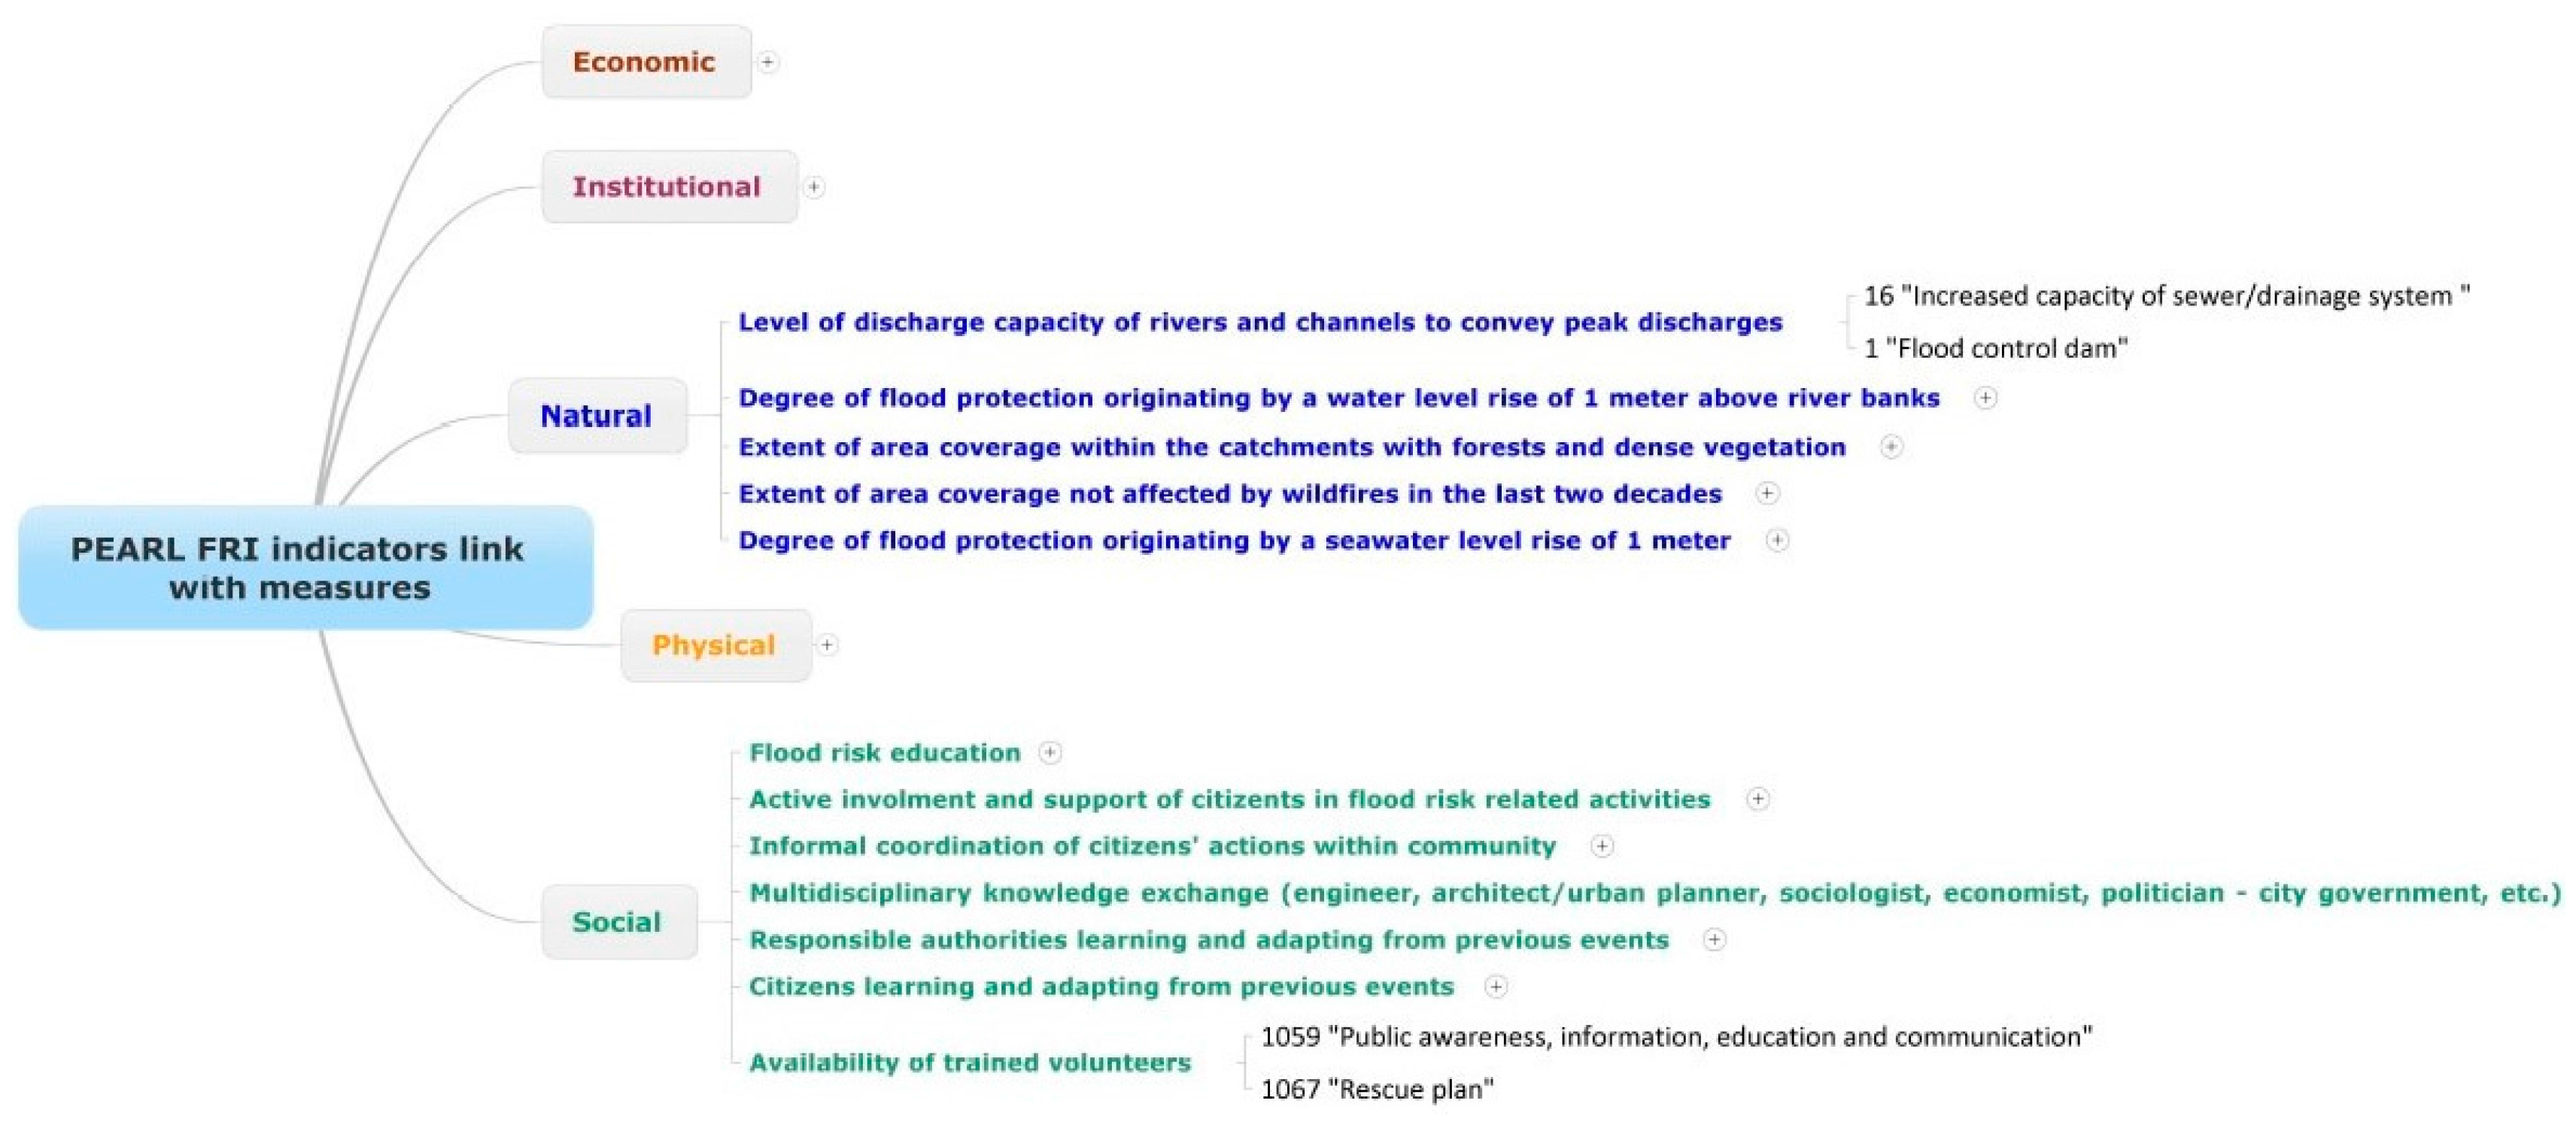
- Once the main vulnerabilities have been recognized, the user may proceed in identifying measures and strategies which may help improving the city’s resilience. The PEARL KB supports this transition by linking all indicators comprising the FRI with relevant measures and thus the user is able to navigate from the FRI page directly to the specific measures (see Section 2.2.2).
- Known case studies of the selected resilience measures can be explored next. The user can spot them on a map and review detailed information related to the case study, such as its description, implementation costs, lessons learned, etc.
- Finally, publications and other sources that document the resilience measures of choice or their applications in various coastal regions can be retrieved for further research.
2.1.3. Repository of Measures and Resilience Strategies and Their Applications
- The CORFU Project—Collaborative Research on Flood Resilience in Urban Areas (available online: http://www.corfu7.eu/) [7];
- The Climate app: A tool for urban climate solutions (available online: http://www.climateapp.org/) [11];
- The European Natural Water Retention Measures Platform (available online: http://recette.nwrm.eu/) [9];
- The Urban Green Blue Grids for sustainable and resilient cities (available online: http://www.urbangreenbluegrids.com/design-tool/) [12];
- The SUStainable DRAINage systems (Susdrain) website (available online: http://www.susdrain.org/) [14];
- The PREPARED Enabling Change Project (available online: http://prepared-fp7.eu/) [10]; and
- The Temporary and Demountable Flood Protection Guide “Delivering Benefits through Evidence” developed from the Environment Agency (available online: https://www.gov.uk/government/uploads/system/uploads/attachment_data/file/290837/scho0711buak-e-e.pdf) [15].
2.2. Integrating the Knowledge Base with the Flood Resiliece and Vulnerability Frameworks
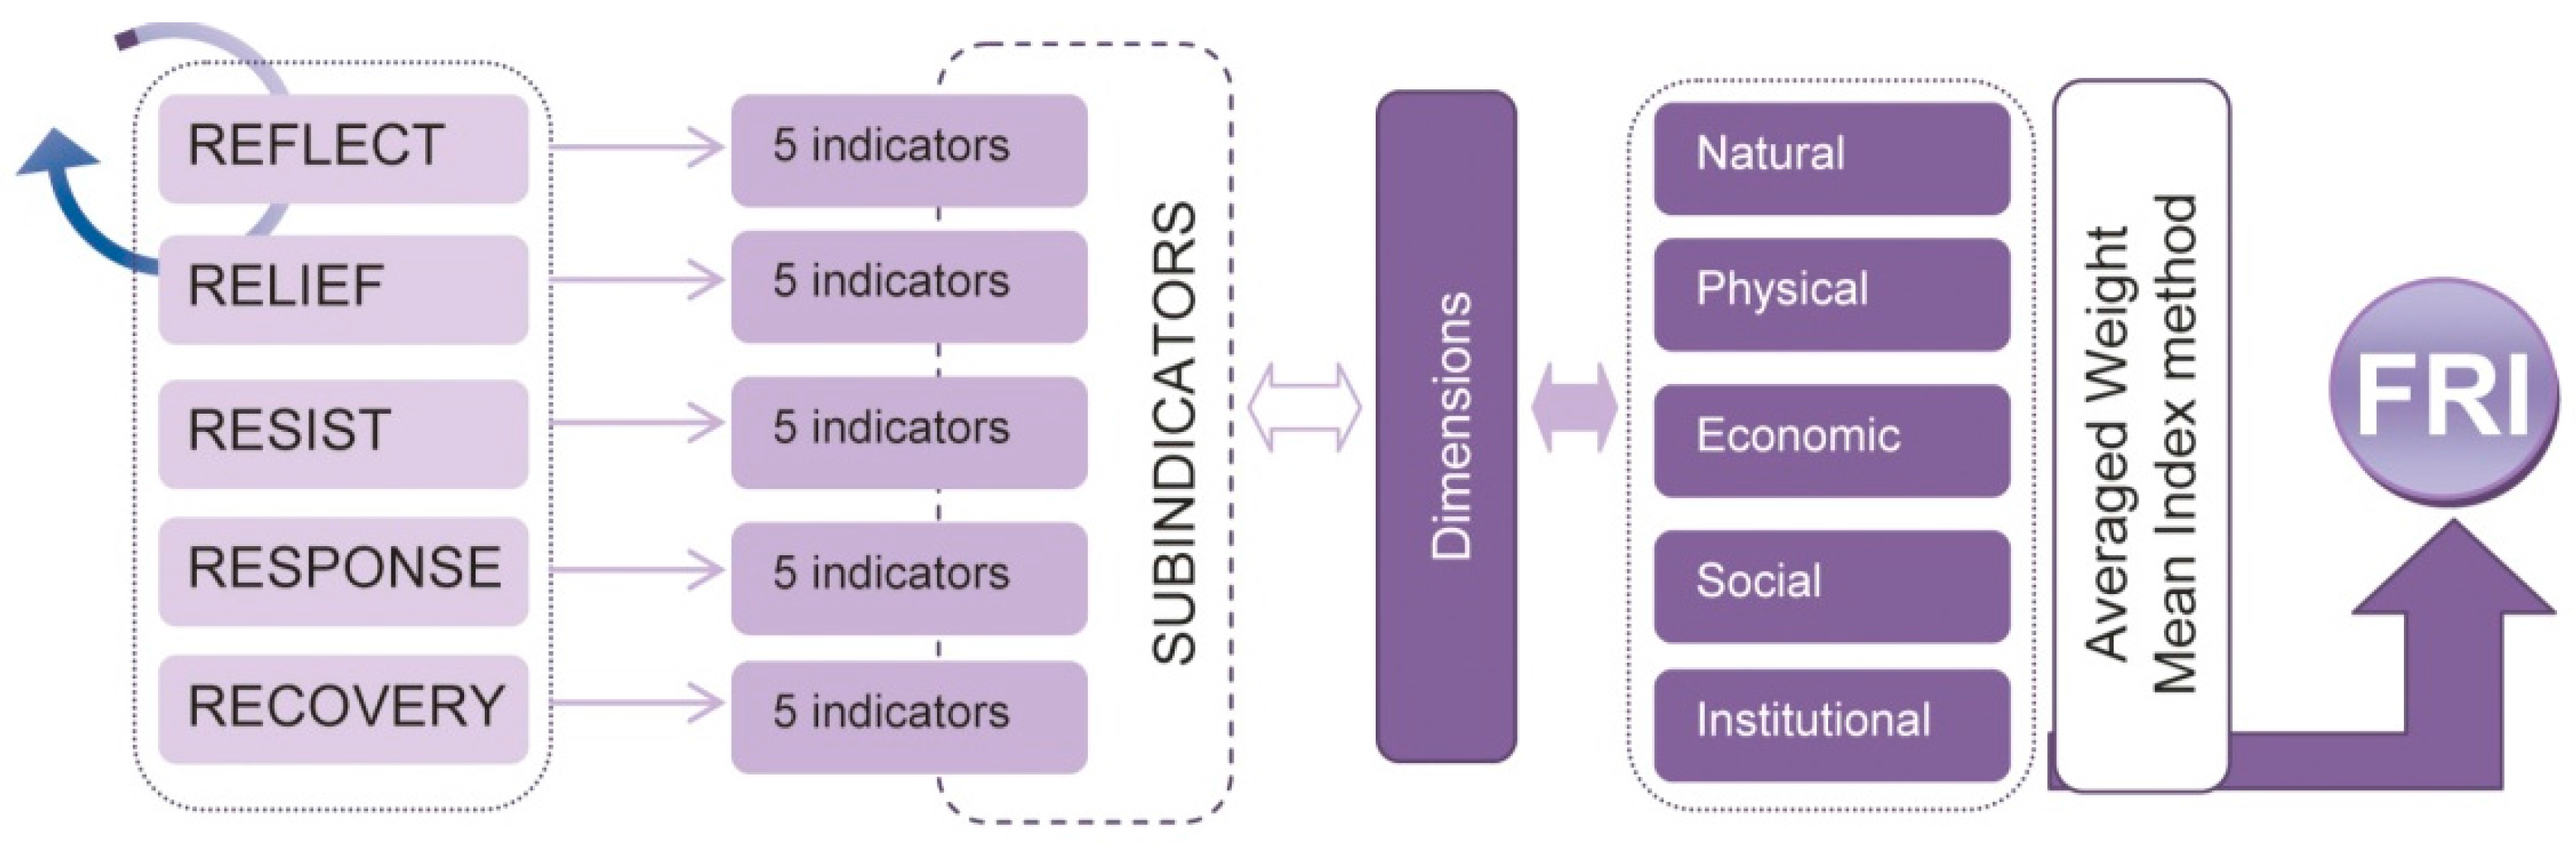
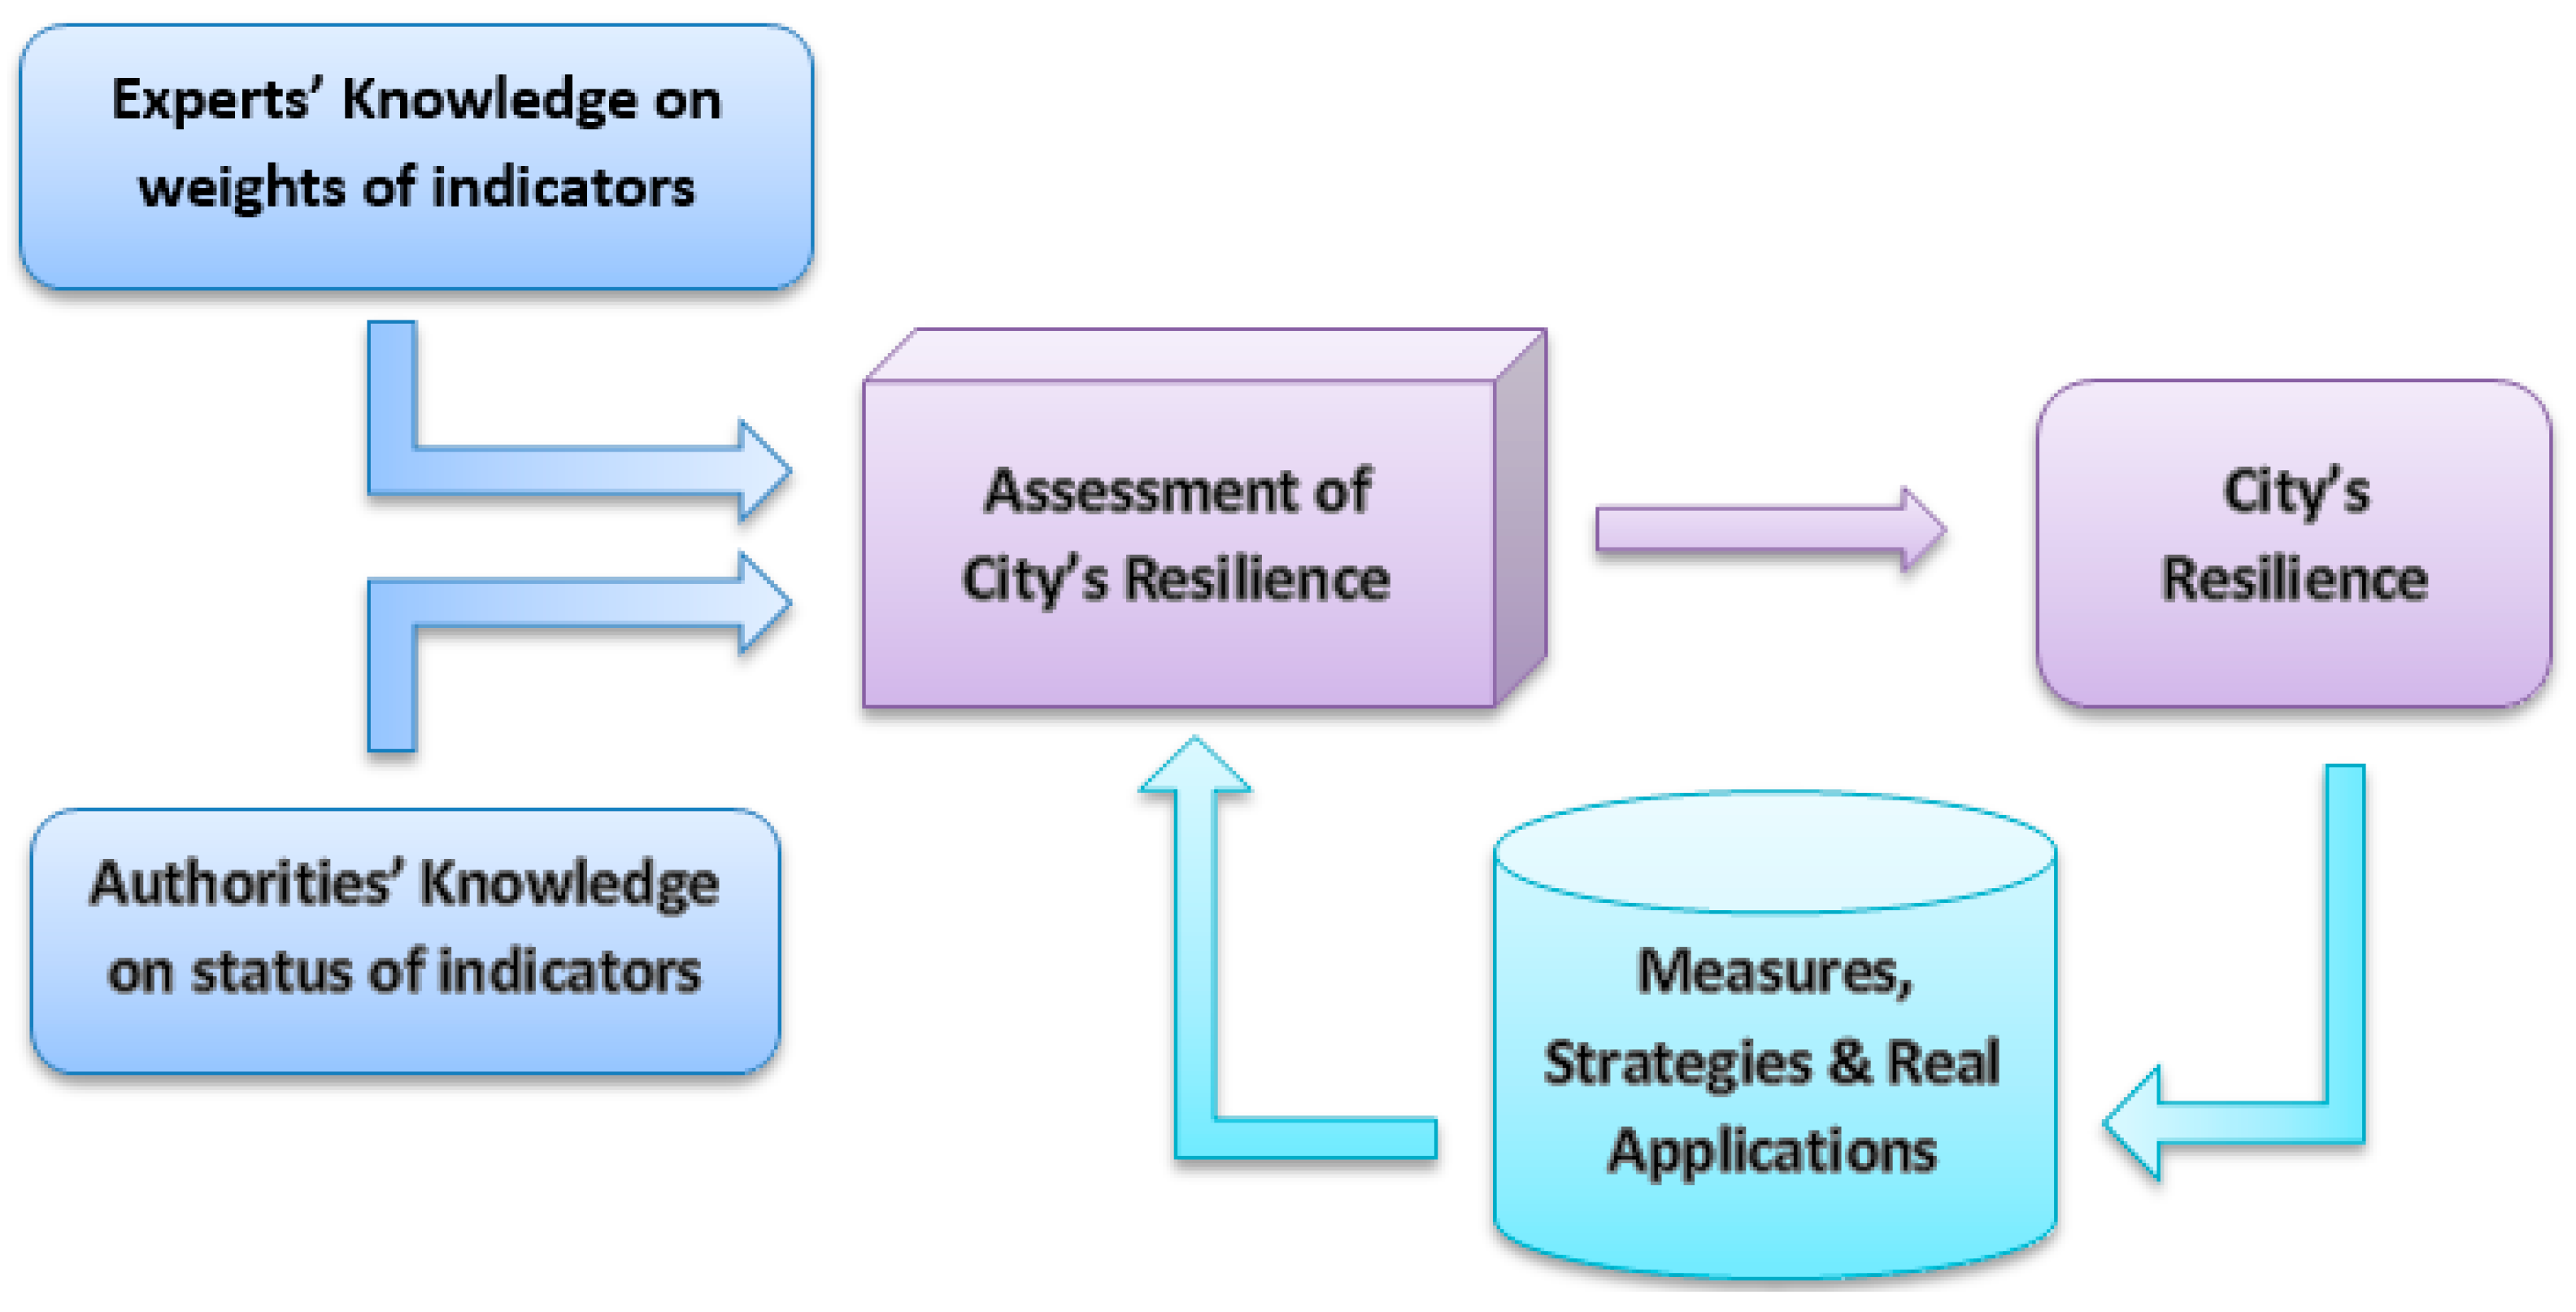
2.2.1. Flood Resilience Index Framework
2.2.2. Modifying Flood Resilience Index Framework and Linking Indicators with Measures
2.2.3. Developing an Online Tool for Assessing Cities’ Resilience
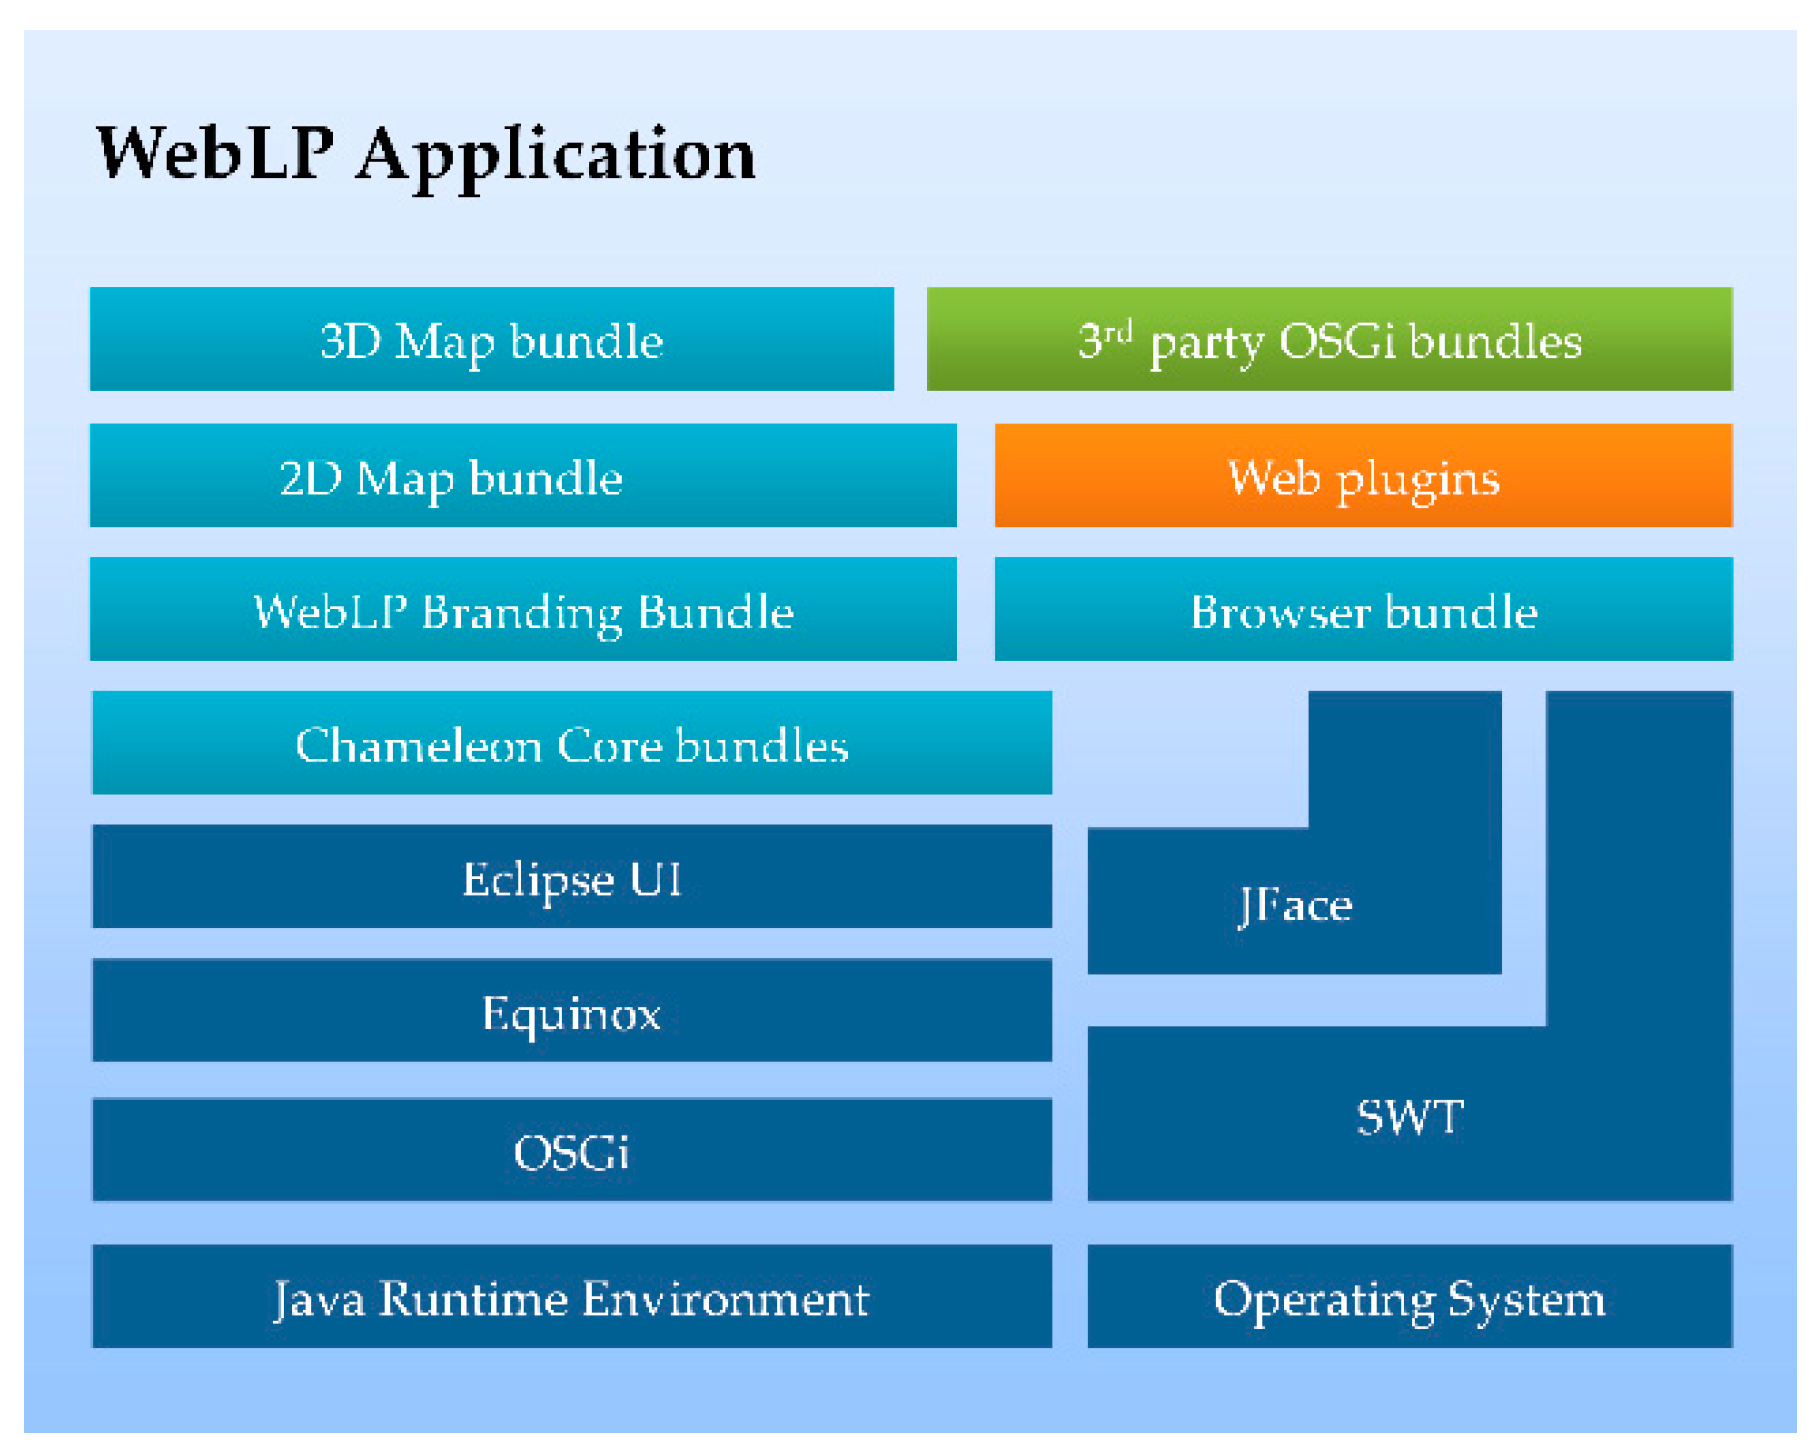
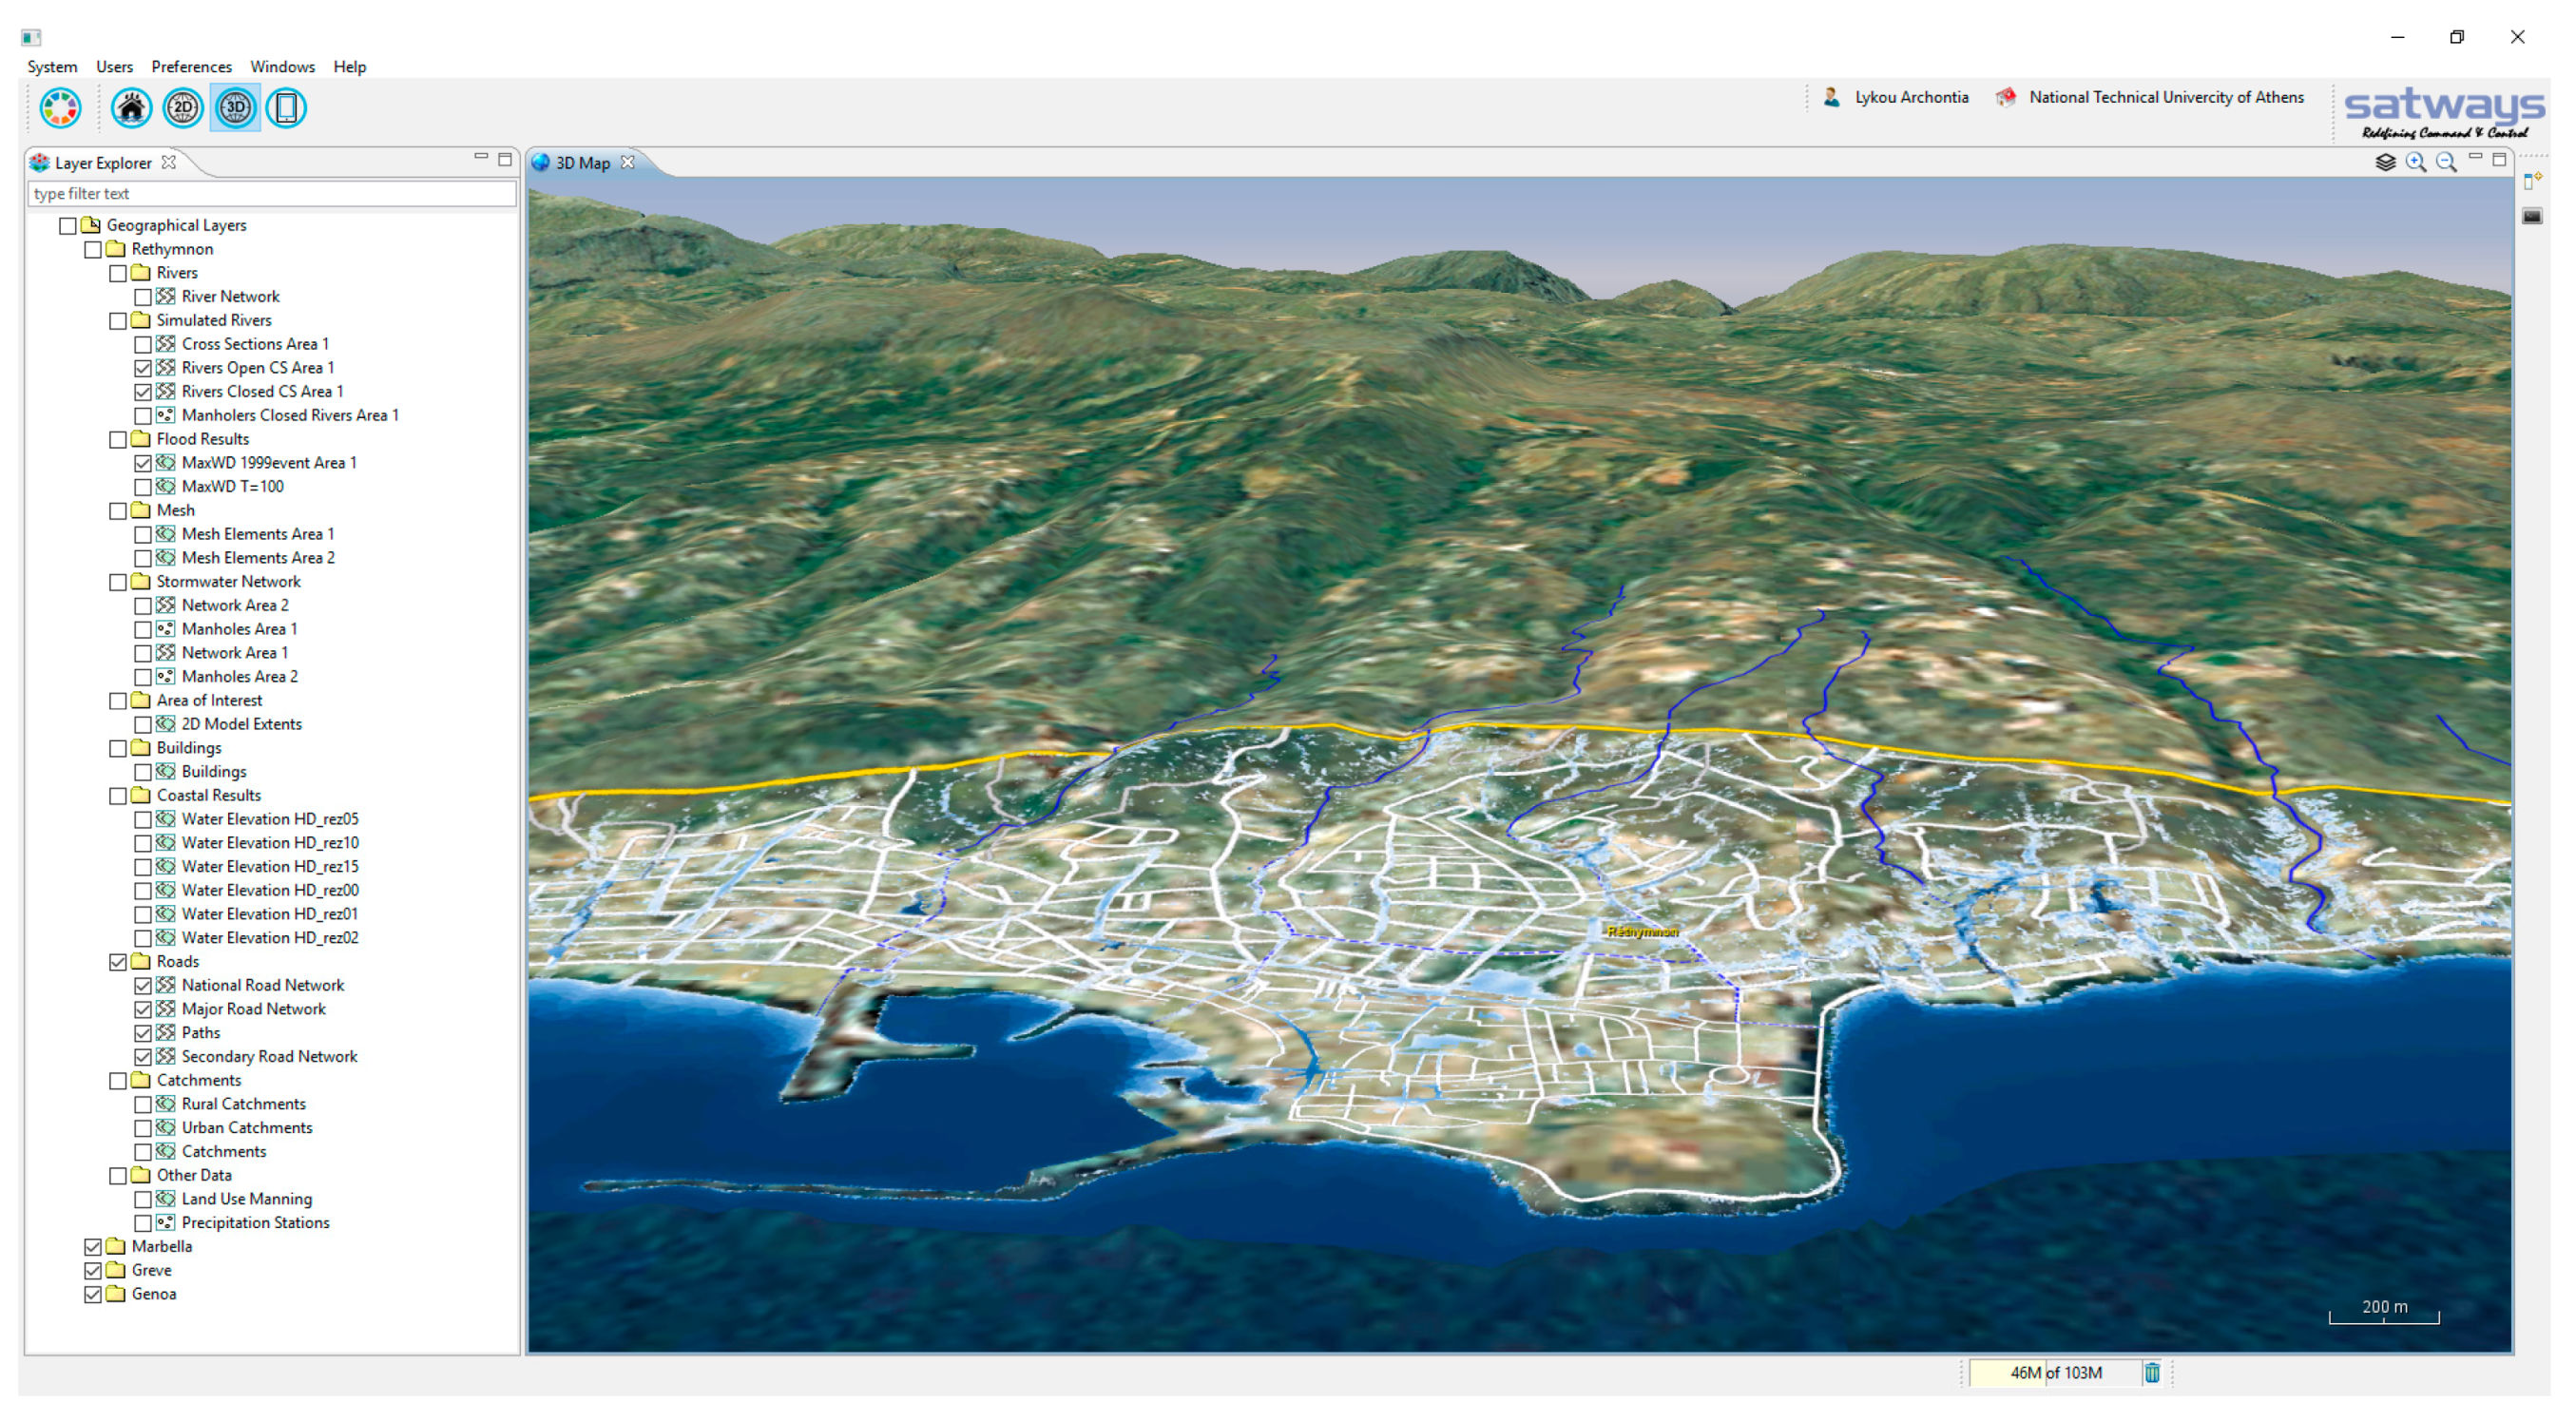
2.3. Integrating the Knowledge Base with a Learning and Planning Platform
- A stakeholder profile, with which stakeholders interact with the platform in real time (prior and during the workshops), make decisions (from a wide, pre-computed set of options) and investigate/visualize their impacts under different scenarios for their own case.
- An expert profile, with which expert facilitators (or stakeholder consultants) use the full functionality of the platform to setup and evaluate new scenarios using models, algorithms and datasets that are accessible through the platform.
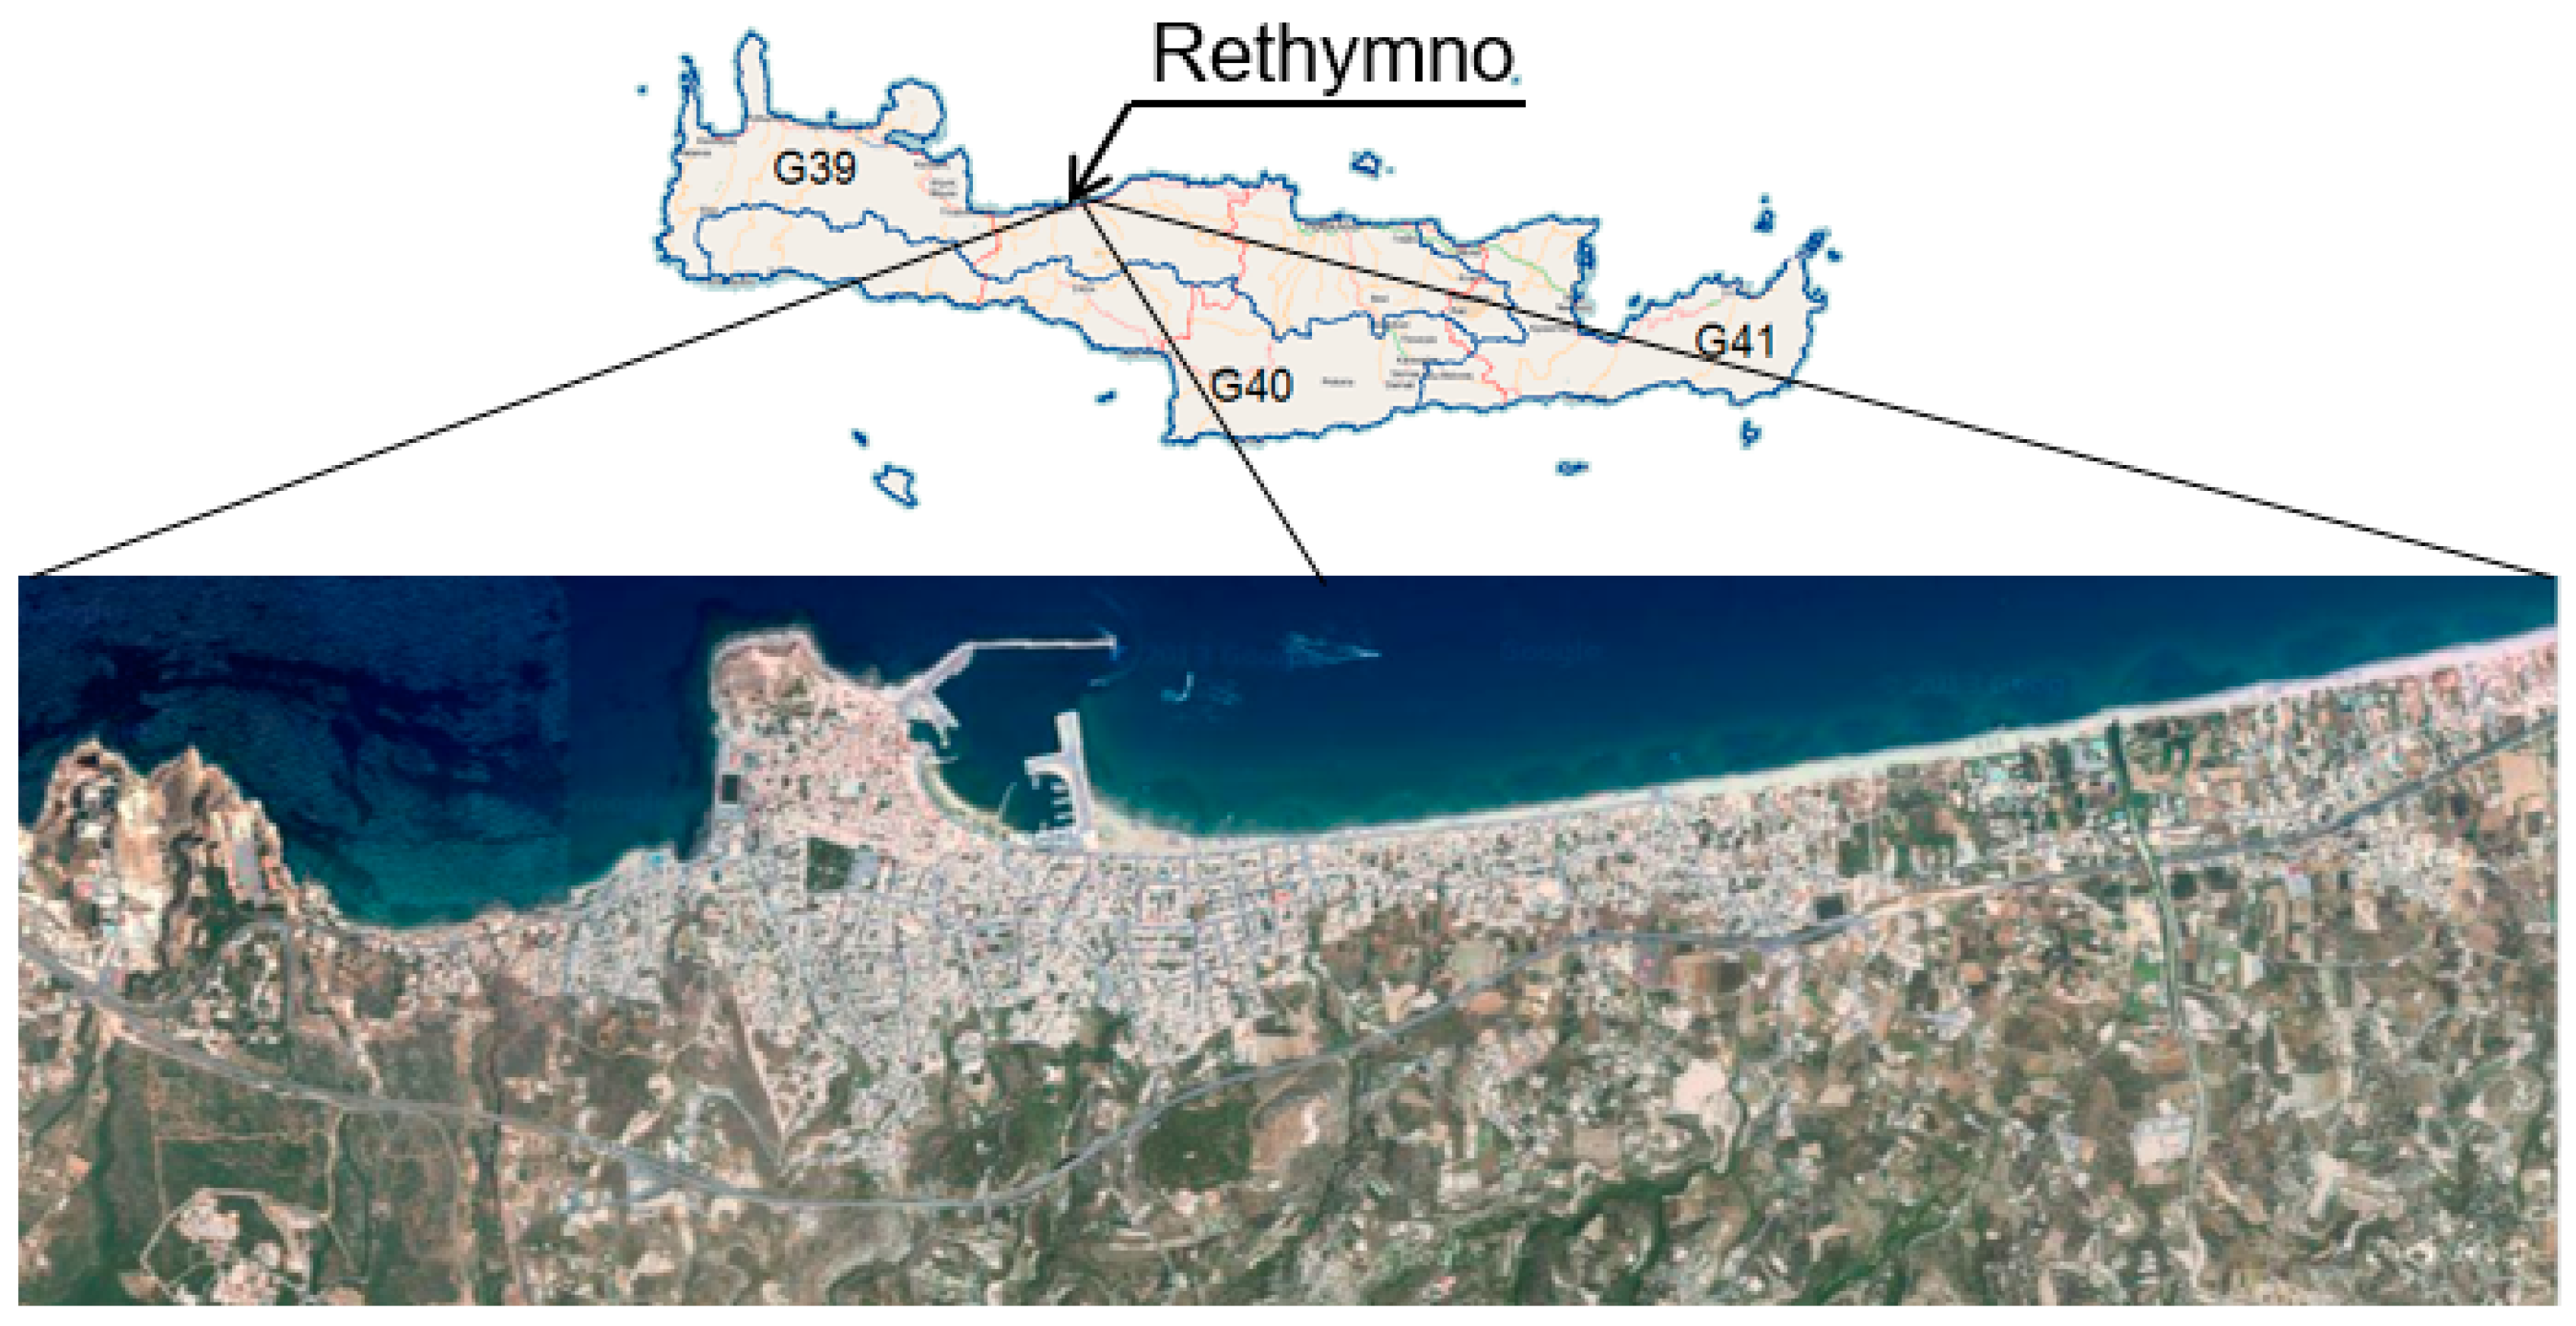
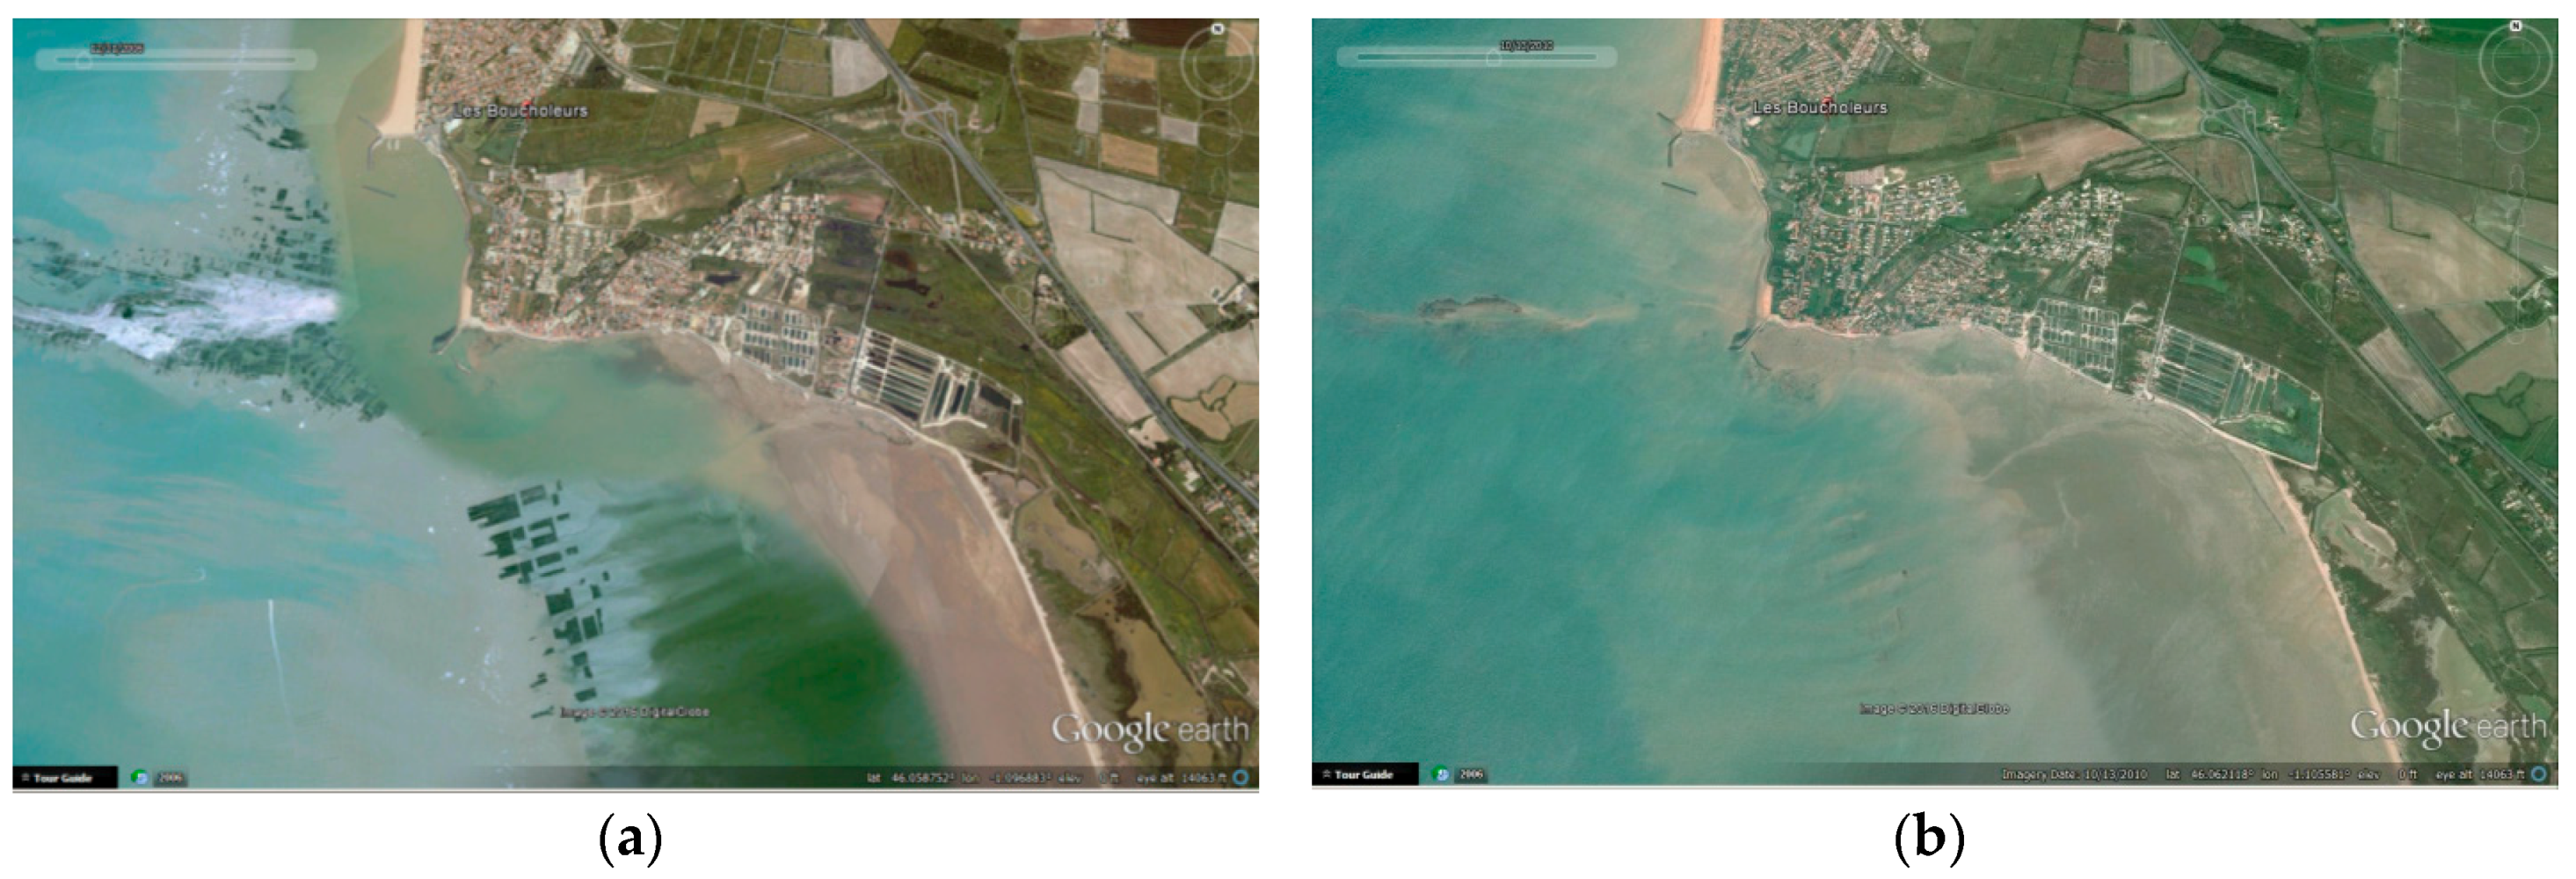
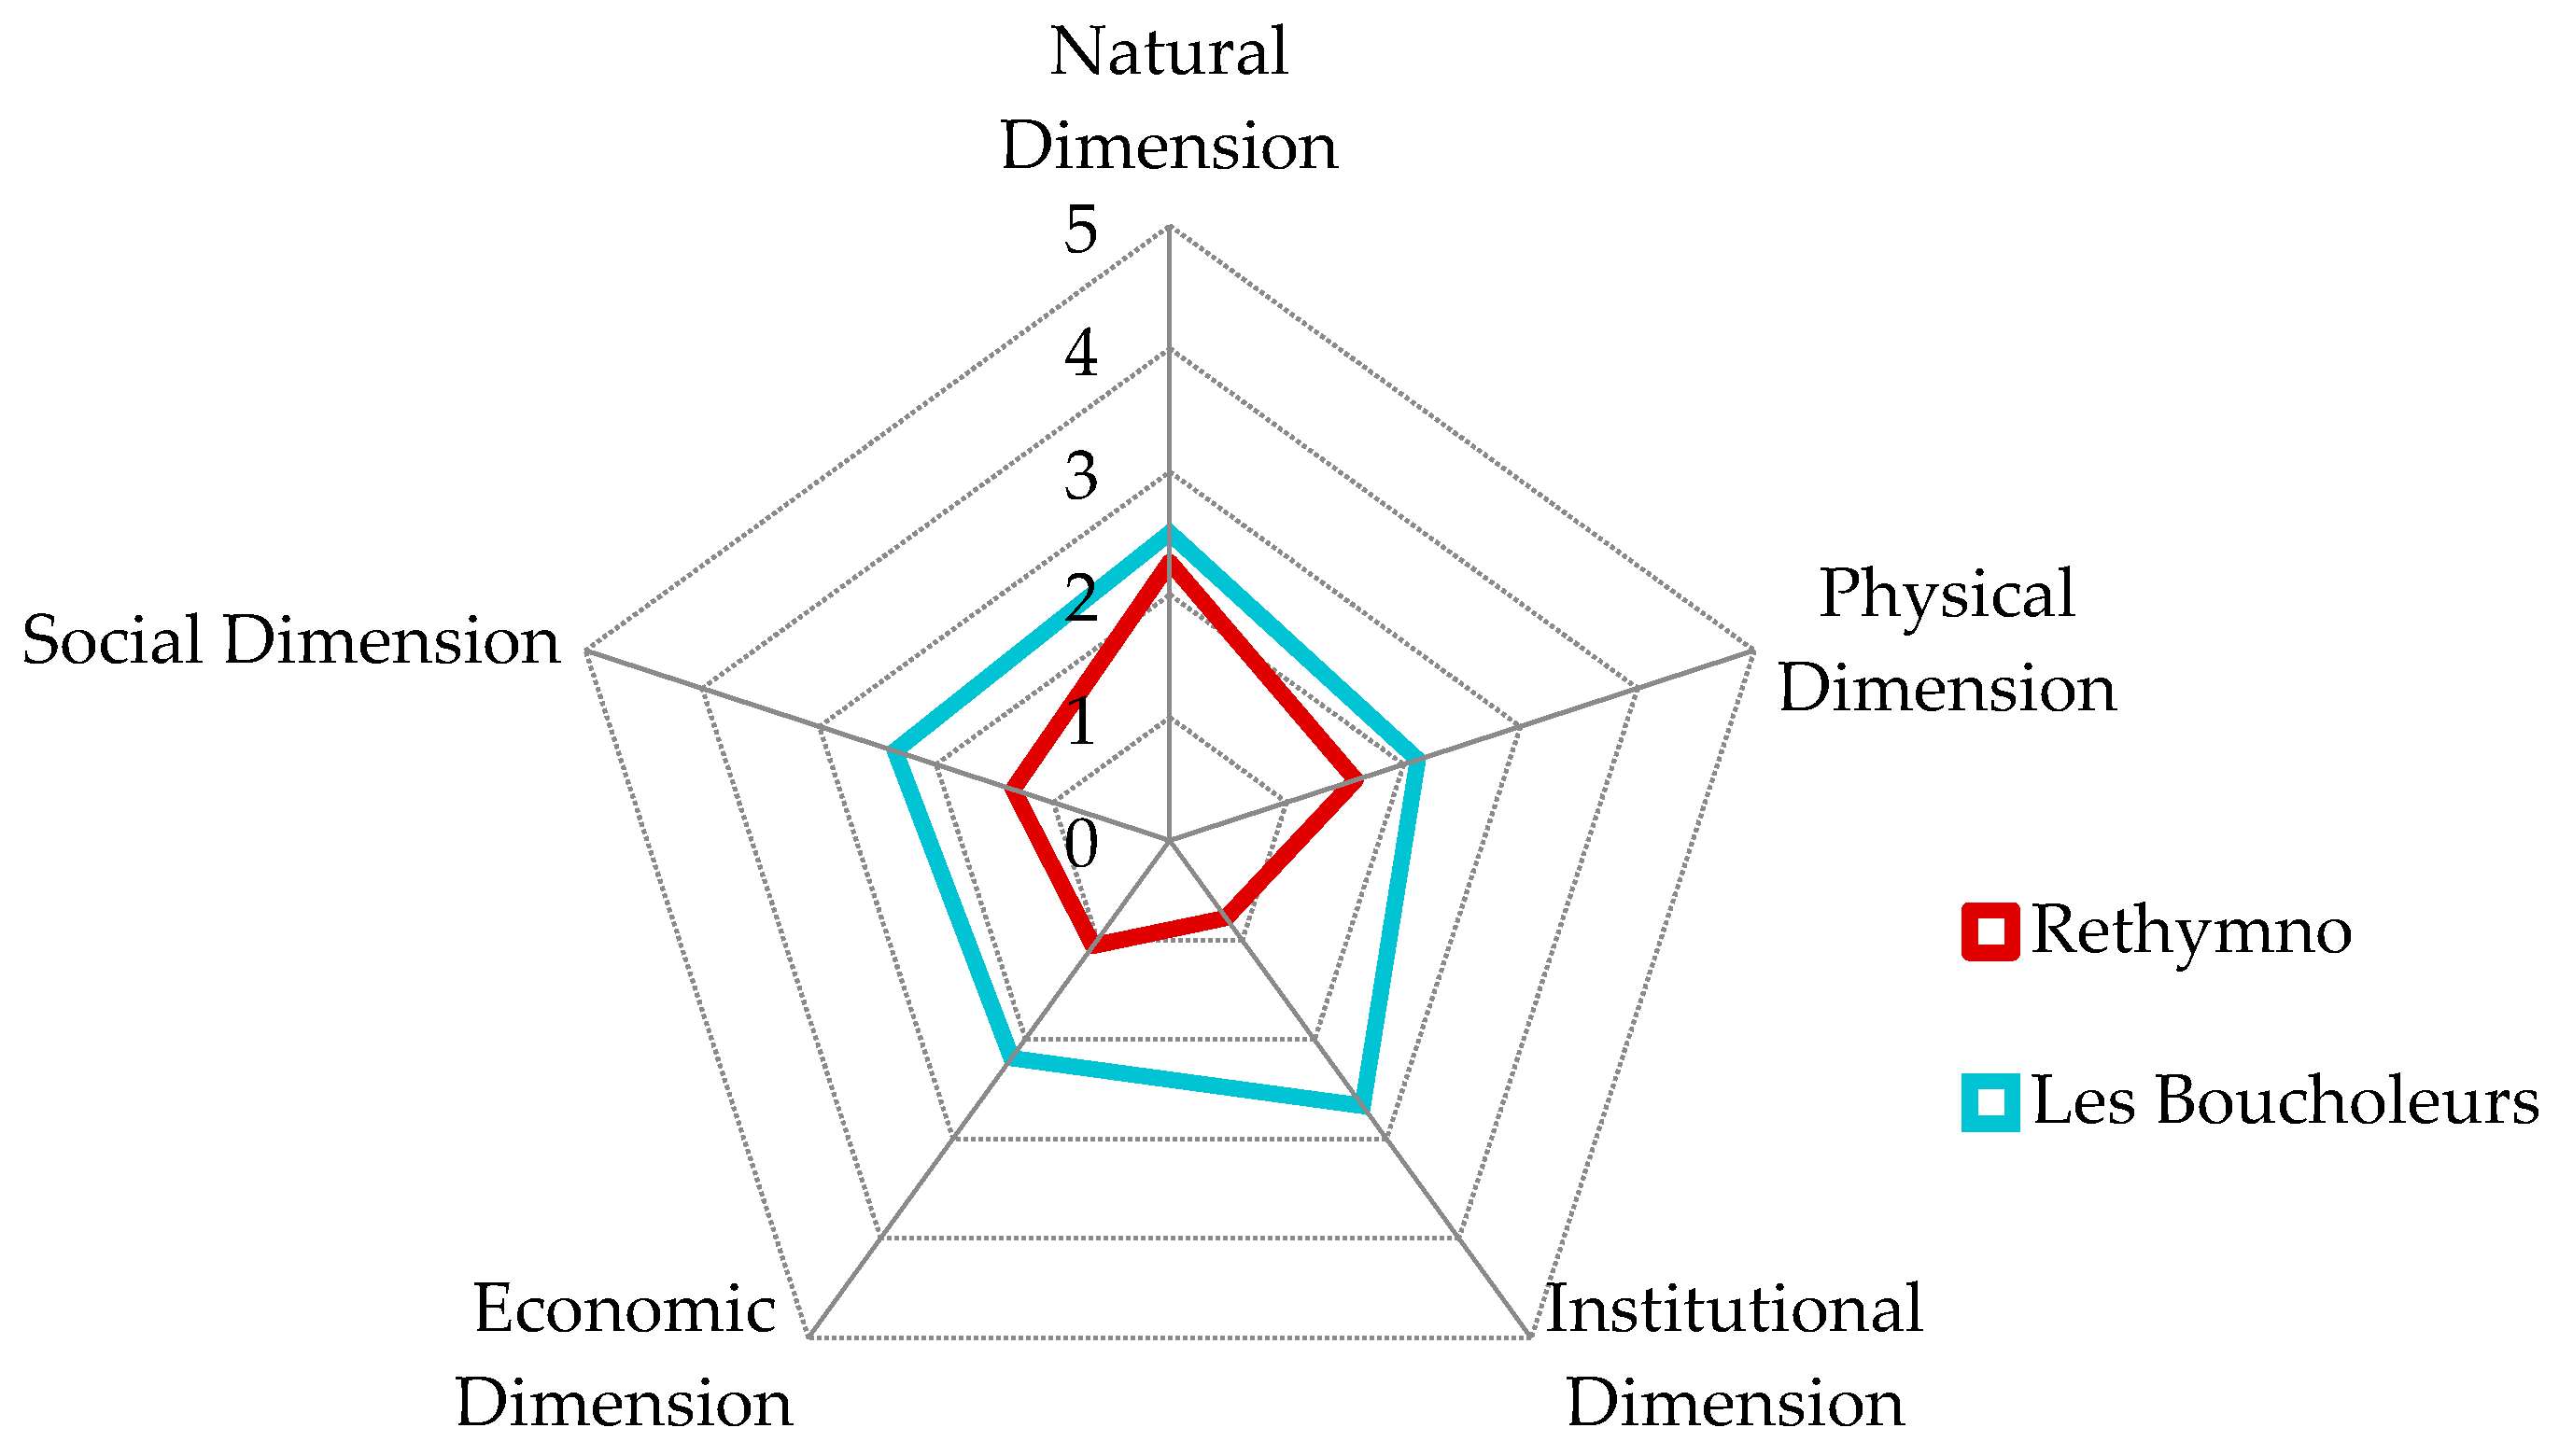
2.4. Testing the Methodological Framework in Two Case Studies
3. Results and Discussion
4. Conclusions
Acknowledgments
Author Contributions
Conflicts of Interest
Abbreviations
| BRGM | Bureau de Recherches Géologiques et Minières |
| EWS | Early Warning System |
| FOSS | Free and Open Source Software |
| FP7 | 7th Framework Programme |
| FRI | Flood Resilience Index |
| GIS | Geographic Information System |
| HTTP | HyperText Transfer Protocol |
| IPCC | Intergovernmental Panel on Climate Change |
| KB | Knowledge Base |
| KBE | Knowledge Base Engine |
| LAA | Learning and Action Alliance |
| NGF | General Levelling in France |
| NGOs | Non-Governmental Organisations |
| NTUA | National Technical University of Athens |
| NWRM | Natural Water Retention Measures |
| ORDB | Object Relational Database |
| ORM | Object-Relational Mapper |
| OSGi | Open Services Gateway Initiative |
| PEARL | Preparing for Extreme And Rare events in coastal regions |
| WebLP | Web Learning and Planning |
Appendix A
- The natural dimension indicates inherent risk and resilience characteristics of the city. This includes topography, natural environment degradation, hydro-meteorological context and disasters.
- The social dimension considers human resource issues, and includes population, health, education, knowledge and awareness, social capital, conflict, crime and related issues.
- The economic dimension deals with the livelihoods and related activities and management of financial resources. Includes issues related to income, employment, expenditures, assets, access to financial services, household assets, savings, insurance, etc.
- The institutional dimension concerns itself with organizational issues and looks at stakeholders. It includes internal and external institutions, institutional collaborations, coordination and cohesion.
- The physical dimension gives an idea of the risk and resilience arising from construction, infrastructure and built environment. It also includes transportation systems, land use, early warning systems and evacuation plans for disaster situations.
Appendix B

| Dimension | Indicator |
|---|---|
| ECONOMIC | Availability and accessibility of financial resources |
| ECONOMIC | Availability of financial resources for protection of transportation network |
| ECONOMIC | Assessment of financial resources management and allocation in relation to past flood events |
| ECONOMIC | Availability of financial resources enabling the development and implementation of evacuation plans before human loss |
| ECONOMIC | Availability of financial resources supporting rescue services |
| ECONOMIC | Availability of resources assisting in quicker and more efficient drainage of flooded areas |
| ECONOMIC | Availability of resources for solid waste removal and management |
| ECONOMIC | Availability of insurance & financial services |
| ECONOMIC | Deduction of taxes of people in flooded areas |
| ECONOMIC | Legal building reconstruction/renovation for flood risk mitigation/adaptation purposes |
| INSTITUTIONAL | Embodying flood risk in urban planning |
| INSTITUTIONAL | Embodying climate change predictions in spatial urban planning |
| INSTITUTIONAL | Land use control |
| INSTITUTIONAL | Preservation of wetlands and green spaces |
| INSTITUTIONAL | Availability of flood vulnerability maps |
| INSTITUTIONAL | Development and availability of regulations and specifications depending zones of flood risk |
| INSTITUTIONAL | Availability of crisis management plan with maps |
| INSTITUTIONAL | Availability of plans for management of existing road network and protection from flood risk |
| INSTITUTIONAL | Availability of evacuation plans with maps |
| INSTITUTIONAL | Development and design of evacuation procedures based on flood risk simulations and assessment of results |
| INSTITUTIONAL | Conduction of evacuation training |
| INSTITUTIONAL | Availability and implementation of regulations enhancing adaptation/mitigation |
| INSTITUTIONAL | Establishment of Stakeholders Committee on flood risk |
| INSTITUTIONAL | Embodying flood risk in Building code |
| INSTITUTIONAL | Level of implementation of Building Code |
| INSTITUTIONAL | Possibility and capability of modifying Building Code on reconstruction procedures |
| INSTITUTIONAL | Level of implementation of Flood Directive in Local level |
| INSTITUTIONAL | Availability of regulations defining reconstruction/renovation procedures after flood events |
| INSTITUTIONAL | Expected efficiency of the reconstruction works |
| NATURAL | Level of discharge capacity of rivers and channels to convey peak discharges |
| NATURAL | Level of area coverage unaffected by flood in case of 1 m river level rise above banks |
| NATURAL | Level of area coverage with forests and dense vegetation |
| NATURAL | Level of area coverage unaffected from wildfires the last 2 decades |
| NATURAL | Level of area coverage unaffected by flood in case of 1 m sea level rise |
| PHYSICAL | Use of real-time monitoring system for hydraulic structures and urban drainage system |
| PHYSICAL | Use of real-time monitoring system in the river network |
| PHYSICAL | Use of an Early Warning System (EWS) |
| PHYSICAL | Support of announcements (e.g., via email, SMS) to target groups by the EWS |
| PHYSICAL | Level of accessibility of roads which are important for solid waste management and transportation network |
| PHYSICAL | Availability and level of accessibility of emergency road network |
| PHYSICAL | Availability and level of accessibility of emergency shelters |
| PHYSICAL | Infiltration capacity of paved areas to reduce runoff |
| PHYSICAL | Sufficient storage capacity of the urban drainage system to accept flood water |
| PHYSICAL | Level of floodwater retention and detention |
| PHYSICAL | Availability of flood-proofing constructions of strategic infrastructures |
| PHYSICAL | Level of protection of crisis management center and rescue services |
| PHYSICAL | Availability of hydraulic structures within urban system capable to reduce peak discharges |
| PHYSICAL | Availability of hydraulic structures for river watershed management capable to reduce peak discharges |
| PHYSICAL | Availability of emergency evacuation routes |
| PHYSICAL | Availability and level of spatial coverage of emergency communication systems |
| PHYSICAL | Availability of GIS based information system for stakeholders |
| SOCIAL | Flood risk education |
| SOCIAL | Active involvement and support of citizens in flood risk related activities |
| SOCIAL | Informal coordination of citizens’ actions within community |
| SOCIAL | Multidisciplinary knowledge exchange (engineer, architect/urban planner, sociologist, economist, politician—city government, etc.) |
| SOCIAL | Responsible authorities learning and adapting from previous events |
| SOCIAL | Citizens learning and adapting from previous events |
| SOCIAL | Availability of trained volunteers |
References
- Panel on Climate Change (IPCC). Glossary of terms. In Managing the Risks of Extreme Events and Disasters to Advance Climate Change Adaptation; Field, C.B., Barros, V.R., Stocker, T.F., Qin, D., Dokken, D.J., Ebi, K.L., Mastrandrea, M.D., Mach, K.J., Plattner, G.-K., Allen, S.K., et al., Eds.; Cambridge University Press: New York, NY, USA, 2012; pp. 555–564. [Google Scholar]
- Deliverable 3.1: Holistic and Multiple Risk Assessment Framework, PEARL Project (FP7-ENVIRONMENT—603663). Available online: http://www.pearl-fp7.eu/about-pearl/wp/wp3/ (accessed on 3 September 2016).
- United Nations Development Programme (UNDP). Human Development Report 2014. Sustaining Human Progress: Reducing Vulnerabilities and Building Resilience; United Nations Development Programme (UNDP): New York, NY, USA, 2014. [Google Scholar]
- Bahadur, A.; Wilkinson, E.; Tanner, T. Measuring resilience: An analytical review (under review). Clim. Dev. 2015. [Google Scholar] [CrossRef]
- Lisa, E.; Schipper, F.; Langston, L. A Comparative Overview of Resilience Measurement Frameworks: Analysing Indicators and Approaches; Overseas Development Institute: London, UK, 2015. [Google Scholar]
- Batica, J.; Gourbesville, P.; Hu, F.Y. Methodology for Flood Resilience Index. In Proceedings of the International Conference on Flood Resilience: Experiences in Asia and Europe, Exeter, UK, 5–7 September 2013.
- CORFU Project, Official Web Site. Available online: http://www.corfu7.eu/ (accessed on 10 January 2016).
- PEARL Project, Official Web Site. Available online: http://www.pearl-fp7.eu/ (accessed on 10 January 2016).
- The European NWRM Platform. Available online: http://nwrm.eu/ (accessed on 8 January 2016).
- PREPARED Project, Official Web Site. Available online: http://prepared-fp7.eu/ (accessed on 15 January 2016).
- Climate App. Available online: http://www.climateapp.nl/ (accessed on 15 January 2016).
- Urban Green-Blue Grids for Sustainable and Resilient Cities. Available online: http://www.urbangreenbluegrids.com/ (accessed on 15 January 2016).
- Levenshtein, V. Binary codes capable of correcting deletions, insertions, and reversals. Sov. Phys. Dokl. 1966, 10, 707–710. [Google Scholar]
- The SUStainable DRAINage Systems (Susdrain) Website. Available online: http://www.susdrain.org/ (accessed on 15 January 2016).
- Ogunyoye, F.; Stevens, R.; Underwood, S. Delivering Benefits through Evidence: Temporay Demountable Flood Protection Guide; Environament Agency: Bristol, UK, 2011.
- Batica, J.; Gourbesville, P. Flood Resilience Index—Methodology and Application. In Proceedings of the 11th International Conference on Hydroinformatics, New York, NY, USA, 2014.
- RISC-KIT and PEARL Consortium. Disaster Risk Reduction Strategies in EU Coastal Areas, RISC-KIT Project (FP7-ENVIRONMENT—603458) and PEARL Project (FP7-ENVIRONMENT—603663). Available online: http://www.pearl-fp7.eu/portfolio-item/pb_drrstrategy/ (accessed on 7 September 2016).


| Very low 0–2 | The activities are not clear and coherent in an overall flood risk management plan. Awareness of important issues is very low as well as the motivation to address them. Interventions have a short-term character. Actions are limited to crisis response. |
| Low 2–3 | Awareness of the issues and motivation to address them exist. Capacity building of human resources remains limited. Capacity to act is improved and substantial. Interventions are more numerous and long-term. There is development and implementation of solutions. |
| Medium 3–4 | Integration and implementation of solutions is at a high level. Interventions are extensive, covering all main aspects of the “problem” and they are part of a coherent long-term strategy. |
| High 4–5 | A ”culture of safety” exists among all stakeholders, where the resilience concept is embedded in all relevant policies, planning, practice, attitudes and behavior. |
| Dimension | Indicator |
|---|---|
| INSTITUTIONAL | Embodying flood risk in urban planning |
| INSTITUTIONAL | Land use control |
| INSTITUTIONAL | Availability of flood vulnerability maps |
| INSTITUTIONAL | Availability and implementation of regulations enhancing adaptation/mitigation |
| PHYSICAL | Sufficient storage capacity of the urban drainage system to accept flood water |
| PHYSICAL | Level of floodwater retention and detention |
| PHYSICAL | Use of an Early Warning System (EWS) |
| PHYSICAL | Support of announcements (e.g., via email, SMS) to target groups by the EWS |
| PHYSICAL | Availability and level of accessibility of emergency shelters |
| PHYSICAL | Availability of hydraulic structures for river watershed management capable to reduce peak discharges |
| PHYSICAL | Availability of flood-proofing constructions of strategic infrastructures |
| SOCIAL | Responsible authorities learning and adapting from previous events |
| SOCIAL | Flood risk education |
| SOCIAL | Multidisciplinary knowledge exchange (engineer, architect/urban planner, sociologist, economist, politician—city government, etc.) |
| SOCIAL | Citizens learning and adapting from previous events |
| SOCIAL | Active involvement and support of citizens in flood risk related activities |
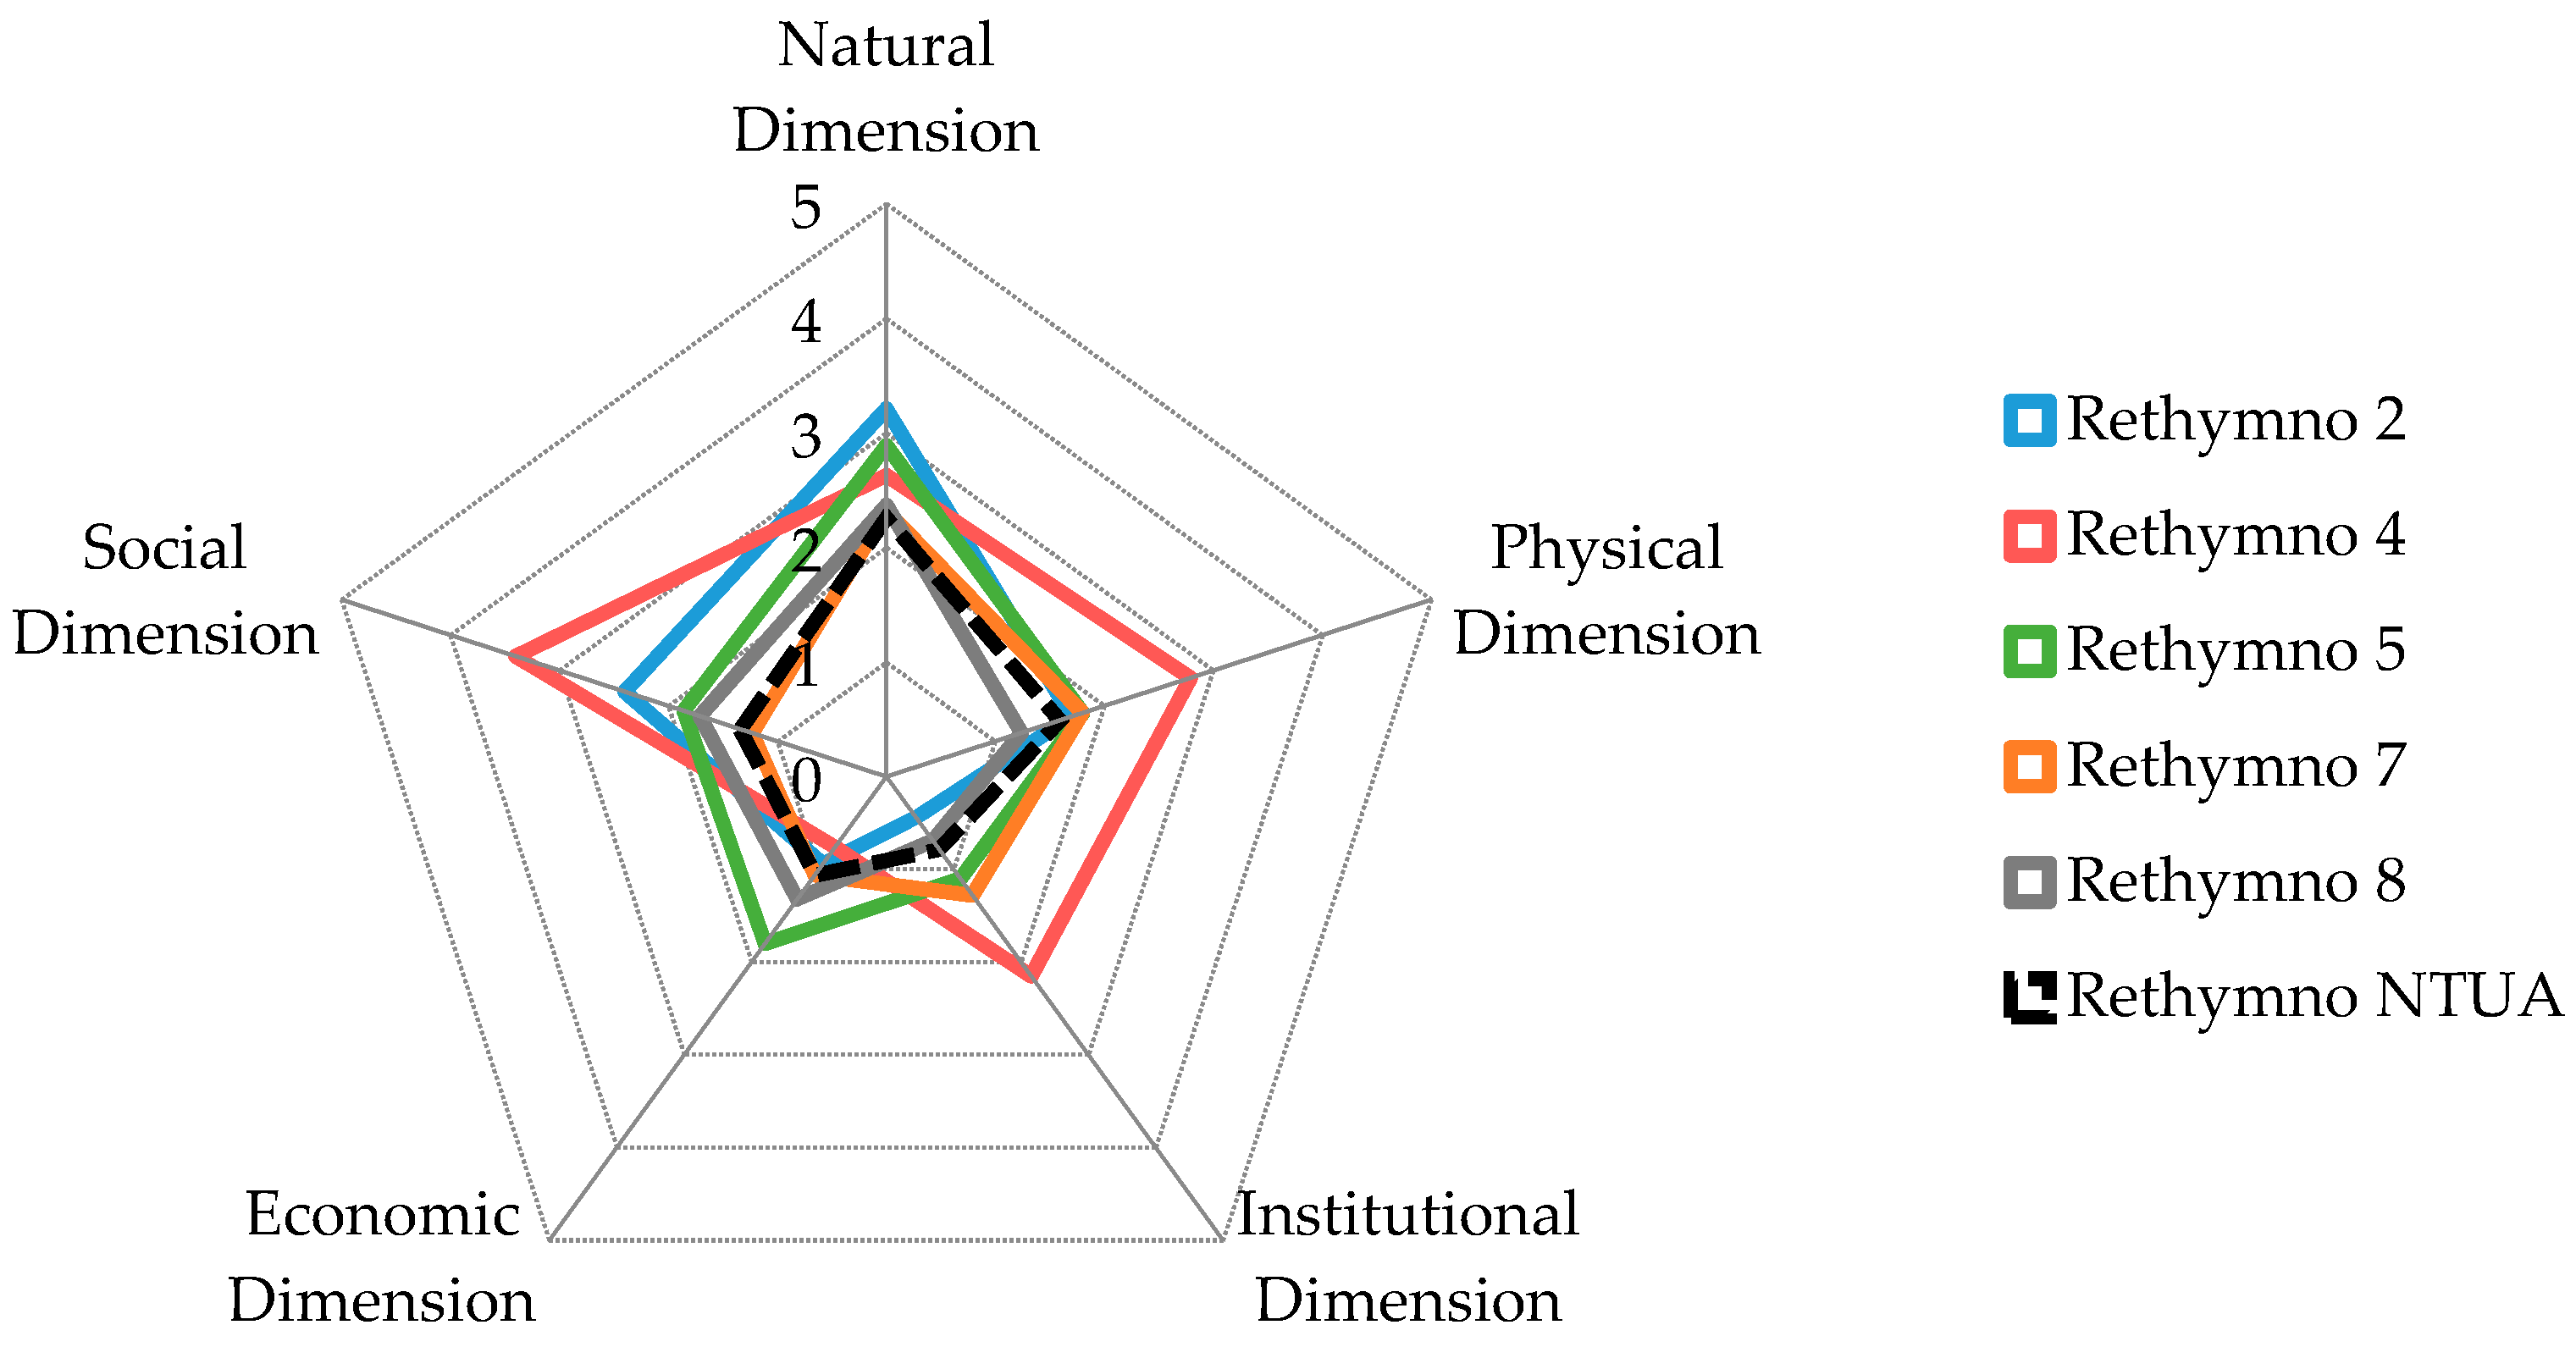
| Name of Group | Authorities’ FRI | Expert’s FRI |
|---|---|---|
| Rethymno 2 | 1.70 | 1.39 |
| Rethymno 4 | 2.35 | |
| Rethymno 5 | 1.86 | |
| Rethymno 7 | 1.53 | |
| Rethymno 8 | 1.44 |
| Dimension 1 | Suggested Measures and/or Strategy |
|---|---|
| Natural | Afforestation and improvement of soil infiltration capacity of upstream rural areas |
| Polder | |
| Physical | Floodwall |
| Artificial reef breakwaters | |
| Artificial sand dunes and dune rehabilitation | |
| Maintenance of hydraulic structures of the storm drainage system | |
| Disconnecting paved surface from sewer system | |
| Storm water retention tanks | |
| Institutional | Evacuation plan |
| Municipal plan of protection | |
| Flood forecast and early warning systems | |
| Inter-municipal flood alert exercises | |
| Monitoring and flood forecasting through partnerships | |
| Land use plan/spatial planning | |
| Flood hazard mapping | |
| Economic | Budget diversion |
| Sponsorships | |
| International loan | |
| Reserve funds | |
| Government debt instrument | |
| Emergency supplies and utilities | |
| Social | Use of social media |
| Public awareness, information, education and communication | |
| Flood alert exercise for citizens |
© 2016 by the authors; licensee MDPI, Basel, Switzerland. This article is an open access article distributed under the terms and conditions of the Creative Commons Attribution (CC-BY) license (http://creativecommons.org/licenses/by/4.0/).
Share and Cite
Karavokiros, G.; Lykou, A.; Koutiva, I.; Batica, J.; Kostaridis, A.; Alves, A.; Makropoulos, C. Providing Evidence-Based, Intelligent Support for Flood Resilient Planning and Policy: The PEARL Knowledge Base. Water 2016, 8, 392. https://doi.org/10.3390/w8090392
Karavokiros G, Lykou A, Koutiva I, Batica J, Kostaridis A, Alves A, Makropoulos C. Providing Evidence-Based, Intelligent Support for Flood Resilient Planning and Policy: The PEARL Knowledge Base. Water. 2016; 8(9):392. https://doi.org/10.3390/w8090392
Chicago/Turabian StyleKaravokiros, George, Archontia Lykou, Ifigenia Koutiva, Jelena Batica, Antonis Kostaridis, Alida Alves, and Christos Makropoulos. 2016. "Providing Evidence-Based, Intelligent Support for Flood Resilient Planning and Policy: The PEARL Knowledge Base" Water 8, no. 9: 392. https://doi.org/10.3390/w8090392
APA StyleKaravokiros, G., Lykou, A., Koutiva, I., Batica, J., Kostaridis, A., Alves, A., & Makropoulos, C. (2016). Providing Evidence-Based, Intelligent Support for Flood Resilient Planning and Policy: The PEARL Knowledge Base. Water, 8(9), 392. https://doi.org/10.3390/w8090392