Drought Characteristics over the Western Cape Province, South Africa
Abstract
:1. Introduction
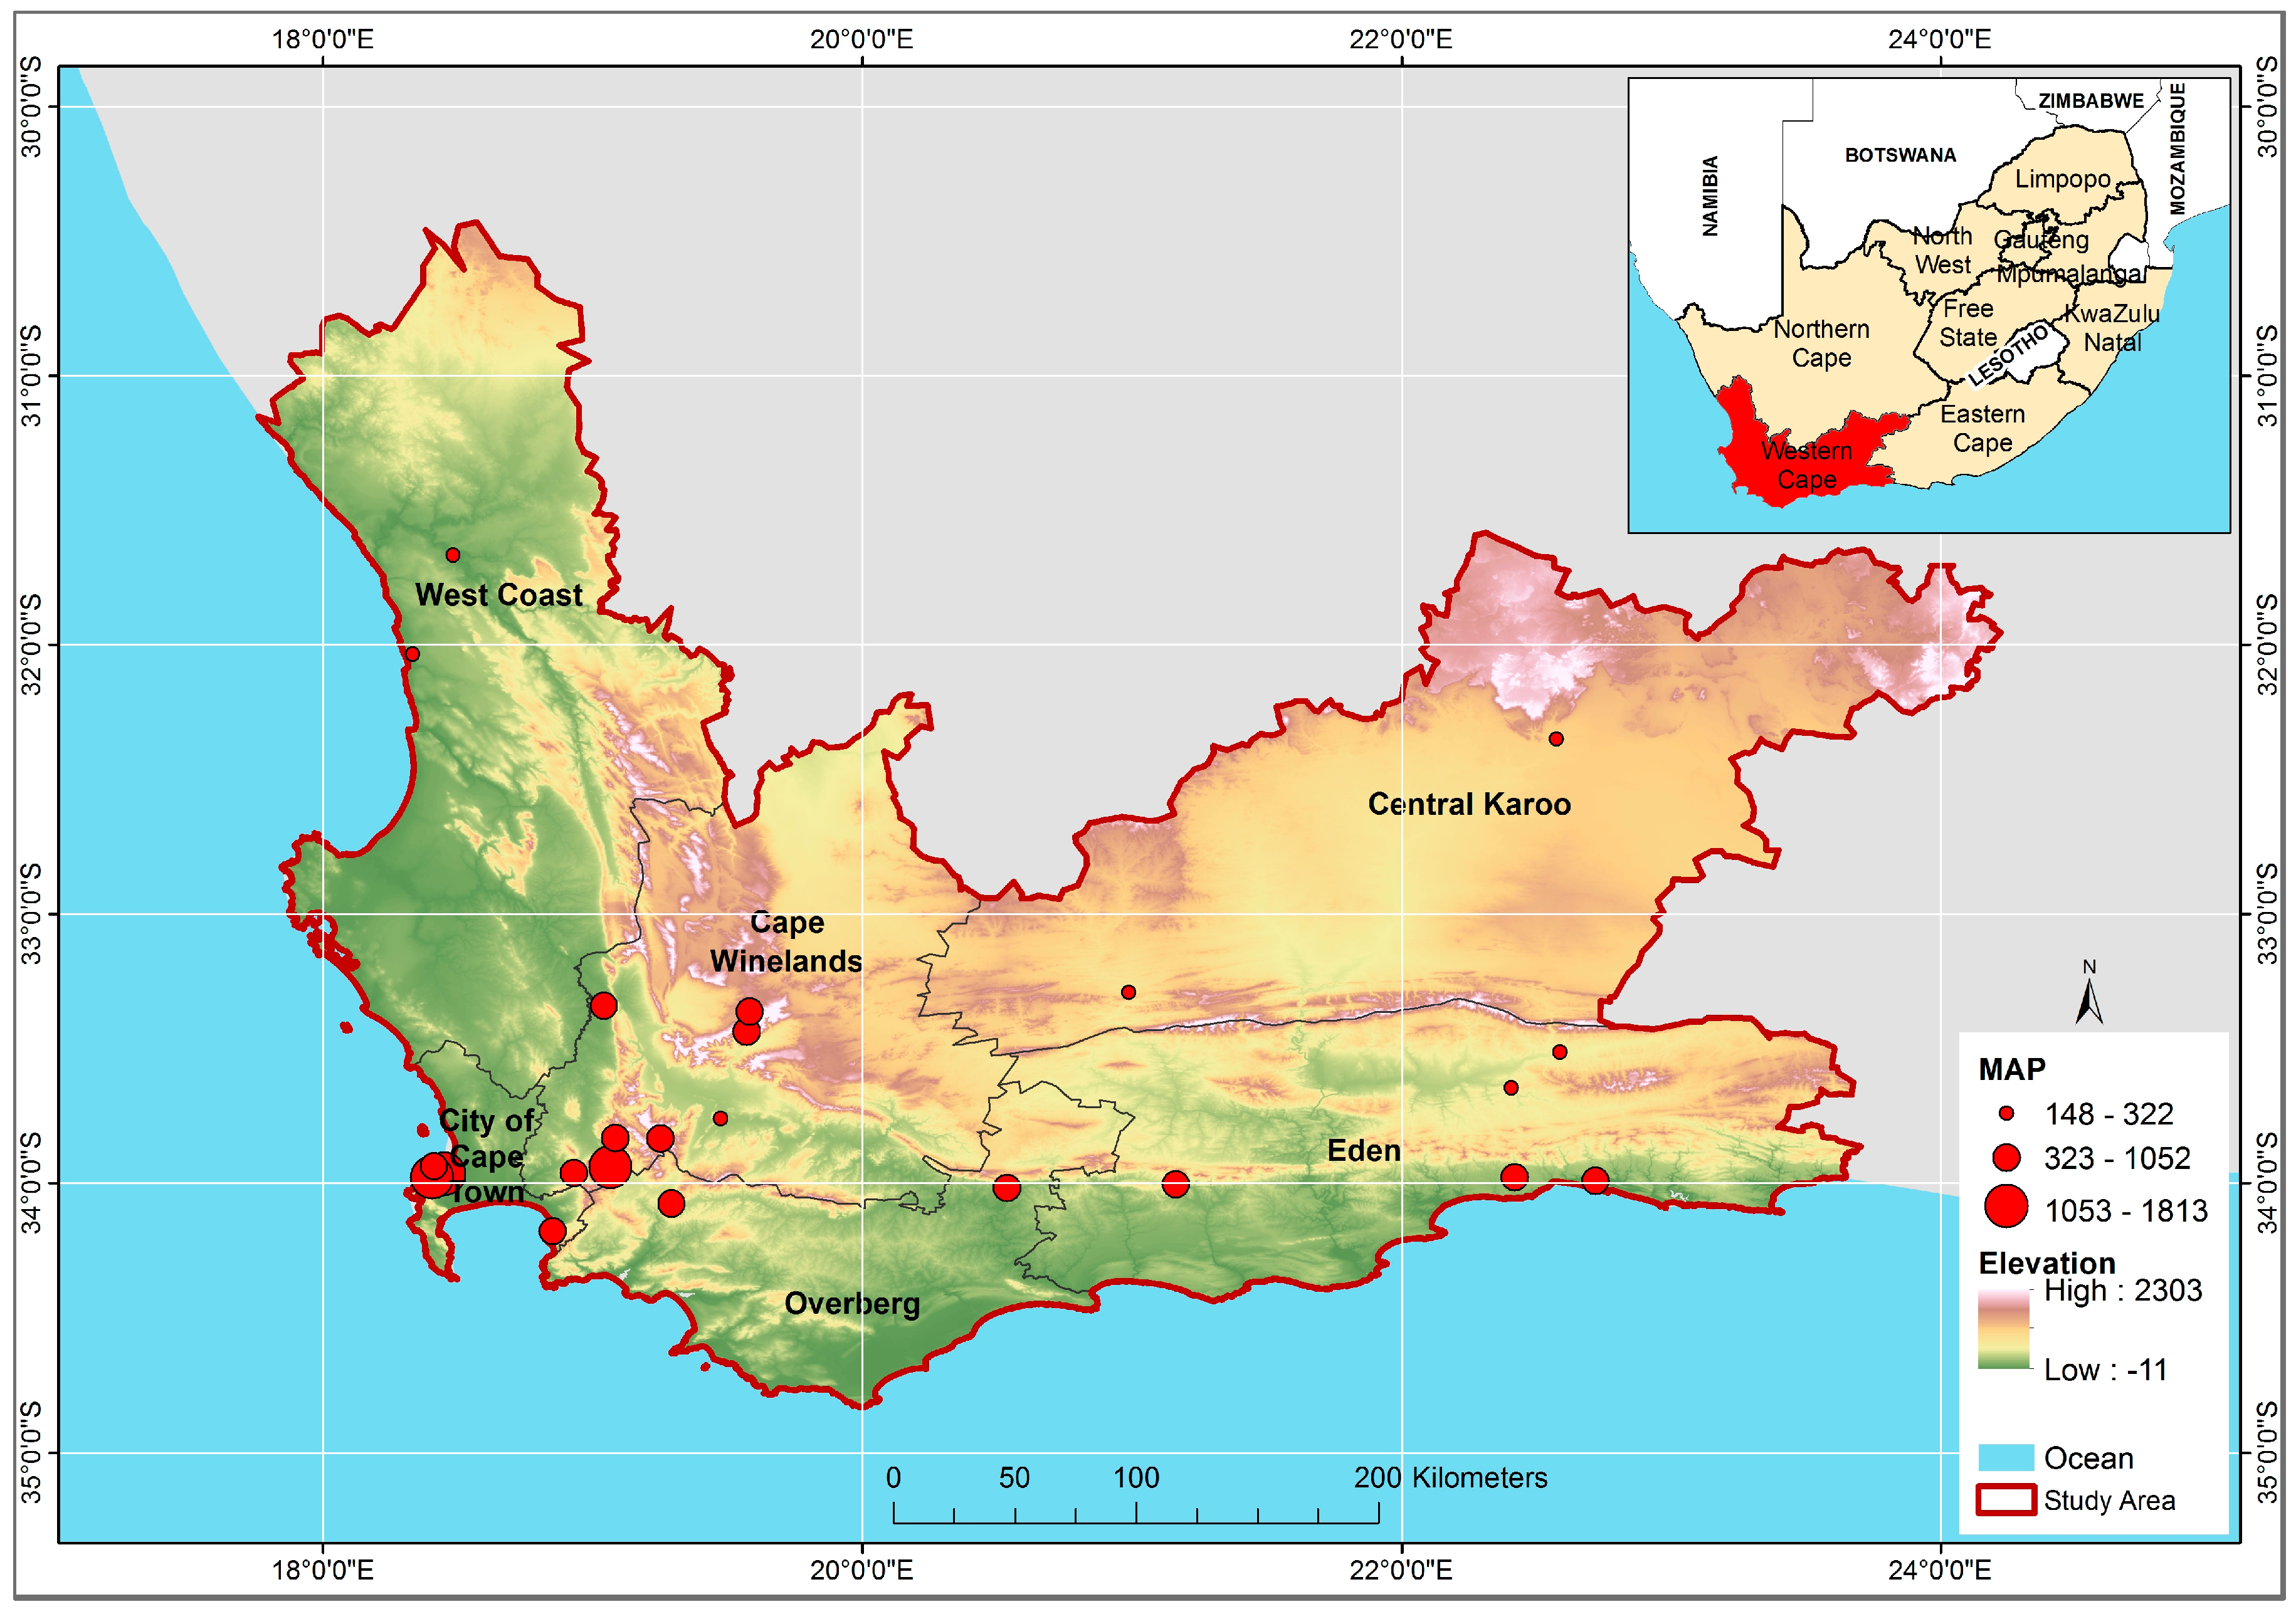
2. Study Area
3. Data and Method
3.1. Data
3.2. Methodology
4. Results
4.1. Seasonal Trends in Precipitation
4.2. Annual Trends in Precipitation
4.3. Analysis of SPI Time Series
4.4. Statistical Characteristics of SPI
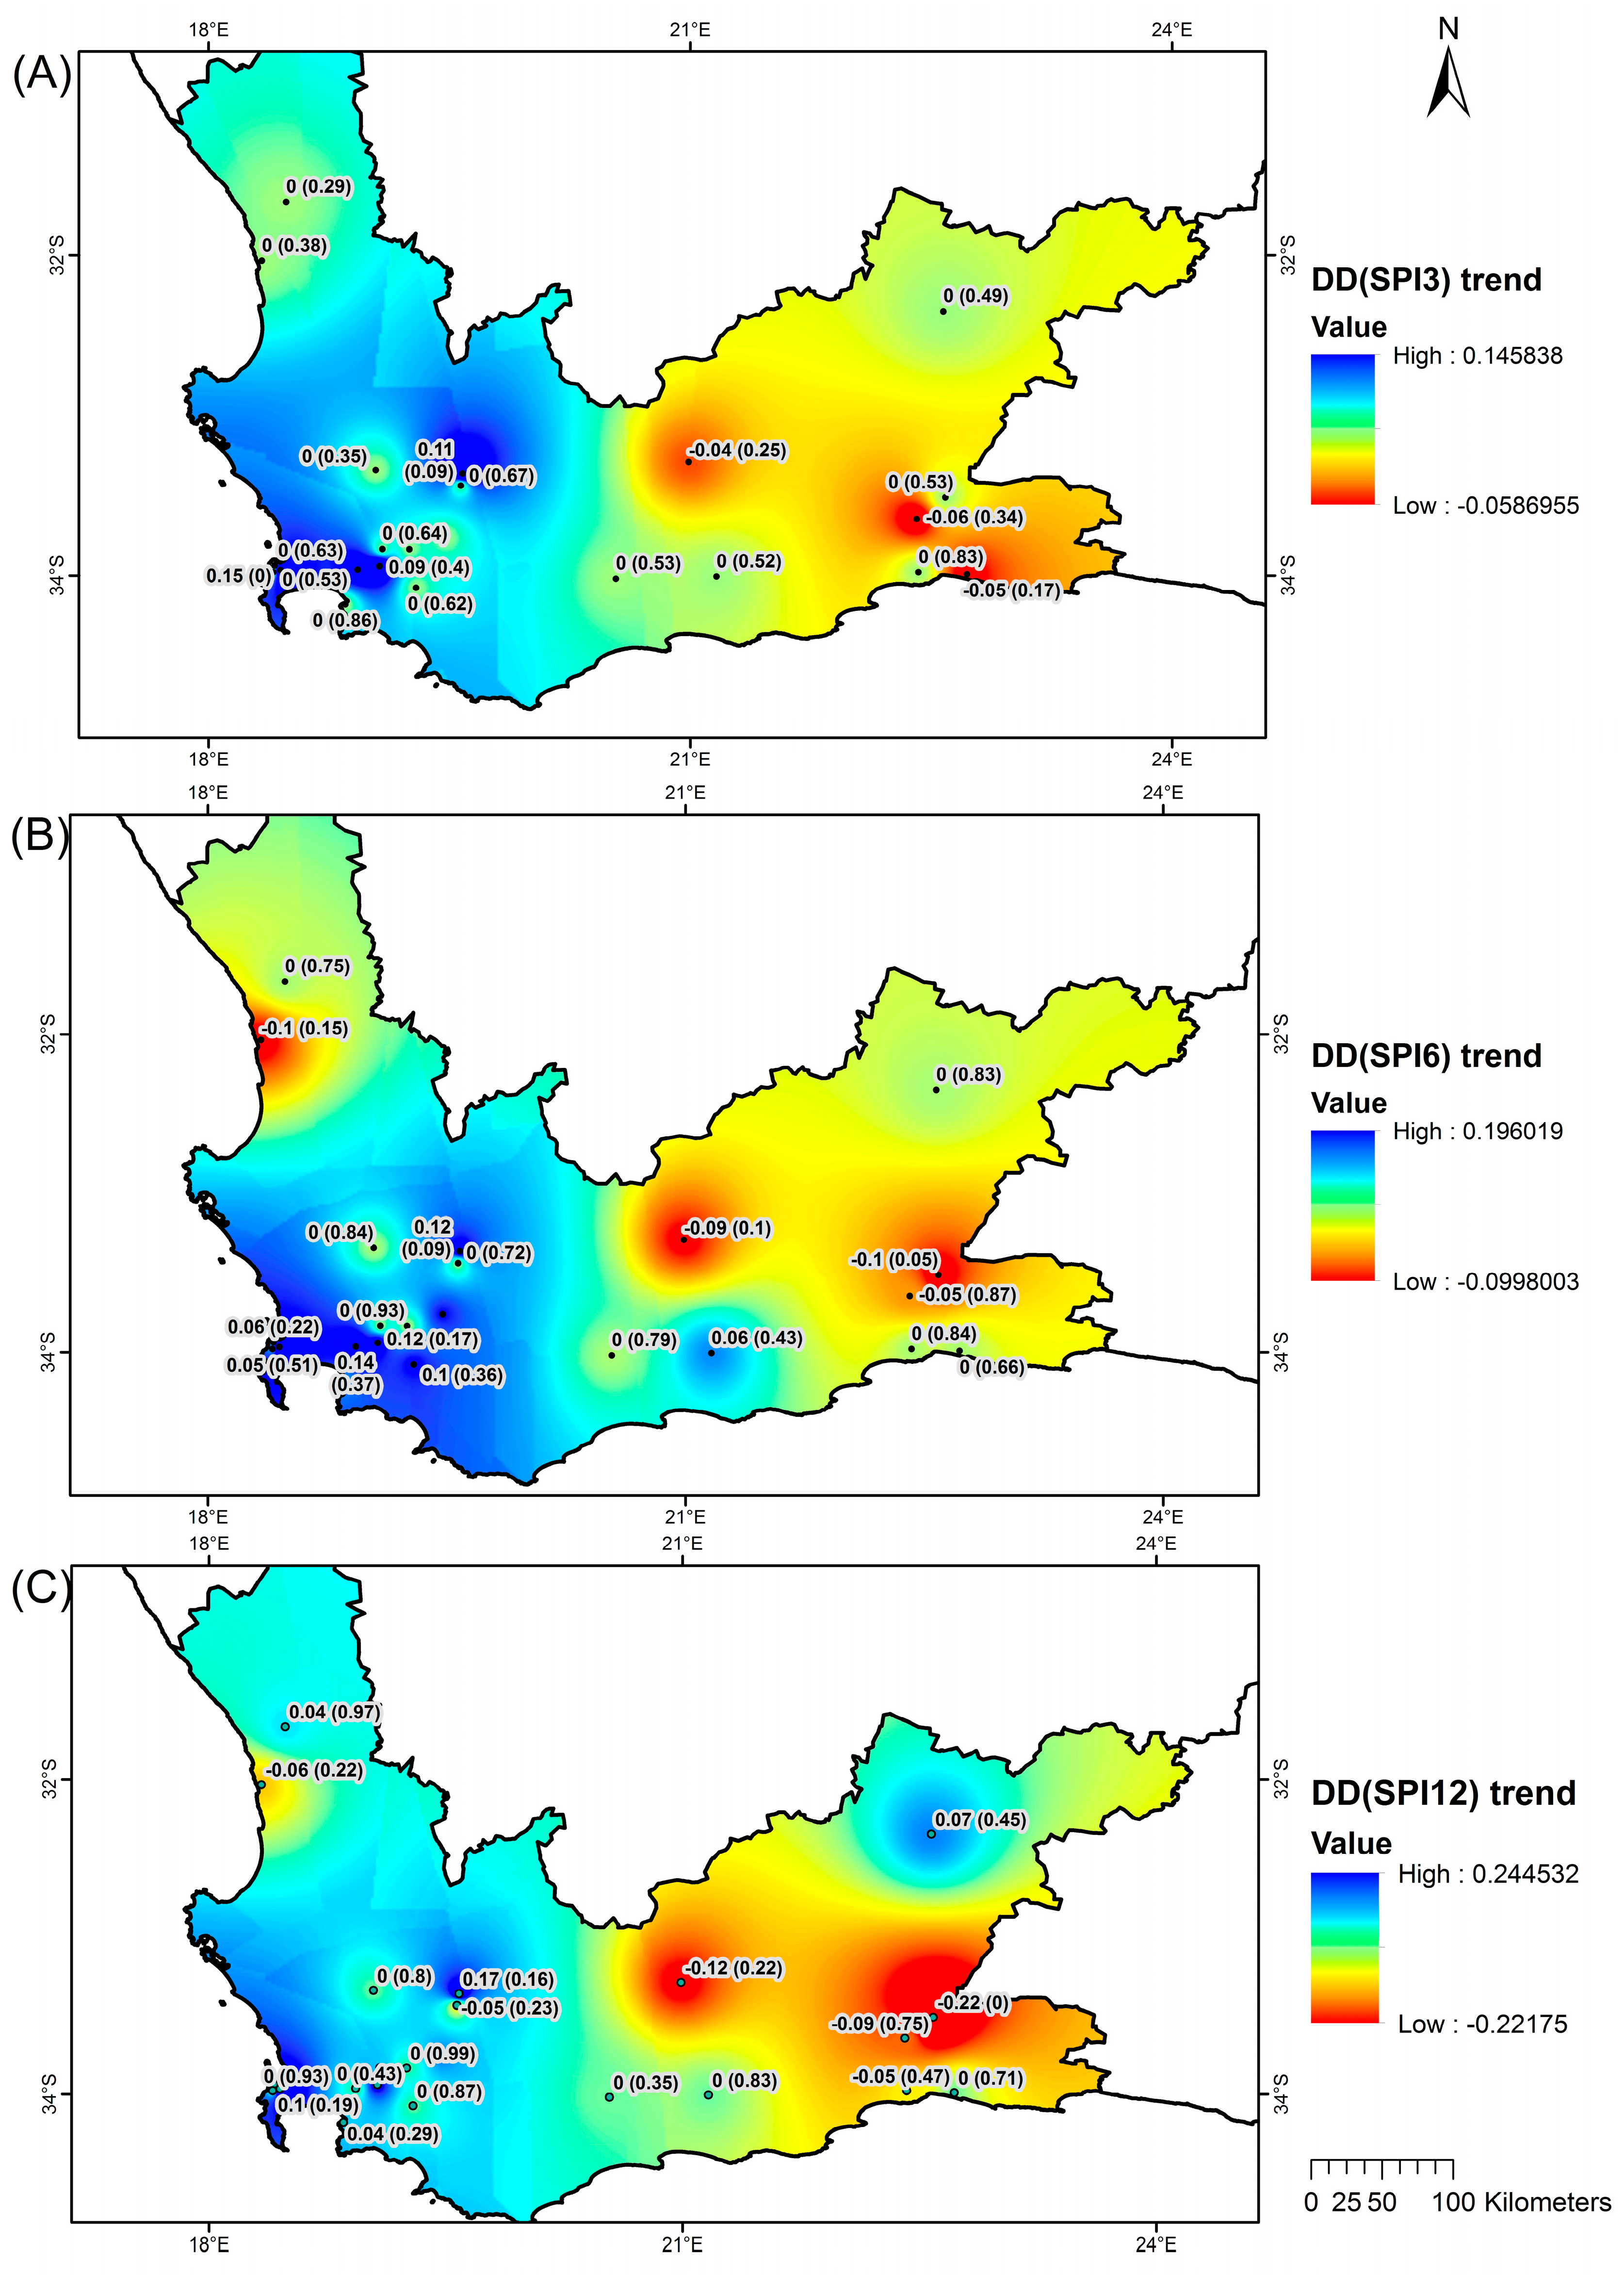
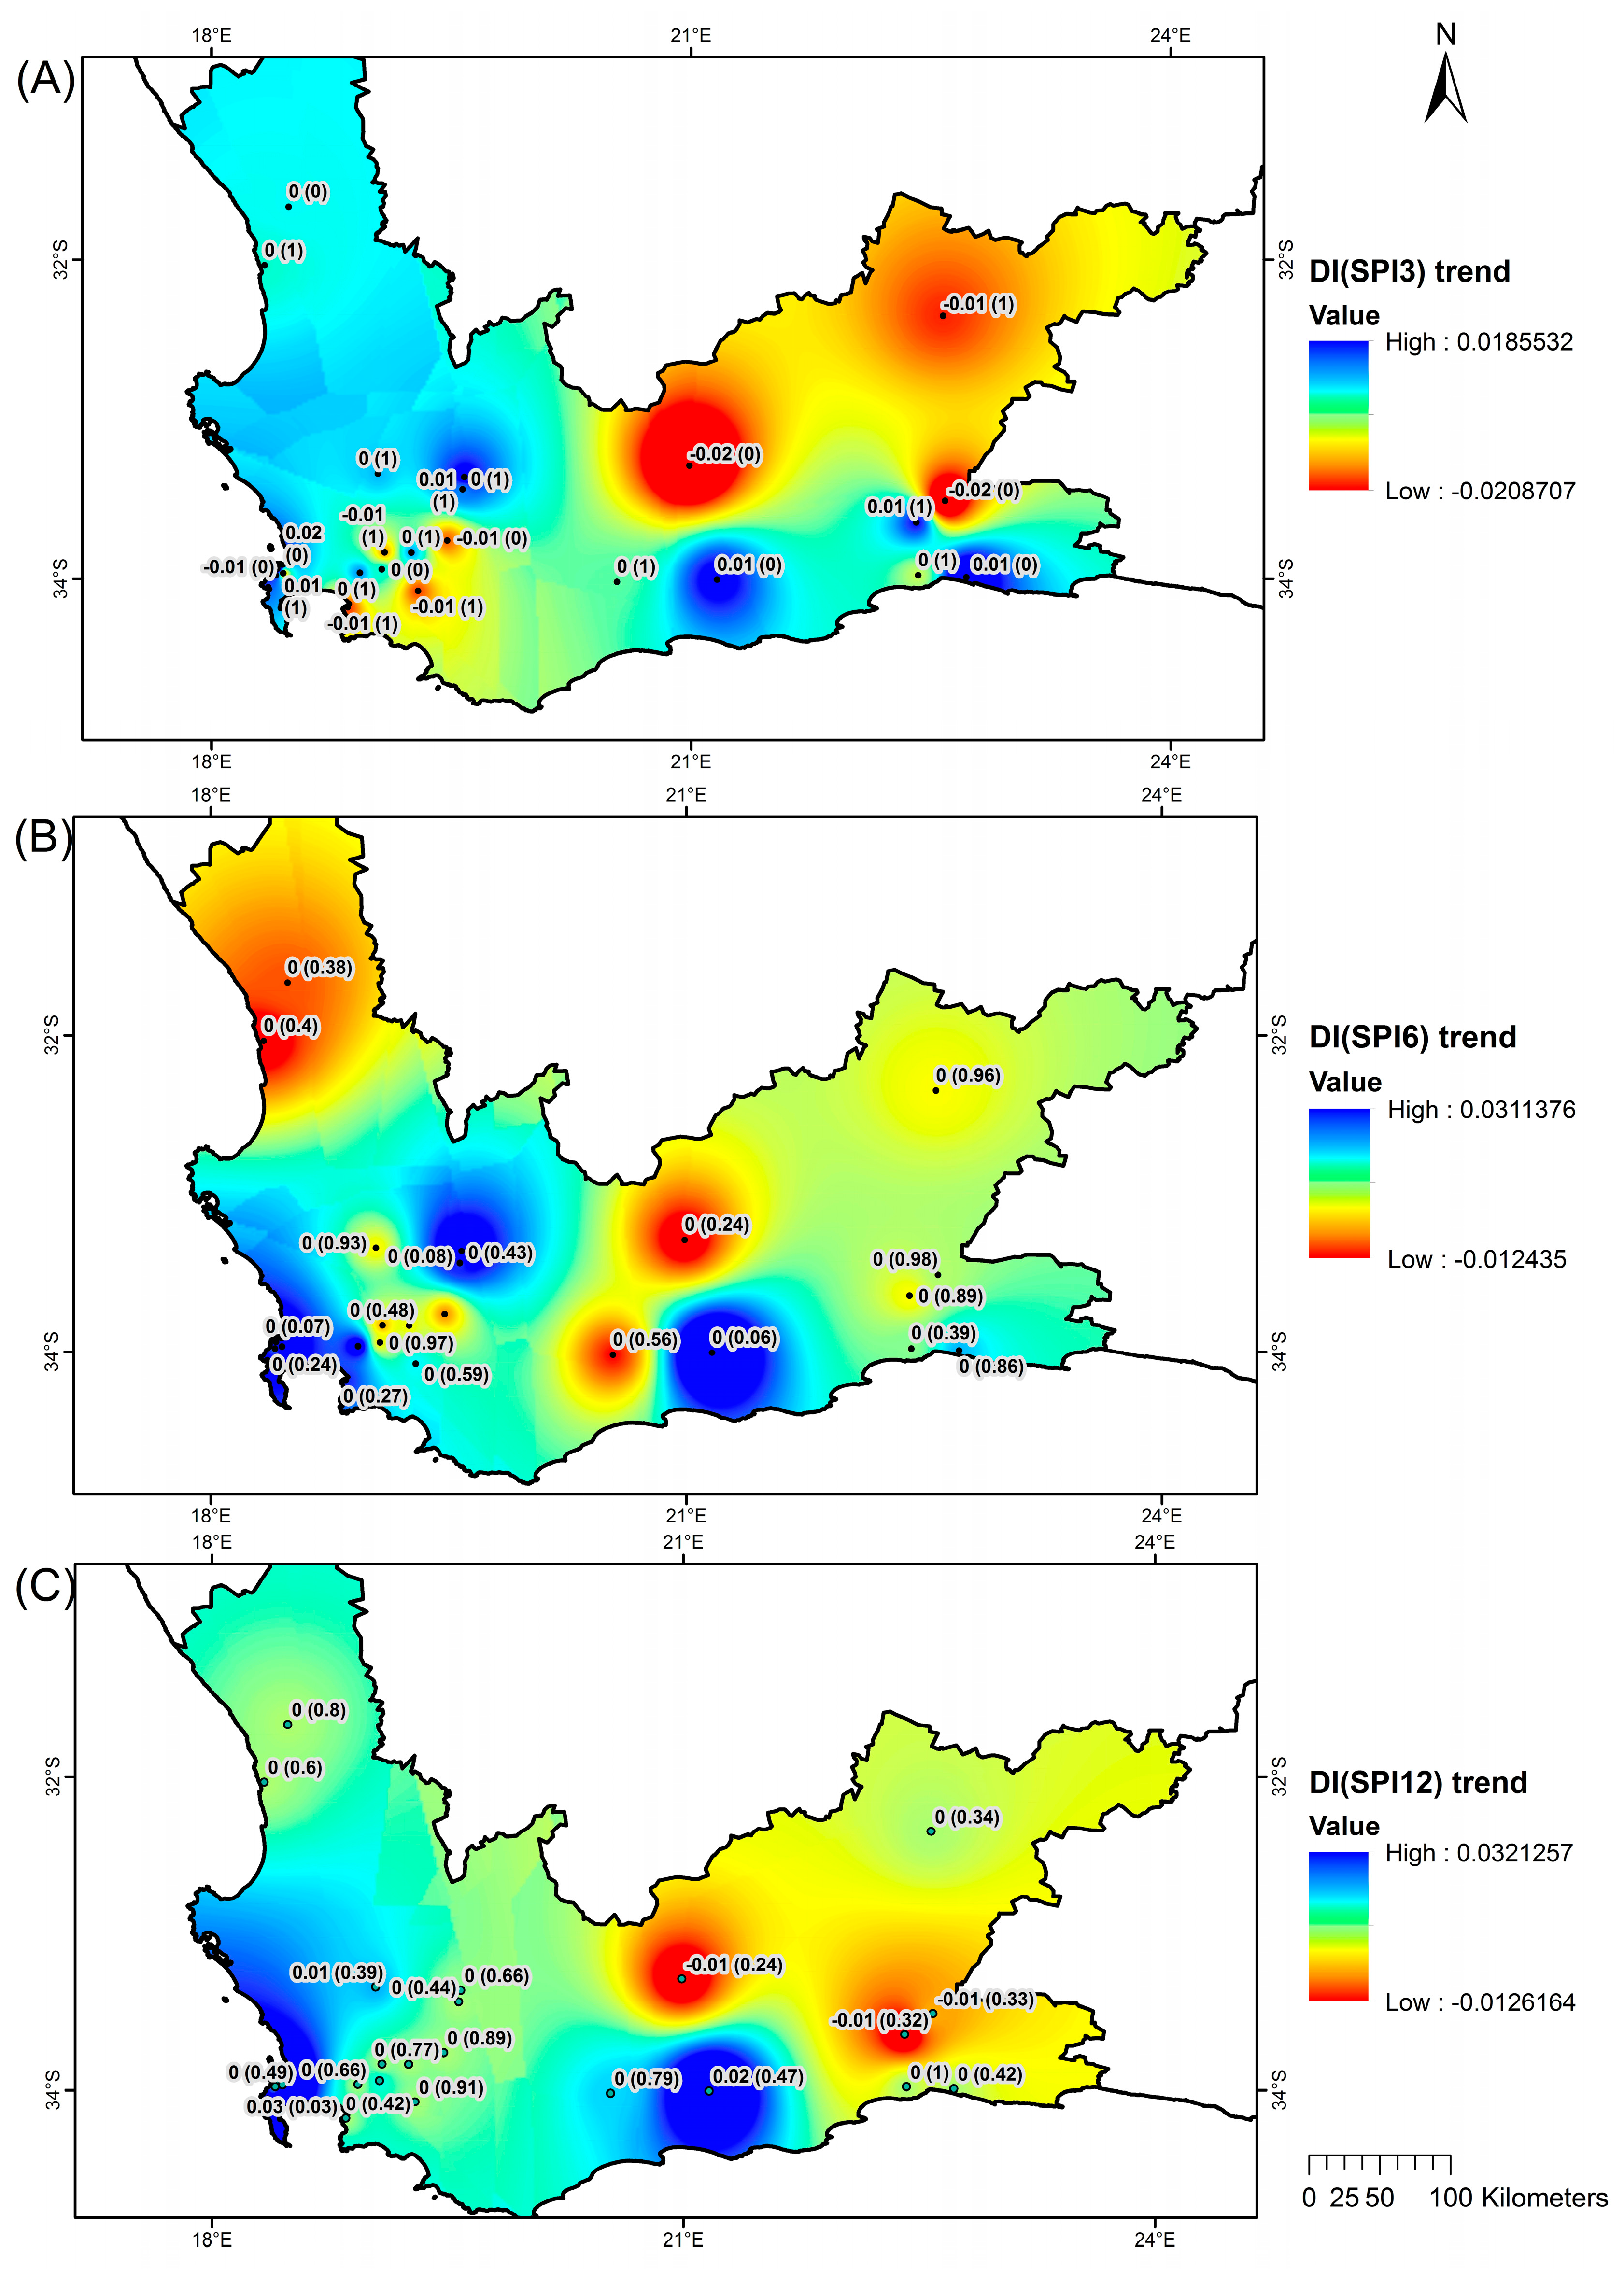
4.5. Trends in Drought Monitoring Indicators Characteristics
5. Implications of Drought Conditions to Agriculture and Water Resources in the Western Cape
6. Conclusions
- (a)
- Over the past three decades, the Western Cape Province has experienced persistent droughts with varying magnitudes and pattern of occurrences.
- (b)
- The ongoing drought conditions over the Western Cape Province appears to be a regular part of nature’s cycle. Notwithstanding drought conditions of the 21st century, the province has continuously experienced recurrent drought patterns dating as far back as the 20th Century.
- (c)
- Analysis of historical drought characteristics based on drought indicators is an important first step towards: (i) placing the current drought conditions into perspective, (ii) contributing towards triggering action and responses on drought preparedness, and (iii) laying the foundation for drought monitoring and development of early warning systems.
Acknowledgments
Author Contributions
Conflicts of Interest
References
- Sonmez, F.K.; Komuscu, A.U.; Erkan, A.; Turgu, E. An analysis of spatial and temporal dimension of drought vulnerability in Turkey using the standardized precipitation index. Nat. Hazards 2005, 35, 243–264. [Google Scholar] [CrossRef]
- Vicente-Serrano, S.M.; Begueria, S.; Lopez-Moreno, J.I. Comment on “characteristics and trends in various forms of the Palmer Drought Severity Index (PDSI) during 1900–2008” by Aiguo Dai. J. Geophys. Res. 2011. [Google Scholar] [CrossRef]
- Wilhite, D.A. (Ed.) Drought: A Global Assessment; Routledge: London, UK, 2000. [Google Scholar]
- Tallaksen, L.M.; Van Lanen, A.A.J. Hydrological Drought: Processes and Estimation Methods for Streamflow and Groundwater; Tallaksen, L.M., van Lanen, H.A.J., Eds.; Developments in Water Science, 48, Elsevier Science B.V.: Amsterdam, The Netherlands, 2004; pp. 199–271. [Google Scholar]
- McKee, T.B.; Doesken, N.J.; Kleist, J. The relationship of drought frequency and duration to time scales. In Proceedings of the 8th Conference on Applied Climatology, Anaheim, CA, USA, 17–22 January 1993; pp. 179–184. [Google Scholar]
- Vicente-Serrano, S.M.; Beguería, S.; López-Moreno, J.I. A multiscalar drought index sensitive to global warming: The standardized precipitation evapotranspiration index. J. Clim. 2010, 23, 1696–1718. [Google Scholar] [CrossRef]
- Palmer, W.C. Meteorological Drought; Weather Bureau Research Paper No. 45; Department of Commerce: Washington, DC, USA, 1965; p. 58.
- Kogan, F.N. Droughts of the late 1980s in the United States as derived from NOAA polar-orbiting satellite data. Am. Meteorol. Soc. 1995, 76, 655–668. [Google Scholar] [CrossRef]
- Byun, H.R.; Wilhite, D.A. Daily quantification of drought severity and duration. J. Clim. 1996, 5, 1181–1201. [Google Scholar]
- Hao, Z.C.; AghaKouchak, A. Multivariate Standardized Drought Index: A parametric multi-index model. Adv. Water Resour. 2013, 57, 12–18. [Google Scholar] [CrossRef]
- Keyantash, J.; Dracup, J. The quantification of drought: An evaluation of drought indices. Bull. Am. Meteorol. Soc. 2002, 83, 1167–1180. [Google Scholar]
- Mishra, A.K.; Singh, V.P. A review of drought concepts. J. Hydrol. 2010, 391, 202–216. [Google Scholar] [CrossRef]
- Sivakumar, M.V.K.; Motha, R.P.; Wilhite, D.A.; Wood, D.A. Agricultural Drought Indices: Proceedings of an Expert Meeting, Proceedings of the WMO/UNISDR Expert Meeting on Agricultural Drought Indices, Geneva, Switzerland, 2–4 June 2010; AGM-11, WMO/TD No. 1572; WAOB-2011; World Meteorological Organization: Murcia, Spain, 2011; p. 219. [Google Scholar]
- Chen, T.; van der Werf, G.R.; de Jeu, R.A.M.; Wang, G.; Dolman, A.J. A global analysis of the impact of drought on net primary productivity. Hydrol. Earth Syst. Sci. 2013, 17, 3885–3894. [Google Scholar] [CrossRef]
- World Meteorological Organization (WMO). Drought Monitoring and Early Warning: Concepts, Progress and Future Challenges; WMO-No. 1006; World Meteorological Organization: Geneva, Switzerland, 2006. [Google Scholar]
- Chang, T.J.; Cleopa, X.A. A proposed method of drought monitoring. Water Resour. 1991, 27, 275–281. [Google Scholar] [CrossRef]
- Heim, R.R. A review of twentieth-century drought indices used in the United States. Bull. Am. Meteorol. Soc. 2002, 83, 1149–1165. [Google Scholar]
- Gasson, B. The Biophysical Environment of the Western Cape Province in Relation to Its Economy and Settlements; School of Architecture and Planning, University of Cape Town for the Department of Local Government and Housing (Directorate of Development Promotion) of the Province of the Western Cape: Cape Town, South Africa, 1998. [Google Scholar]
- Edwards, D.C.; McKee, T.B. Characteristics of 20th Century Drought in the United States at Multiple Time Scales; Climatology Report 97-2; Department of Atmospheric Science, Colorado State University: Fort Collins, CO, USA, 1997. [Google Scholar]
- Tan, C.; Yang, J.; Li, M. Temporal-spatial variation of drought indicated by SPI and SPEI in Ningxia Hui Autonomous region, China. Amosphere 2015, 6, 1399–1421. [Google Scholar] [CrossRef]
- Zhang, X.; Vicent, L.A.; Hogg, W.D.; Niitsoo, A. Temperature and precipitation trends in Canada during the 20th Century. Atmos. Ocean 2000, 38, 395–429. [Google Scholar] [CrossRef]
- Yue, S.; Wang, C.Y. Regional streamflow trend detection with consideration of both temporal and spatial correction. Int. J. Clim. 2002, 22, 933–946. [Google Scholar] [CrossRef]
- Theil, H. A Rank-Invariant Method of Linear and Polynomial Regression Analysis, I; Springer: Dordrecht, The Netherlands, 1950; Volume 53, pp. 386–392. [Google Scholar]
- Thei, H. A Rank-Invariant Method of Linear and Polynomial Regression Analysis, II; Springer: Dordrecht, The Netherlands, 1950; Volume 53, pp. 521–525. [Google Scholar]
- Thei, H. A Rank-Invariant Method of Linear and Polynomial Regression Analysis, III; Springer: Dordrecht, The Netherlands, 1950; Volume 53, pp. 1397–1452. [Google Scholar]
- Sen, P.K. Estimates of the regression coefficient based on Kendall’s tau. J. Am Statist. Assoc. 1968, 63, 1379–1389. [Google Scholar] [CrossRef]
- Mzezewa, J.; Misi, T.; van Rensburg, L.D. Characteristics of rainfall at a semi-arid ecotope in the Limpopo Province (South Africa) and its implications for sustainable crop production. Water SA 2010, 36, 19–26. [Google Scholar] [CrossRef]


| Station Name | DJF Trends (Sig.) | MAM Trends (Sig.) | JJA Trends (Sig.) | SON Trends (Sig.) |
|---|---|---|---|---|
| Voelvlei Dam | −0.186 (0.76) | −0.645 (0.76) | −0.852 (0.84) | 0.417 (0.71) |
| Wemmershoek Dam | −1.114 (0.14) | −2.272 (0.29) | −1.555 (0.84) | 1.886 (0.29) |
| Assegaaibos | −2.558 (0.01) | −4.127 (0.43) | −7.564 (0.34) | −0.304 (0.84) |
| Higgovale CT | −0.251 (0.29) | −1.798 (0.29) | −1.105 (0.68) | 0.684 (0.58) |
| Table Mountain | −1.598 (0.10) | −3.233 (0.26) | −2.223 (0.68) | 0.587 (0.86) |
| Table Mountain at Newlands | −1.264 (0.17) | −4.690 (0.14) | −7.635 (0.08) | −1.604 (0.29) |
| Jonkershoek | −2.920 (0.01) | −4.653 (0.07) | −0.115 (0.84) | 1.802 (0.92) |
| Lambertsbaai | −0.183 (0.59) | −0.316 (0.76) | 0.573 (0.54) | 0.013 (0.56) |
| Kogel Baai | −0.409 (0.97) | −2.653 (0.06) | −1.087 (0.41) | 0.829 (0.92) |
| Vredendal | 0.096 (0.16) | −0.357 (0.04) | 0.383 (0.76) | −0.094 (0.76) |
| Stettynskloof Dam | −0.465 (0.66) | −1.662 (0.36) | 1.624 (0.95) | 0.184 (1.00) |
| Roode Els Berg Dam | −0.258 (0.79) | −1.997 (0.52) | −0.583 (0.92) | −0.868 (0.63) |
| Lakenvallei Dam | −0.309 (0.92) | −2.395 (0.10) | −0.22962 (0.92) | −0.699 (0.86) |
| Kwaggaskloof Dam | 0.257 (0.43) | −1.192 (0.09) | −0.333 (0.61) | −0.269 (0.97) |
| Theewaterskloof Dam | −0.297 (0.92) | −2.340 (0.00) | 1.299 (0.40) | −0.274 (0.95) |
| Buffeljags Dam | −0.088 (0.84) | −1.033 (0.18) | 0.975 (0.40) | 0.302 (0.95) |
| Korinte−vet Dam | −1.694 (0.28) | −2.273 (0.20) | 0.792 (0.34) | 0.194 (0.63) |
| Floriskraal Dam | 0.288 (0.22) | 0.803 (0.23) | 0.861 (0.29) | −0.188 (0.86) |
| Gamka Dam | 0.645 (0.15) | −0.542 (0.36) | 0.212 (0.23) | −0.566 (0.22) |
| Kammanassie Dam | 0.759 (0.17) | 0.128 (0.81) | 1.280 (0.00) | −0.743 (0.14) |
| Stompdrift Dam | 0.387 (0.21) | 0.122 (0.87) | 0.665 (0.08) | −0.483 (0.45) |
| George | −0.671 (0.78) | −0.554 (0.61) | 0.844 (0.52) | −0.018 (0.95) |
| Ronde Valley | −1.609 (0.50) | 0.719 (0.61) | 1.156 (0.28) | −0.309 (0.81) |
| Station | SPI-3 | SPI-6 | SPI-12 | ||||||
|---|---|---|---|---|---|---|---|---|---|
| Var. | Kurt. | Skew. | Var. | Kurt. | Skew. | Var. | Kurt. | Skew. | |
| Voelvlei Dam | 0.277 | 0.437 | −0.605 | 0.462 | −0.348 | −0.349 | 0.682 | −0.970 | 0.019 |
| Wemmershoek Dam | 0.262 | −0.569 | 0.388 | 0.454 | 0.166 | 0.726 | 0.713 | 0.368 | 0.752 |
| Assegaaibos | 0.268 | −0.079 | −0.688 | 0.509 | −0.406 | −0.446 | 0.753 | −0.414 | −0.220 |
| Higgovale CT | 0.251 | −0.065 | −0.559 | 0.455 | −0.420 | −0.271 | 0.754 | −0.456 | −0.337 |
| Table Mountain | 0.333 | 0.048 | 0.203 | 0.514 | 0.357 | 0.424 | 0.774 | 0.059 | 0.562 |
| Table Mountain at Newlands | 0.315 | −0.587 | −0.325 | 0.484 | −0.393 | −0.048 | 0.747 | −0.404 | 0.035 |
| Jonkershoek | 0.368 | 0.194 | −1.008 | 0.666 | 0.176 | −1.012 | 1.367 | 1.078 | −1.424 |
| Lambertsbaai | 0.200 | −0.599 | 0.330 | 0.370 | −0.440 | 0.212 | 0.616 | −0.173 | 0.341 |
| Kogel Baai | 0.499 | 3.818 | −1.512 | 0.725 | 0.653 | −0.880 | 1.080 | 3.427 | −1.415 |
| Vredendal | 0.307 | −0.315 | 0.594 | 0.462 | −0.334 | 0.702 | 0.580 | 0.033 | 0.318 |
| Stettynskloof Dam | 0.200 | −0.542 | 0.262 | 0.393 | −0.466 | 0.646 | 0.721 | 0.106 | 0.738 |
| Roode Els Berg Dam | 0.237 | 1.254 | −0.629 | 0.393 | 0.362 | −0.394 | 0.673 | 0.867 | −0.185 |
| Lakenvallei Dam | 0.257 | −0.377 | 0.112 | 0.490 | −0.167 | 0.218 | 0.776 | 0.589 | −0.123 |
| Kwaggaskloof Dam | 0.244 | 0.833 | 0.247 | 0.466 | 0.319 | 0.144 | 0.751 | −0.037 | −0.203 |
| Theewaterskloof Dam | 0.188 | 0.336 | −0.292 | 0.417 | 0.398 | −0.480 | 0.689 | −0.098 | 0.073 |
| Buffeljags Dam | 0.168 | −0.954 | −0.346 | 0.336 | −0.689 | −0.287 | 0.690 | 0.077 | −0.901 |
| Korinte−vet Dam | 0.157 | 0.405 | −0.585 | 0.337 | 0.252 | −0.729 | 0.600 | 1.330 | −0.946 |
| Floriskraal Dam | 0.236 | −0.510 | 0.127 | 0.450 | −0.335 | −0.066 | 0.670 | −1.072 | 0.238 |
| Gamka Dam | 0.204 | 0.806 | 0.027 | 0.469 | 1.035 | −0.093 | 0.722 | 0.205 | −0.071 |
| Kammanassie Dam | 0.195 | 2.378 | −0.754 | 0.445 | 2.086 | −0.687 | 0.697 | 0.191 | −0.441 |
| Stompdrift Dam | 0.169 | 0.016 | 0.378 | 0.335 | 0.839 | 0.225 | 0.565 | 0.407 | −0.140 |
| George | 0.180 | −0.802 | 0.252 | 0.354 | −0.724 | 0.230 | 0.621 | −0.488 | −0.106 |
| Ronde Valley | 0.292 | 1.261 | −0.891 | 0.532 | 1.283 | −0.901 | 0.823 | 0.579 | −0.724 |
© 2017 by the authors. Licensee MDPI, Basel, Switzerland. This article is an open access article distributed under the terms and conditions of the Creative Commons Attribution (CC BY) license (http://creativecommons.org/licenses/by/4.0/).
Share and Cite
Botai, C.M.; Botai, J.O.; De Wit, J.P.; Ncongwane, K.P.; Adeola, A.M. Drought Characteristics over the Western Cape Province, South Africa. Water 2017, 9, 876. https://doi.org/10.3390/w9110876
Botai CM, Botai JO, De Wit JP, Ncongwane KP, Adeola AM. Drought Characteristics over the Western Cape Province, South Africa. Water. 2017; 9(11):876. https://doi.org/10.3390/w9110876
Chicago/Turabian StyleBotai, Christina M., Joel O. Botai, Jaco P. De Wit, Katlego P. Ncongwane, and Abiodun M. Adeola. 2017. "Drought Characteristics over the Western Cape Province, South Africa" Water 9, no. 11: 876. https://doi.org/10.3390/w9110876
APA StyleBotai, C. M., Botai, J. O., De Wit, J. P., Ncongwane, K. P., & Adeola, A. M. (2017). Drought Characteristics over the Western Cape Province, South Africa. Water, 9(11), 876. https://doi.org/10.3390/w9110876


