Article

Drought Characteristics over the Western Cape Province, South Africa

by
Christina M. Botai
1,*,
Joel O. Botai
1,2,
Jaco P. De Wit
1,
Katlego P. Ncongwane
1 and
Abiodun M. Adeola
1
1
South African Weather Service, Private Bag X097, Pretoria 0001, South Africa
2
Department of Geography, Geoinformatics Meteorology, Private Bag X20, Hatfield 0028, South Africa
*
Author to whom correspondence should be addressed.
Water 2017, 9(11), 876; https://doi.org/10.3390/w9110876
Submission received: 24 August 2017 / Revised: 3 November 2017 / Accepted: 7 November 2017 / Published: 10 November 2017

Abstract

:
Drought is a creeping phenomenon whose effects evolve with time, yet the start and end is often only clear in the hindsight. The present study assessed drought conditions using two categories of drought indicators computed from precipitation data sets measured by weather stations across the Western Cape Province, South Africa for the period 1985 to 2016. The first category was the Standardized Precipitation Index (SPI) accumulated over 3-, 6- and 12-months (hereafter of SPI-3, SPI-6 and SPI-12 respectively). The second category consists of the four Drought Monitoring Indicators (DMI) i.e., Drought Duration (DD), Severity (DS), Intensity (DI) and Frequency (DF). Firstly, analysis of SPI-3, SPI-6 and SPI-12 illustrate that between 1985 and 2016, the Western Cape Province experienced recurrent mild drought conditions. This suggests that the drought conditions experienced during 2015/2016 hydrological year (hereafter current) in the Western Cape Province is a manifestation of past drought conditions. Secondly, analysis of trends in DMI series depict a noticeable spatial-temporal dependence wherein the southern and western regions experienced more severe droughts compared to the eastern and northern regions of the Western Cape Province. Results also show that the DMI trends exhibit up to ~8% variability over the past decade. Overall, the current drought conditions in the Western Cape Province continues to adversely affect agricultural production while the water reservoirs are at below 30% capacity implying that the socio-economic impacts of these droughts will continue to reverberate for many months to come. Though the on-going drought conditions in the Western Cape Province is a regular part of nature’s cycle, analysis of historical drought characteristics based on drought indicators is an important first step towards placing the current drought conditions into perspective, and contribute to triggering action and response thereof. All these lay the foundation for drought monitoring and contribute towards the development of drought early warning.

1. Introduction

Drought is a slowly recurring natural phenomenon with its impacts cutting across different sectors (e.g., agriculture, water resources, tourism, energy, ecosystems, etc.) in the society. In particular, droughts are the most complex and damaging natural disasters due to the inherent complexity in detecting the onset and predicting the end of a drought event [1,2]. Drought inevitably exhibits a recurrent salient feature in the changing climate probably due to the linkage of drought with certain climate patterns. Drought propagates through four main epochs. Firstly, drought originates as a meteorological drought characterized by below-normal precipitation over a period of one to three months. If the drought conditions persist such that the impact results in insufficient soil and subsoil water thereby affecting crop growth, then this epoch is called an agricultural drought. The third epoch referred to as hydrological drought ensues when the drought conditions manifest in terms of reduced water levels in water reservoirs [3,4]. Lastly, the socio-economic drought conditions manifest when the physical water shortage begins to affect human activities. Due to the complexity and severity of the impacts that drought has on various sectors, there is a need to monitor and forecast drought in order to avert future impacts as well as to derive mitigation and adaptation measures to minimize the impacts.
Drought indices are often used to monitor, predict and assess the severity of drought in a region. Such indices are developed based on climate variables such as precipitation, temperature, evapotranspiration, runoff and vegetation conditions. The Standardized Precipitation Index (SPI) developed by McKee et al. [5] is one of the indices commonly used for drought monitoring and assessment. Other drought indices include the Standardized Precipitation Evapotranspiration Index (SPEI) [6], Palmer Drought Severity Index (PDSI) [7], Vegetation Condition Index (VCI) [8], Effective Drought Index (EDI) [9], Multivariate Standardized Drought Index (MSDI) [10] and many others. Each of these indices has its own advantages and disadvantages; see studies by Keyantash and Dracup [11], Mishra and Singh [12], Sivakumar et al. [13] and references therein. The selection of drought indices is therefore dependent on the nature of the drought index, local conditions, and data requirements.
The SPI, particularly, is a precipitation-based tool developed primarily for drought analysis and monitoring [5]. This drought index has a multiscalar phenomenon and allows researchers to determine and categorize the various types of drought at a timescale of interest (e.g., 1-, 3-, 6-, 9-, 12-, 24-month) [5,14]. The SPI has been well tested and recommended as a key drought indicator by the World Meteorological Organization [6,14,15]. Although the SPI does not consider the effects of temperature, evapotranspiration, and other climate variables it is still considered the best indicator for drought analysis and monitoring purposes. This is due to the fact that precipitation is known to be the main variable in determining characteristics of drought (e.g., onset, duration, intensity, frequency) [16,17].
The Western Cape Province is at present (2014 to 2017 hydrological years) experiencing the worst water shortage in 113 years. As shown in Figure 1, the current storage water levels from the major dams in the province are reportedly at 22.8%, which translates to effectively 12.3% of the usable dam water. This crisis has triggered the government to impose intensified water restrictions to its consumers, while exploring strategies to avert the taps from completely running dry. Currently, the Western Cape Province has been declared a disaster region, with the impacts being exacerbated by the effects of droughts, coupled with other climatic factors. In particular, the Western Cape is experiencing the worst drought since 1904, with the west coast and the central Karoo already declared agricultural drought disaster areas.
In this contribution, SPIs are used to analyze the drought conditions in the Western Cape Province, based on observed rainfall time series from 23 rain-gauge stations distributed within the province. The research study aims to determine and understand the extent of historical drought that has significantly affected water resources in the province. In particular, the study intends to assess the historical drought in terms of its duration, frequency, intensity and severity. The results can contribute towards planning, preparedness and innovation, thereby enhancing the province’s adaptation capacity to water resources supply and demand.

2. Study Area

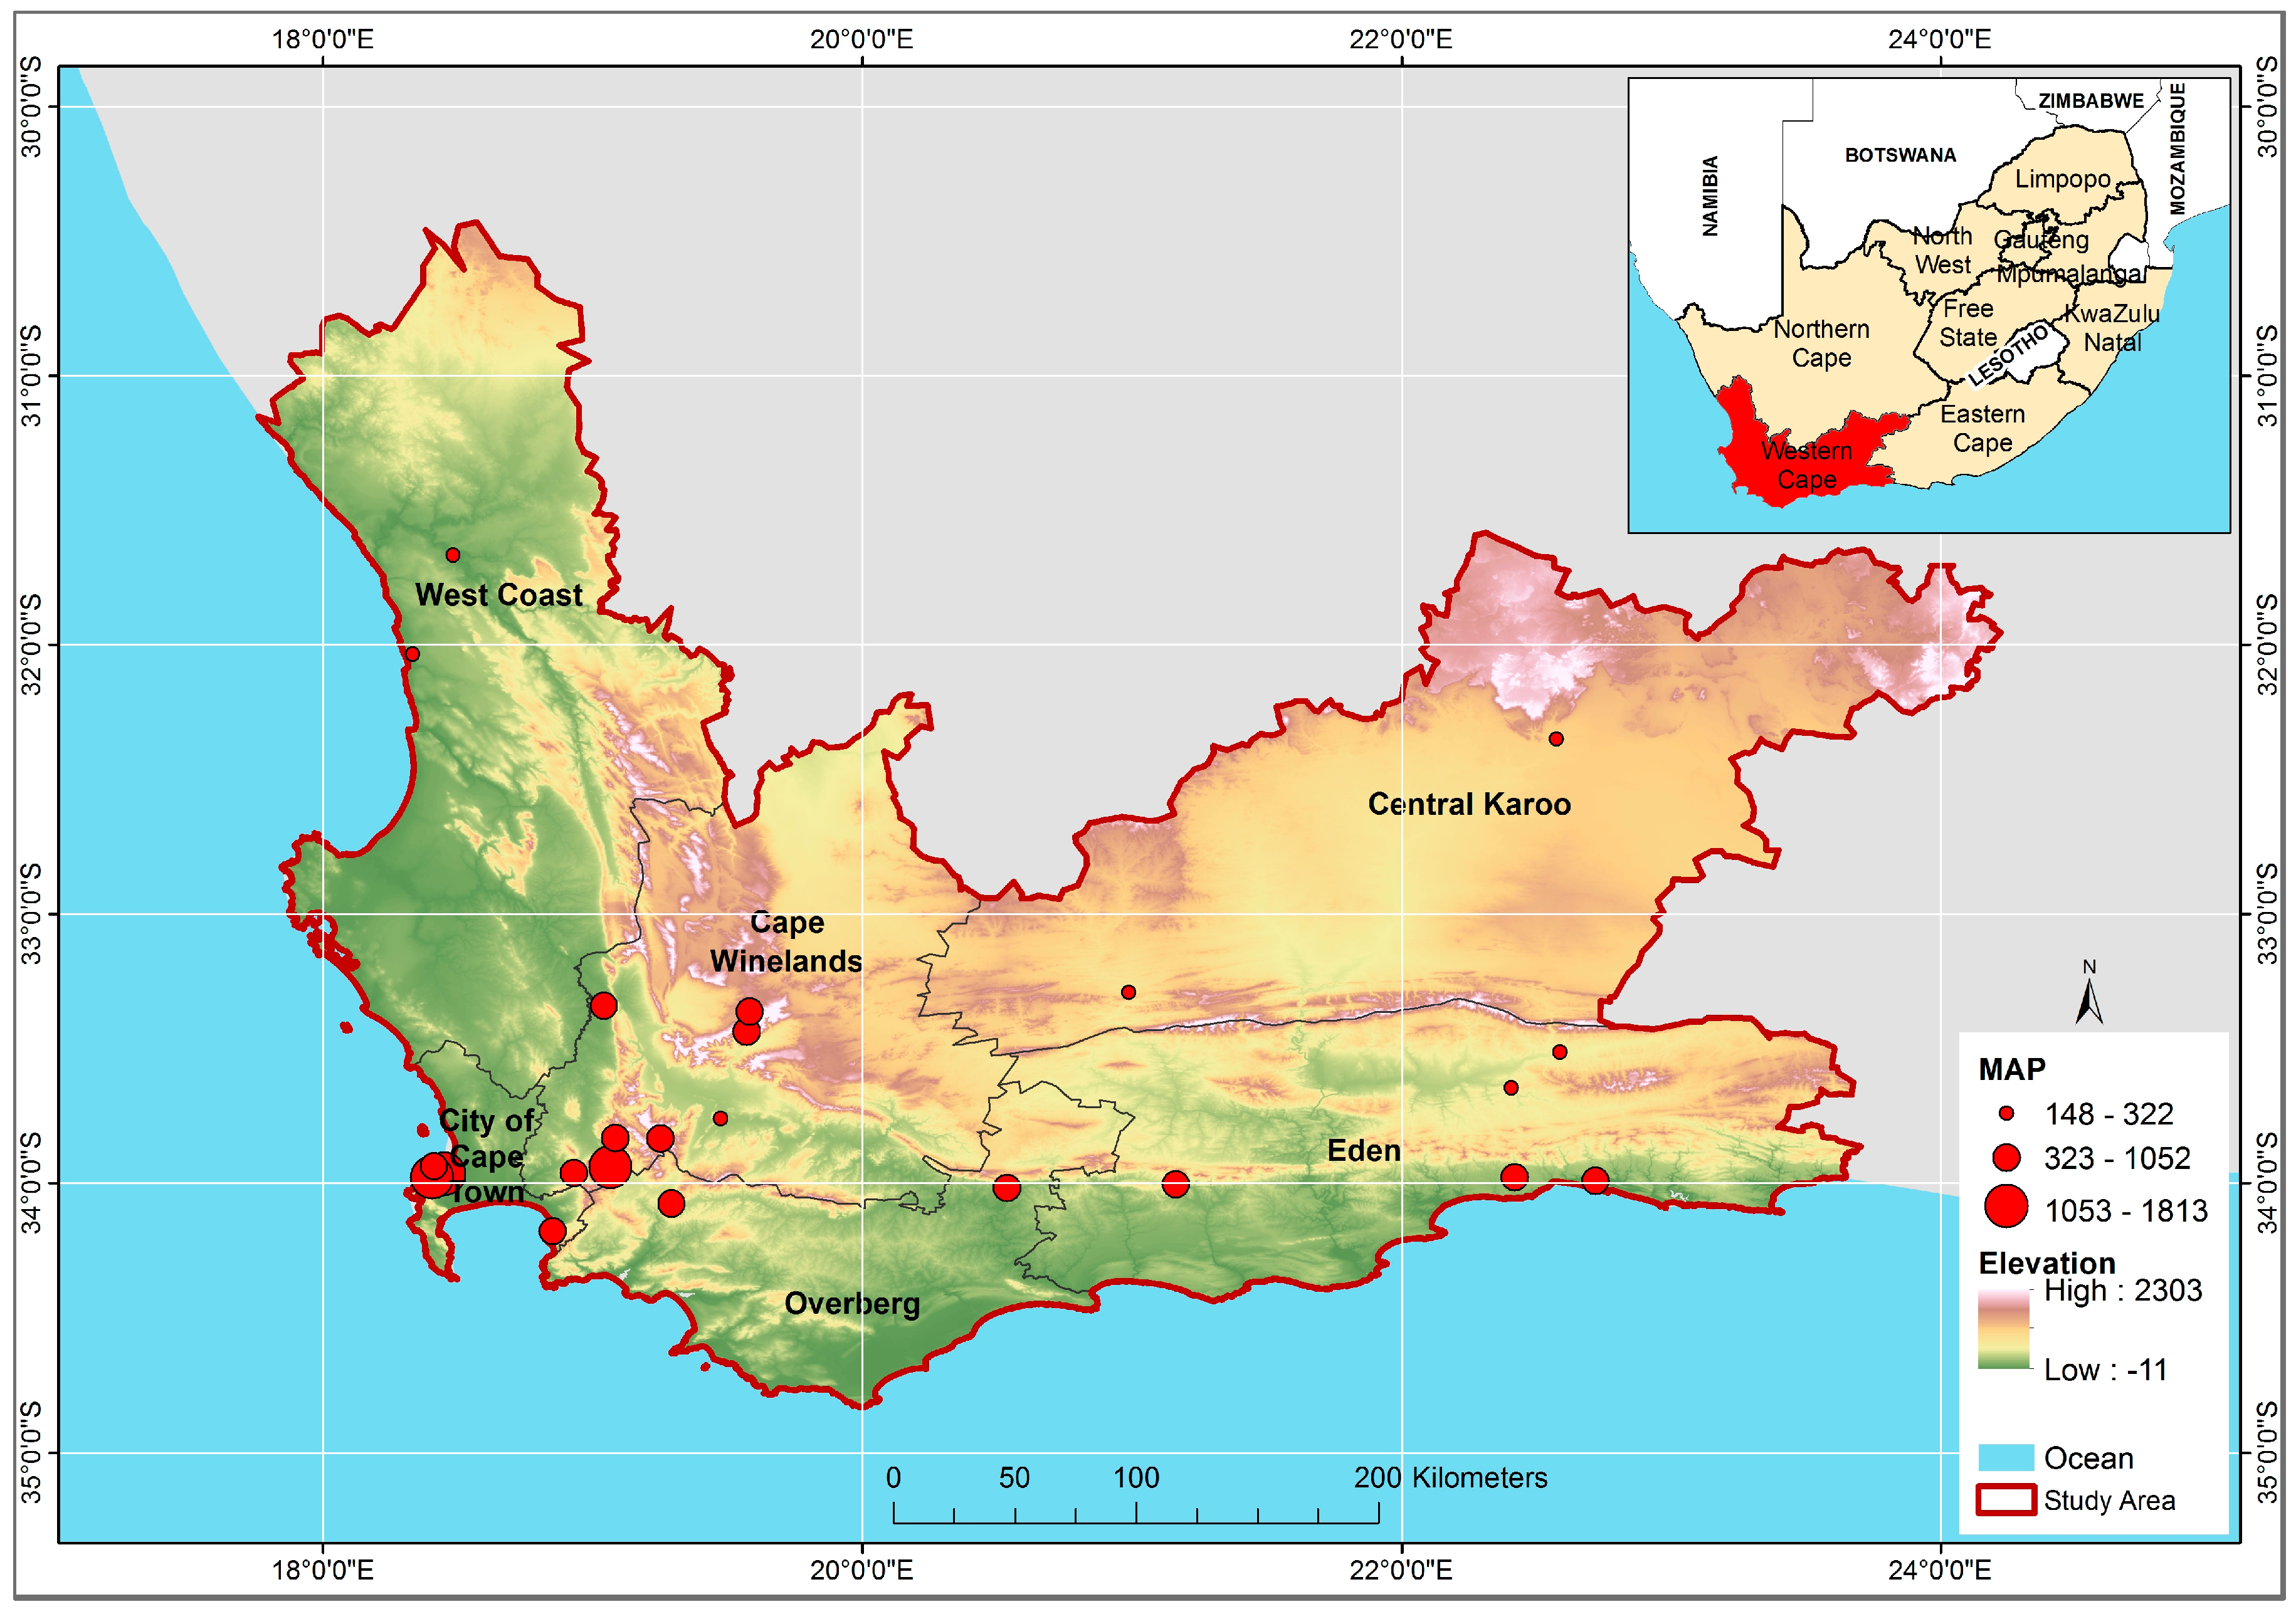
The Western Cape, depicted in Figure 2, is the 4th largest of the nine provinces of South Africa, situated on the south-western tip of the country. The province borders the Northern Cape and the Eastern Cape provinces in the north and east, respectively as well as the Atlantic Ocean on the west and the Indian Ocean in the south. Its economy is dominated by manufacturing that accounts for 13% of the provincial economy, followed by construction and agriculture at 5% and 4% respectively, and mining just under 0.5%. The major geological associations found in the Western Cape are: Adelaide Subgroup, Ecca Group, Cape Supergroup, Malmesbury Group, Vanrhynsdorp Group, Namaqua Metamorphic Complex, Enon Malmebury Group and various coastal Deposits. The substrates of the Malmebury Group provide the province’s dominant and suitable soils for agriculture. The Western Cape has a warm temperate Mediterranean climate along the coast with hot dry summers and cold winters, often below freezing inland. The average temperature in summer ranges from 15 °C to 27 °C, whereas in winter the average temperature is between 5 °C and 22 °C. Precipitation in the Western Cape varies across the province. In particular, the Western Cape is characterized by three dominant rainfall zones, viz: the winter, late summer and constant rainfall regimes. The Peninsula and Boland areas are characterized by winter-rainfall with sunny and dry summers. Regions towards the south-coast are influenced by all year-round rainfall while the Great Karoo is characterized by summer rainfall. The annual precipitation in the province varies from ~300 mm to more than 900 mm. However, some areas in the Western Cape Province receive extreme rainfall i.e., as low as 60 mm and as high as 3345 mm [18].

3. Data and Method

3.1. Data

The precipitation data analyzed in the present study were collected from 23 weather stations distributed across the Western Cape Province, see Figure 2 for the distribution of the stations. The analyzed data spanned 1985–2016 and were provided by the Department of Water and Sanitation (DWS). Selection of the stations was based on a continuous length of records, less than 5% of missing data per station and the distribution of the stations to fairly cover the province. Characteristics of the selected stations are summarized in Figure 2. Rainfall total amount varies across the province, with the lowest Mean Annual Precipitation (MAP) (e.g., 148 mm) recorded by the Vredendal weather station and the highest (1813 mm) recorded by the Assegaaibos weather station.

3.2. Methodology

In order to characterize the historical droughts in the present study, 3-, 6- and 12-month SPI indices were calculated from pre-processed monthly precipitation data using SPI R package, which is based on the methodology presented in McKee et al. [8] and Edwards and McKee [19]. In this method, a gamma distribution function is used to fit monthly precipitation time series for individual weather stations and the corresponding gamma distribution parameters (i.e., alpha and beta) for each station for the 3-, 6- and 12-month accumulation time scales are estimated. The resulting gamma parameters are then used to find the cumulative probability of an observed precipitation event which is then transformed into a normal distribution with mean zero and variance of one (Edwards and McKee [19]). The resulting SPI is either positive, indicating wetter conditions or negative, indicating drier conditions. For Drought Monitoring Indicators (DMIs) analysis, the SPI time series corresponding to the hydrological year (October to September months) were then used as summarized in the following algorithm:
(a) For each station, a Drought Time series (hereafter DTs) was derived based on the selecting only dry months.
(b) The DTs derived in (a) were used to compute the DMIs i.e., Drought Duration (DD), Drought Severity (DS), Drought Intensity (DI) and Drought Frequency (DF). The DS and DI were calculated based on the following equations described in Tan et al. [20],
D S e = | j = 1 m I n d e x j | e
D I e = S e m
In Equation (1), the subscript e corresponds to a drought event while j represents a drought month. In addition, Indexj is the SPI value in month j while m is the duration of a drought event (e). The DF was calculated based on Equation (3).
D F s = n s N s × 100 %
where ns equals the number of drought events, Ns is the total number of years for the study period and s is a station.
(c) Further, the DTs and DMIs were used to compute the trends. In particular, two methods were used to compute the trends of DTs and DMIs. The first method was based on pre-whitening (hereinafter referred to as the “z” method) linear trend analysis procedure proposed by Zhang et al. [21]. This method assumes that both DTs and DEIs series are composed of a long-term trend component and a white noise residual component, thus enabling incorporation of a statistical regression model with serially correlated residuals described by Equation (4).
Y t = μ + T t + v t
where Yt is a climate variable at time t, µ is the constant term, Tt is the trend and vt is the noise at time t. Equation (4) can be simplified by assuming a linear trend, that is,
Y t = β t
where β represents the slope of the linear region between the climate variable and time. On the other hand, the noise may be expressed as per Equation (6)
v t = r = 1 p r v t r + ε t
where r are the parameters of the autoregressive process, p is the order of the auto-regression and { ε t } is white noise, so that Equation (4) can be re-written as
Y t = μ + β t + r Y t 1 + ε t
whereby lag-one autocorrelation, AR(1) was utilized. The second method used was based on trend-free pre-whitened trend analysis (hereinafter referred to as the “y” method) described in Yue et al. [22]. This method assumes that, a hydrological time series can be represented by a linear trend given by
T t = b t
and an AR(1) component with noise. In Equation (8), b represents the slope of each combined series and it is estimated using Theil-Sen Approach (TSA) proposed by Thei [23], Thei [24], Thei [25] and [26]. Assuming that the slope is not zero, then linearity is assumed whereby the DTs and DEIs are de-trended by using Equation (9).
X t = X t T t = X t b t
The trend-free pre-whitening procedure is achieved by de-trending the series X t using lag-1 serial correlation coefficient r 1 and then removing the AR(1) from the series, as per Equation (10),
Y t = X t r 1 X t 1
The residual series after applying the trend-free pre-whitening procedure results in an independent series. The identified trend Tt and the residual Y t are blended by
Y t = Y t + T t
The MK test was then applied to the blended series Y t to assess the significance of the DTs and DMIs time series.

4. Results

4.1. Seasonal Trends in Precipitation

Precipitation in the Western Cape Province exhibits noticeable spatial-temporal dependence. Most of the regions in the province receive rain during winter, whereas very few areas are known to be receiving rainfall throughout the year. Table 1 gives a summary of seasonal trends in precipitation as well as the significance of the trends across the selected stations. During summer (DJF), more than 16 weather stations exhibit negative trends, with only two stations showing statistically significant trends, these are indicated in bold face in the table. The rest of the stations depict a positive statistically insignificant trend. Similarly, 19 stations show a negative trend during MAM, with only one station exhibiting trends that are statistically significant at 0.05 significant level. In winter, 12 weather stations show a positive trend whereas 11 of the stations exhibit negative trends. The sudden increase in positive trends on most of the stations can be attributed to the winter rains received in most areas of the province. During SON, 13 stations show a negative trend, while 10 stations depict positive trend. The trends across all the stations are statistically insignificant at 0.05 significant level.

4.2. Annual Trends in Precipitation

Figure 3 presents results for annual precipitation trends across the Western Cape Province. Based on the reported results, vast majority of the stations (16 stations) show a decreasing trend (negative trend). The Table Mountain at Newlands and Assegaaibos stations exhibit the least negative trends, with −18.94 mm/year and −16.51 mm/year, respectively, followed by the Jonkershoek trend with −0.73 mm/year. Furthermore, seven stations exhibit positive trends in annual precipitation. The results indicate that the calculated trends in precipitation time series are statistically insignificant across all but one weather stations (the yellow bar). Only the Table Mountain at Newlands exhibits statistically significant trend at 0.05 significant level. Overall, the annual trend analysis indicates a precipitation change that leads to persistent drier conditions in the Western Cape. These results are in-line with the continued drought conditions that have affected the overall water resources in the province.

4.3. Analysis of SPI Time Series

This section examines the temporal variability of the observed droughts based on the calculated SPI values. Results for the average time series of the SPI calculated from 3-, 6- and 12-month are depicted in Figure 4. According to McKee et al. [5] classification of droughts, drought events are defined whenever the SPI values are less than −1, and the more the negative SPI the more severe the drought. Adopting McKee et al. [5] SPI classification criteria, the calculated SPI values in this study depict mild drought conditions in the Western Cape Province over the study period, particularly at seasonal (3-month accumulation period) time-scale. Similarly, the SPI-6 averaged values indicate that the Western Cape Province experienced mild inter-annual drought variability over the study period. The averaged SPI-12 values range between −0.1 to −0.7 for the dry episodes and 0.01 to 1.2 for the wet episodes. The calculated SPI-12 values suggest that the Western Cape Province experienced a mild annual drought variability during 1985–2016 study period. Additionally, Figure 4 shows that between 1985 and 2016, the SPI values depict increasing amplitudes of variability in all the three accumulation periods used in the present study. This pattern of variability suggests that the Western Cape Province experienced increasingly irregular and more intense drought conditions in the past three decades. Overall, the SPI values calculated across the selected time-scales depict seasonal to annual drought variability. In addition, analysis of SPI values across all the three time-scales indicate that continuous mild drought events occurred in the years 1987–1988, 1993–1994, 1997–2000, 2002–2003 (only on 3- and 6-month time-scales), 2008–2011 (3- and 6-month time-scales), 2009–2011 (only 12-month time-scale) and 2014–2015 (across all the time-scales). The longest drought lasted for 4 years, between 1997 and 2000 across all the time-scales and between 2008 and 2011 at seasonal and inter-annual time-scales.

4.4. Statistical Characteristics of SPI

The summary of statistical parameters (e.g., the variance: Var., skewness: Skew. and kurtosis: Kurt) of SPI across the three selected time-scales is given in Table 2. The variance of SPI values across the stations was calculated to determine the variability of drought within the study region. The results indicate a clear pattern in the variance of the SPIs. In this regard, the variances of the SPI-3 across the 23 stations range from a minimum of 0.2 and highest variance peak at 0.5. For SPI-6, the variance varies across the stations with values ranging between 0.3 and 0.7. The annual SPI-12 depict a variance of three times larger compared to the variance in the SPI-3 values. This annual averaged SPI values depict a slightly different pattern compared to the monthly values wherein the SPI-12 show a smoother pattern compared to e.g., SPI-3. This could be attributed to the inherent extreme SPI values in the three accumulation periods. The analysis of the skewness and kurtosis across the analyzed SPI time-scales illustrate that the SPI has inherent low degree of dispersion. In this study, the coefficient of skewness is used to characterize the nature of the asymmetry around the mean. Results show that the values of the skewness lie between −1.0 and 1.0. The skewness for SPI-3, SPI-6 and SPI-12 is asymmetric towards the left (negative skewness coefficient) in most of the selected weather stations. In particular, skewness for SPI-3 values calculated from 12 stations depicts asymmetric distribution towards the left while the remaining 11 stations exhibit positive skewness. Similarly, skewness coefficient for SPI-6 and SPI-12 derived from 14 stations depict asymmetrical pattern distributed towards the left while the rest (9 stations) exhibit asymmetric positive distribution. In terms of kurtosis, the SPI values depict largely a leptokurtic distribution in 16 weather stations and platykurtic in seven stations on seasonal time-scale. SPI-6 values depict relatively peaked distribution in 13 stations and platykurtic distribution in 10 stations. For SPI-12 values, the distribution of drought is leptokurtic in 14 weather stations and platykurtic in 9 stations. Overall, the kurtosis statistics obtained in the present study suggests that the temporal distribution of rainfall in the Western Cape Province of South Africa exhibits a leptokurtic distribution, a phenomenon that is common in semi-arid regions (see for example studies by Mzezewa et al. [27]).

4.5. Trends in Drought Monitoring Indicators Characteristics

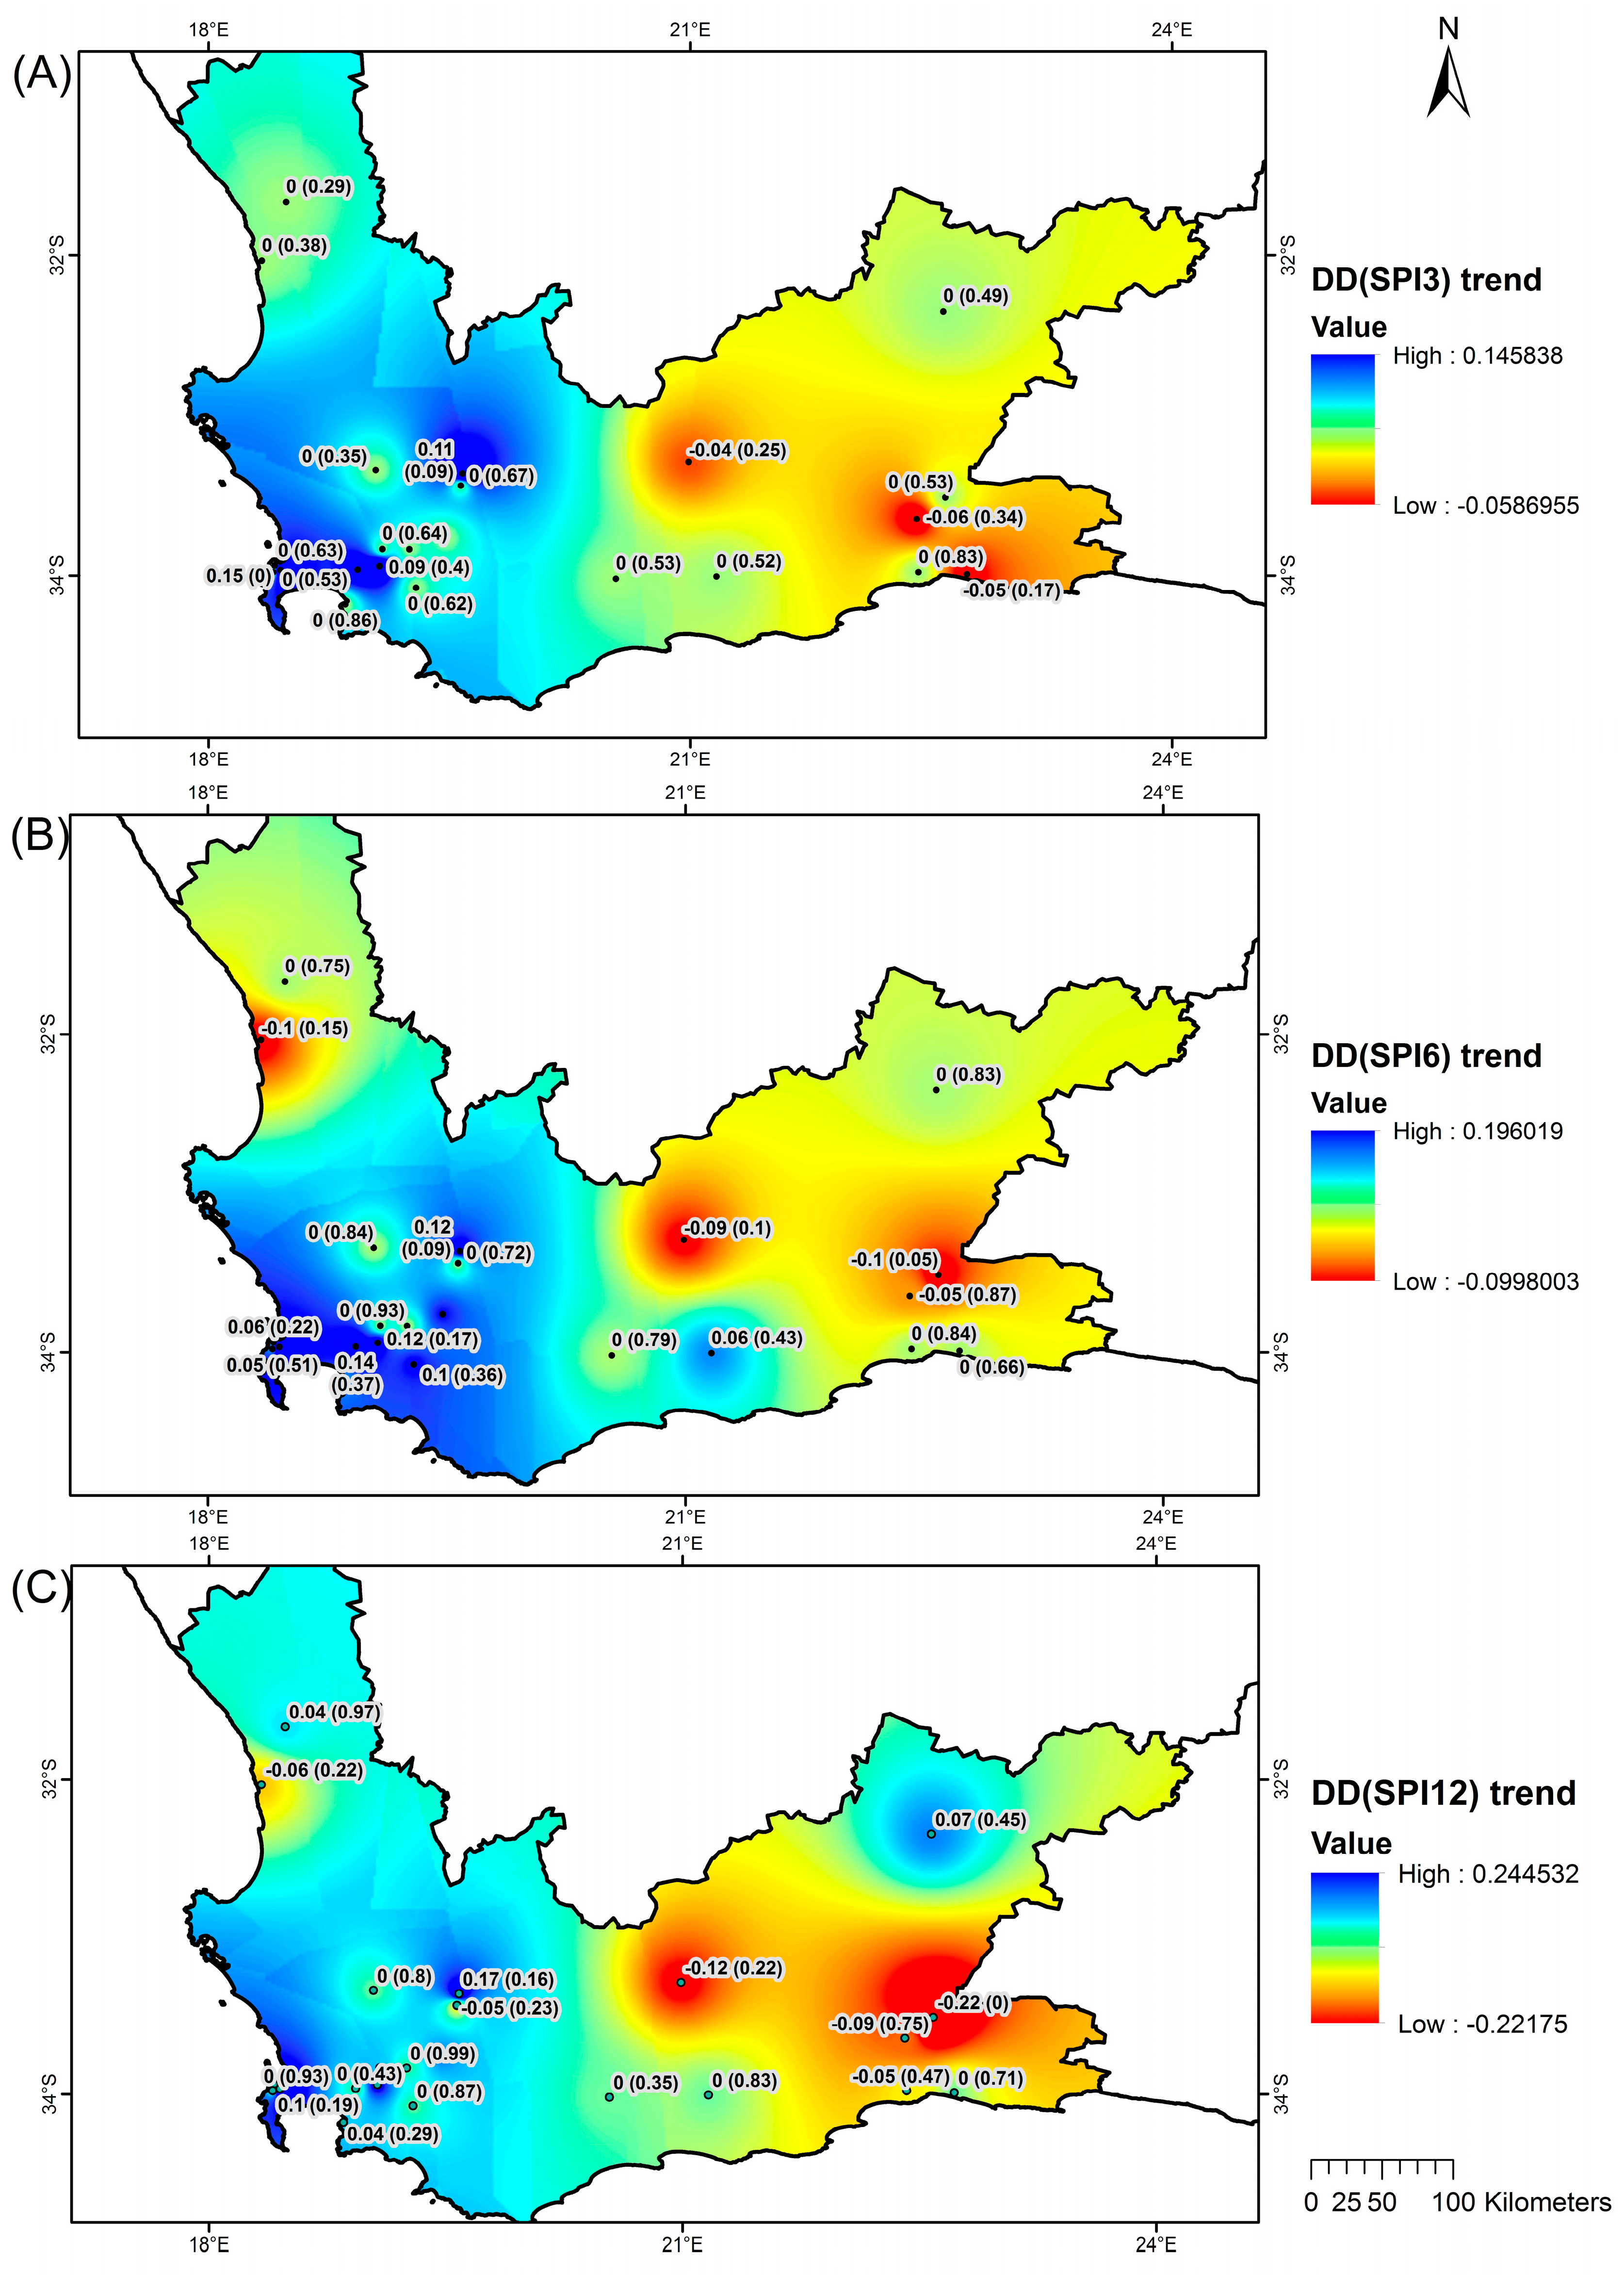
This study analyzed trends and their significance (at <0.05 significance level) using various drought characteristics including drought duration, frequency, intensity and severity. Figure 5 depicts the interpolated surface trends and significance trends in drought duration at the selected weather stations. As depicted in the figure, Figure 5A–C corresponds to the SPI-3, SPI-6 and SPI-12 trends, respectively. Trends calculated using SPI-3 time series illustrate that the drought duration exhibits positive weak trends in most parts of the study area. In particular, weak positive trends occur towards the eastern part of the province, covering Breede-Gouritz Water Management Area, whereas the trends slightly increase towards the western part of the province. Negative trends (this cover <20% of the province) occur towards the west, covering the lower Berg-Olifants Water Management Area. In contrast, SPI-6 and SPI-12 results depict negative trends in the interior regions and towards the eastern-lower regions of the province, whereas positive trends are observed towards the western part of the province. SPI-3 trends exhibit statistically insignificant trends across the stations, whereas only one weather station depicts subtle (only pockets) significant trends in both SPI-6 and SPI-12 trends. In the last three decades, the Western Cape Province has experienced persistent droughts with absolute percent changes in trends ranging from 2% to 4% across the SPI-3, SPI-6 and SPI-12 accumulation periods.
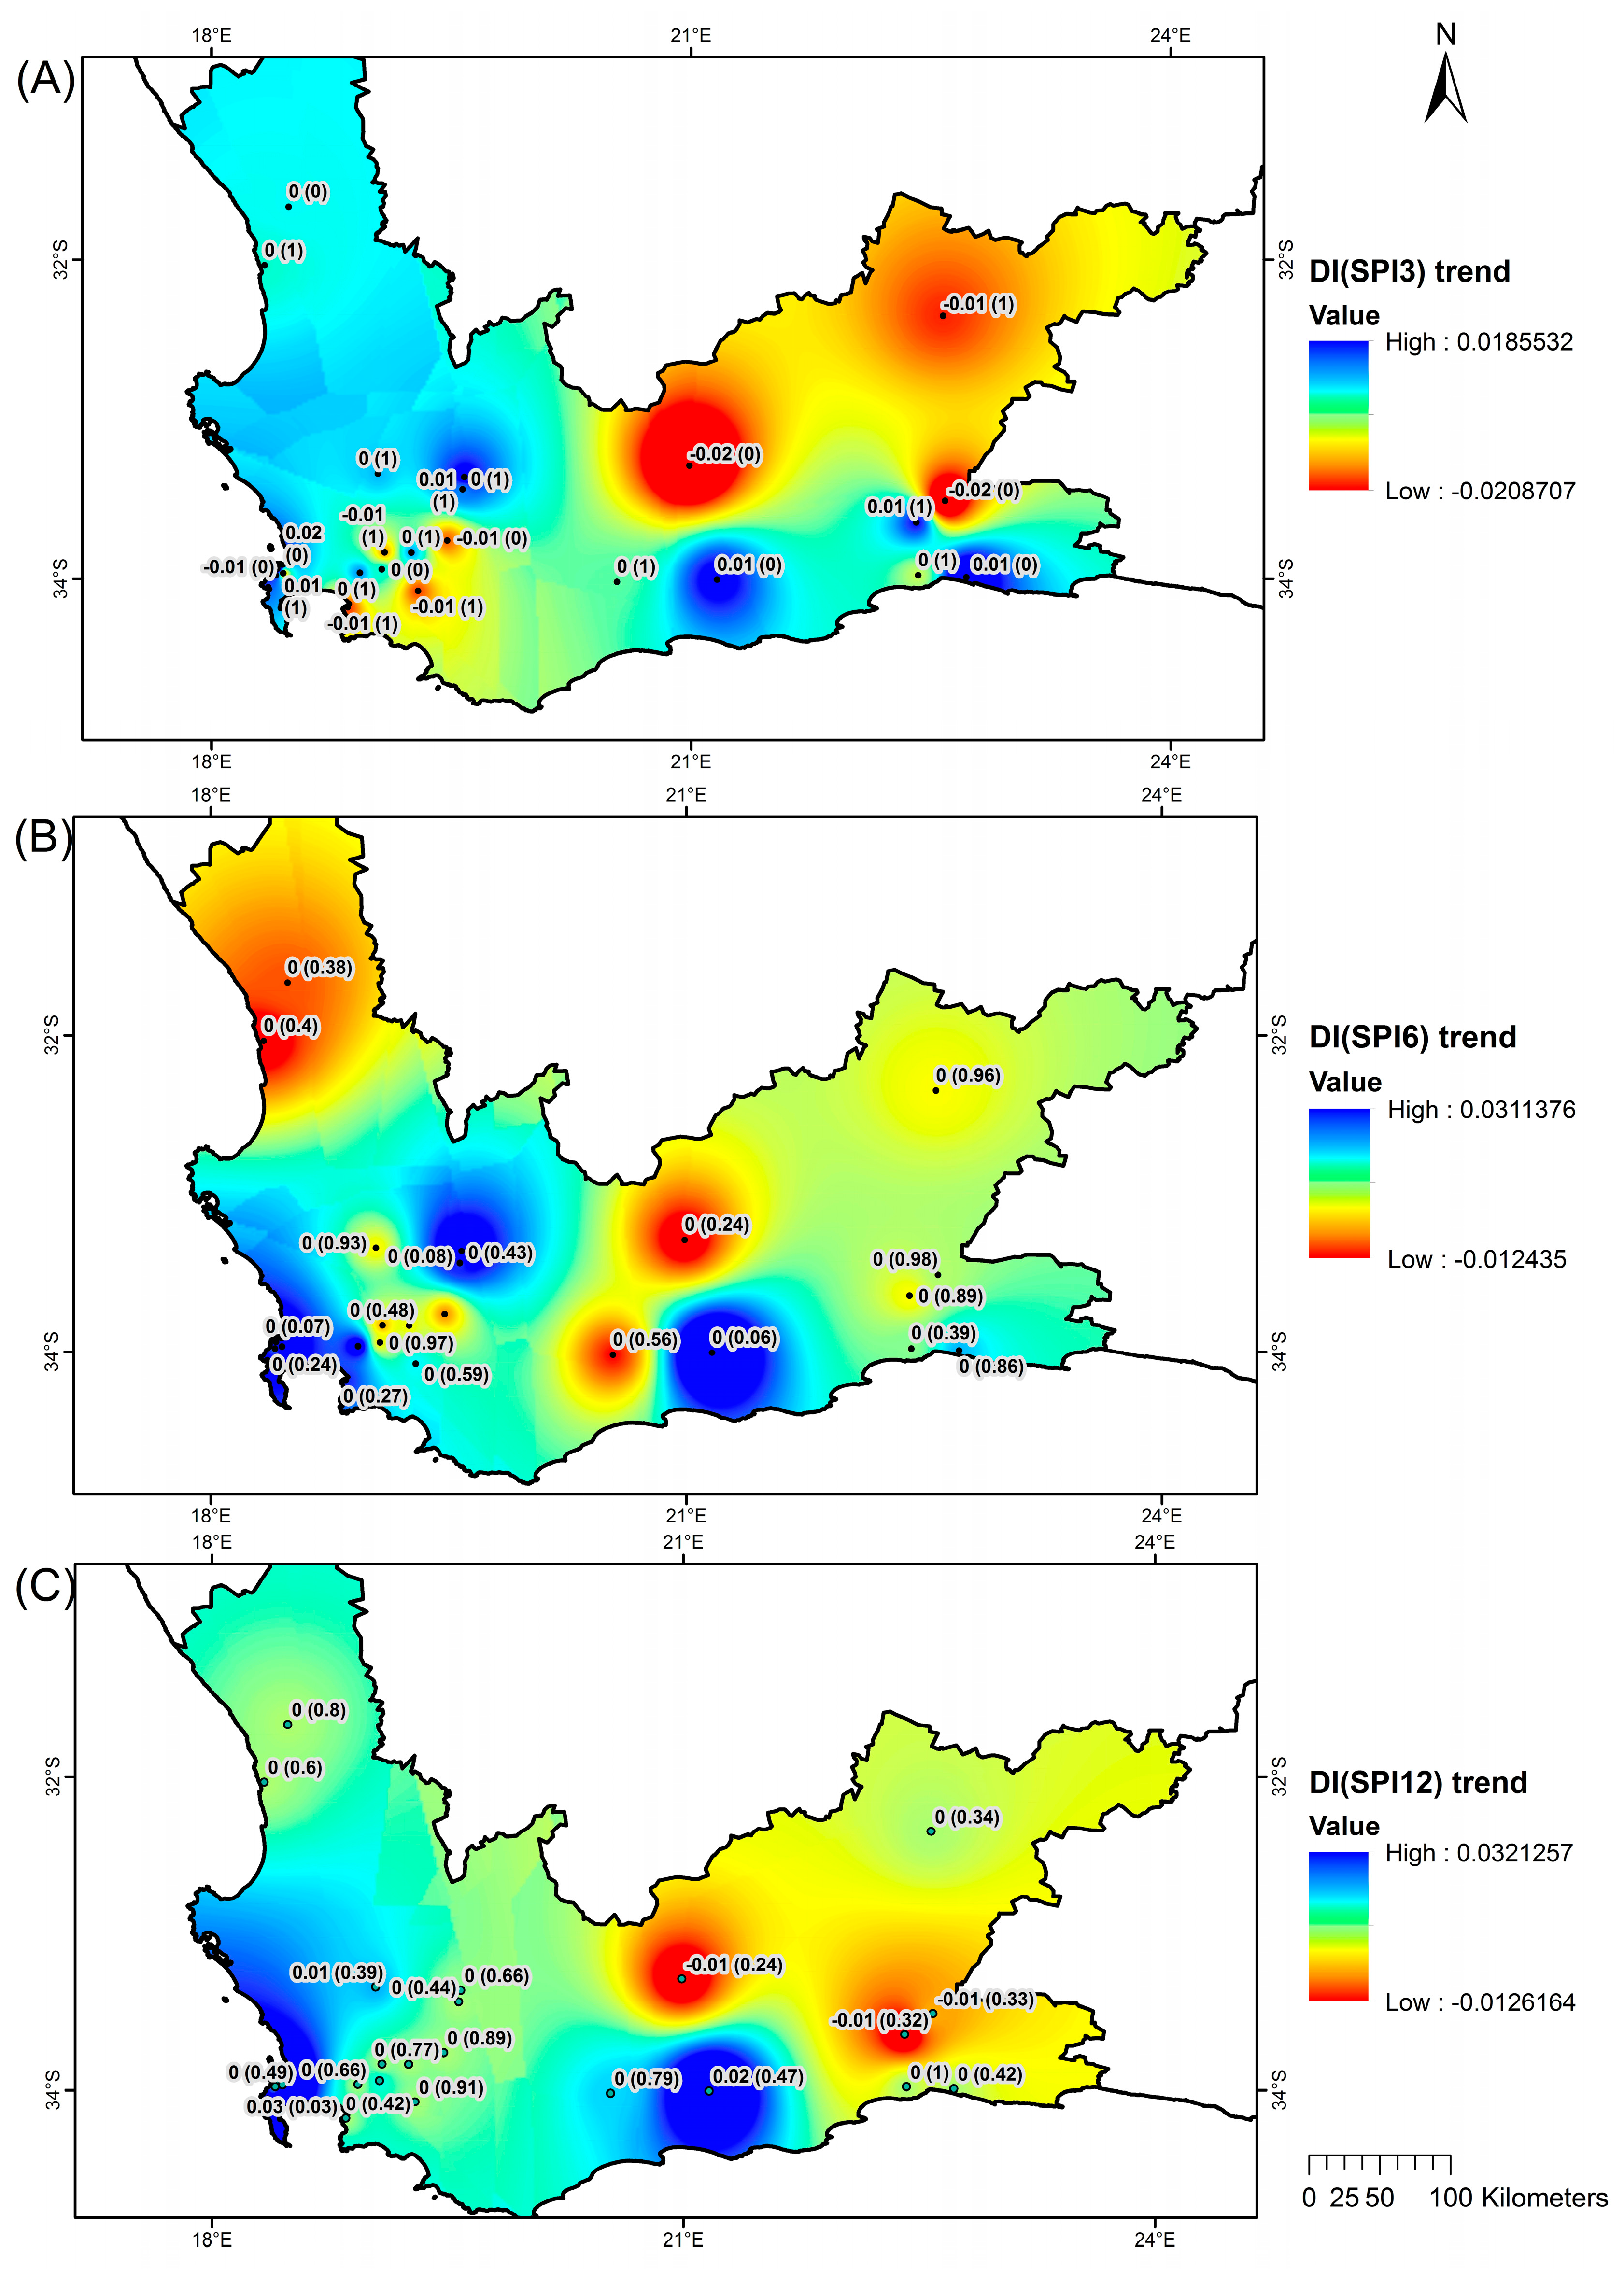
Figure 6 depicts trends and the associated significant trends in drought intensity across SPI-3, SPI-6 and SPI-12 accumulation time-scales. Trends in drought intensity derived using SPI-3 (A) depict a decreasing pattern in drought intensity, particularly around Breede-Gouritz Water Management Area, from the central area and towards the east upper region. On the other hand, parts of the lower east region as well as towards the west upper areas comprising of the Berg-Olfants Water Management Area exhibit zero to positive trends in drought intensity. In terms of the SPI-6 trends, Figure 6B depicts subtle positive and negative drought intensity trends across the Western Cape Province. Furthermore, trends calculated from SPI-12 time series (C) depict a similar pattern to those calculated using SPI-3 time series. In addition, the calculated trends are mostly statistically insignificant across the considered time-scales. In general, the Western Cape Province has experienced approximately 4% absolute changes in drought intensity over the last three decades.
Trends and significant trends in drought frequency are shown in Figure 7. Trends in drought frequency across the three time-sales delineate the study area into two regions. For instance, the interior areas and towards the eastern regions (mostly in the Berg-Olfants Water management Area) exhibit negative trends in drought frequency whereas positive trends are observed in the interior and towards the west regions of the Province, covering the Breede-Gouritz Water Management Area. In particular, the Berg-Olfants Water management Area has experienced ~8% positive changes in drought frequency while the Berg-Olfants Water management Area has experienced ~7% negative changes in drought frequency over the last three decades. In general, the Western Cape Province exhibit largely zero to statistically insignificant positive trends across SPI-3, SPI-6 and SPI-12 accumulation periods.
Figure 8 depicts results for trends and significant trends in drought severity across the three selected time-scales. Based on SPI-3 (A) and SPI-6 (B) time series, drought severity depicts statistically insignificant positive trends in some areas especially in the interior and western regions of the Western Cape Province. These areas include the Berg, Olfants/Doorn and Gamtoos rivers drainage regions of the Western Cape Province. The negative trends are mostly in the eastern interior regions i.e., across some regions of the Breede, and Gouritz drainage regions. For the SPI-12 time series, the trends delineate the Western Province into two regions i.e., western region exhibiting largely positive trends (but near zero) and the eastern region exhibiting largely negative trends. In most parts of the Western Cape Province, the trends are statistically insignificant across the SPI-3, SPI-6 and SPI-12 accumulation periods.

5. Implications of Drought Conditions to Agriculture and Water Resources in the Western Cape

Drought assessment and monitoring are essential for improved decisions on agriculture and water resources management and planning. In particular, the SPI index is a commonly used as a drought monitor to regions that are vulnerable to drought conditions. This study analyzed drought characteristics using SPI values derived from rainfall records from 23 weather stations data distributed within the Western Cape Province of South Africa. The motivation for investigating drought characteristics in the Western Cape Province is because there have been persistent drought conditions in the province since 2014. This drought conditions has severely affected various sectors including agriculture and water. The results reported in this contribution suggest that the Western Cape Province has been experiencing mild drought conditions from 1985 to 2016. In particular, drought conditions seem to exacerbate towards the southern Cape regions, covering the Central Karoo and Eden district municipalities. Since these regions are year-round rainfall areas, the results suggest that the area has been receiving insufficient rainfall throughout the year. Insufficient rainfall coupled with warm temperatures often exacerbates evapotranspiration, leading to crop stress and loss of water in the various water reservoirs. This is especially true given that the province’s average dam levels during the 2015/2016 hydrological year were below 30% (see Figure 1). Results also show that the Overberg, Cape Winelands and West Coast district municipalities experienced largely mild drought conditions. The vast majority of these regions are winter rainfall areas suggesting that the drought conditions spread to the winter months. Climatologically, the Western Cape is unique from other provinces in South Africa because this region is characterized by a Mediterranean climate. As a result, the rainfall patterns in the province enable a variety of crops including pome fruit (apples and pears), stone fruit (apricots, peaches & nectarines and plums), table grapes as well as viticulture. The persistence of droughts has therefore affected the production of these crops. Agriculture plays a significant role in the Western Cape economy and therefore the persistence of drought conditions will affect the region negatively. In particular, the agricultural sector is the main employer in the province. This sector also ensures that South Africa maintains its food security status thereby ensuring that the citizens have the necessary food that promotes a healthy prosperous life. Increase in drought conditions will therefore have a significant impact on the agricultural sector, leading to job loses, increase in food prices and other socio-economic impacts. In addition, a decrease in rainfall coupled with other extreme climatic factors (warm temperature, evapotranspiration), particularly, in Eden and Central Karoo areas will exacerbate drought conditions, leading to major decline in the usable water across the Western Cape Province water reservoirs.

6. Conclusions

The present study used two categories of drought indicators computed from precipitation data sets (1985–2016) from 23 weather stations across the Western Cape Province, South Africa. The first category was the SPI accumulated over 3-, 6- and 12-month time-scales. The second category consists of the four DMI, namely, DD, DS, DI and DF. Analysis of SPI-3, SPI-6 and SPI-12 illustrate that between 1985 and 2016, the Western Cape Province experienced recurrent mild meteorological, agricultural and hydrological drought conditions with inherent spatial-temporal variability. This suggests that the current drought conditions in the Western Cape Province is a manifestation of past drought conditions. The only difference between past and present drought conditions is that the Western Cape Province has now experienced the longest or persistence drought duration. Furthermore, analysis of trends in DMI time series depicts a noticeable spatial-temporal dependence wherein the southern and western parts of the province experienced more frequent, intense and severe droughts compared to the eastern regions of the Western Cape Province. Overall, the ongoing drought conditions in the Western Cape Province have adversely affected agricultural production while the water reservoirs are at a capacity of below 30% implying that the socio-economic impacts of these droughts will continue to reverberate for many months to come. This has led to the National Provincial and local governments and the private sector to hold multi-stakeholder meetings to discuss various options available for drought mitigation in the province and in South Africa in general. In general, results of the study postulate the following inferences:
(a)
Over the past three decades, the Western Cape Province has experienced persistent droughts with varying magnitudes and pattern of occurrences.
(b)
The ongoing drought conditions over the Western Cape Province appears to be a regular part of nature’s cycle. Notwithstanding drought conditions of the 21st century, the province has continuously experienced recurrent drought patterns dating as far back as the 20th Century.
(c)
Analysis of historical drought characteristics based on drought indicators is an important first step towards: (i) placing the current drought conditions into perspective, (ii) contributing towards triggering action and responses on drought preparedness, and (iii) laying the foundation for drought monitoring and development of early warning systems.

Acknowledgments

This work was funded by the Water Research Commission, South Africa (WRC) project (no. K5/2309). The authors wish to thank the anonymous reviewers for their constructive and detailed comments that assisted to improve the quality of the manuscript.

Author Contributions

Christina M. Botai conceptualized, drafted and finalized the manuscript. Joel O. Botai conceptualized, undertook the data analysis and edited the manuscript. Jaco P. de Wit collected and formatted the required meteorological data. Katlego P. Ncongwane and Abiodun M. Adeola revised and edited the manuscript. All authors have read and approved the final manuscript.

Conflicts of Interest

The authors declare that there is not conflict of interest.

References

  1. Sonmez, F.K.; Komuscu, A.U.; Erkan, A.; Turgu, E. An analysis of spatial and temporal dimension of drought vulnerability in Turkey using the standardized precipitation index. Nat. Hazards 2005, 35, 243–264. [Google Scholar] [CrossRef]
  2. Vicente-Serrano, S.M.; Begueria, S.; Lopez-Moreno, J.I. Comment on “characteristics and trends in various forms of the Palmer Drought Severity Index (PDSI) during 1900–2008” by Aiguo Dai. J. Geophys. Res. 2011. [Google Scholar] [CrossRef]
  3. Wilhite, D.A. (Ed.) Drought: A Global Assessment; Routledge: London, UK, 2000. [Google Scholar]
  4. Tallaksen, L.M.; Van Lanen, A.A.J. Hydrological Drought: Processes and Estimation Methods for Streamflow and Groundwater; Tallaksen, L.M., van Lanen, H.A.J., Eds.; Developments in Water Science, 48, Elsevier Science B.V.: Amsterdam, The Netherlands, 2004; pp. 199–271. [Google Scholar]
  5. McKee, T.B.; Doesken, N.J.; Kleist, J. The relationship of drought frequency and duration to time scales. In Proceedings of the 8th Conference on Applied Climatology, Anaheim, CA, USA, 17–22 January 1993; pp. 179–184. [Google Scholar]
  6. Vicente-Serrano, S.M.; Beguería, S.; López-Moreno, J.I. A multiscalar drought index sensitive to global warming: The standardized precipitation evapotranspiration index. J. Clim. 2010, 23, 1696–1718. [Google Scholar] [CrossRef]
  7. Palmer, W.C. Meteorological Drought; Weather Bureau Research Paper No. 45; Department of Commerce: Washington, DC, USA, 1965; p. 58.
  8. Kogan, F.N. Droughts of the late 1980s in the United States as derived from NOAA polar-orbiting satellite data. Am. Meteorol. Soc. 1995, 76, 655–668. [Google Scholar] [CrossRef]
  9. Byun, H.R.; Wilhite, D.A. Daily quantification of drought severity and duration. J. Clim. 1996, 5, 1181–1201. [Google Scholar]
  10. Hao, Z.C.; AghaKouchak, A. Multivariate Standardized Drought Index: A parametric multi-index model. Adv. Water Resour. 2013, 57, 12–18. [Google Scholar] [CrossRef]
  11. Keyantash, J.; Dracup, J. The quantification of drought: An evaluation of drought indices. Bull. Am. Meteorol. Soc. 2002, 83, 1167–1180. [Google Scholar]
  12. Mishra, A.K.; Singh, V.P. A review of drought concepts. J. Hydrol. 2010, 391, 202–216. [Google Scholar] [CrossRef]
  13. Sivakumar, M.V.K.; Motha, R.P.; Wilhite, D.A.; Wood, D.A. Agricultural Drought Indices: Proceedings of an Expert Meeting, Proceedings of the WMO/UNISDR Expert Meeting on Agricultural Drought Indices, Geneva, Switzerland, 2–4 June 2010; AGM-11, WMO/TD No. 1572; WAOB-2011; World Meteorological Organization: Murcia, Spain, 2011; p. 219. [Google Scholar]
  14. Chen, T.; van der Werf, G.R.; de Jeu, R.A.M.; Wang, G.; Dolman, A.J. A global analysis of the impact of drought on net primary productivity. Hydrol. Earth Syst. Sci. 2013, 17, 3885–3894. [Google Scholar] [CrossRef]
  15. World Meteorological Organization (WMO). Drought Monitoring and Early Warning: Concepts, Progress and Future Challenges; WMO-No. 1006; World Meteorological Organization: Geneva, Switzerland, 2006. [Google Scholar]
  16. Chang, T.J.; Cleopa, X.A. A proposed method of drought monitoring. Water Resour. 1991, 27, 275–281. [Google Scholar] [CrossRef]
  17. Heim, R.R. A review of twentieth-century drought indices used in the United States. Bull. Am. Meteorol. Soc. 2002, 83, 1149–1165. [Google Scholar]
  18. Gasson, B. The Biophysical Environment of the Western Cape Province in Relation to Its Economy and Settlements; School of Architecture and Planning, University of Cape Town for the Department of Local Government and Housing (Directorate of Development Promotion) of the Province of the Western Cape: Cape Town, South Africa, 1998. [Google Scholar]
  19. Edwards, D.C.; McKee, T.B. Characteristics of 20th Century Drought in the United States at Multiple Time Scales; Climatology Report 97-2; Department of Atmospheric Science, Colorado State University: Fort Collins, CO, USA, 1997. [Google Scholar]
  20. Tan, C.; Yang, J.; Li, M. Temporal-spatial variation of drought indicated by SPI and SPEI in Ningxia Hui Autonomous region, China. Amosphere 2015, 6, 1399–1421. [Google Scholar] [CrossRef]
  21. Zhang, X.; Vicent, L.A.; Hogg, W.D.; Niitsoo, A. Temperature and precipitation trends in Canada during the 20th Century. Atmos. Ocean 2000, 38, 395–429. [Google Scholar] [CrossRef]
  22. Yue, S.; Wang, C.Y. Regional streamflow trend detection with consideration of both temporal and spatial correction. Int. J. Clim. 2002, 22, 933–946. [Google Scholar] [CrossRef]
  23. Theil, H. A Rank-Invariant Method of Linear and Polynomial Regression Analysis, I; Springer: Dordrecht, The Netherlands, 1950; Volume 53, pp. 386–392. [Google Scholar]
  24. Thei, H. A Rank-Invariant Method of Linear and Polynomial Regression Analysis, II; Springer: Dordrecht, The Netherlands, 1950; Volume 53, pp. 521–525. [Google Scholar]
  25. Thei, H. A Rank-Invariant Method of Linear and Polynomial Regression Analysis, III; Springer: Dordrecht, The Netherlands, 1950; Volume 53, pp. 1397–1452. [Google Scholar]
  26. Sen, P.K. Estimates of the regression coefficient based on Kendall’s tau. J. Am Statist. Assoc. 1968, 63, 1379–1389. [Google Scholar] [CrossRef]
  27. Mzezewa, J.; Misi, T.; van Rensburg, L.D. Characteristics of rainfall at a semi-arid ecotope in the Limpopo Province (South Africa) and its implications for sustainable crop production. Water SA 2010, 36, 19–26. [Google Scholar] [CrossRef]
Figure 1. Water levels in major dams in the Western Cape Province.
Water 09 00876 g001
Figure 2. Map of the study area and distribution of selected weather stations (indicated in red circles). Radiuses of the depicted circle sizes are relative to the Mean Annual Precipitation (MAP) recorded at the stations.
Water 09 00876 g002
Figure 3. Precipitation trends [units: mm-year−1] across the selected weather stations. The yellow bar indicates weather station exhibiting statistically significant trends.
Water 09 00876 g003
Figure 4. Annual average SPI time series at different time scales.
Water 09 00876 g004
Figure 5. Trends and significant trends in drought duration derived from (A) SPI-3, (B) SPI-6 and (C) SPI-12 values.
Water 09 00876 g005
Figure 6. Same as Figure 5 but in drought intensity, with (AC) corresponding to SPI-3, SPI-6 and SPI-12, respectively.
Water 09 00876 g006
Figure 7. Same as Figure 5 but in drought frequency, with (AC) corresponding to SPI-3, SPI-6 and SPI-12, respectively.
Water 09 00876 g007
Figure 8. Same as Figure 5 but in drought severity, with (AC) corresponding to SPI-3, SPI-6 and SPI-12, respectively.
Water 09 00876 g008
Table 1. Seasonal precipitation trends [mm-month−1] and their significance.
Station NameDJF Trends (Sig.)MAM Trends (Sig.)JJA Trends (Sig.)SON Trends (Sig.)
Voelvlei Dam−0.186 (0.76)−0.645 (0.76)−0.852 (0.84)0.417 (0.71)
Wemmershoek Dam−1.114 (0.14)−2.272 (0.29)−1.555 (0.84)1.886 (0.29)
Assegaaibos−2.558 (0.01)−4.127 (0.43)−7.564 (0.34)−0.304 (0.84)
Higgovale CT−0.251 (0.29)−1.798 (0.29)−1.105 (0.68)0.684 (0.58)
Table Mountain−1.598 (0.10)−3.233 (0.26)−2.223 (0.68)0.587 (0.86)
Table Mountain at Newlands−1.264 (0.17)−4.690 (0.14)−7.635 (0.08)−1.604 (0.29)
Jonkershoek−2.920 (0.01)−4.653 (0.07)−0.115 (0.84)1.802 (0.92)
Lambertsbaai−0.183 (0.59)−0.316 (0.76)0.573 (0.54)0.013 (0.56)
Kogel Baai−0.409 (0.97)−2.653 (0.06)−1.087 (0.41)0.829 (0.92)
Vredendal0.096 (0.16)−0.357 (0.04)0.383 (0.76)−0.094 (0.76)
Stettynskloof Dam−0.465 (0.66)−1.662 (0.36)1.624 (0.95)0.184 (1.00)
Roode Els Berg Dam−0.258 (0.79)−1.997 (0.52)−0.583 (0.92)−0.868 (0.63)
Lakenvallei Dam−0.309 (0.92)−2.395 (0.10)−0.22962 (0.92)−0.699 (0.86)
Kwaggaskloof Dam0.257 (0.43)−1.192 (0.09)−0.333 (0.61)−0.269 (0.97)
Theewaterskloof Dam−0.297 (0.92)−2.340 (0.00)1.299 (0.40)−0.274 (0.95)
Buffeljags Dam−0.088 (0.84)−1.033 (0.18)0.975 (0.40)0.302 (0.95)
Korinte−vet Dam−1.694 (0.28)−2.273 (0.20)0.792 (0.34)0.194 (0.63)
Floriskraal Dam0.288 (0.22)0.803 (0.23)0.861 (0.29)−0.188 (0.86)
Gamka Dam0.645 (0.15)−0.542 (0.36)0.212 (0.23)−0.566 (0.22)
Kammanassie Dam0.759 (0.17)0.128 (0.81)1.280 (0.00)−0.743 (0.14)
Stompdrift Dam0.387 (0.21)0.122 (0.87)0.665 (0.08)−0.483 (0.45)
George−0.671 (0.78)−0.554 (0.61)0.844 (0.52)−0.018 (0.95)
Ronde Valley−1.609 (0.50)0.719 (0.61)1.156 (0.28)−0.309 (0.81)
Note: Statistically significance trends are indicated in bold face.
Table 2. Descriptive statistics of SPI values.
StationSPI-3SPI-6SPI-12
Var.Kurt.Skew.Var.Kurt.Skew.Var.Kurt.Skew.
Voelvlei Dam0.2770.437−0.6050.462−0.348−0.3490.682−0.9700.019
Wemmershoek Dam0.262−0.5690.3880.4540.1660.7260.7130.3680.752
Assegaaibos0.268−0.079−0.6880.509−0.406−0.4460.753−0.414−0.220
Higgovale CT0.251−0.065−0.5590.455−0.420−0.2710.754−0.456−0.337
Table Mountain0.3330.0480.2030.5140.3570.4240.7740.0590.562
Table Mountain at Newlands0.315−0.587−0.3250.484−0.393−0.0480.747−0.4040.035
Jonkershoek0.3680.194−1.0080.6660.176−1.0121.3671.078−1.424
Lambertsbaai0.200−0.5990.3300.370−0.4400.2120.616−0.1730.341
Kogel Baai0.4993.818−1.5120.7250.653−0.8801.0803.427−1.415
Vredendal0.307−0.3150.5940.462−0.3340.7020.5800.0330.318
Stettynskloof Dam0.200−0.5420.2620.393−0.4660.6460.7210.1060.738
Roode Els Berg Dam0.2371.254−0.6290.3930.362−0.3940.6730.867−0.185
Lakenvallei Dam0.257−0.3770.1120.490−0.1670.2180.7760.589−0.123
Kwaggaskloof Dam0.2440.8330.2470.4660.3190.1440.751−0.037−0.203
Theewaterskloof Dam0.1880.336−0.2920.4170.398−0.4800.689−0.0980.073
Buffeljags Dam0.168−0.954−0.3460.336−0.689−0.2870.6900.077−0.901
Korinte−vet Dam0.1570.405−0.5850.3370.252−0.7290.6001.330−0.946
Floriskraal Dam0.236−0.5100.1270.450−0.335−0.0660.670−1.0720.238
Gamka Dam0.2040.8060.0270.4691.035−0.0930.7220.205−0.071
Kammanassie Dam0.1952.378−0.7540.4452.086−0.6870.6970.191−0.441
Stompdrift Dam0.1690.0160.3780.3350.8390.2250.5650.407−0.140
George0.180−0.8020.2520.354−0.7240.2300.621−0.488−0.106
Ronde Valley0.2921.261−0.8910.5321.283−0.9010.8230.579−0.724