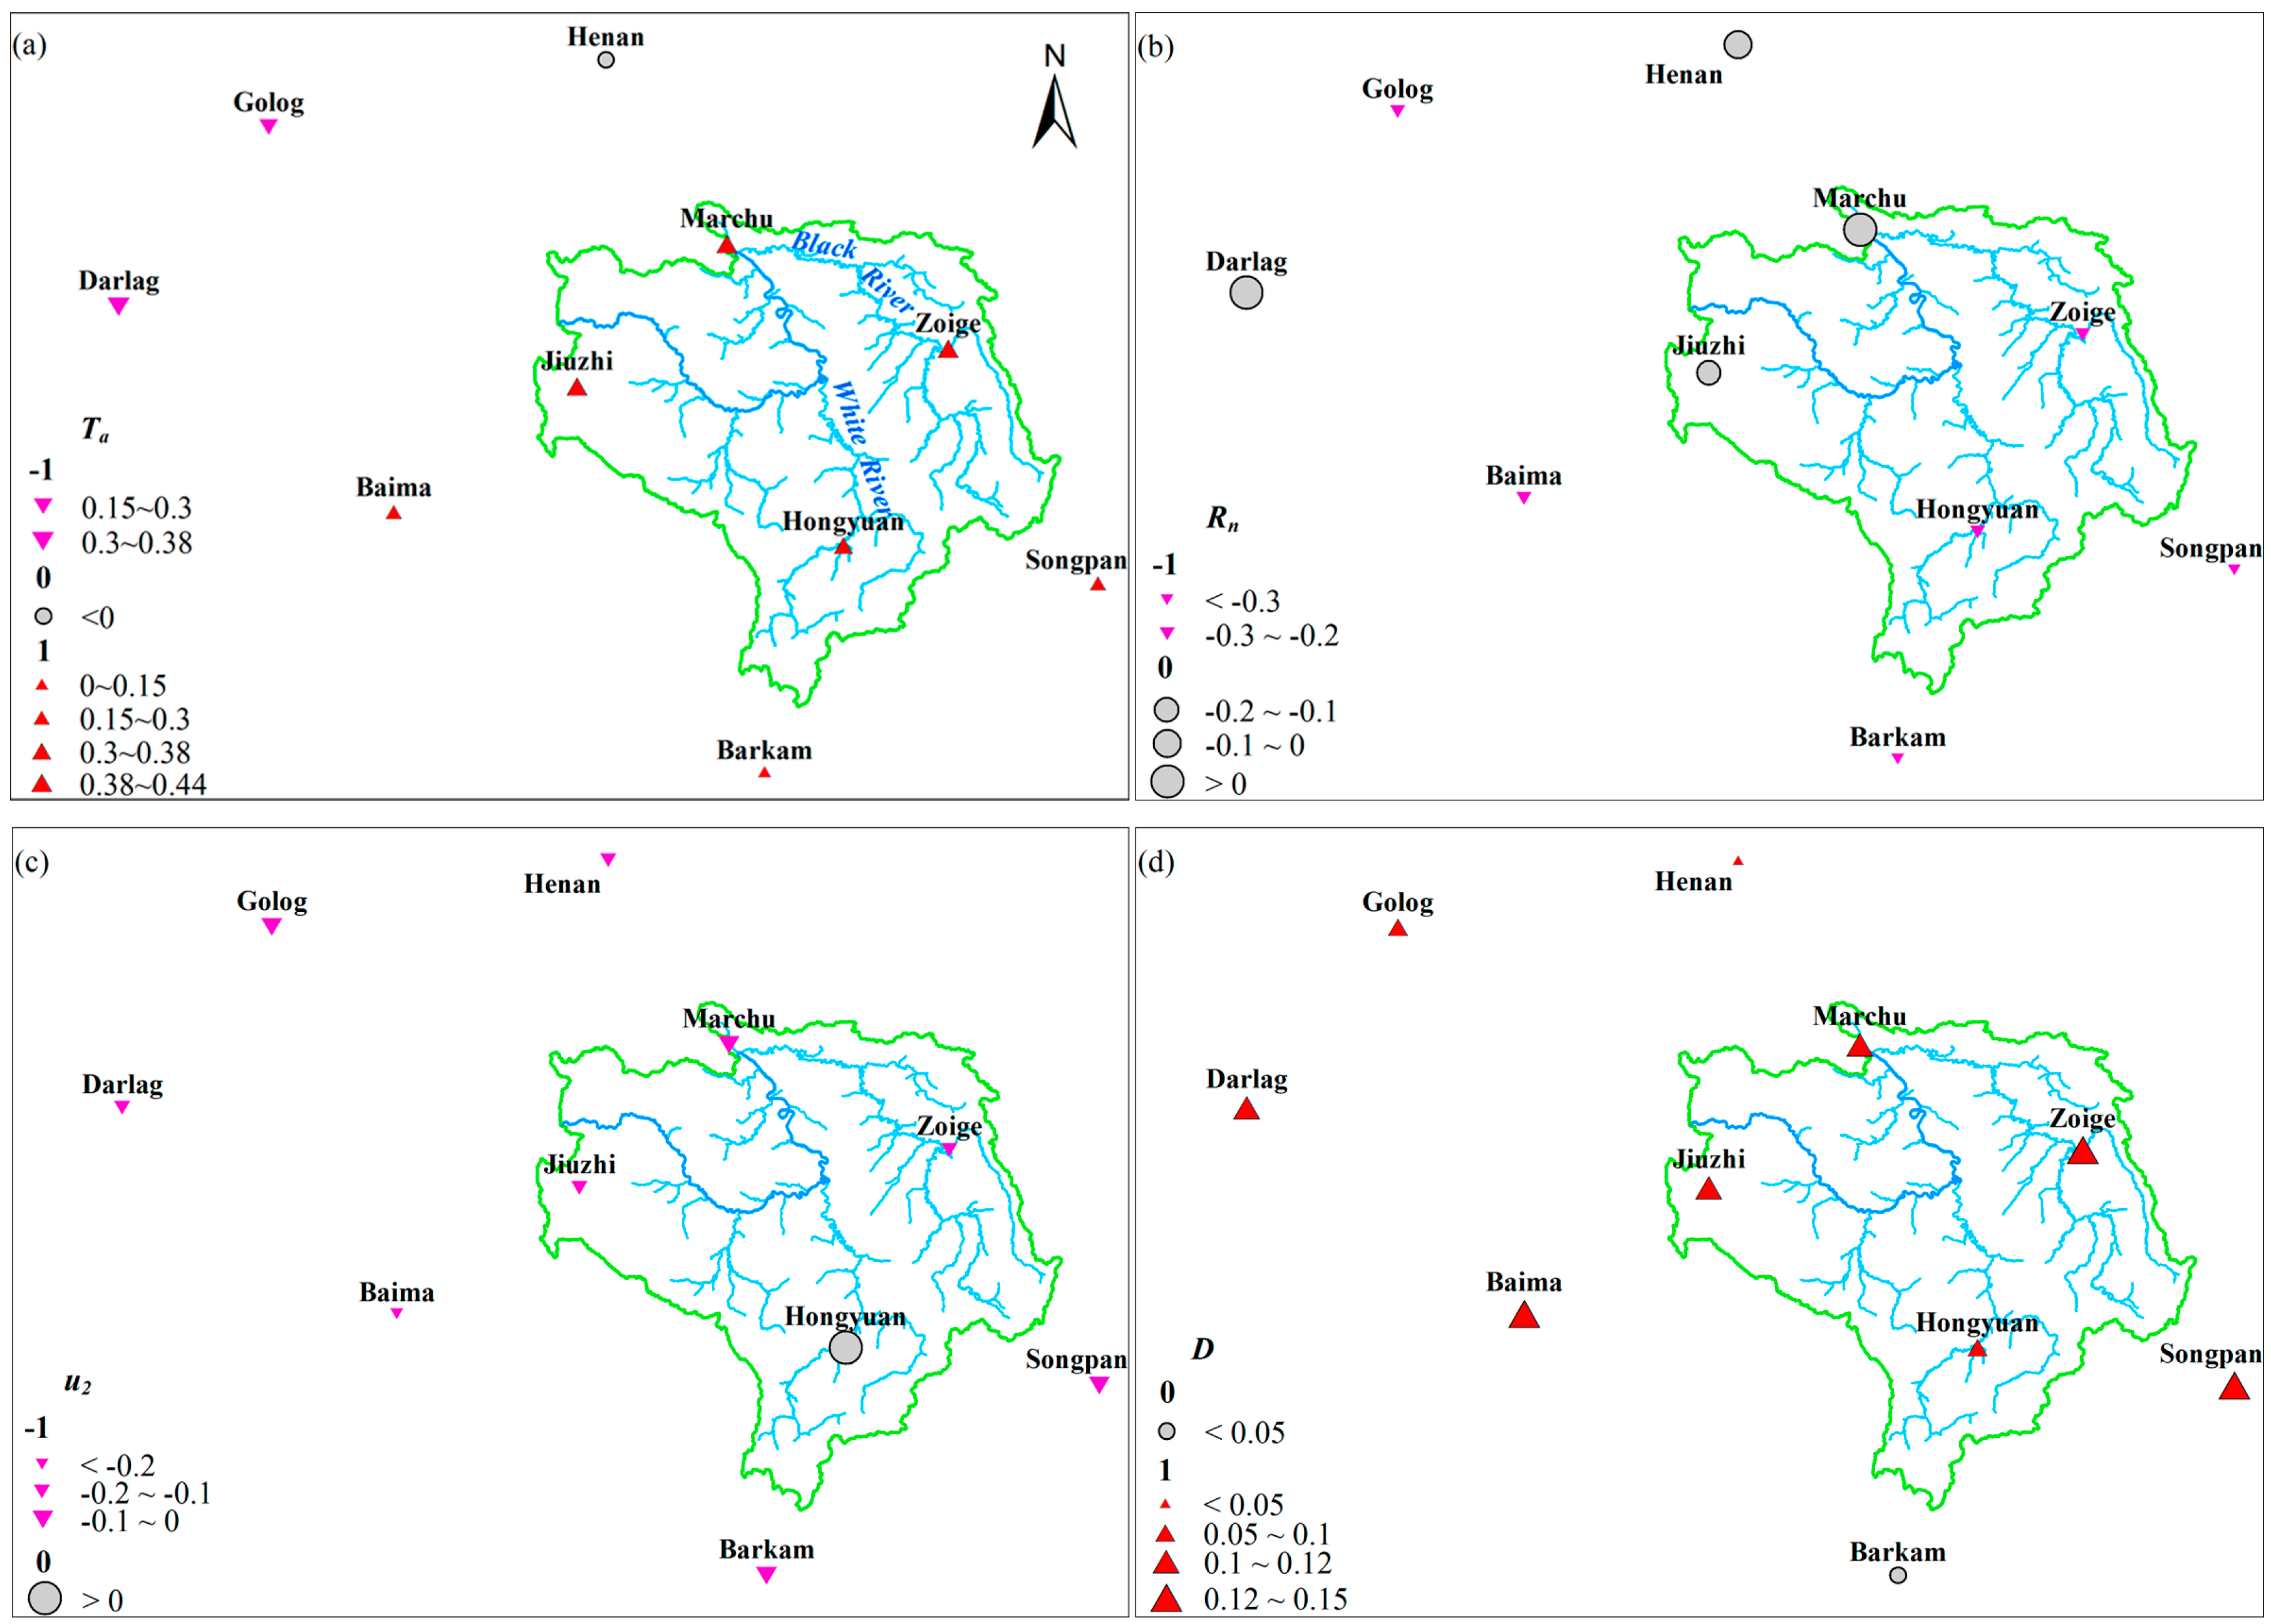
3.1. Change in the Main Climate Factors
The four stations in the Zoige wetland show significant warming trends (
p = 0.05) from 1969 to 2014 (
Figure 2). However, the three stations located in the south beyond the Zoige wetland exhibit weak warming trends. The three stations located in the northwest beyond the Zoige wetland exhibit decreasing trends (Golog and Darlag stations) or no trend (Henan station). Comparatively, the average temperature
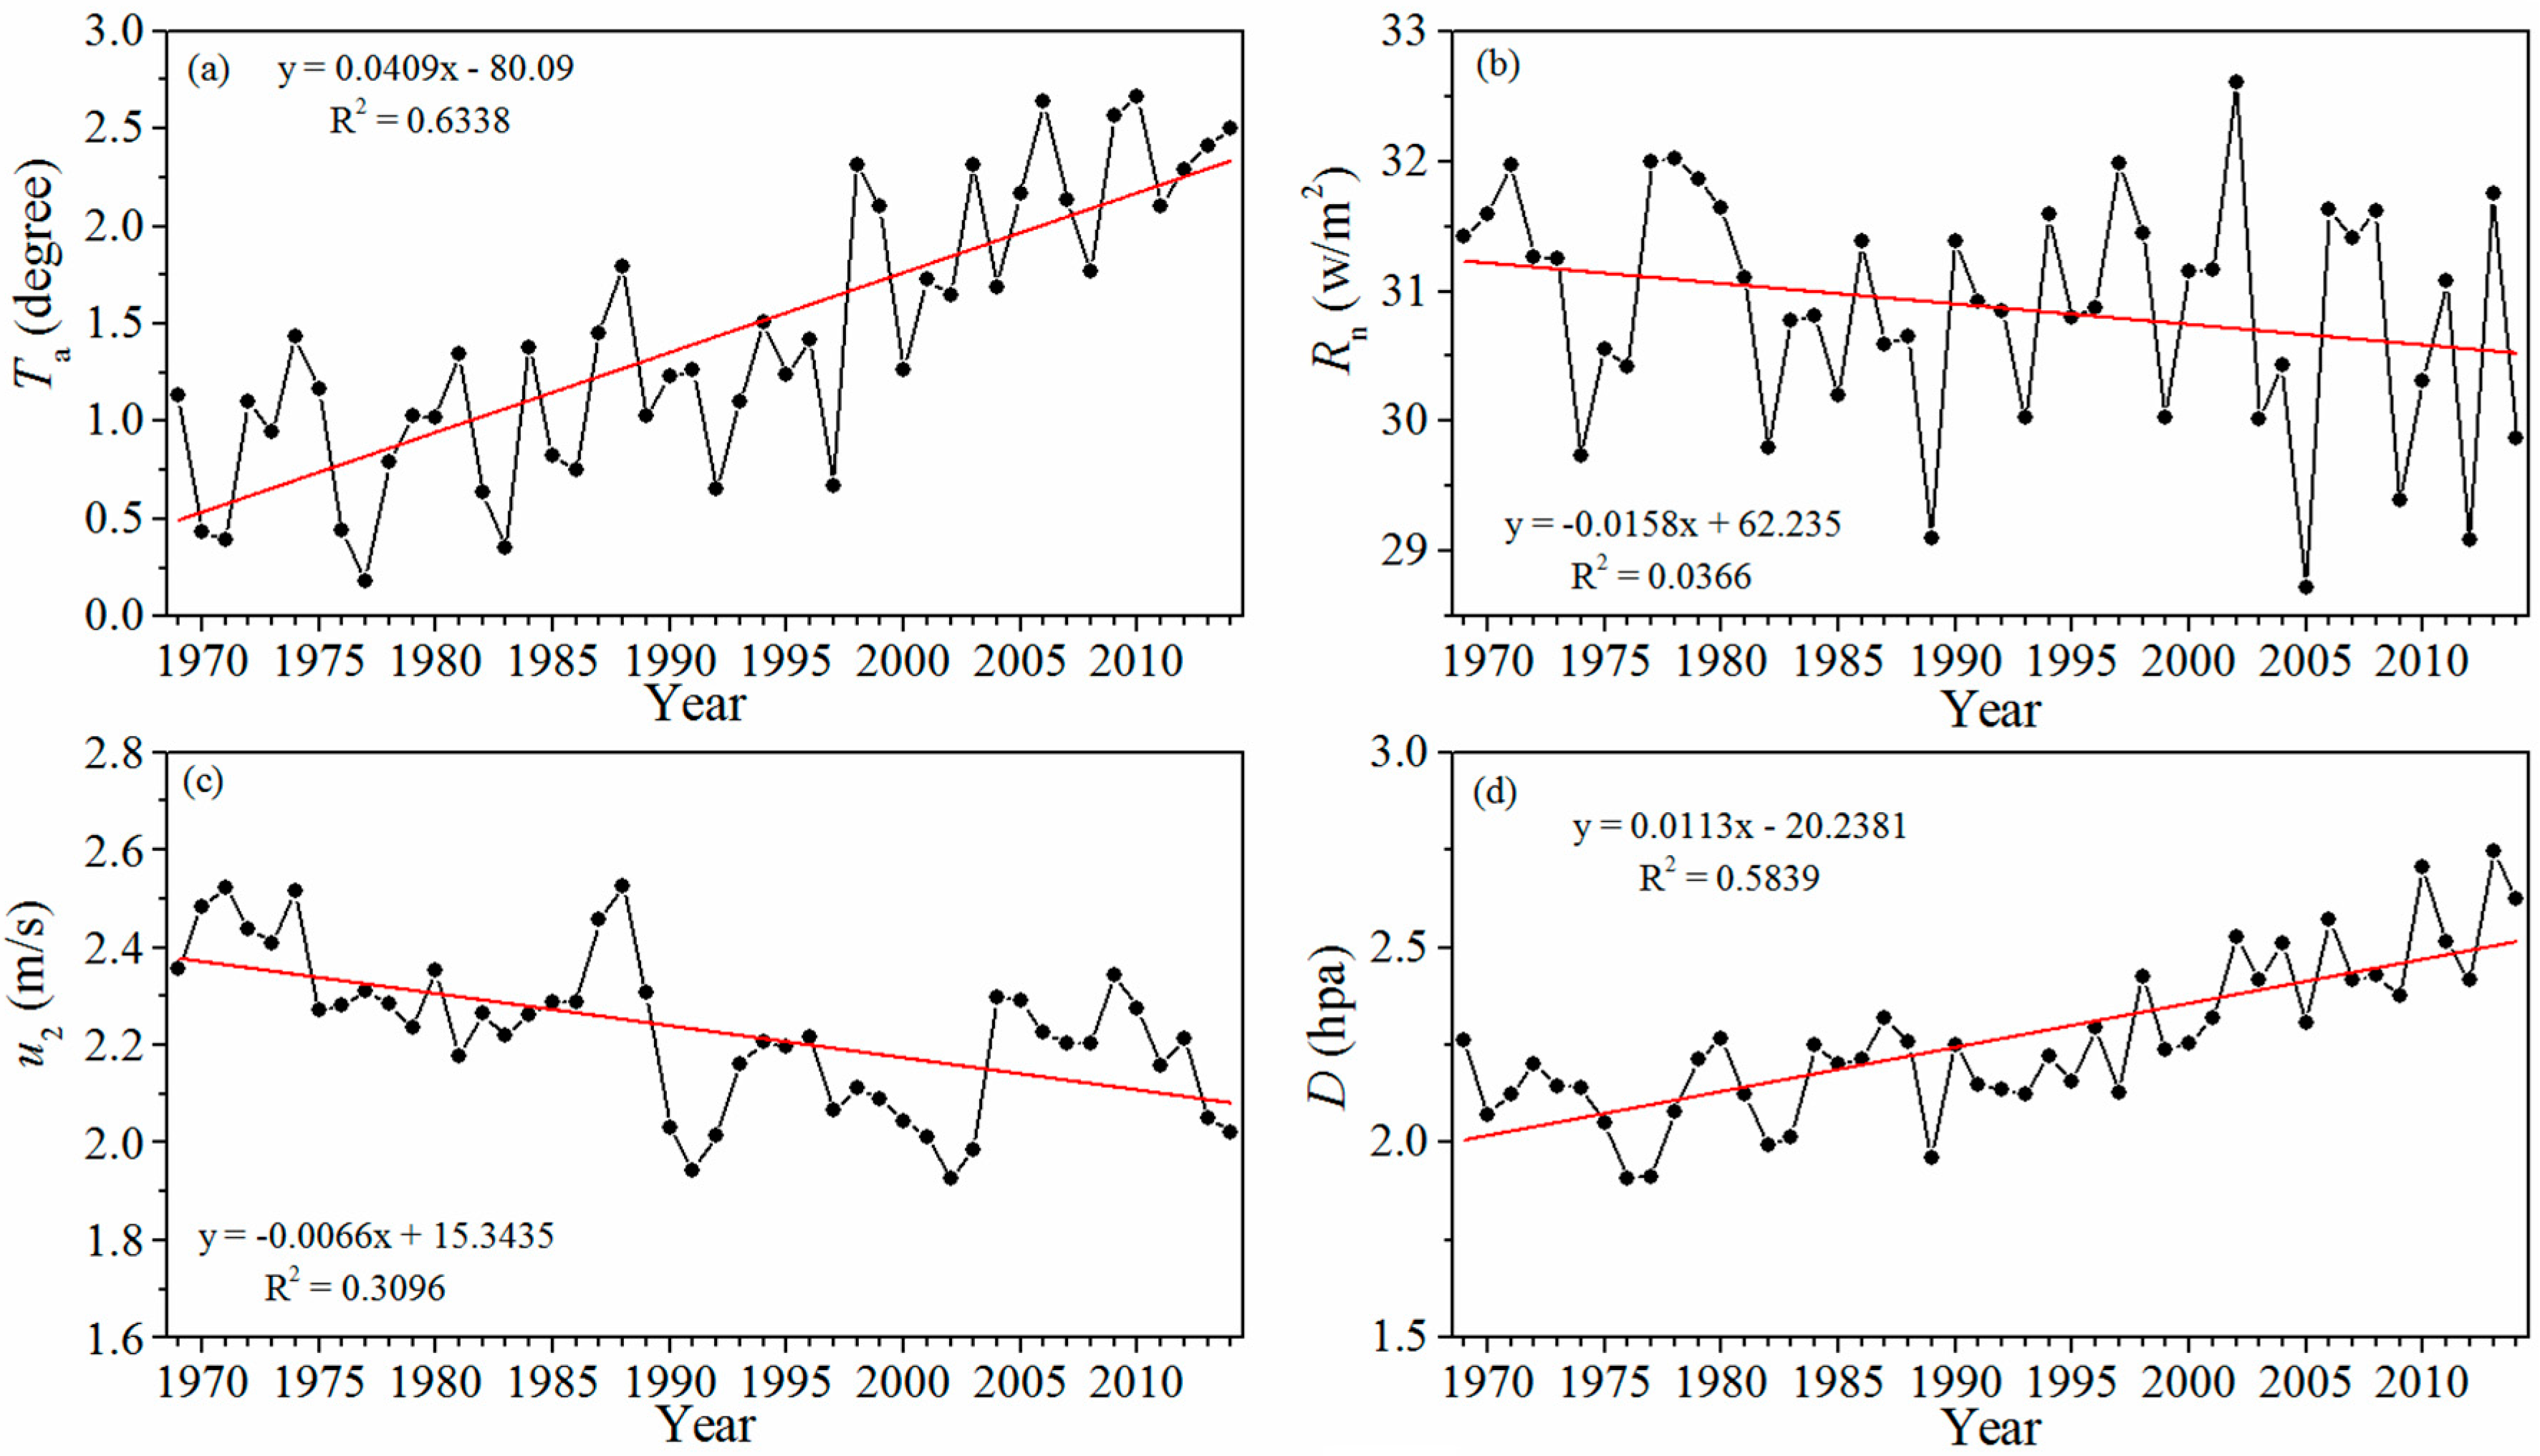
Ta of the four stations in the Zoige wetland increased more significantly (with a trend slope of 0.41 °C decade
−1,
p < 0.01) (
Figure 3) than that of the six stations in the peripheral areas (with a trend slope of 0.20 °C decade
−1,
p < 0.01) (
Table 3).
In the Zoige wetland, Zoige and Hongyuan stations show significantly decreasing trends (p = 0.05) in net radiation Rn, whereas Marchu and Jiuzhi stations show no obvious trends in net radiation Rn. Similarly, in the peripheral areas, the four stations exhibit significantly decreasing trends in net radiation Rn (p = 0.05), whereas the other two stations (Darlag and Henan stations) show no trends at p = 0.05. The average net radiation Rn of the Zoige wetland and its peripheral areas show similar decreasing trends (with a trend slope of −0.16 and −0.18 W m−2 decade−1, respectively).
All of the stations in the Zoige wetland and its peripheral areas exhibited significant downward trends in wind speed u2 (p = 0.05), except for the Hongyuan station (no trend at p = 0.05). The average wind speed u2 of the Zoige wetland declined slower (−0.07 m/s decade−1) than that of its peripheral areas (−0.12 m/s decade−1). All of the stations in the Zoige wetland and its peripheral areas exhibited significant upward trends in D, except for the Barkam station (no trend at p = 0.05). Comparably, the average vapor pressure deficit D of the Zoige wetland shows more significant increasing trends (0.11 hPa decade−1) than its peripheral areas (0.08 hPa decade−1).
3.2. Changes in the Observed Epan
The observed pan evaporation (
Epan_o) of three stations in the Zoige wetland exhibit increasing trends during 1969–2001, whereas Marchu exhibits decreasing trends (
Table 4). By contrast, four of the six stations in the peripheral areas exhibit decreasing trends in
Epan_o. Comparatively, the average
Epan_o of the four stations in the Zoige wetland increased during 1969–2001 (with a trend slope of 0.7 mm decade
−1,
p < 0.05), whereas that of the six stations in the peripheral areas decreased (with a trend slope of −20.3 mm decade
−1,
p < 0.05).
A change point is observed in the time series of the average
Epan_o of the four stations in the Zoige wetland (
Figure 4).
Epan_o in the Zoige wetland decreased significantly (−66.5 mm decade
−1,
p < 0.05) during 1969–1989, but increased significantly during 1990–2001 (with a trend slope of 140.8 mm decade
−1,
p < 0.05). Similarly,
Epan_o in the peripheral areas decreased significantly (−73.1 mm decade
−1,
p < 0.05) during 1969–1989, but increased significantly during 1990–2001 (with a trend slope of 107.0 mm decade
−1,
p < 0.05).
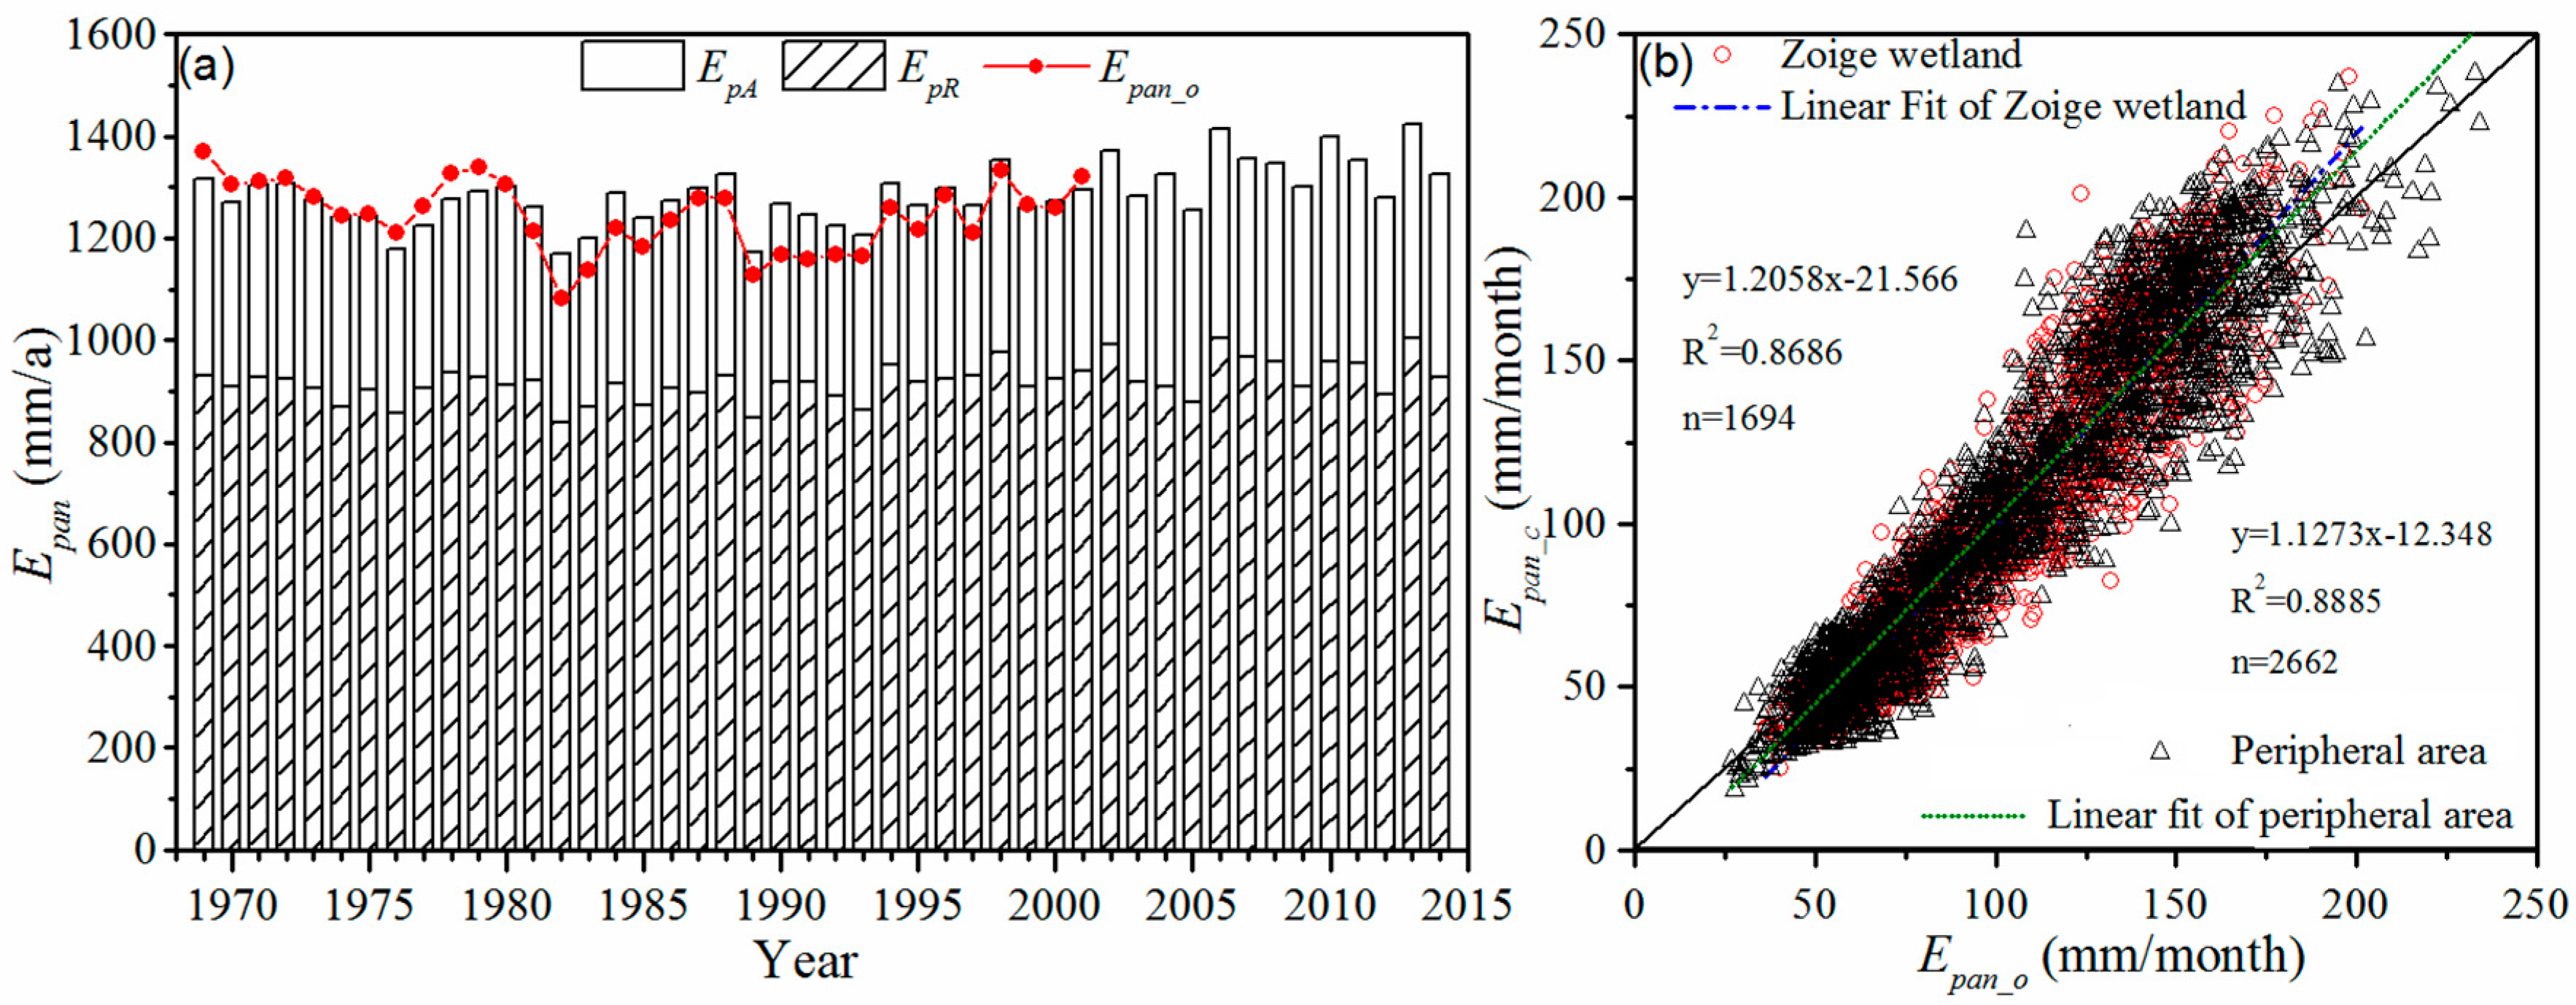
3.3. Contributions of the Main Climate Factors on the Changes in Epan
The PenPan-20 model was used to simulate the pan evaporation (
Epan_c) from 1969 to 2014. The parameters
a and
b in the wind speed conversion function (
a = 0.62;
b = 0.75) were calibrated by a trial-and-error method, with Nash–Sutcliffe efficiency coefficient (NSE) as the objective function. First, the daily simulated pan evaporation
Epan_c was calculated using the climate factors (
Rn,
Ta,
u2, and
D). Then, the monthly
Epan_c was calculated and compared with the observed values (
Epan_o). As shown in
Figure 4, a strong correlation (with
R2 > 0.87, NSE > 0.82, MAE < 14 mm, RMSE < 17.8 mm) exists between the calculated and observed pan evaporation in the Zoige wetland and its peripheral areas. It indicates that the PenPan-20 model could accurately simulate the pan evaporation
Epan and effect of climate factors on
Epan.
The dominant factors contributing to the change in
Epan in the Zoige wetland were explored based on the PenPan model. The increases in
Epan during 1969–2014 were mainly caused by changes in vapor pressure deficit (
D) at Marchu, Jiuzhi, and Zoige stations, with contributions of 18.7, 24.2, and 16.9 mm decade
−1, respectively, and by changes in temperature (
Ta) at Hongyuan station (13.7 mm decade
−1) (
Figure 5). The increase in vapor pressure deficit (
D) was the dominant factor of changes in
Epan at the three stations (Golog, Darlag, and Songpan) in peripheral areas, with a mean contribution of 16 mm decade
−1. The increase in temperature (
Ta) was the dominant factor of changes in
Epan at Baima (28.8 mm decade
−1). The decrease in wind speed (
u2) was responsible for the reduction in
Epan at Henan and Barkam stations, with contributions of −20 and −13 mm decade
−1, respectively. The decrease in wind speed (
u2) was the dominant factor leading to the decrease in
Epan before 1989 for the four stations in the Zoige wetland, whereas the increase in water vapor pressure deficit (
D) was the most important factor driving the increase in
Epan after 1990 (except for Marchu, with the increase in temperature (
Ta) as the first driver).
The contributions of
Rn,
u2,
Ta, and
D to the change in
Epan in the Zoige wetland and its peripheral areas were evaluated according to the arithmetic average values of the corresponding stations (
Table 5). Increasing temperature (
Ta) and vapor pressure deficit (
D) were the dominant factors leading to the change in
Epan in the Zoige wetland from 1969 to 2014 (19.0 and 16.0 mm decade
−1, respectively). Although the decreasing
Rn and
u2 offset the increase in
Epan (−4.1 and −8.6 mm decade
−1, respectively), the simulated
Epan in the Zoige wetland shows increasing trends. The effects of the increasing temperature (
Ta) and vapor pressure deficit (
D) on
Epan are significant after 1990, with contributions of 24.4 and 32.4 mm decade
−1, respectively. Comparatively, the effects of the increasing temperature (
Ta) and vapor pressure deficit (
D) on
Epan from 1969 to 2014 in the peripheral areas are weaker than those of the decreasing wind speed (
u2) and net radiation (
Rn). As a result, the peripheral areas exhibited a weak decline in
Epan during 1969–2014.
Considering the contributions of temperature (
Ta) on
via net radiation (
Rn) and on
via water vapor pressure deficit (
D), the total contribution of increasing temperature (
Ta) on the trends in
Epan in the Zoige wetland is 26.61 mm decade
−1 during 1969–2014 and is more significant during 1990–2014 (40.88 mm decade
−1) (
Table 6). The effects of temperature (
Ta) in the Zoige wetland are more significant than those in the peripheral regions.


