1. Introduction
Climate change may lead to changes in the intensity, frequency, spatial extent, and duration of extreme weather and climatic events [
1,
2,
3,
4]. Increasing evidence shows that such changes in the global-scale climate system may already pose a threat to humans through increased morbidity and mortality. This is caused by heat, cold, drought, and rainfall/floods; as well as by changes in air quality, water quality, and the ecology of infectious diseases [
5,
6,
7,
8]. Accounting for half of all natural disasters in the world, flooding is one of the most common and severe forms of natural disaster [
9,
10,
11,
12]. Flood events are expected to increase in frequency and intensity due to more frequent and extreme precipitation events and rising sea level [
13,
14,
15,
16]. China is a country prone to a variety of natural disasters, but flooding is the major meteorological disaster that affects many of its regions [
17,
18,
19].
Flood control systems, which consist of reservoirs, river levees, and flood retarding area in most river basins in China, have been formed after decades of construction of hydraulic structures. With the rapid development of the economy in the river basins, the flood risk has increased in synchrony [
20,
21].
China suffered a series of severe floods in 2016, of which the most serious happened in the Yangtze River basin. The average accumulated precipitation of Hubei Province between 28 June and 10 July reached 372 mm. There are about 140 rivers and more than 200 stations in the Yangtze River basin, all of which have a history of encountering floods beyond the warning stage. In total, 19 rivers and 25 stations have experienced beyond-guaranteed stage floods, while 21 rivers and 21 stations established new flood records. Compared to the recorded flood in 1998, disasters and dangers that occurred in the main stream of the Yangtze River are evidently reduced; they decreased to less than 1% of that in the Flood of 1998, due to the last twelve years’ construction. Now, the main focus of disaster and danger has shifted to the tributary and flood retarding areas.
The use of flood retarding areas is an important secondary flood control mechanism, and is used to accommodate floods that exceed standard levels of flooding [
22,
23]. Nevertheless, the rapid development of the population and economy in such areas means that using the flood retarding areas also results in great loss. Because climate change makes extreme flood events more likely to occur, it should be noticed that a scientific, reasonable flood retarding operation scheme is the key issue to achieve both the best use of the resources in the flood retarding areas and relief of flood risk in the area. Liu proposed a fuzzy optimization model for a scheduling scheme of flood retarding areas [
24], and Wang proposed the multi-object and scenario analysis model for flood retarding areas [
25]. Although some other scholars have studied the flood risk management of flood retarding areas [
26,
27,
28,
29], there are few reports in the literature on optimal operation of flood retarding areas.
The main purpose of this paper was to study the effect of different flood retarding operation schemes and to try to provide an optimal method by choosing the best scheme. The flood retarding area of Hongze Lake—the second-largest flood retarding area in China—was taken as a case study. A one- and two-dimensional coupled hydrodynamic model was established to simulate the flood routing in the Hongze Lake area. Fifteen different schemes involving different flood magnitudes and different flood retarding operations were simulated to discuss three topics: (1) flood retarding necessity; (2) graded flood retarding necessity; and (3) optimal flood retarding scheme in terms of effect of reducing water level, flood loss in the area, and preparedness of transfer.
2. Materials and Methods
2.1. Study Area
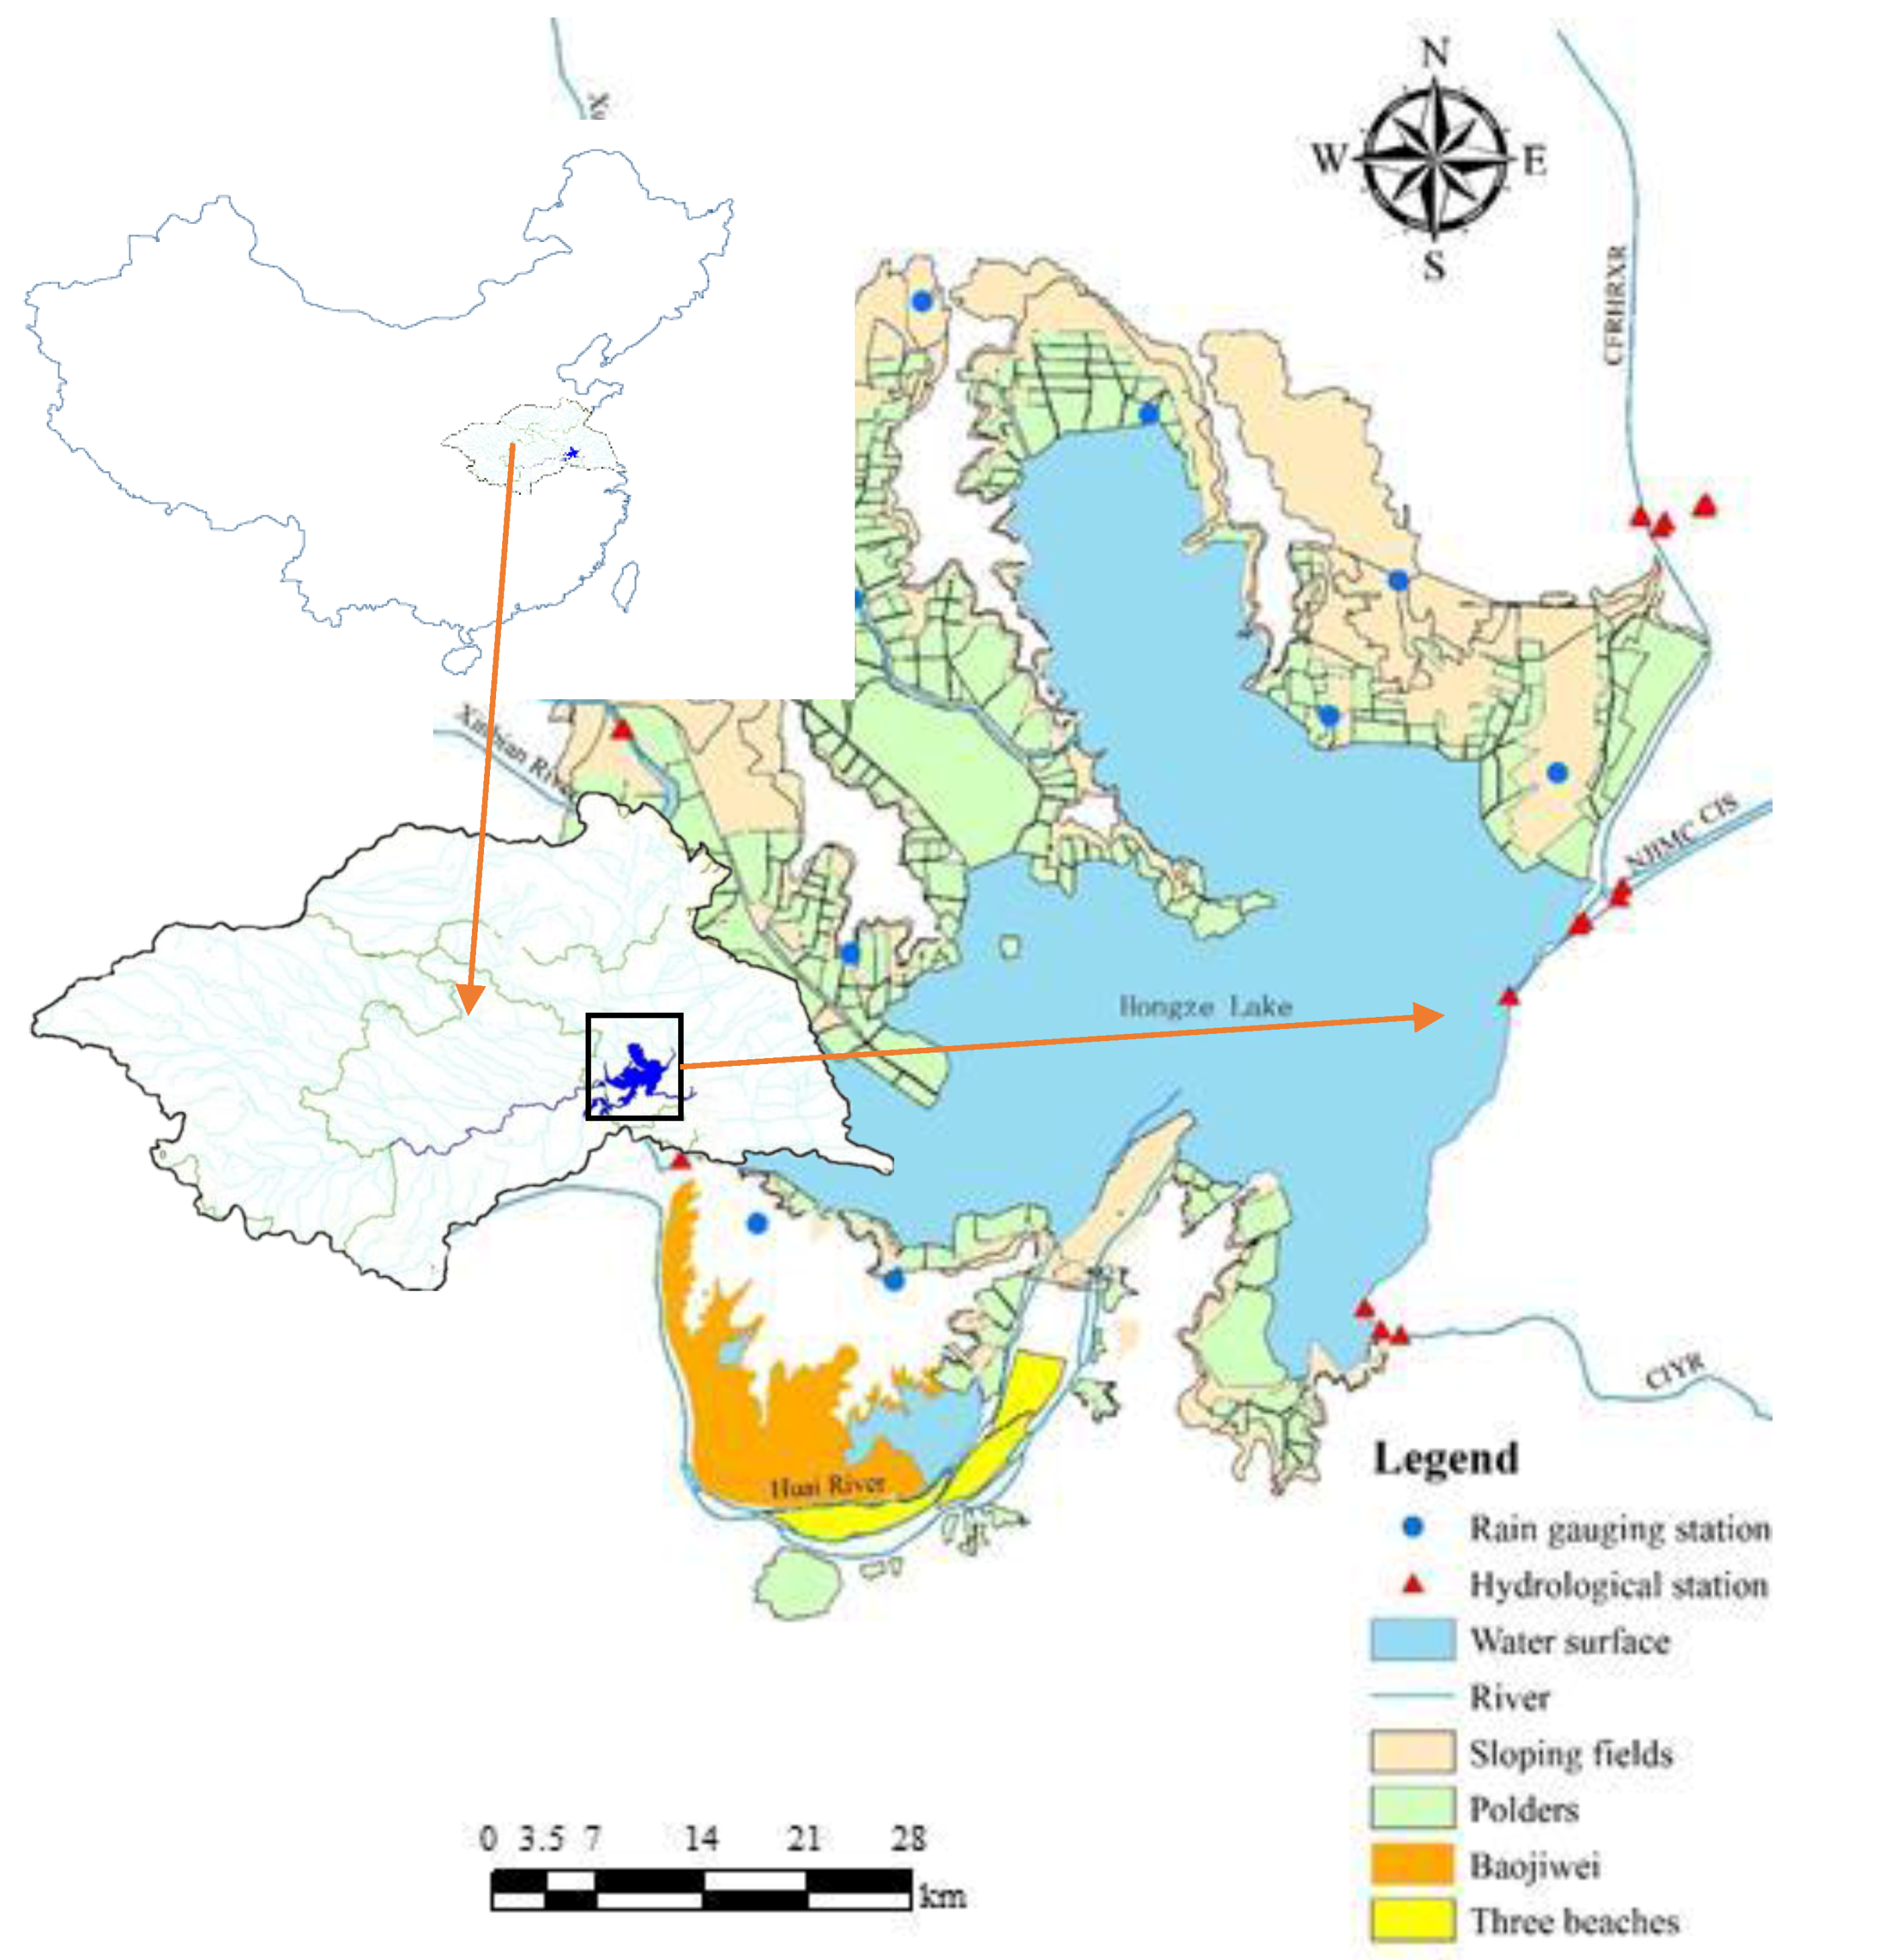
Hongze Lake is a large regulating reservoir that could accommodate a flood of 158,000 km
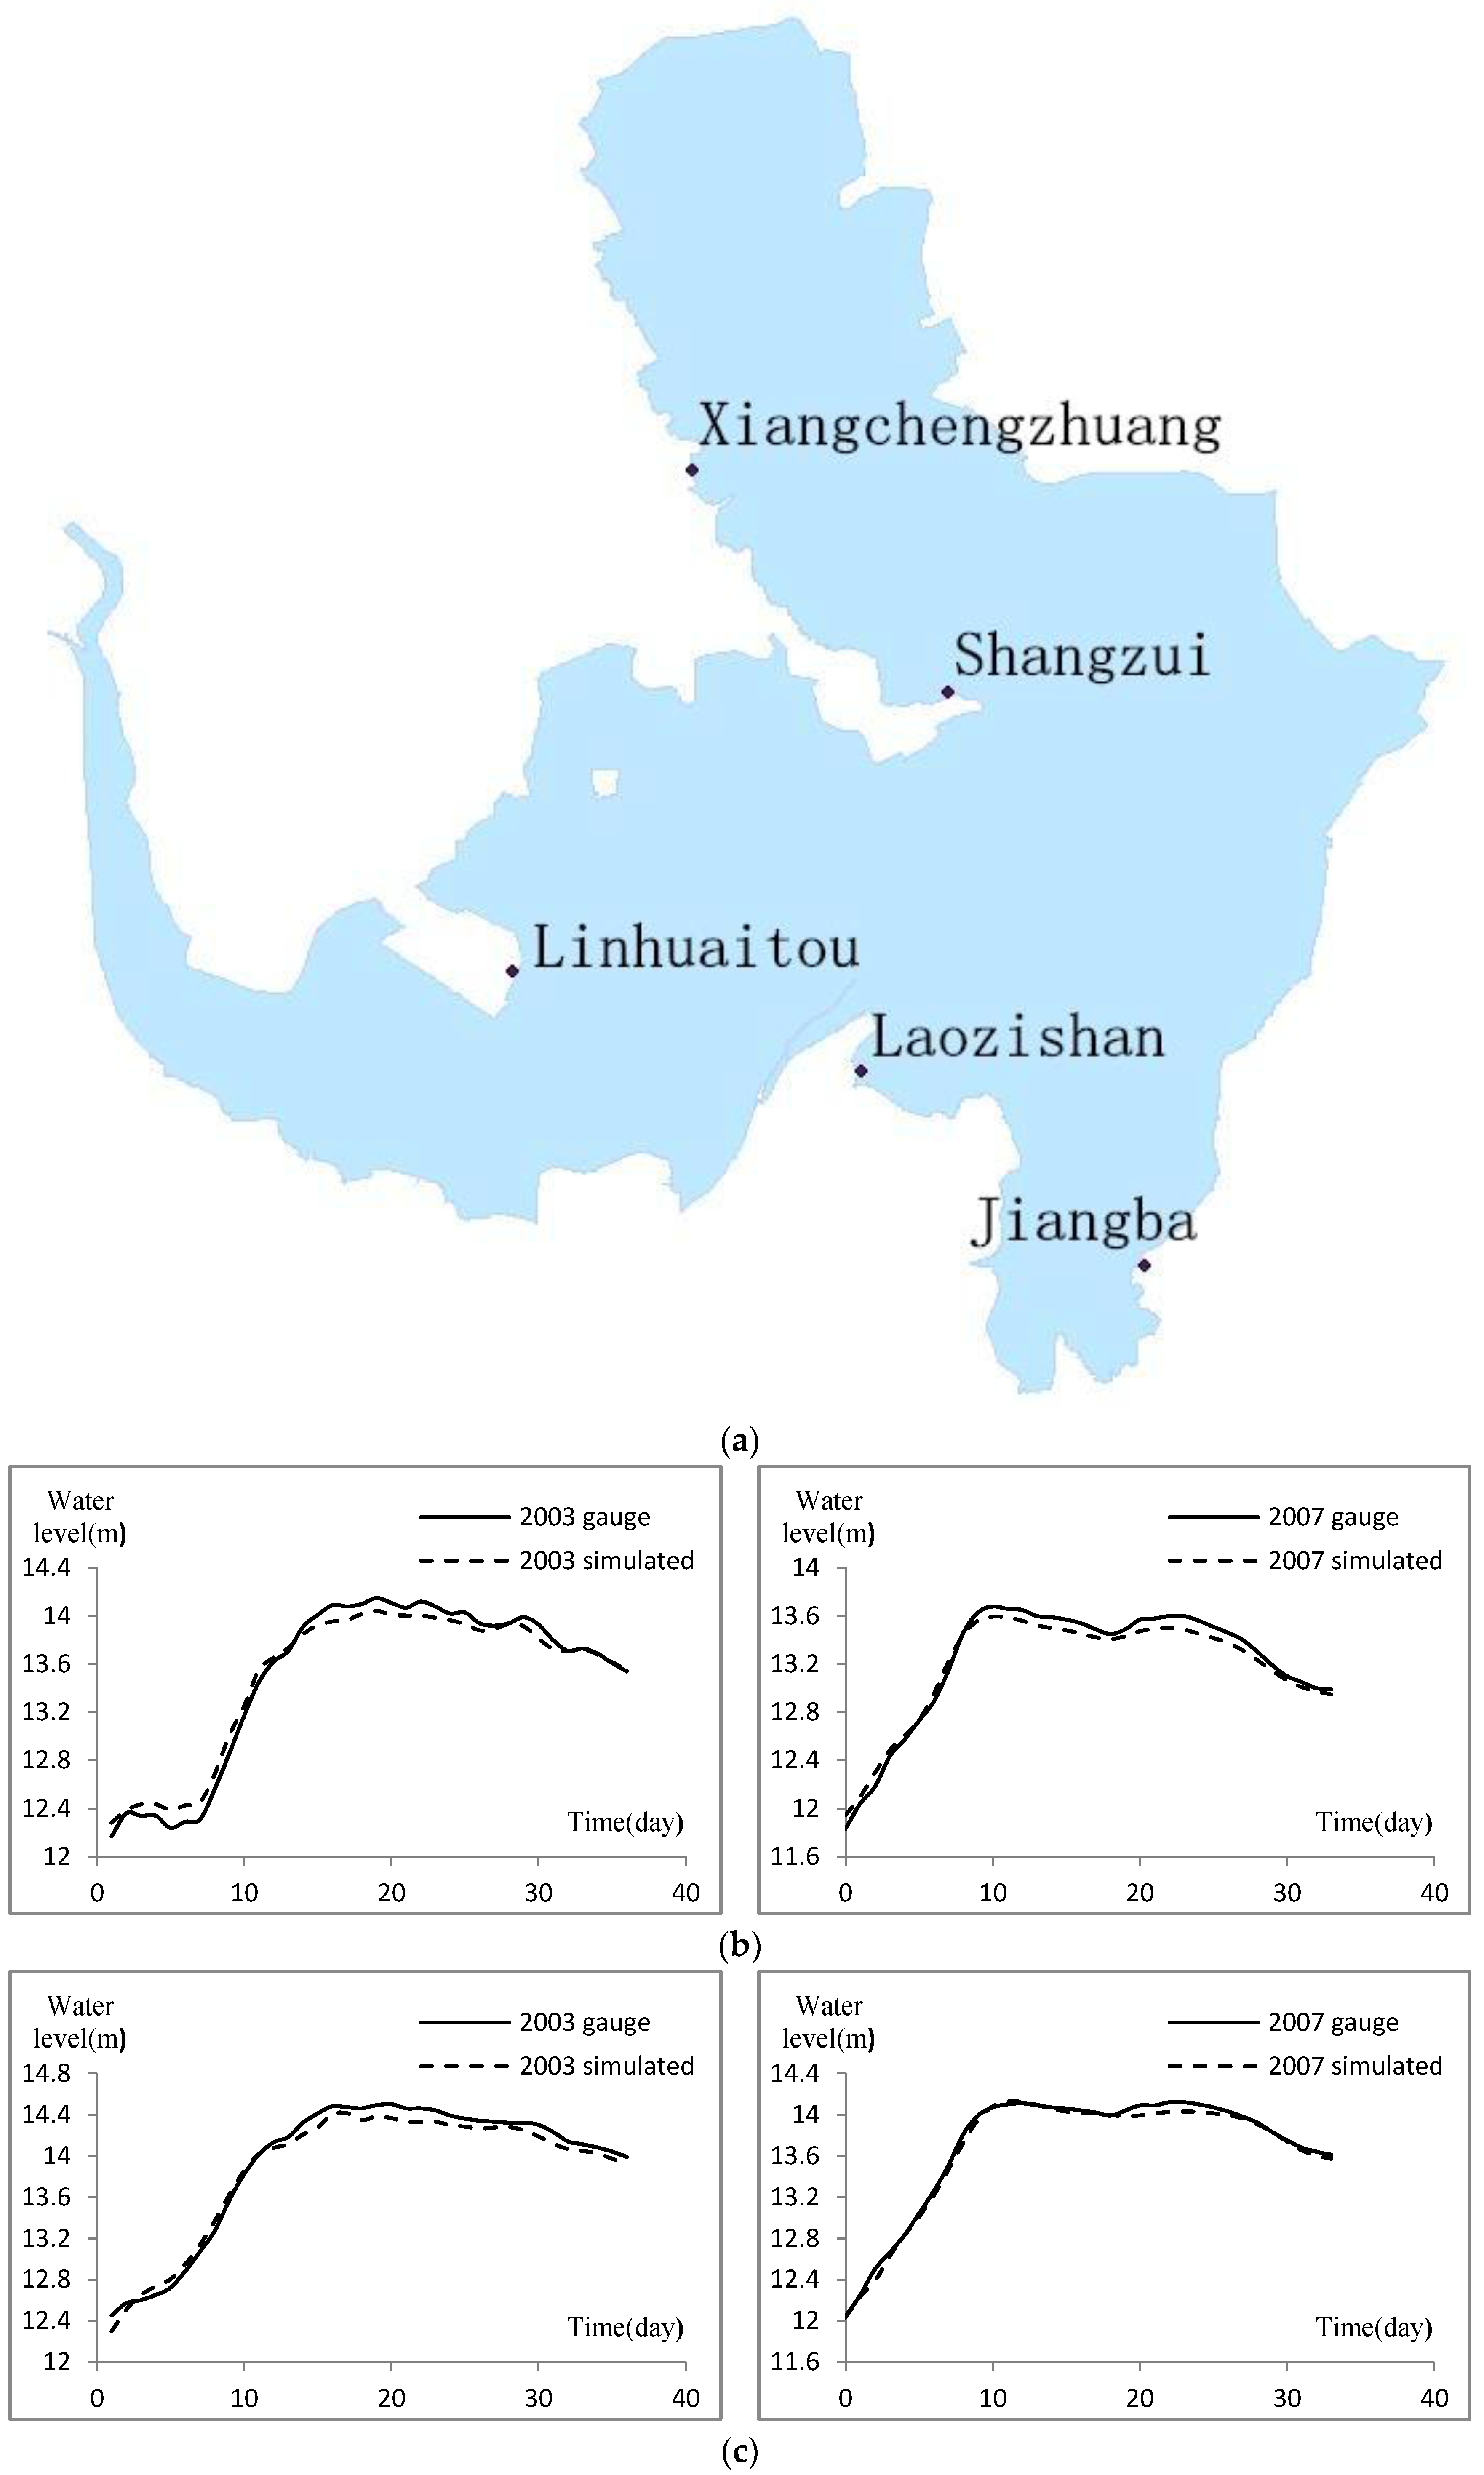
2 from upstream and discharge it to the Yangtze River and Yellow Sea mainly by the Channel into the Yangtze River (CIYR), the Channel into the Sea (CIS), the Channel of Flood Release from the Huai River to the Xinyi River (CFRHRXR), and North Jiangsu Irrigation Main Channel (NJIMC) (
Figure 1) [
30,
31]. The dead water level, flood control level, normal water level, design water level, and check water level of Hongze Lake is 11.33, 12.33, 13.33, 15.83 and 16.83 m, respectively, based on the 1985 National Elevation Datum. Its corresponding reservoir capacity for flood control is 9.8 billion m
3.
The flood retarding area of Hongze Lake, which is located on the west embankment of Hongze Lake, south of the Abandoned Yellow River, contains polders and fields at elevations of 12.33–16.83 m. Its total area is 2132 km2, and the total population is about 4 million. The capacity for flood control is 4.2 billion m3—about half of the lake’s capacity.
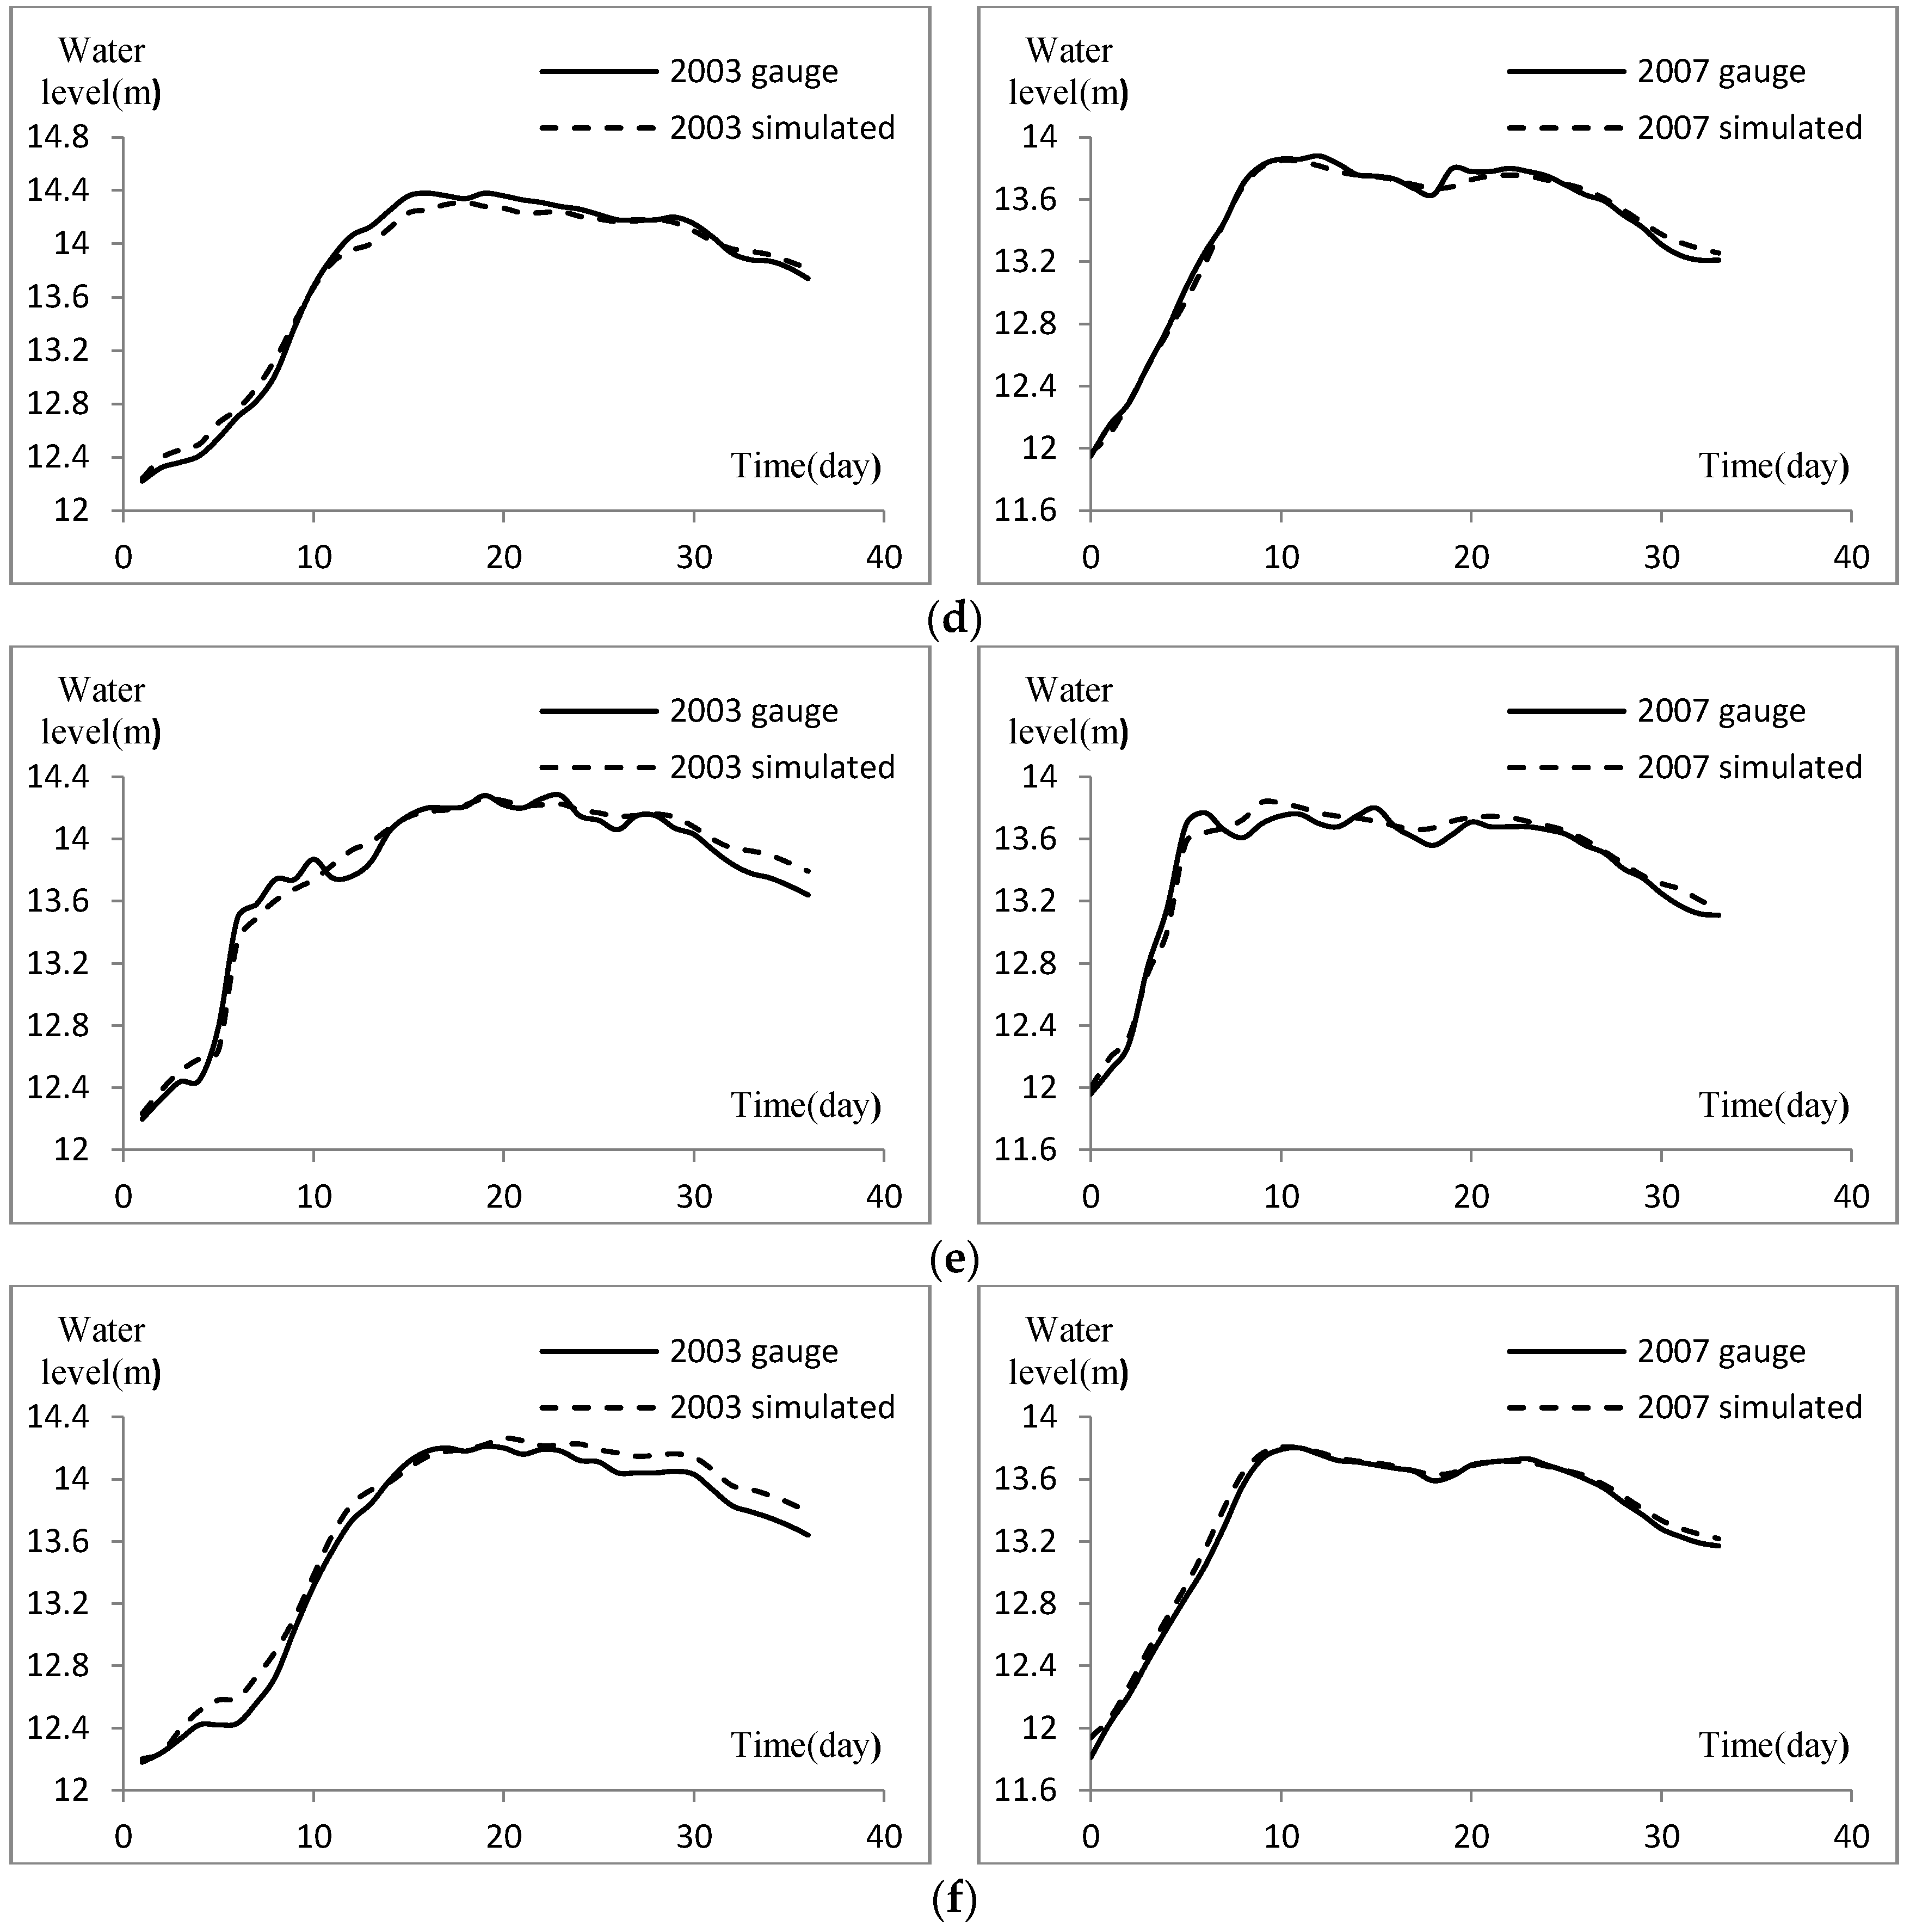
Since the founding of the People’s Republic of China, major floods have occurred in 1954, 1991, 2003, and 2007 in the Huai River basin. In 1954, the water level in Hongze Lake reached 15.06 m, and all areas at lower elevation were submerged. In 1991, some houses in the flood retarding area collapsed and people were relocated. In 2003, the water level of Hongze Lake reached 14.2 m, resulting in 273,000 people being rehoused. Application of the CIS in advance prevented the flood retarding area from being used. In 2007, the water level of Hongze Lake reached 13.73 m, and the discharge through both the CIS and CIYR were greater than in 2003. The water level declined due to the additional use of the CFRHRXR and NJMC.
The existing operation plan of the flood retarding area of Hongze Lake is that all polders in the area will be used to retard flooding when the water level of Hongze Lake reaches 14.33 m. It would be a huge economic loss to use such a large area (>2000 km2) with a human population of 4 million. There are more than 300 polders distributed in the area, and it would be unscientific to take the whole area as a single unit rather than conducting a more reasonable operation based on the magnitude of a flood, the effect of flood retarding, and the distribution of the polders.
2.2. Data and Model
2.2.1. One-Dimensional Model
The governing equation of the one-dimensional river net model is the Saint-Venant Equation, as follows:
where
t and
x stand for time and distance, respectively;
A represents the cross-sectional area;
Q is the discharge;
q is the lateral inflow;
h is the water level;
C is the Chezy resistance; and
R is the hydraulic radius.
The above control equations are applied to simulate the process of submerging the watercourse. The solution of the equations is based on an implicit finite difference scheme developed by Abbott and Ionescu [
32]. The scheme is structured to be independent of the wave description specified. A computational grid of alternating discharge and water level points is used. The computational grid is automatically generated based on the user requirements. The computational points are divided into two kinds: Q-points used to calculate discharge, and h-points used to calculate water level. Q-points are placed midway between neighboring h-points and at structures, while h-points are located at cross-sections.
In the continuity equation, the storage width
is introduced as:
giving
As only
Q has a derivative with respect to
x, the equation can easily be centered at an h-point. The derivatives in Equation (4) are expressed at the time level,
, as follows:
in Equation (4) is approximated by
where
is the surface area between grid points
and
.
is the surface area between grid points
and
. Here,
is the distance between points
and
.
Substituting for the derivatives in Equation (4) gives a formulation with the following form:
where
,
, and
are functions of
b and
, and moreover, depend on
Q and
h at time level
n, and
Q on time level
n and time level
.
The momentum equation is centered at Q-points. The derivatives of Equation (2) are expressed in the following way:
For the quadratic term in Equation (10), a special formulation is used to ensure the correct sign for this term when the flow direction changes during a time step:
where
can be specified by the user and is set to 1.0 by default. With all the derivatives substituted, the momentum equation can be written in the following form:
where
,
,
,
.
To obtain a fully centered description of
, these terms should be valid at time level
—a condition that can only be fulfilled by using an iteration. For this reason, the equations are solved by default two times at every time step—the first iteration starting from the results of the previous time step, and the second iteration using the centered values from this calculation. The Chasing Method is applied to solve the discrete equations [
33].
Data of cross-sections of 128 rivers was collected that described a total of 1491 cross-sections, as well as the hydraulic structures and historical hydrology data to be used to establish the one-dimensional river net model.
2.2.2. Two-Dimensional Model
The two-dimensional model is based on the solution of the incompressible Reynolds-averaged Navier–Stokes equations, subject to the assumptions of Boussinesq and of hydrostatic pressure.
The local continuity equation is written as
where
t is the time;
x,
y, and
z are the Cartesian co-ordinates;
h is the total water depth;
u and
v are the velocity components in
x and
y directions;
is the Coriolis parameter (
is the angular rate of revolution and
the geographic latitude);
g is the gravitational acceleration; and
is the density of water. In this case,
,
,
and
are components of the radiation stress tensor;
is the atmospheric pressure; and
is the reference density of water.
is the magnitude of the discharge due to point sources, and
is the.
The above control equations are used to calculate and simulate the submerging process of easily velocity by which the water is discharged into the ambient water submerged areas. Because the model contains nonlinear mixed arithmetic operators, the finite volume method is used to make the equations discrete [
34]. An approximate Riemann solver is used to calculate the convective fluxes at the cell interfaces. The dependent variables to the left and to the right of an interface must be estimated using Roe’s scheme. Second-order spatial accuracy is achieved by employing a linear gradient-reconstruction technique. To avoid numerical oscillations, a second-order total variation diminishing (TVD) slope limiter is used [
35].
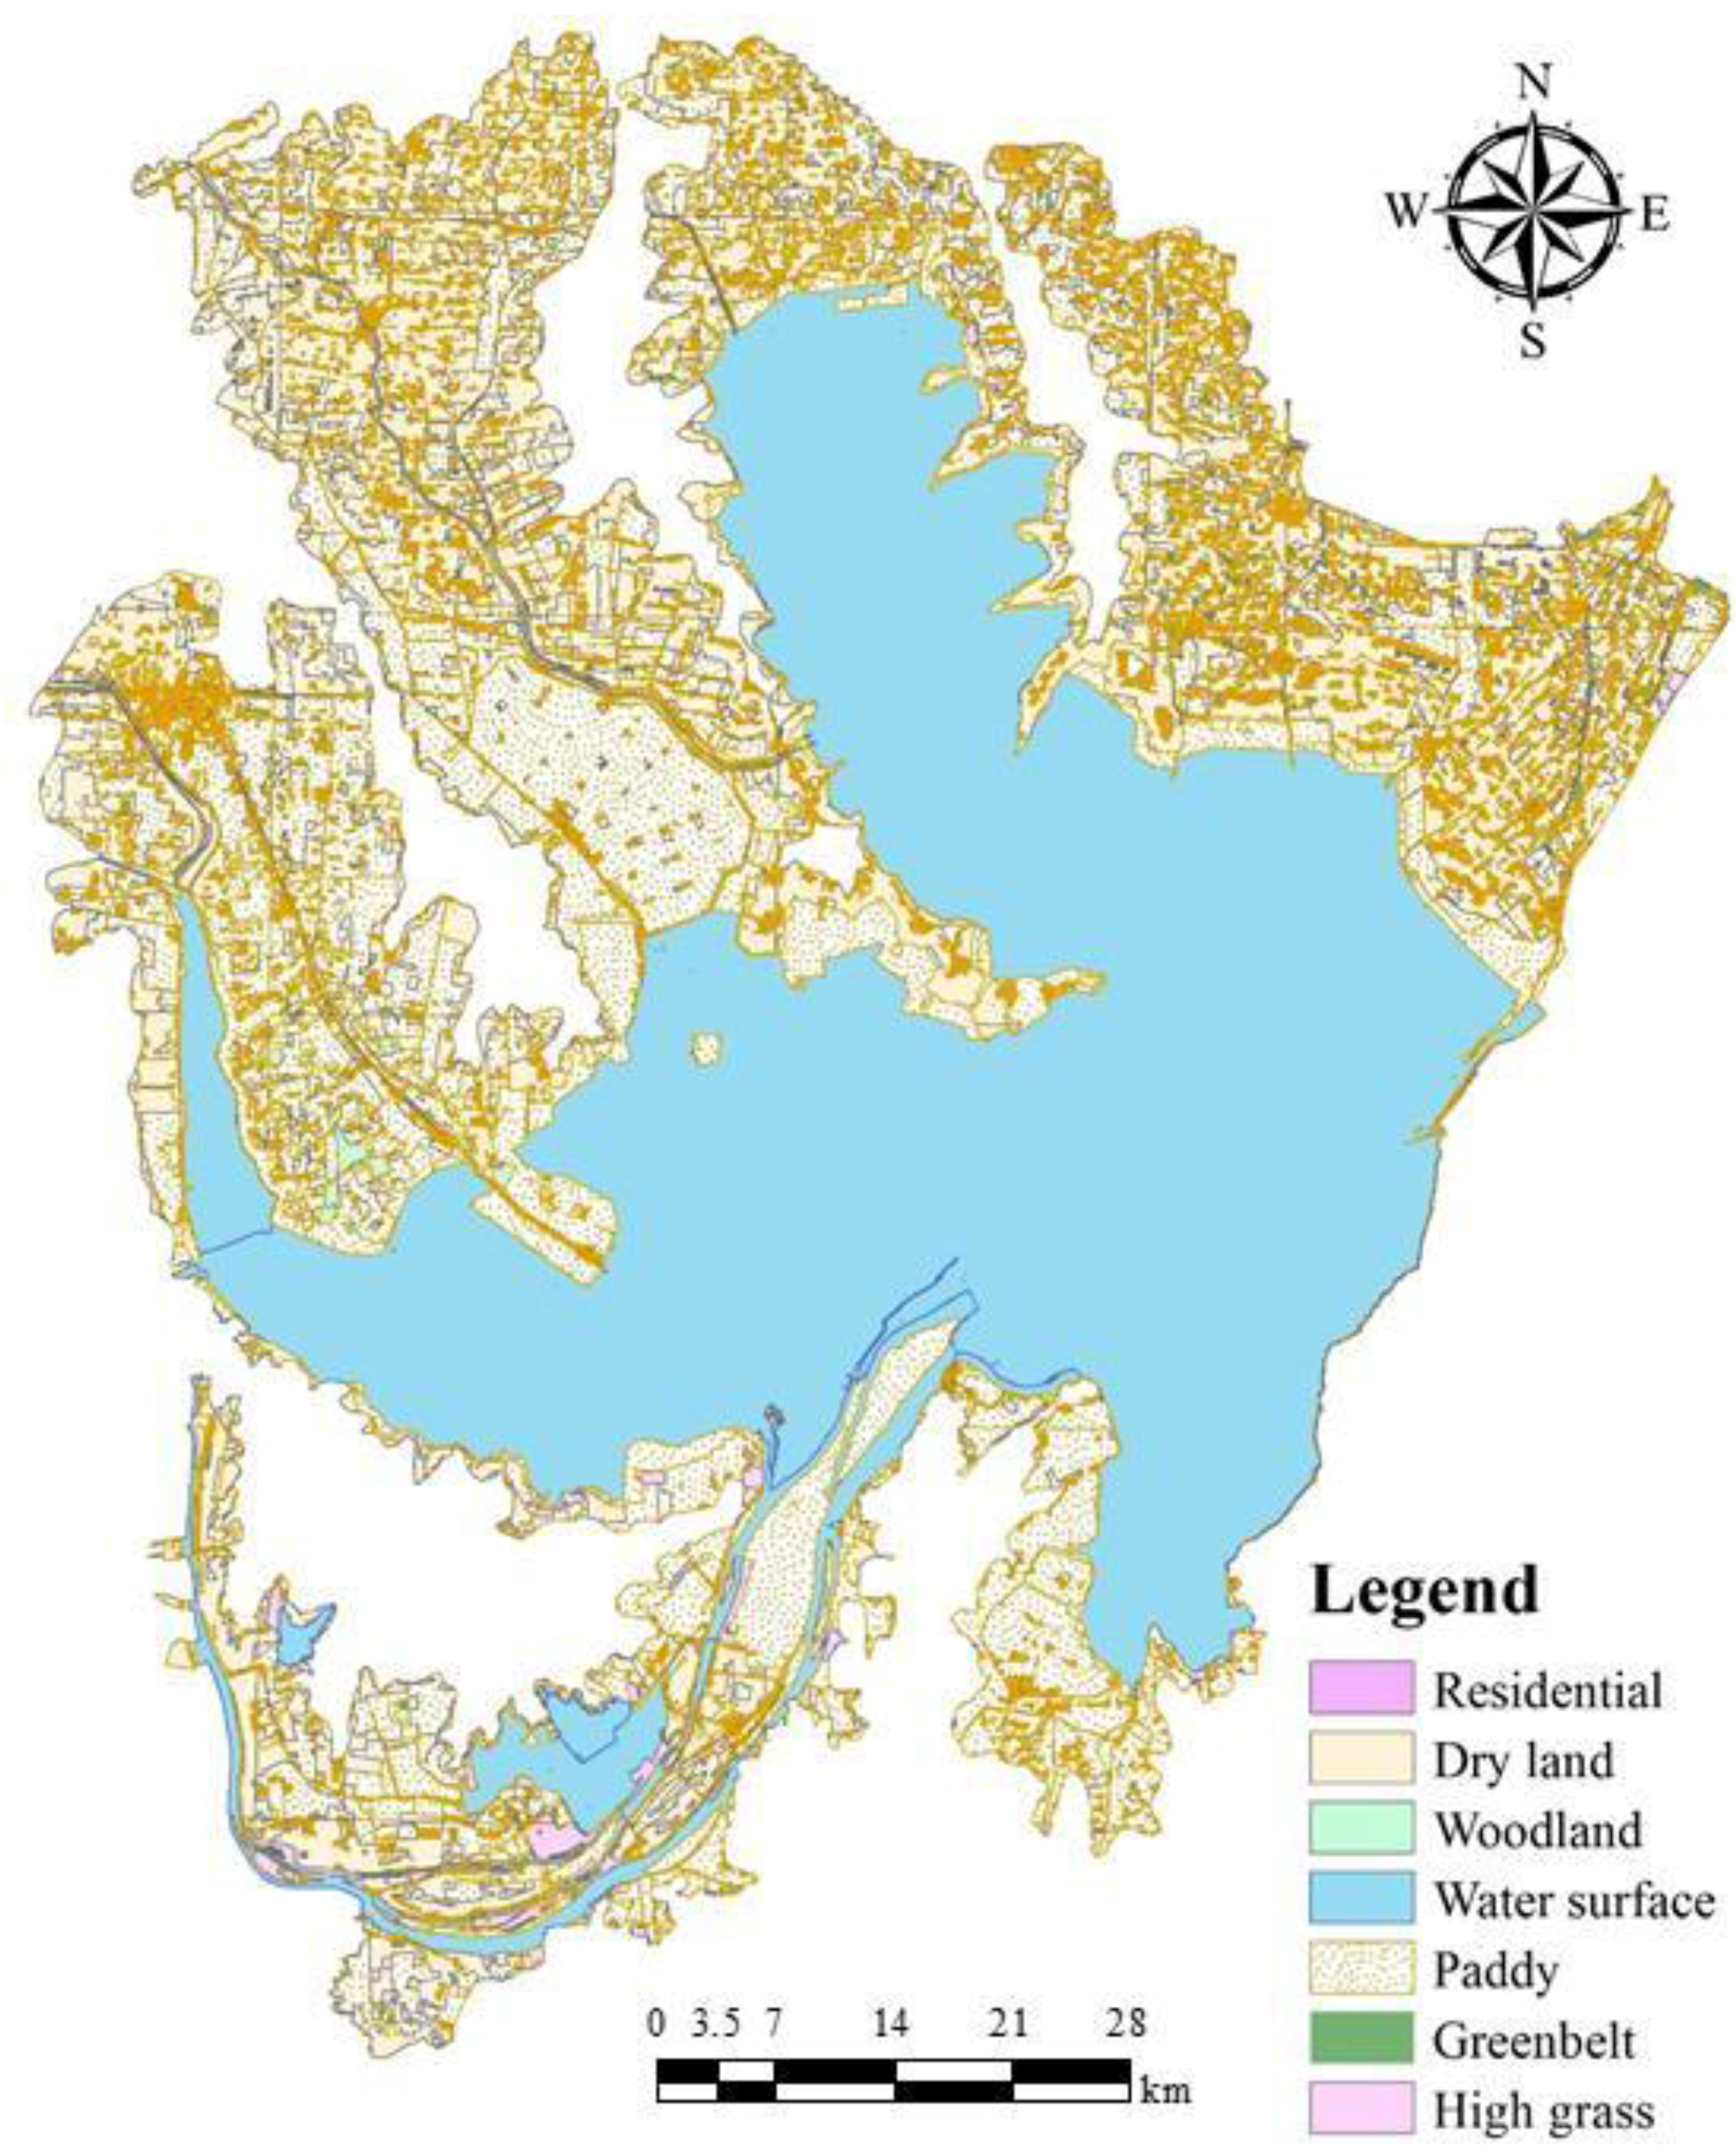
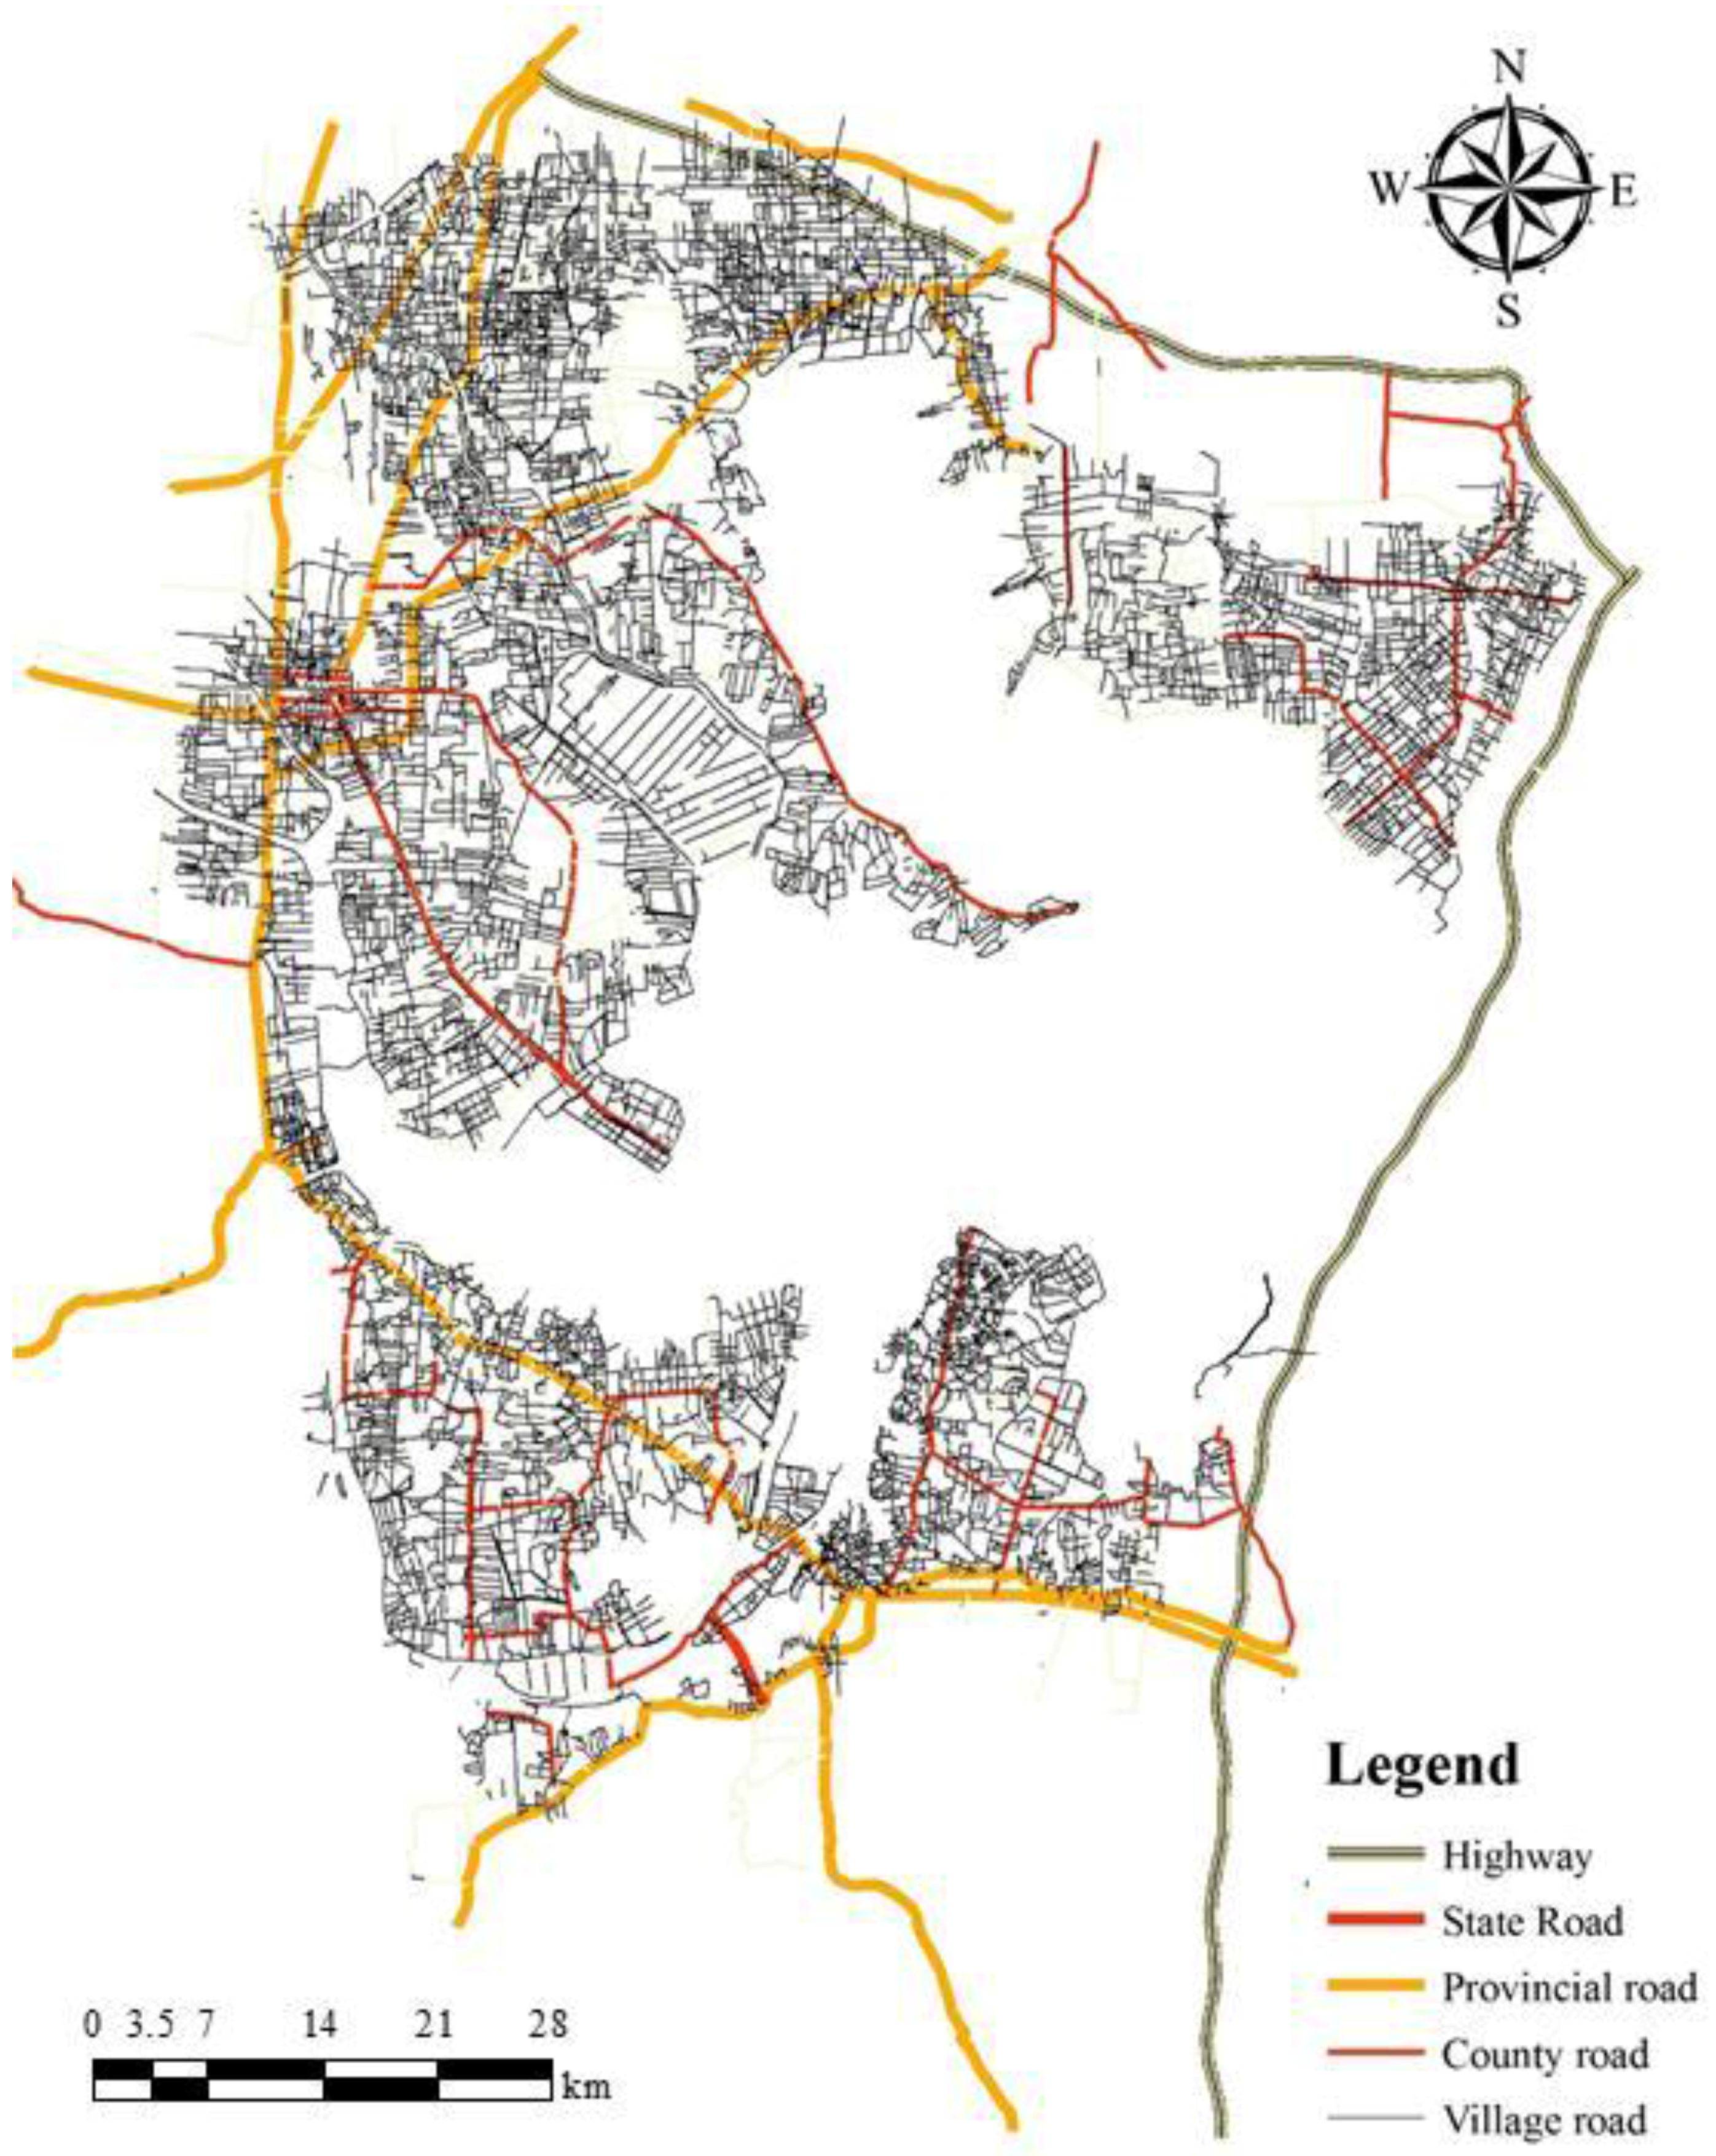
A topography map at 1:10,000 scale (
Figure 2) and high resolution 5 m × 5 m digital elevation model (DEM) was acquired, along with road data (
Figure 3). The roughness coefficients of the different types of underlying surface are listed in
Table 1.
2.2.3. Model Coupling
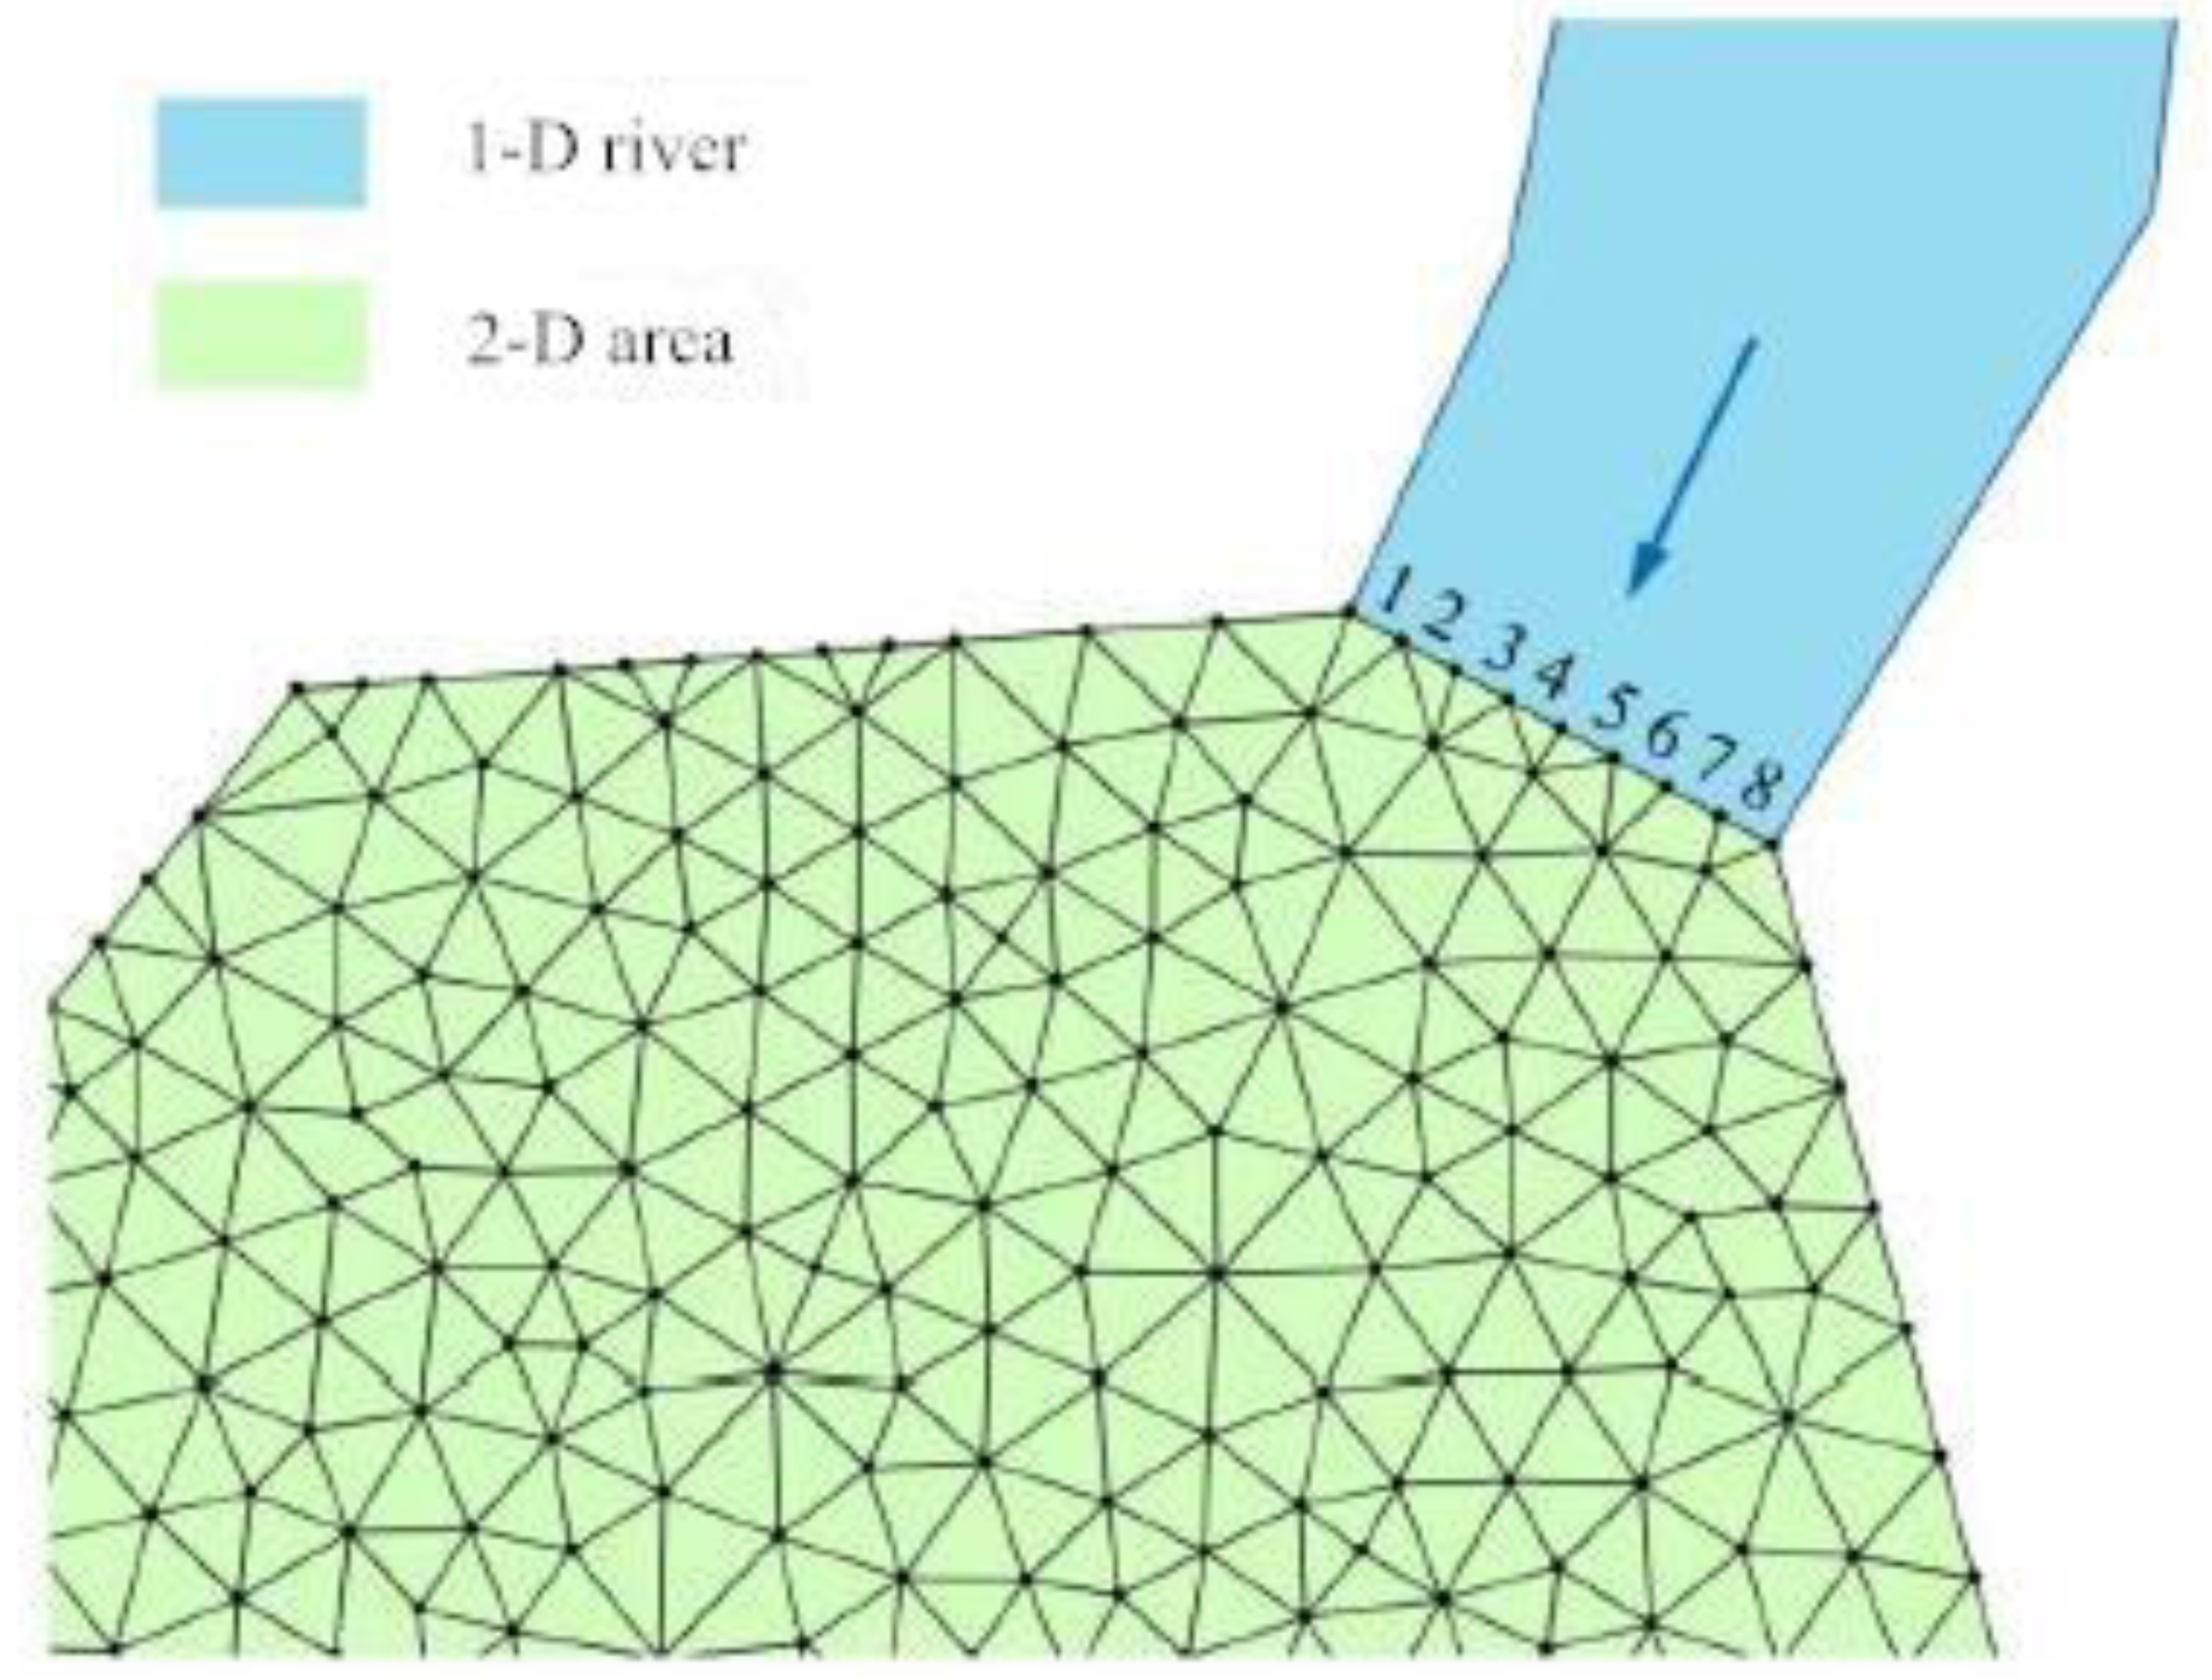
The two models are coupled by providing dynamic results for each other as boundary conditions. The discharge result along the coupling line from the one-dimensional model is used as the inflow condition of the two-dimensional model, while the mean water level resulting along the coupling line from the two-dimensional model is used as the water level condition of the one-dimensional model (
Figure 4).
2.2.4. Flood Loss Analysis Method
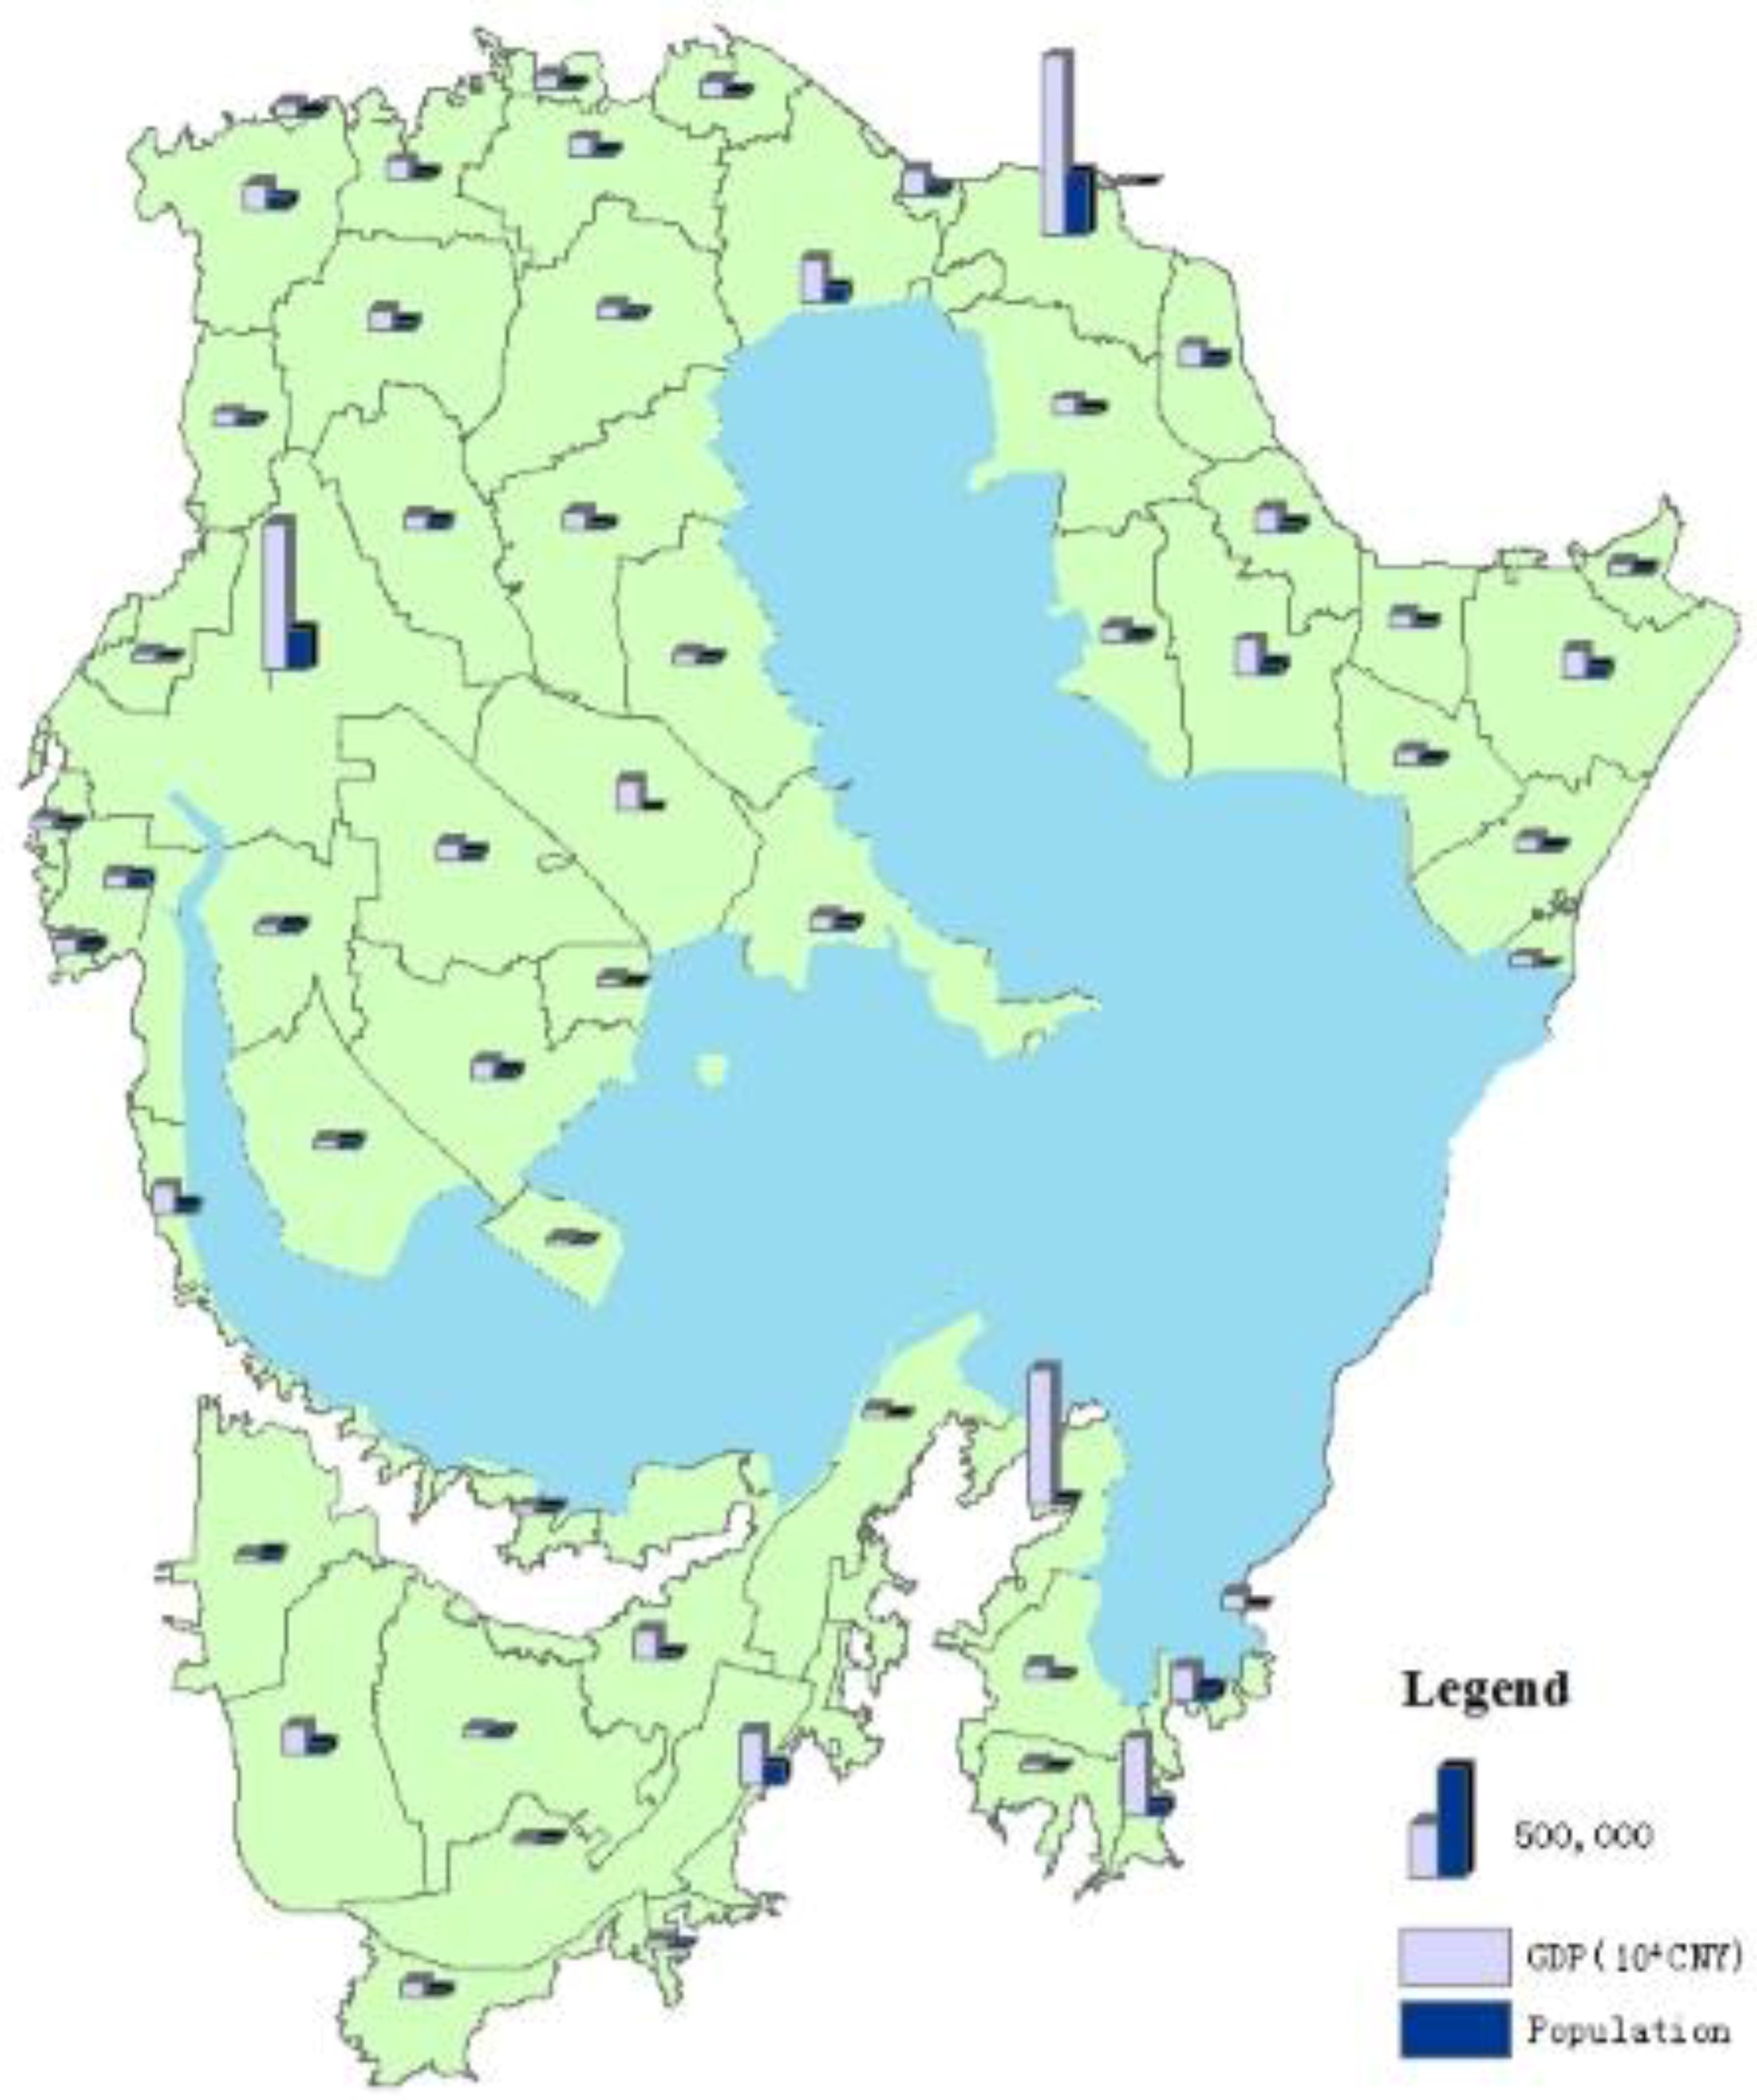
Social economic information about the study area was collected. The population and gross domestic product (GDP) of the study area was 4 million and 108 billion Chinese Yuan (1 CNY = 0.145 USD), respectively, in 2013. The distribution of GDP and the population is shown in
Figure 5. The calculation of flood loss was performed in a geographic information system (GIS) environment using ArcGIS software. All spatial data are represented in a raster cell format using the same spatial resolution as the input DEM. The flood depths simulated from the one- and two-dimensional hydrodynamic models, building data containing information about the property values of flood-prone buildings, and a depth–loss relationship relating the flood loss and water depths, were used in calculating flood damage. The process estimates flood loss considering five water depth classes (5–30, 30–50, 50–100, 100–200 and >200 cm) and six categories (household, housing, agriculture, industry, commerce, and roads). For all subcategories, a mean loss ratio was derived from the empirical data of private households affected by the flood in July 2007. This information is listed in
Table 2.
2.3. Special Treatments
2.3.1. Treatment of Flood Retarding Areas of Upstream and “Three Beaches”
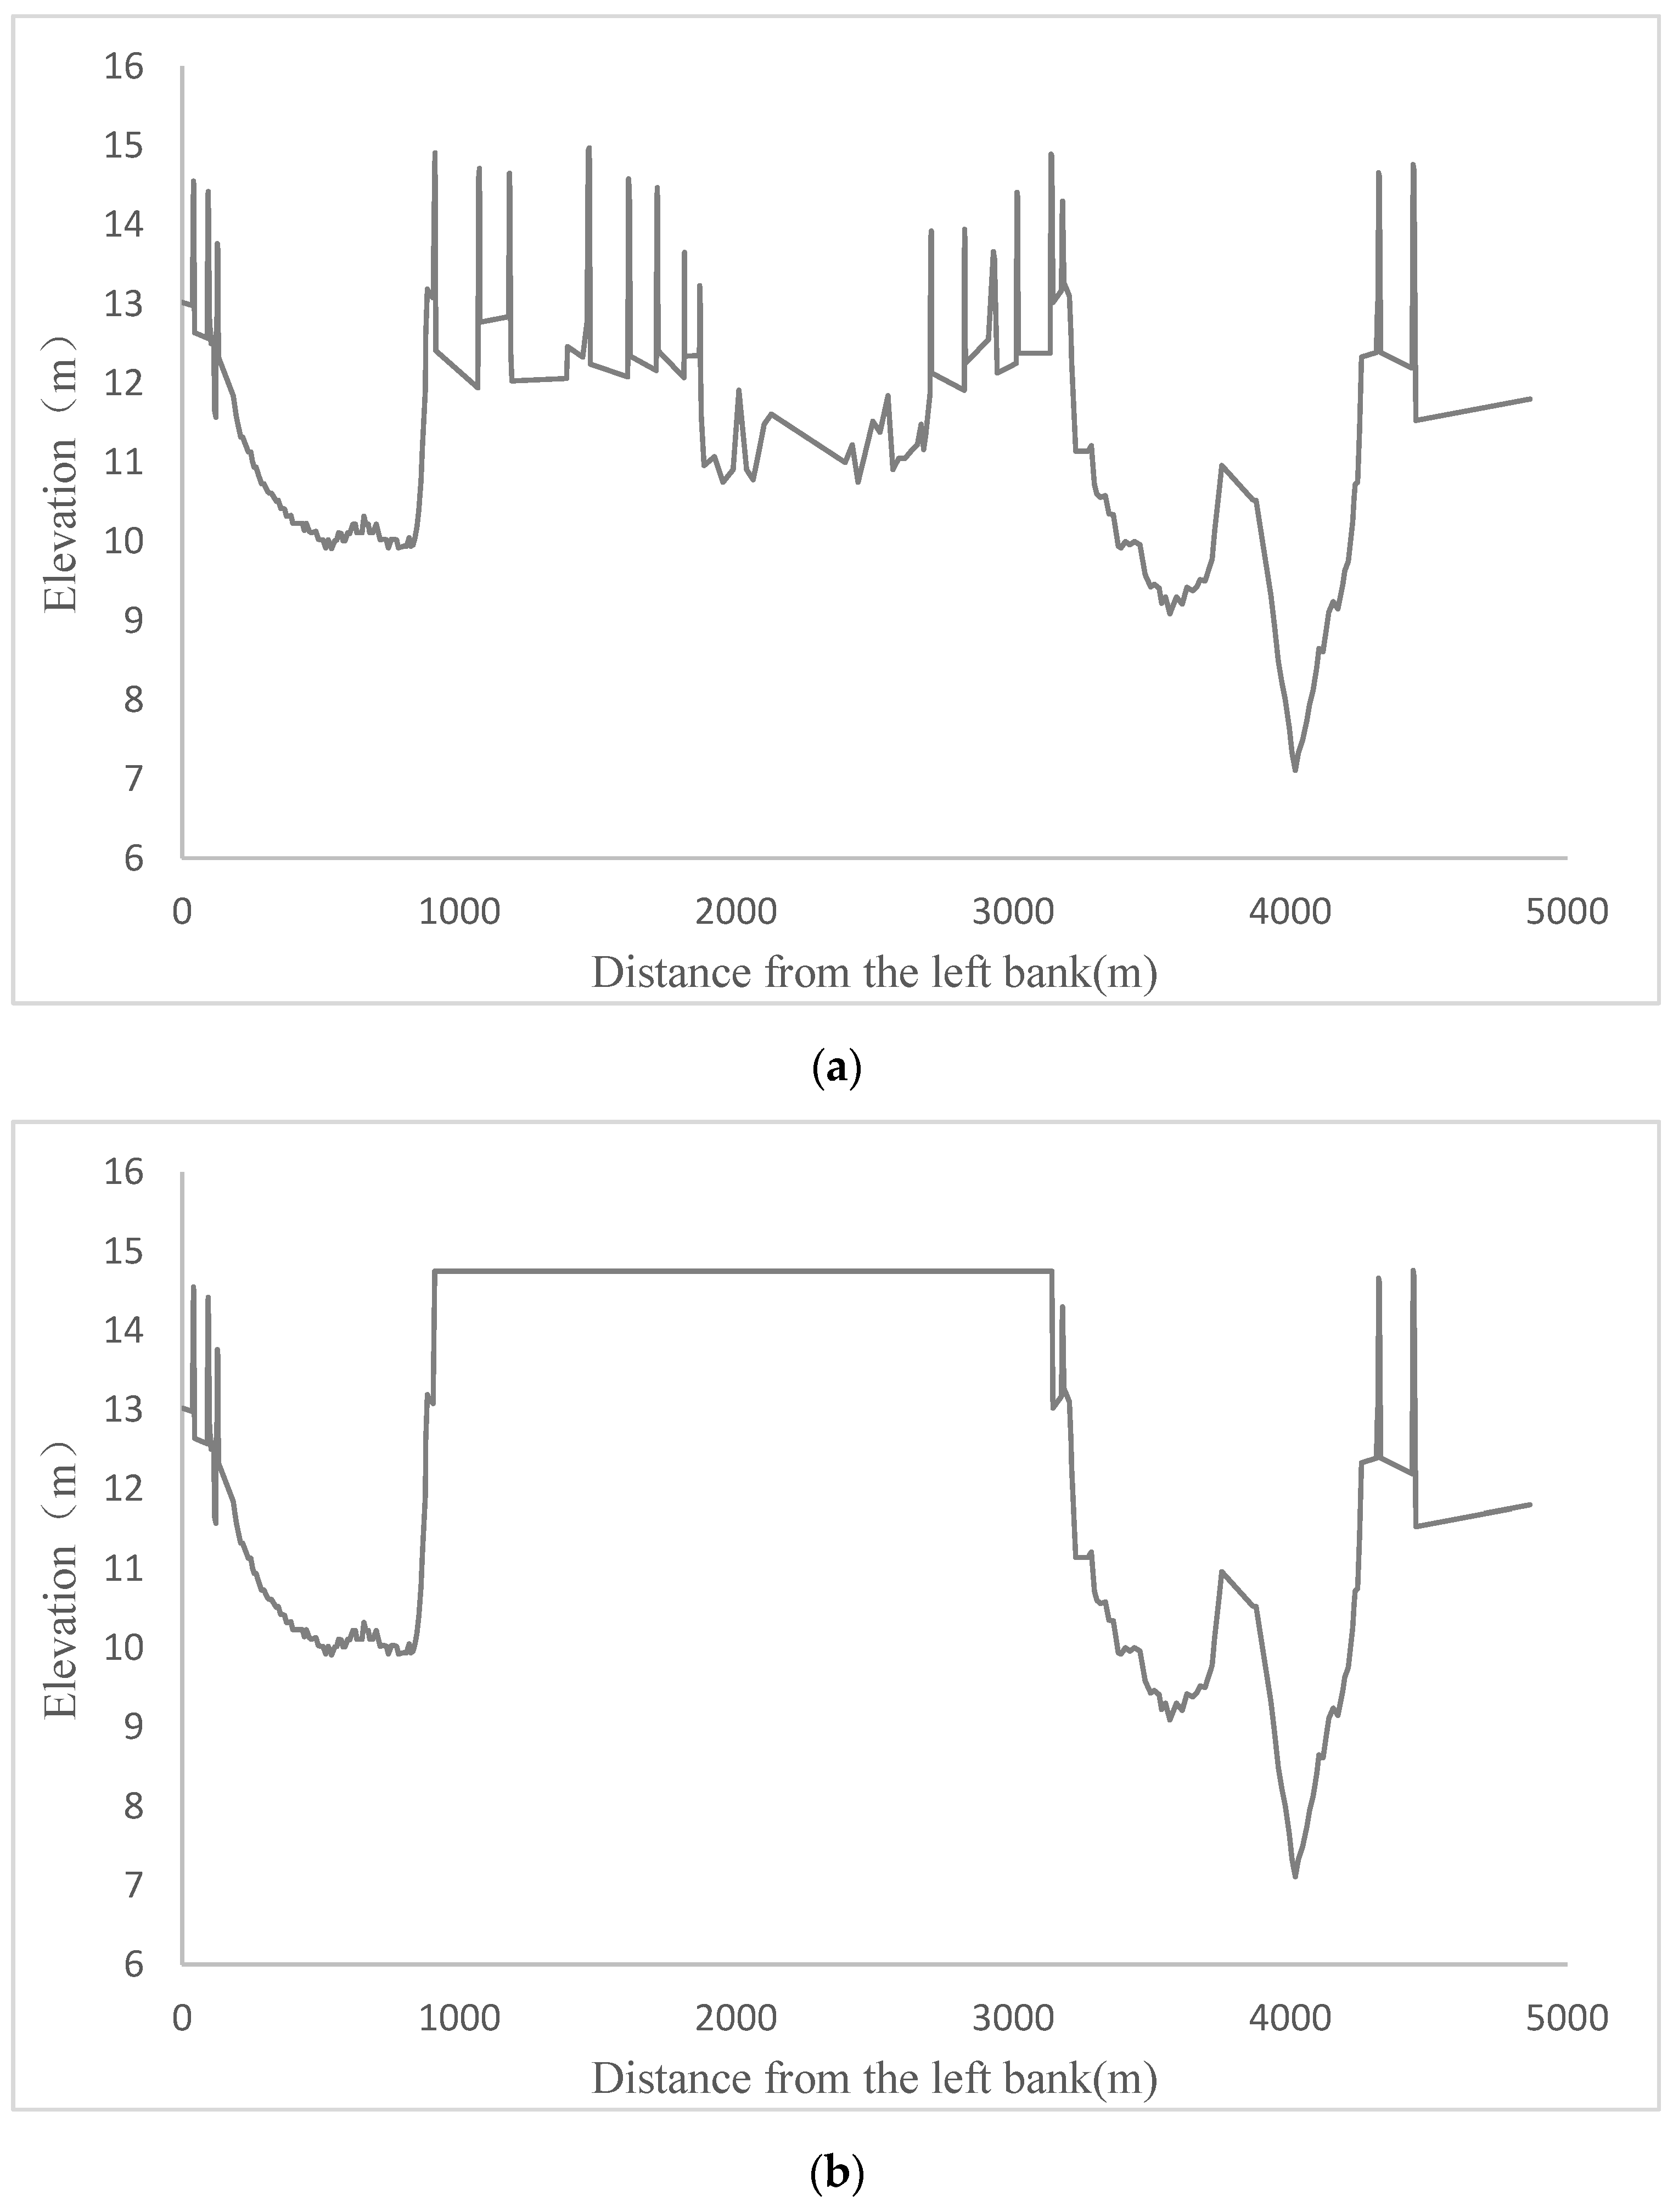
Bao-ji-wei and Pan-cun-wa flood retarding areas, which are located on opposite sides of the Huai River; and the “Three beaches”—which consist of Yao beach, Ha beach, and Chenggentan beach in the center of the Huai River—are considered in the model (
Figure 1). The operating regulation of the flood retarding area is that when the water level at Fushan station exceeds 17.97 m, six flood entrances open simultaneously. The treatment is to discretize the area into 2-D irregular grids, and this is connected with Huai River where the six flood entrances are located. For the condition of “Three beaches”, the area would be flooded only when the water level outside exceeds the elevation of the “Three beaches” embankment; so the treatment is to change the cross sections of Huai River at the “Three beaches” interval to be a line (
Figure 6), then discretize the area and connect it with the Huai River using a flood entrance that will open when the water level is higher than the crest elevation.
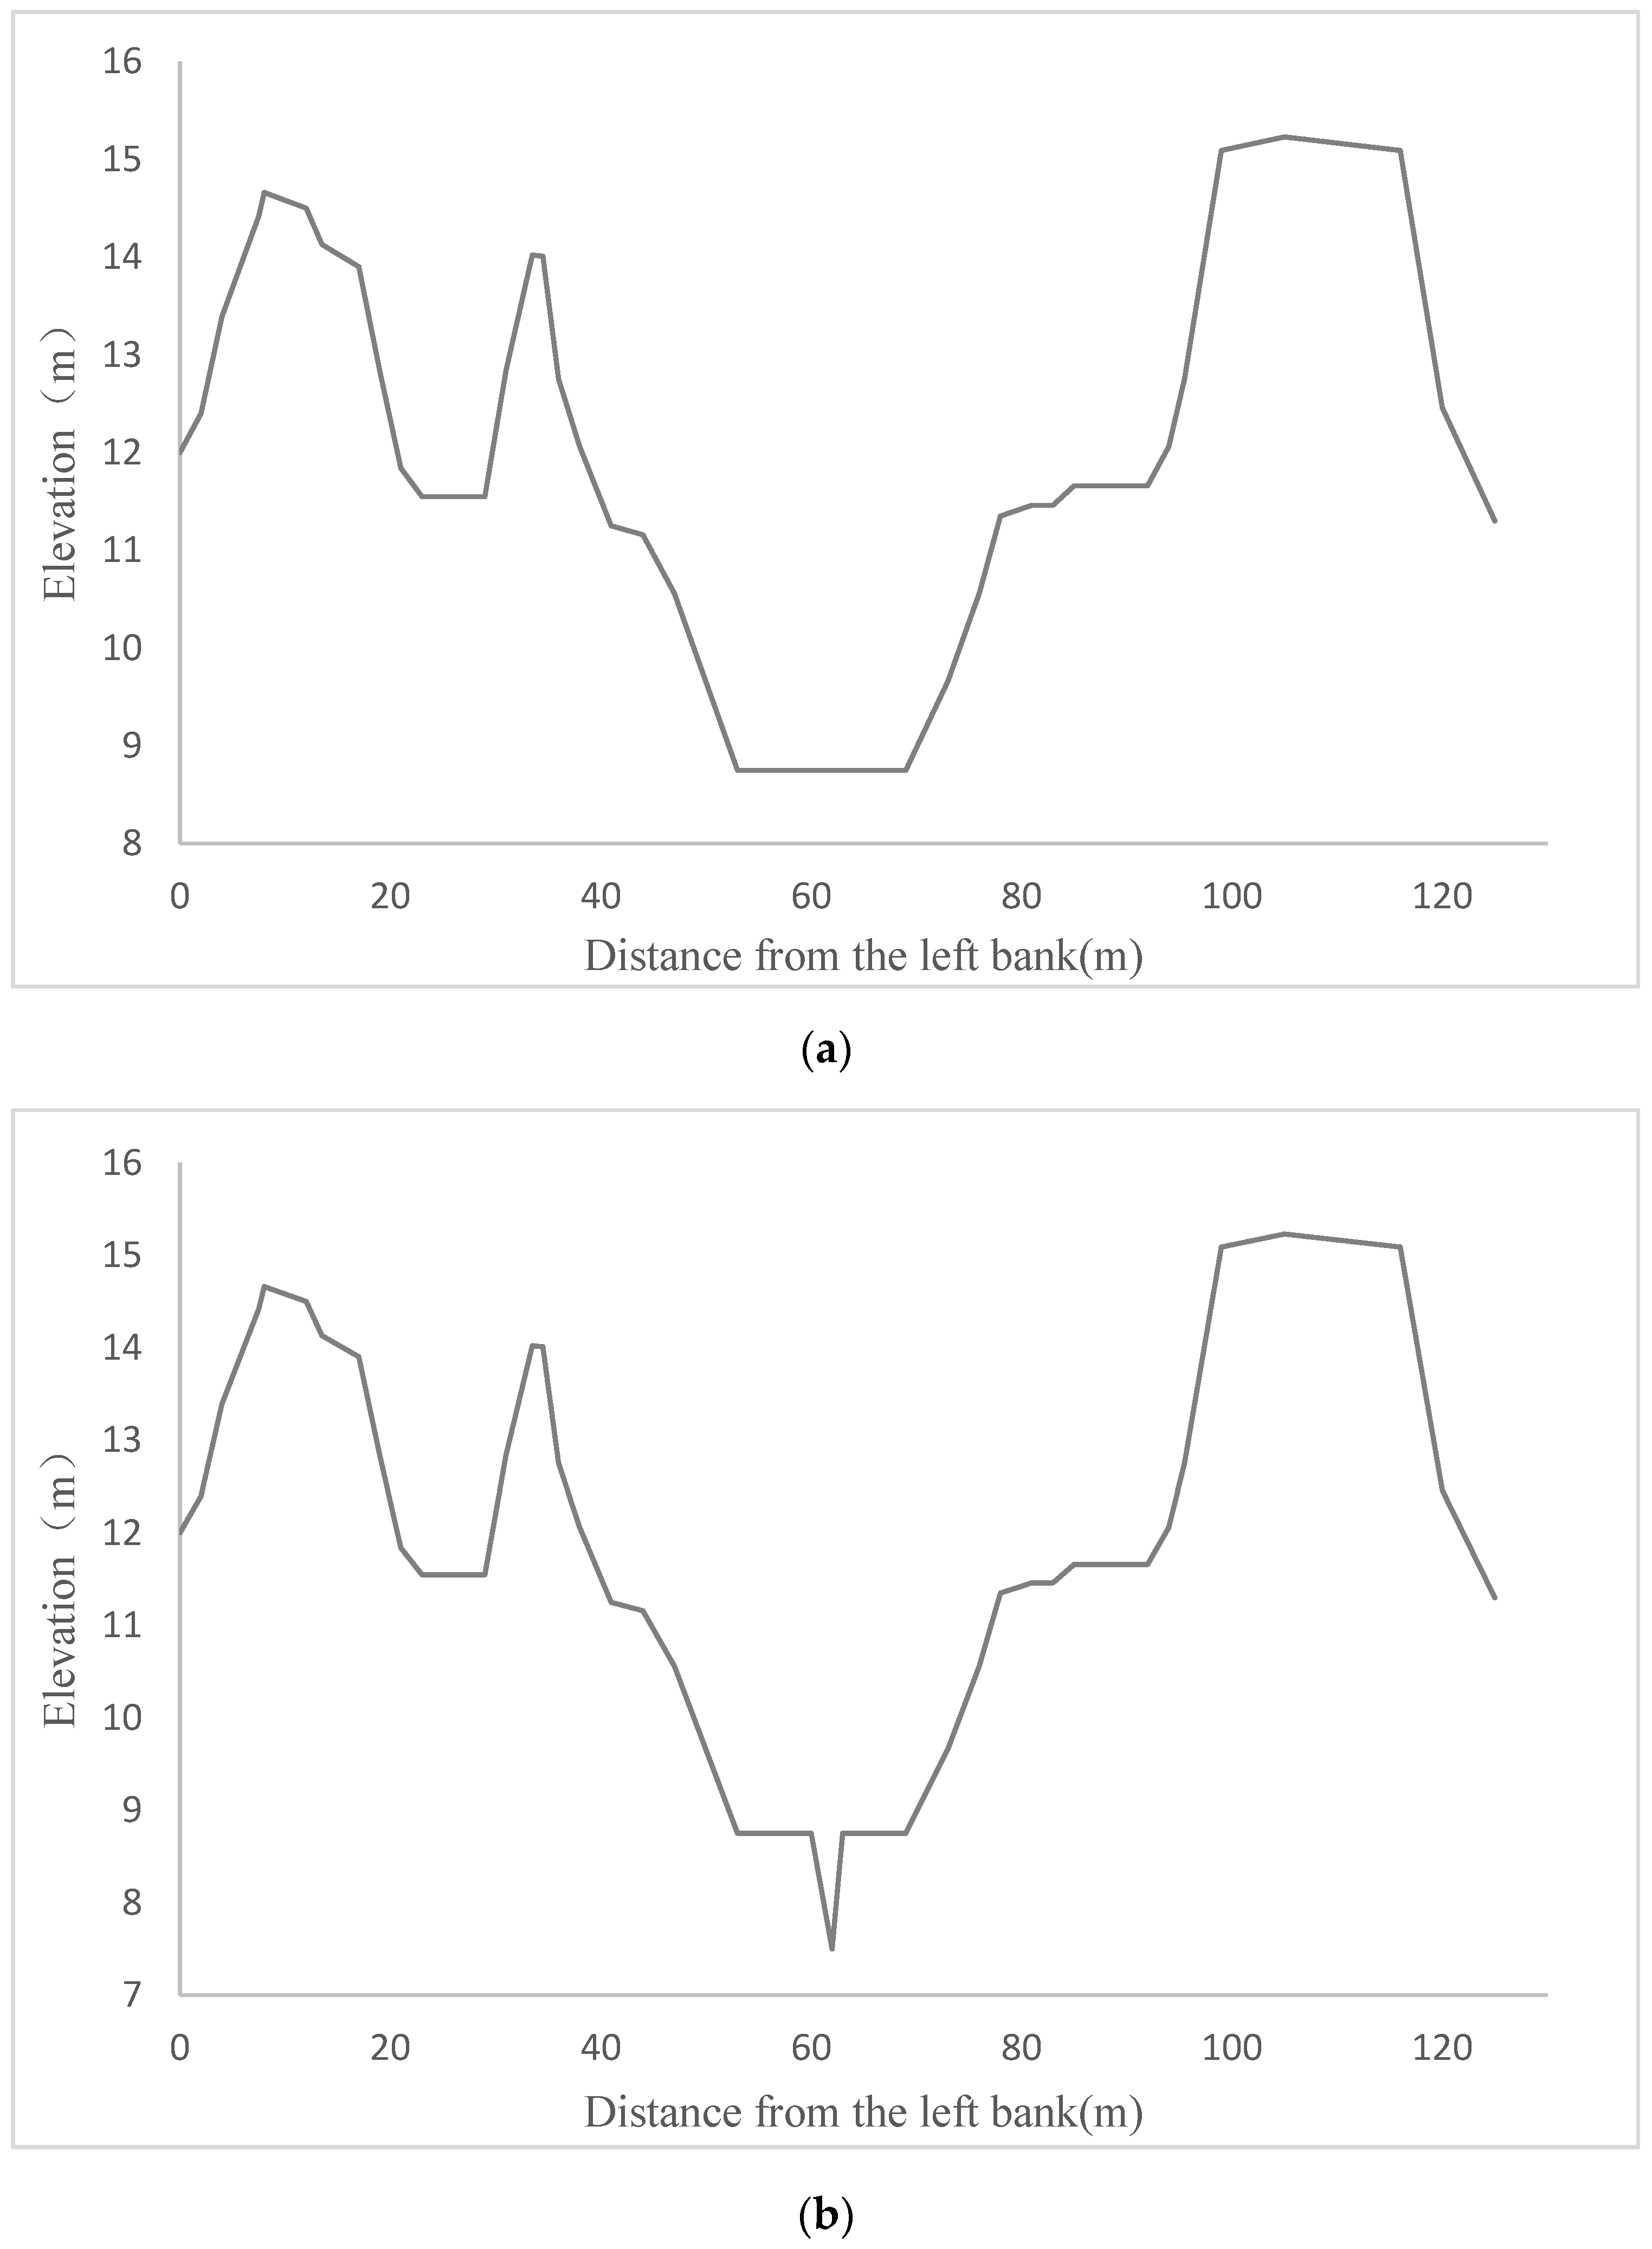
2.3.2. Treatment of the River Bottom Elevation
It is very common that the two bottom elevations of intersection cross-sections do not match, especially in plain river network areas such as the Hongze Lake area. The lack of consistent data on the cross-sections may lead to instability of the model. To circumvent this defect, the “Narrow Slit” method was introduced, which creates an inverted triangle of small width at the bottom of the higher cross-section to make the two bottoms have the same level (
Figure 7). One of the advantages of this strategy is that it only changes a small area of cross-section.
2.3.3. Polder Generalization and Joint Operation of Sluices and Pumps
One challenge in this study is how to generalize the polders. The other challenge is how to reasonably reflect the effect of hydraulic structures, because there are more than 300 polders in this area, and each polder may have multiple sluices and pumps. In the end, 314 polders were generalized and most of them had one generalized river. There is one sluice and one pump at the same place in each generalized river, of which the parameter was given value in relation to the real sluices and pumps after merge generalization. Sluices are operated as follows. First, they are fully opened when the water level in Hongze Lake exceeds 14.33 m to let the flood flow into the flood retarding area. Second, they fully open when the water level in Hongze Lake is <14.33 m and the water level in the flood retarding area is simultaneously higher than that of the adjacent river. This allows the water to flow out naturally. The pumps are operated so that it starts when the water level of Hongze Lake is below 14.33 m and the water level in the flood retarding area is lower than the level in the adjacent river.
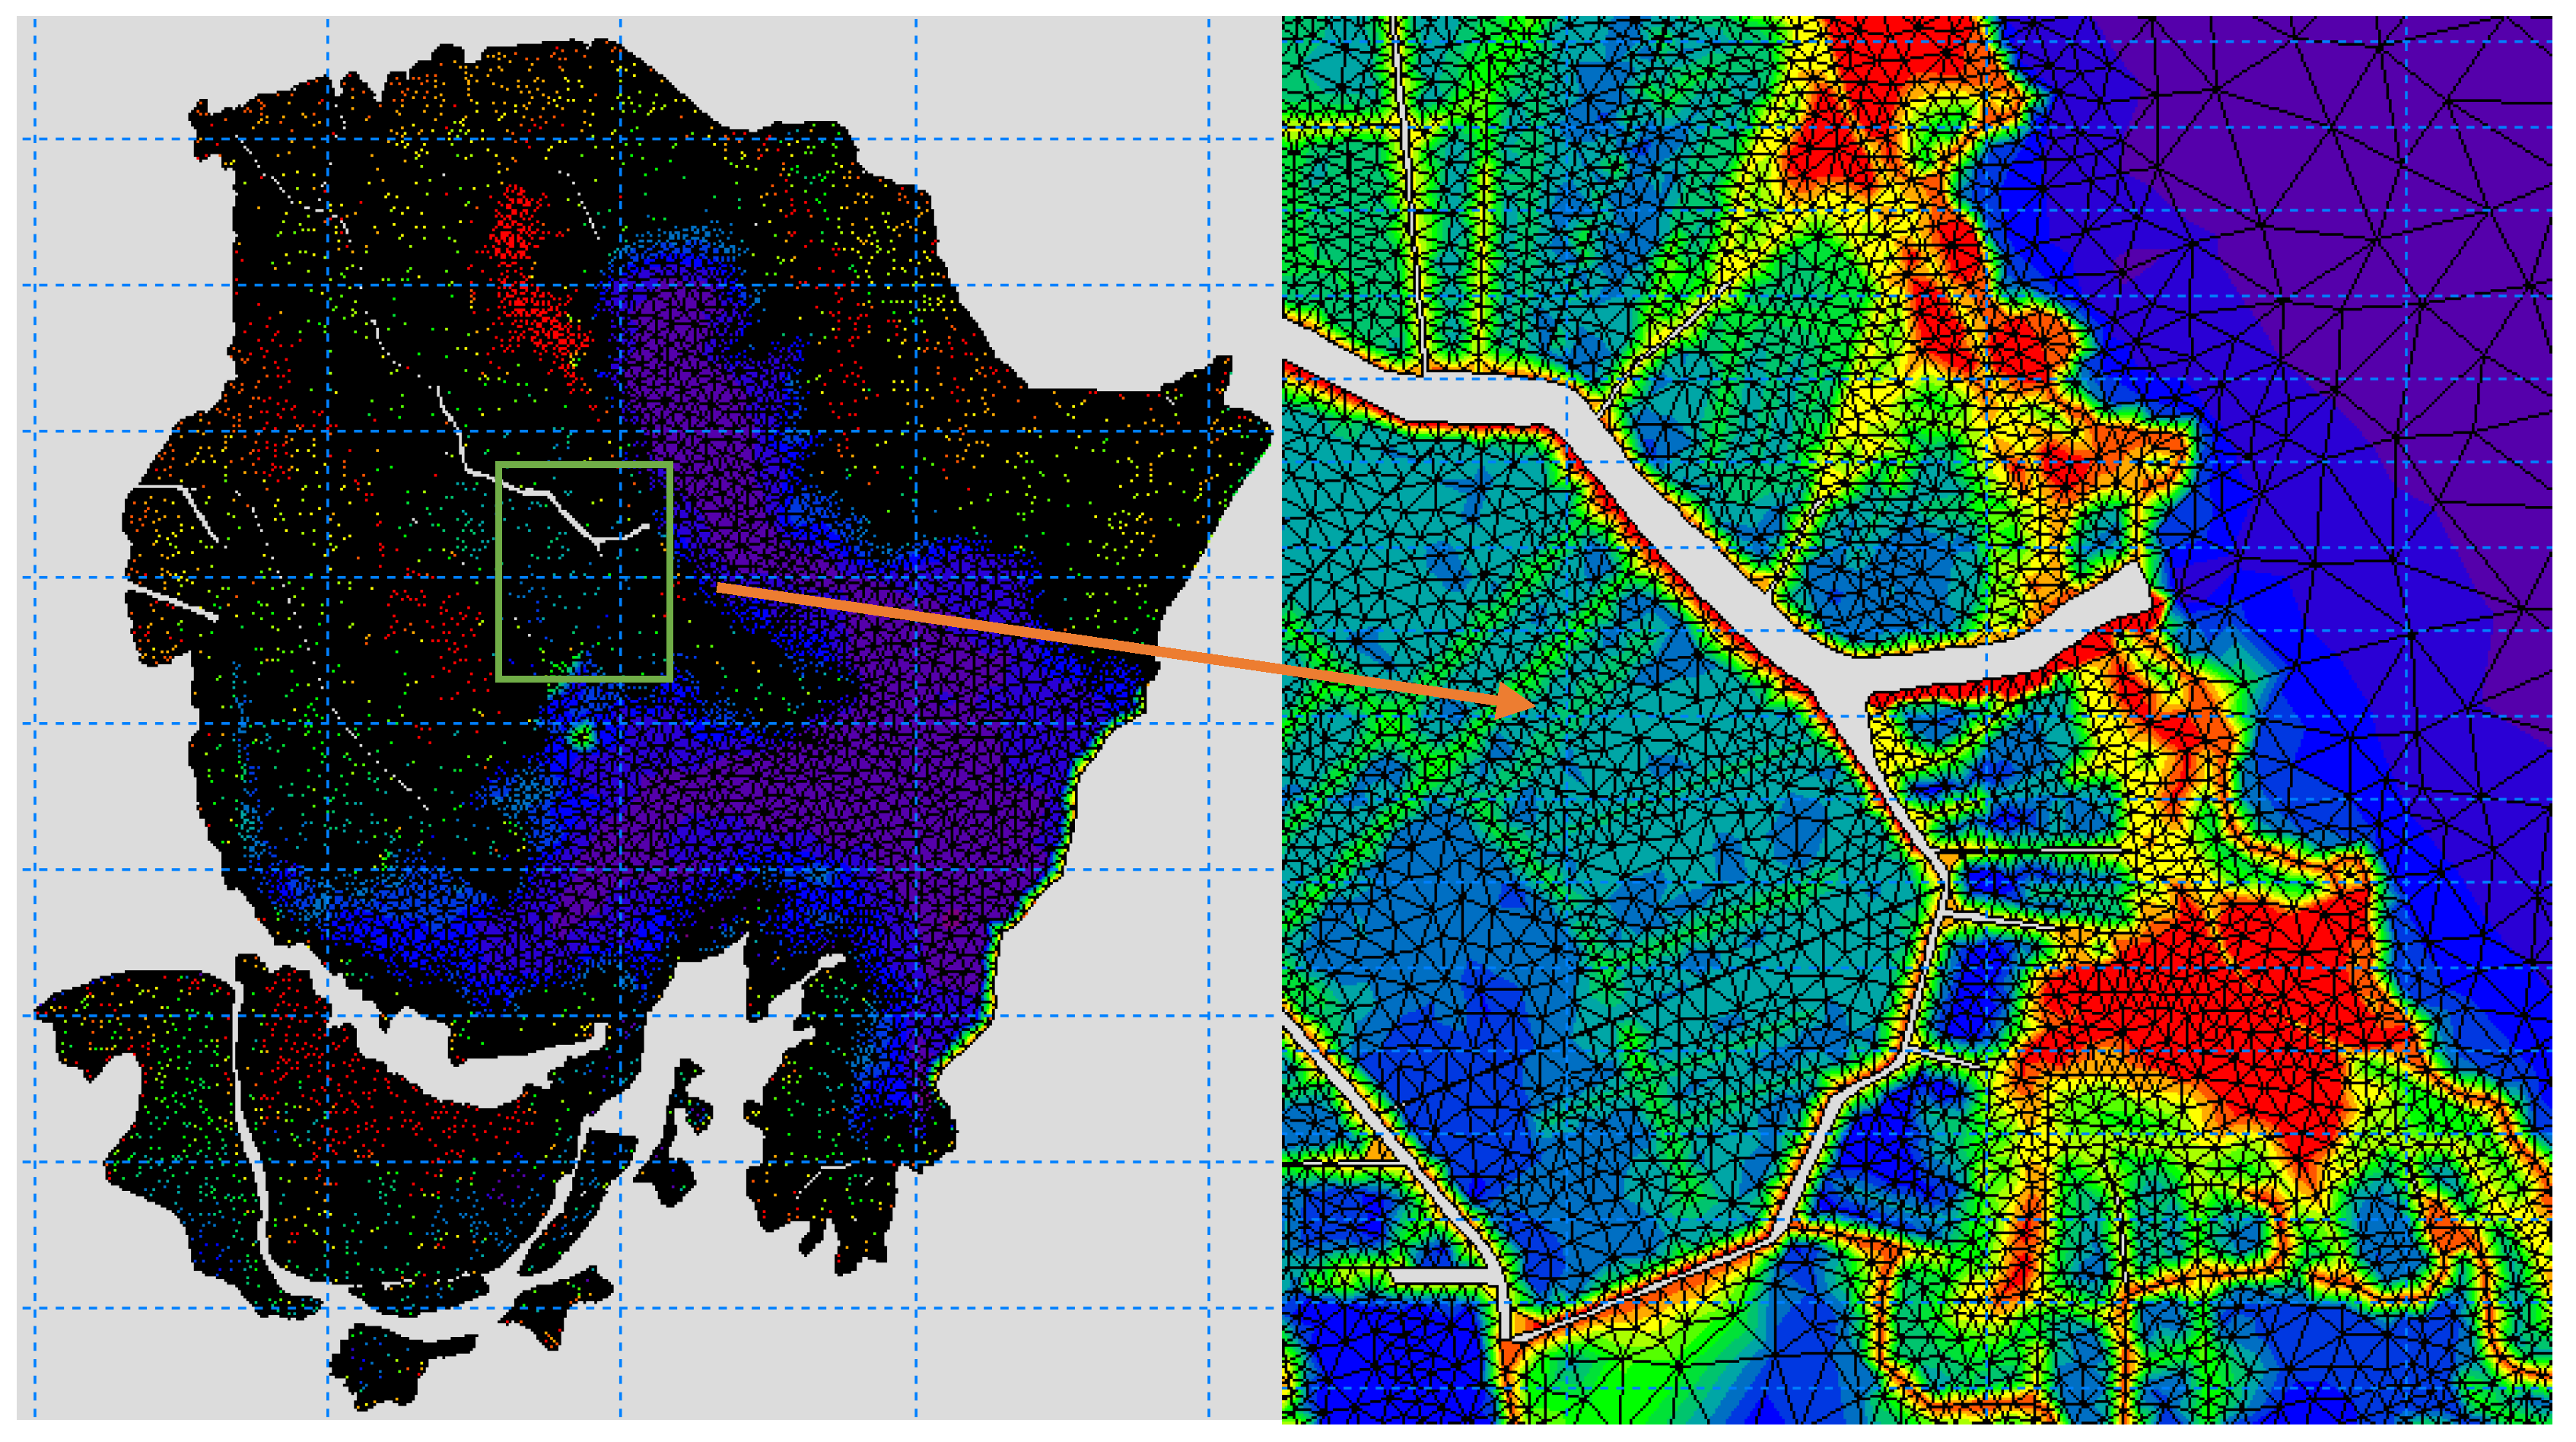
2.3.4. Treatment of the Two-Dimensional Grid
Different grid sizes were used to ensure both the computational cost and the accuracy of the model (
Figure 8). The number of nodes and elements were 48,665 and 85,894, respectively. The largest element was 1 km
2, and the smallest was 0.11 km
2. Different from the usual treatment of rivers in two-dimensional areas, the main rivers were removed from the flood retarding area grid so that the water volume would not be computed twice (once in the 1-D river and again in the 2-D grid).
2.3.5. Method of Drying/Wetting Depth Boundary
A drying/wetting boundary method was introduced to improve the effectiveness and stability of computation [
36,
37]. Grids were assessed by drying depth threshold and wetting depth threshold before computation at each time step. A grid is defined (1) as a drying grid when the water depth is below the drying depth threshold; (2) as a flooding grid when the water depth of this grid is between the drying depth and wetting depth thresholds; and (3) as a wetting grid when the water depth of this grid is above the wetting depth threshold. Drying grids are not considered in the computations, and only the conservation of mass is counted for flooding grids. For wetting grids, both the continuity equation and momentum equation are used.
2.4. Flood Retarding Schemes
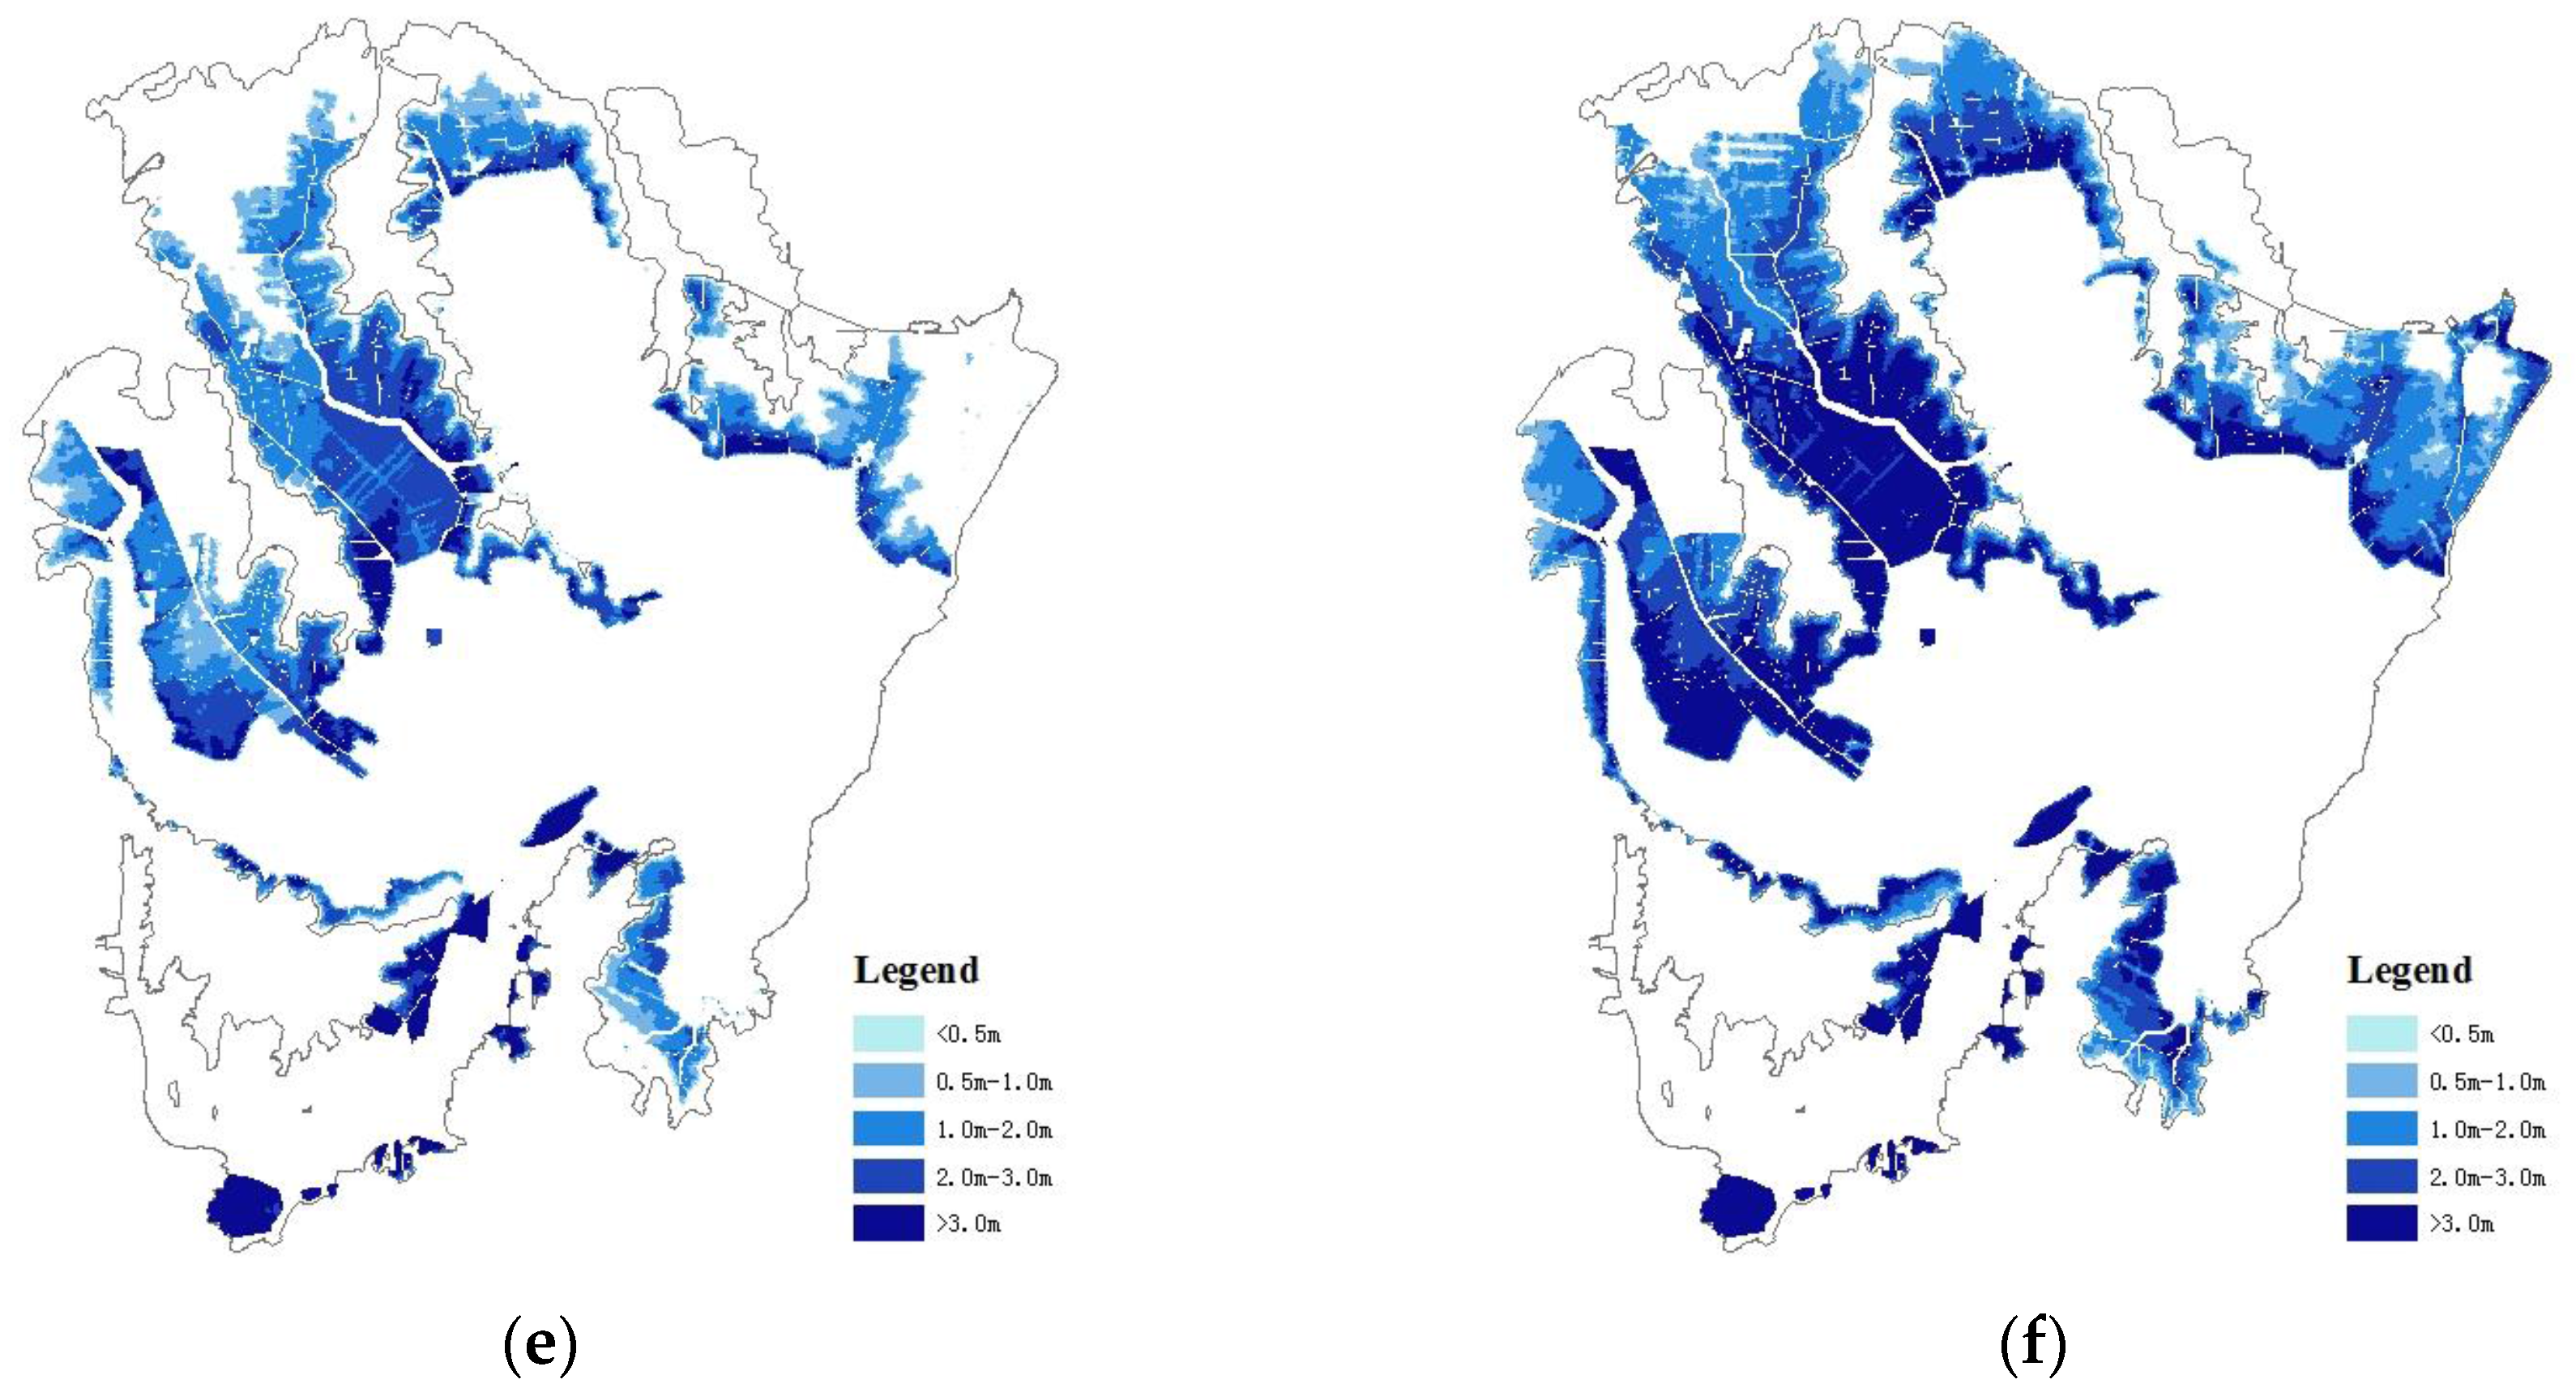
We designed 15 schemes that included a “no flood retarding” scheme, a “no grading flood retarding” scheme, and three “graded flood retarding” schemes for
p = 1%, 0.33% and 0.05% flood events to discuss the three topics mentioned earlier. Here,
p represents the probability of a flood event equal to or greater than that considered, and
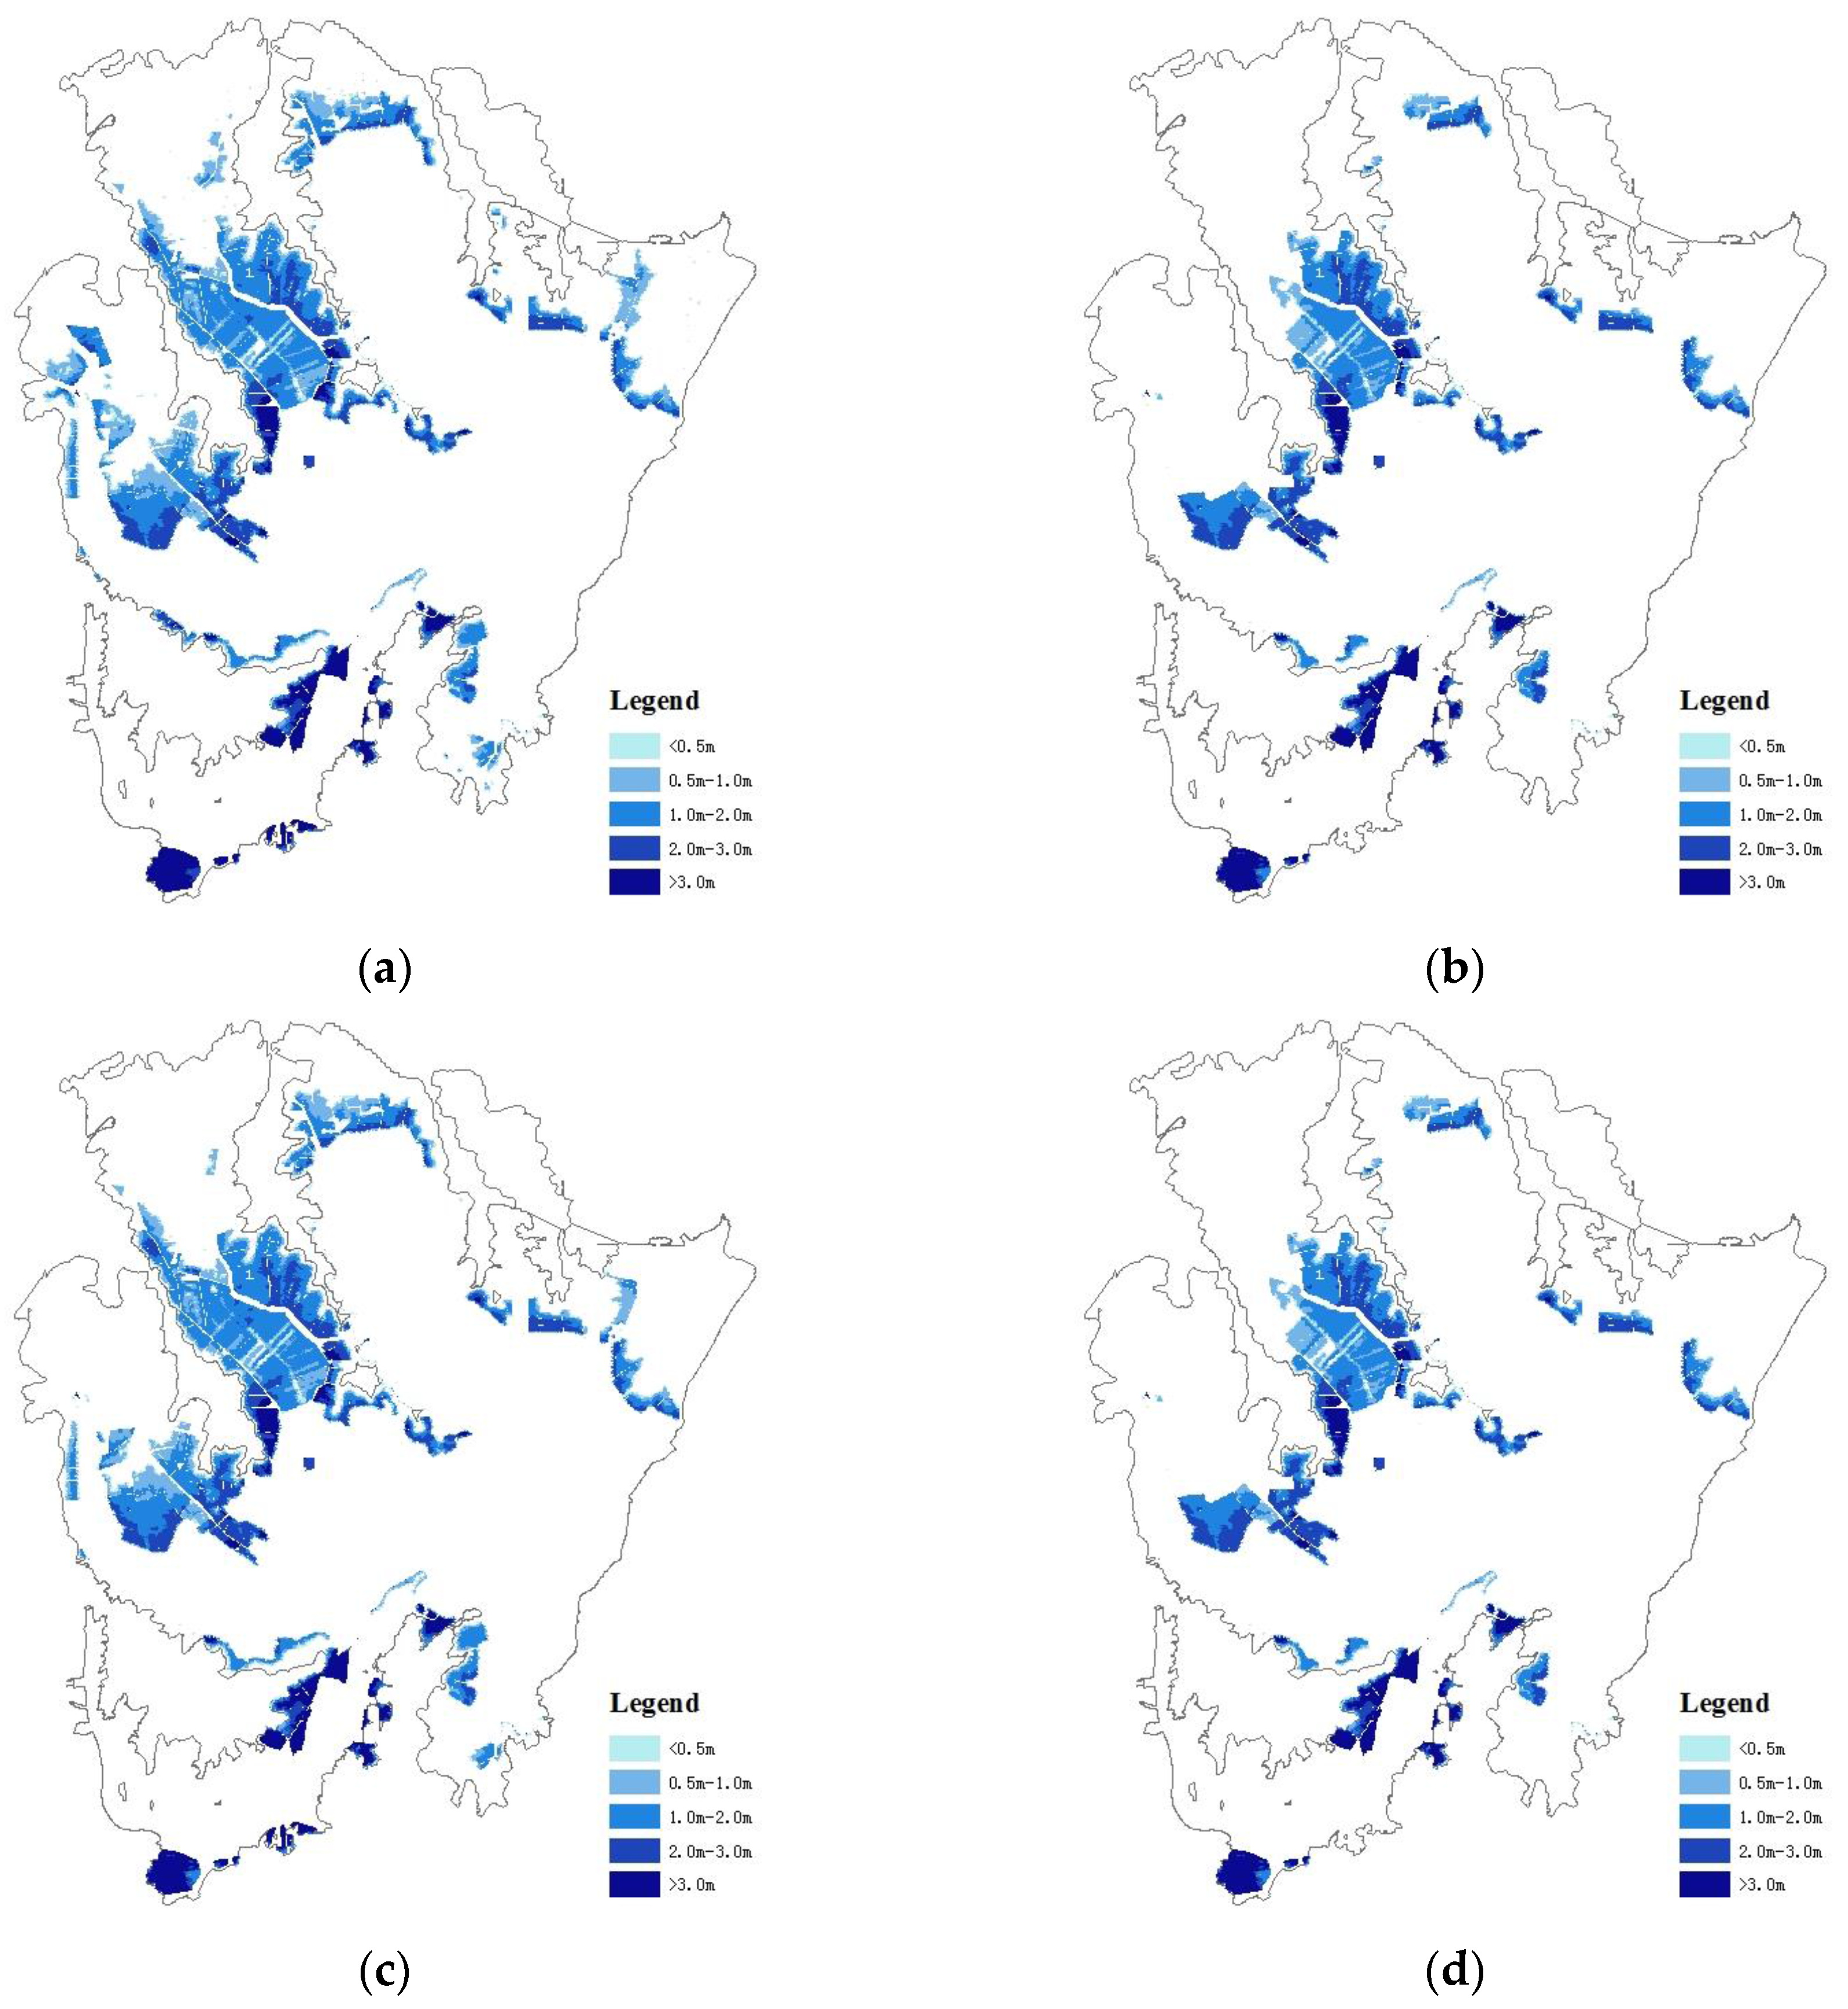
p = 1% means that the expected return period of such a flood event is one hundred years. The “no flood retarding” scheme means that the flood retarding area is not used at all. The “no grading flood retarding” scheme is the existing operation scheme in which all the polders are used for flood retarding when the water level of Hongze Lake exceeds 14.33 m. Three “graded flood retarding” schemes are designed based on the existing operating scheme, the consideration of topography, and the distribution of the population and economy. Graded flood retarding Scheme 1: The polders at elevation <13.33 m are opened for flood retarding when the water level in Hongze Lake exceeds 14.33 m, and all are utilized when the water level in Hongze Lake exceeds 15.03 m. Graded flood retarding Scheme 2: The polders at elevations <14.33 m are used for flood retarding when the water level in Hongze Lake exceeds 14.33 m, and all polders are used when the water level of Hongze Lake exceeds 15.03 m. Graded flood retarding Scheme 3: The polders at elevations <13.33 m are used for flood retarding when the water level in Hongze Lake exceeds 14.33 m, and the polders between 13.33 and 15.03 m elevation are used for flood retarding when the water level in Hongze Lake exceeds 15.03 m. All polders are used when the water level in Hongze Lake exceeds 15.83 m. The distribution of the polders in the “no grading flood retarding” scheme and the three “graded flood retarding” schemes is shown in
Figure 9. The design inflow process for Hongze Lake—which was proposed by China Water Huaihe Planning and Research in 1996—was applied as the upper boundary of the model (
Table 3), while the relationship curves of the water level and discharge of the outflows based on the second-phase project of CIS was applied as the lower boundary (
Table 4).
4. Discussion
4.1. Necessity for Flood Retarding
It is obvious that flood retarding is very effective, according to the results from
Table 6. Without using the flood retarding area, the HWLOH would reach 15.17, 15.91, and 18.25 m for
p = 1%, 0.33%, and 0.05% floods, respectively. The design flood level and check flood level of Hongze Lake is 15.83 and 16.83 m, respectively. Therefore, there exists a major risk to downstream areas such as Yangzhou, Taizhou, and Lixiahe, caused by the potential hazard of dam-break floods of Hongze Lake. As proposed by NHRI, if a
p = 0.33% dam-break flood event happens at CIYR, the flood loss is estimated to be approximately 150 billion CNY, which is 10 times more than the capacity of the flood retarding area. This takes the flood retarding effectiveness into consideration and only considers the Lixiahe area. In other words, if the flood retarding area is not used and all of the downstream areas are considered, the flood loss would be much larger than 150 billion CNY. It is essential to be able to use the flood retarding area. Although flood retarding would bring a flood risk to the flood retarding area, the flood loss is much smaller than what would occur in downstream areas. The flood risk to downstream areas could clearly be reduced by having a flood retarding area.
4.2. Necessity for Graded Flood Retarding
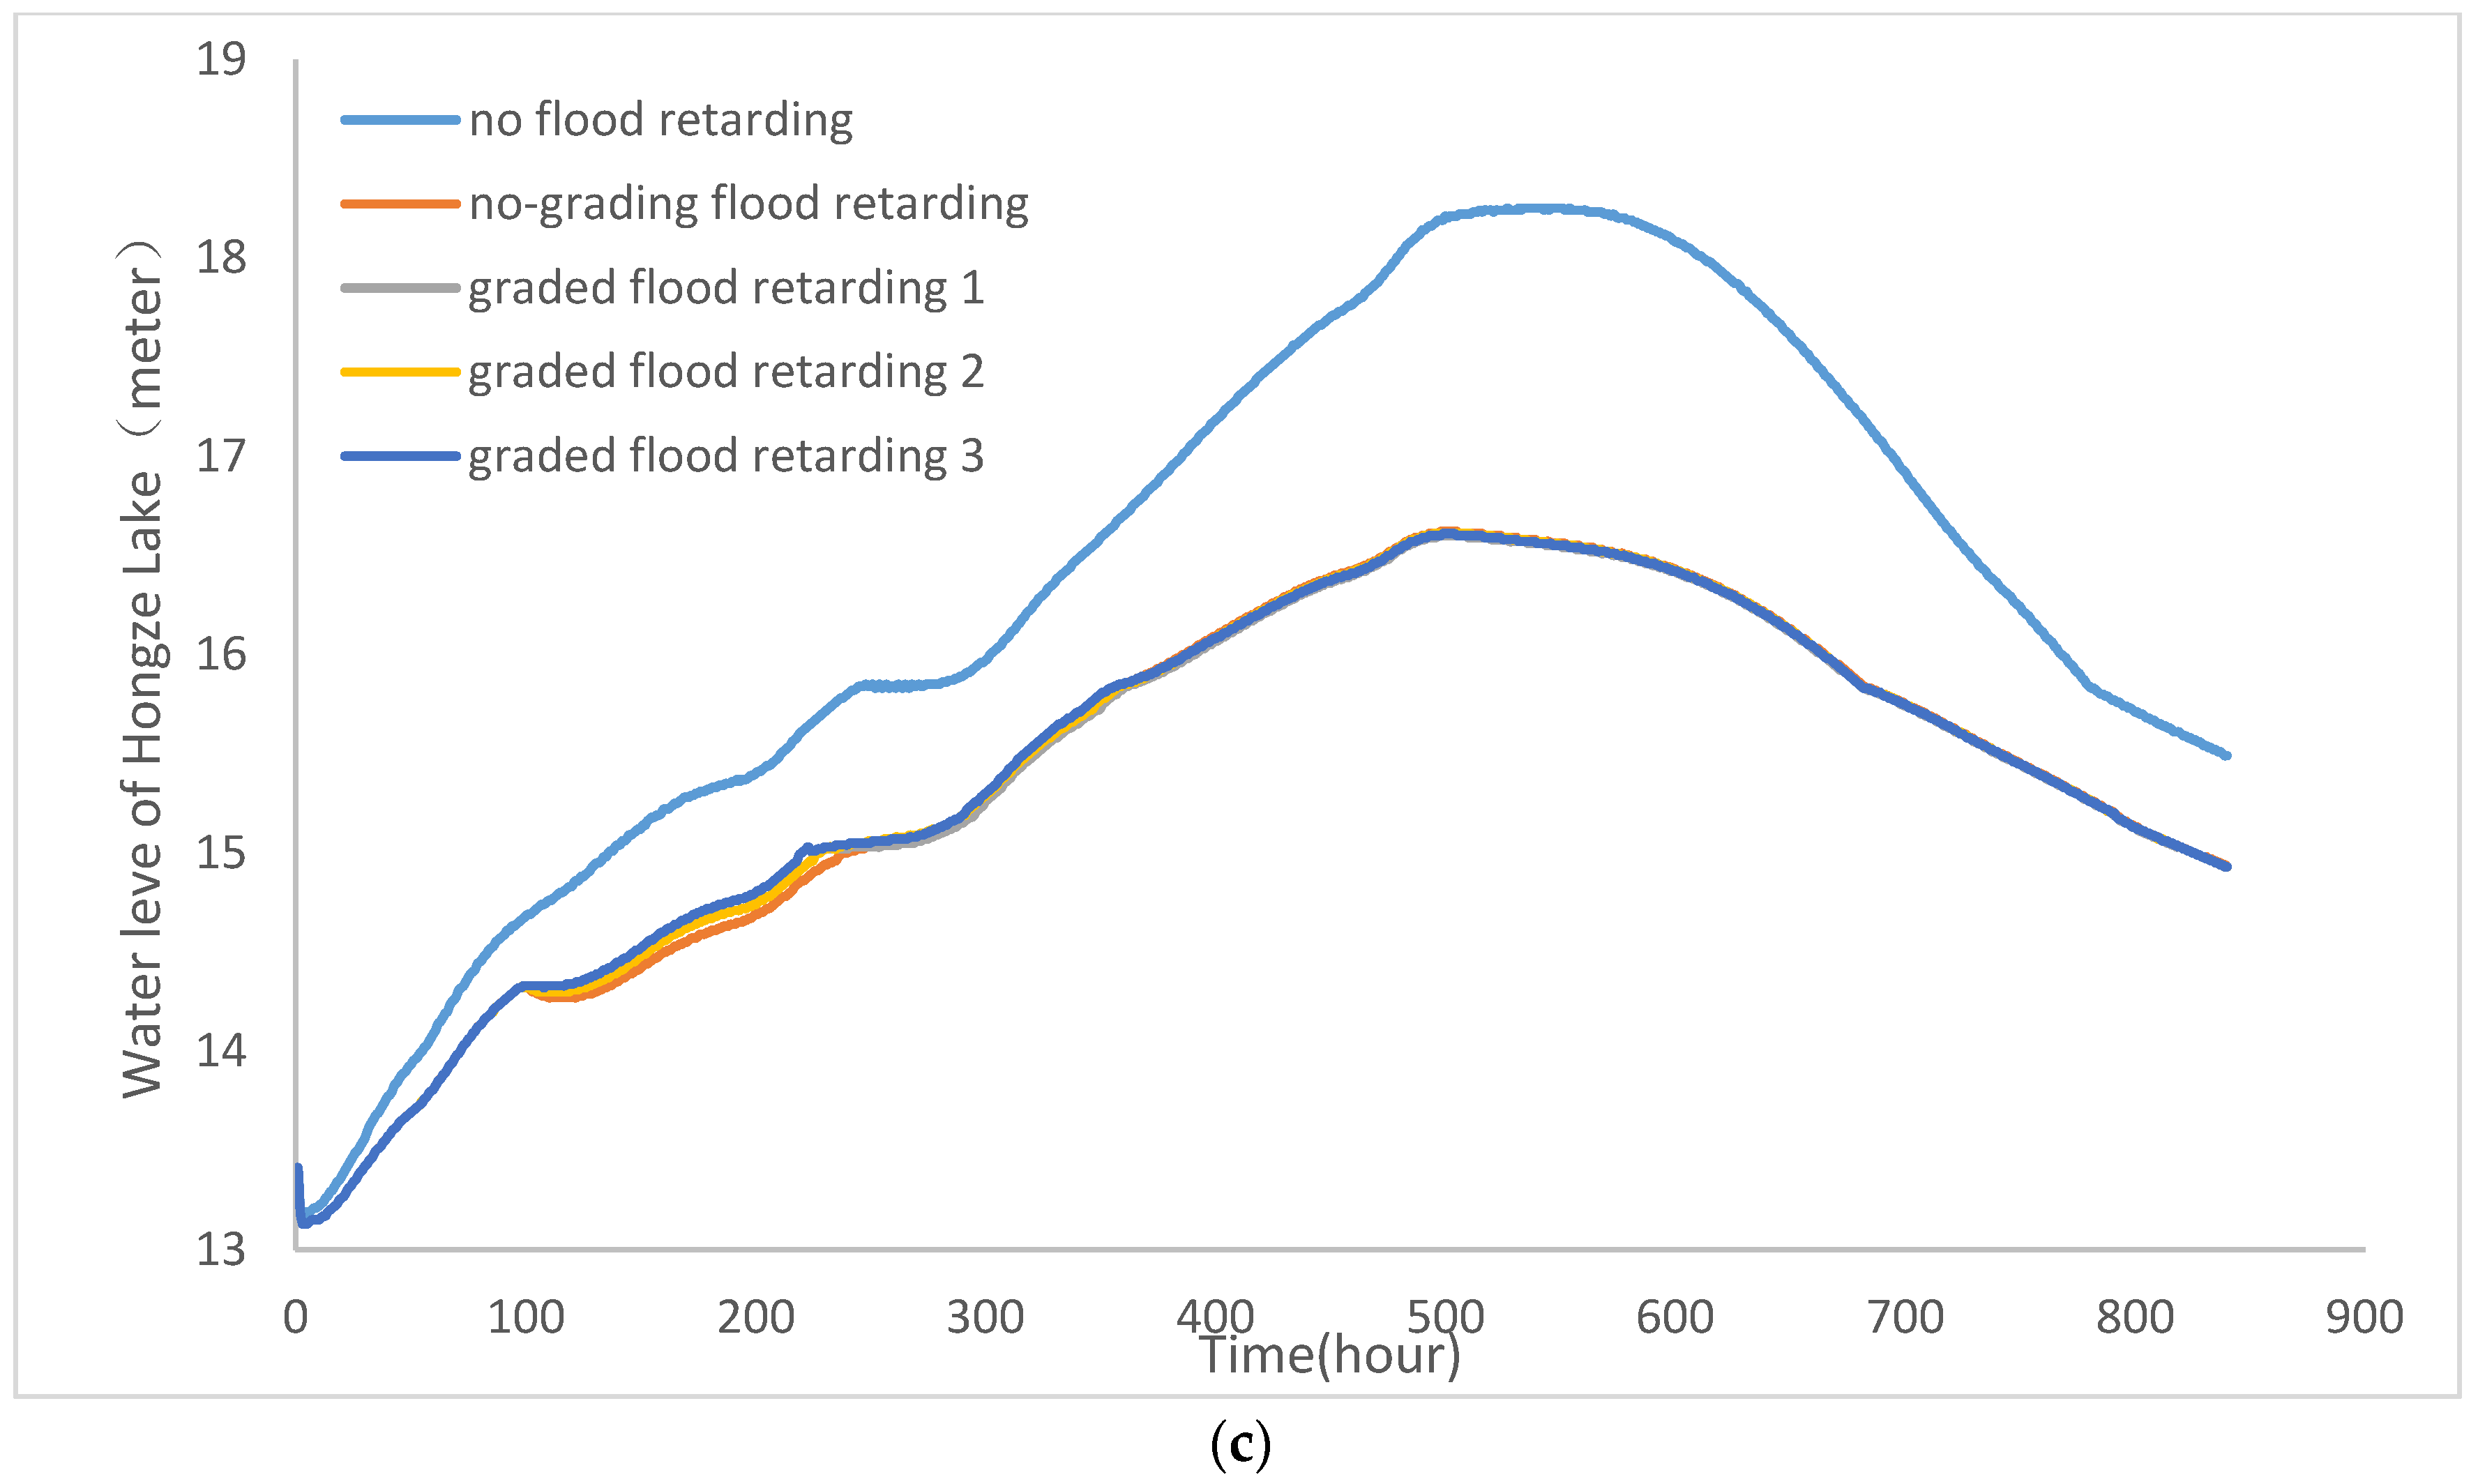
For a p = 1% flood event, because the HWLOH of the four flood retarding schemes are all below 15.03 m, only the first grade of flood retarding would happen. Obviously, the more flood retarding polders that are used, the greater the flood retarding volume and the smaller the HWLOH. The “no grading flood retarding” scheme obtains the minimum HWLOH (14.51 m), while the “graded flood retarding” scheme 1 and “graded flood retarding” scheme 3 obtain the maximum (14.60 m). The difference is not very significant. Although the “no grading flood retarding” scheme best reduces the flood peak, it results in much greater flood loss than the “graded flood retarding” schemes do.
For a p = 0.33% flood event, because the HWLOH of the four flood retarding areas are all between 15.03 and 15.83 m, second grade flood retarding happens in the three “graded flood retarding” schemes. The more second grade flood retarding polders are used, the smaller the HWLOH. Therefore, the lowest HWLOH occurs in the “graded flood retarding” scheme 1 (15.19 m), while the highest HWLOH occurs in the “no grading flood retarding” scheme and “graded flood retarding” scheme 3 (15.26 m; the polders in the “graded flood retarding” scheme 3 are not all used yet). The “no grading flood retarding” scheme has not only the largest flooded area and flood loss, but also the worst effect on reducing the flood peak.
For a p = 0.05% flood event, because the peak flow and total flood volume are all extremely large, the HWLOH of the four flood retarding schemes all exceed 15.83 m and all of the polders are used for flood retarding. Although the processes affecting the water level in Hongze Lake are not the same, the HWLOH, flood retarding volume, and flooded area of the four schemes differ little. The “graded flood retarding” schemes allow more time to plan and prepare for the transfer of people and property.
It is worth mentioning that only the low-elevation polders play important roles in flood retarding when the water level of Hongze Lake reaches 14.33 m, while the high-elevation polders have little effect. With rising water level in Hongze Lake, the high-elevation polders begin to retard flood gradually. Furthermore, because the construction of the flood retarding area has just started, many polders do not yet have a corresponding flood entrance. It is no doubt a challenge to alter more than 300 polders at one time and reconstruct the embankments.
Based on the analysis above, it can be concluded that the “graded flood retarding” scheme is superior to the “no grading flood retarding” scheme.
4.3. The Optimal Graded Flood Retarding Scheme
For a p = 1% flood event, “graded flood retarding” scheme 1 and “graded flood retarding” scheme 3 obtain the same results because the HWLOH does not reach 15.03 m. Flooded area and flood loss for the “graded flood retarding” scheme 2 is 191.14 km2 and 1.8 billion CNY more than those of “graded flood retarding” scheme 1 and “graded flood retarding” scheme 3. They increase by 42.3% and 37.1%, respectively. Therefore, “graded flood retarding” scheme 1 and “graded flood retarding” scheme 3 are both superior to “graded flood retarding” scheme 2.
For a p = 0.33% flood event, the difference in results between the three “graded flood retarding” schemes are not very significant. “graded flood retarding” scheme 1 has the best effect for reducing the flood peak, while its flooded area and flood loss are at mid-place. “Graded flood retarding” scheme 2 has the largest flooded area and flood loss, and “graded flood retarding” scheme 3 has the worst effect for reducing flood peak. Therefore, “graded flood retarding” scheme 1 is superior to the “graded flood retarding” scheme 2 and “graded flood retarding” scheme 3.
For a p = 0.05% flood event, the results of the three “graded flood retarding” schemes are almost the same. The only difference is the order in which the people and properties at the different grades would need to transfer (out of the flood area).
In summary, “graded flood retarding” scheme 1 is the recommended option.


