4.1. Simulation Results and Analysis
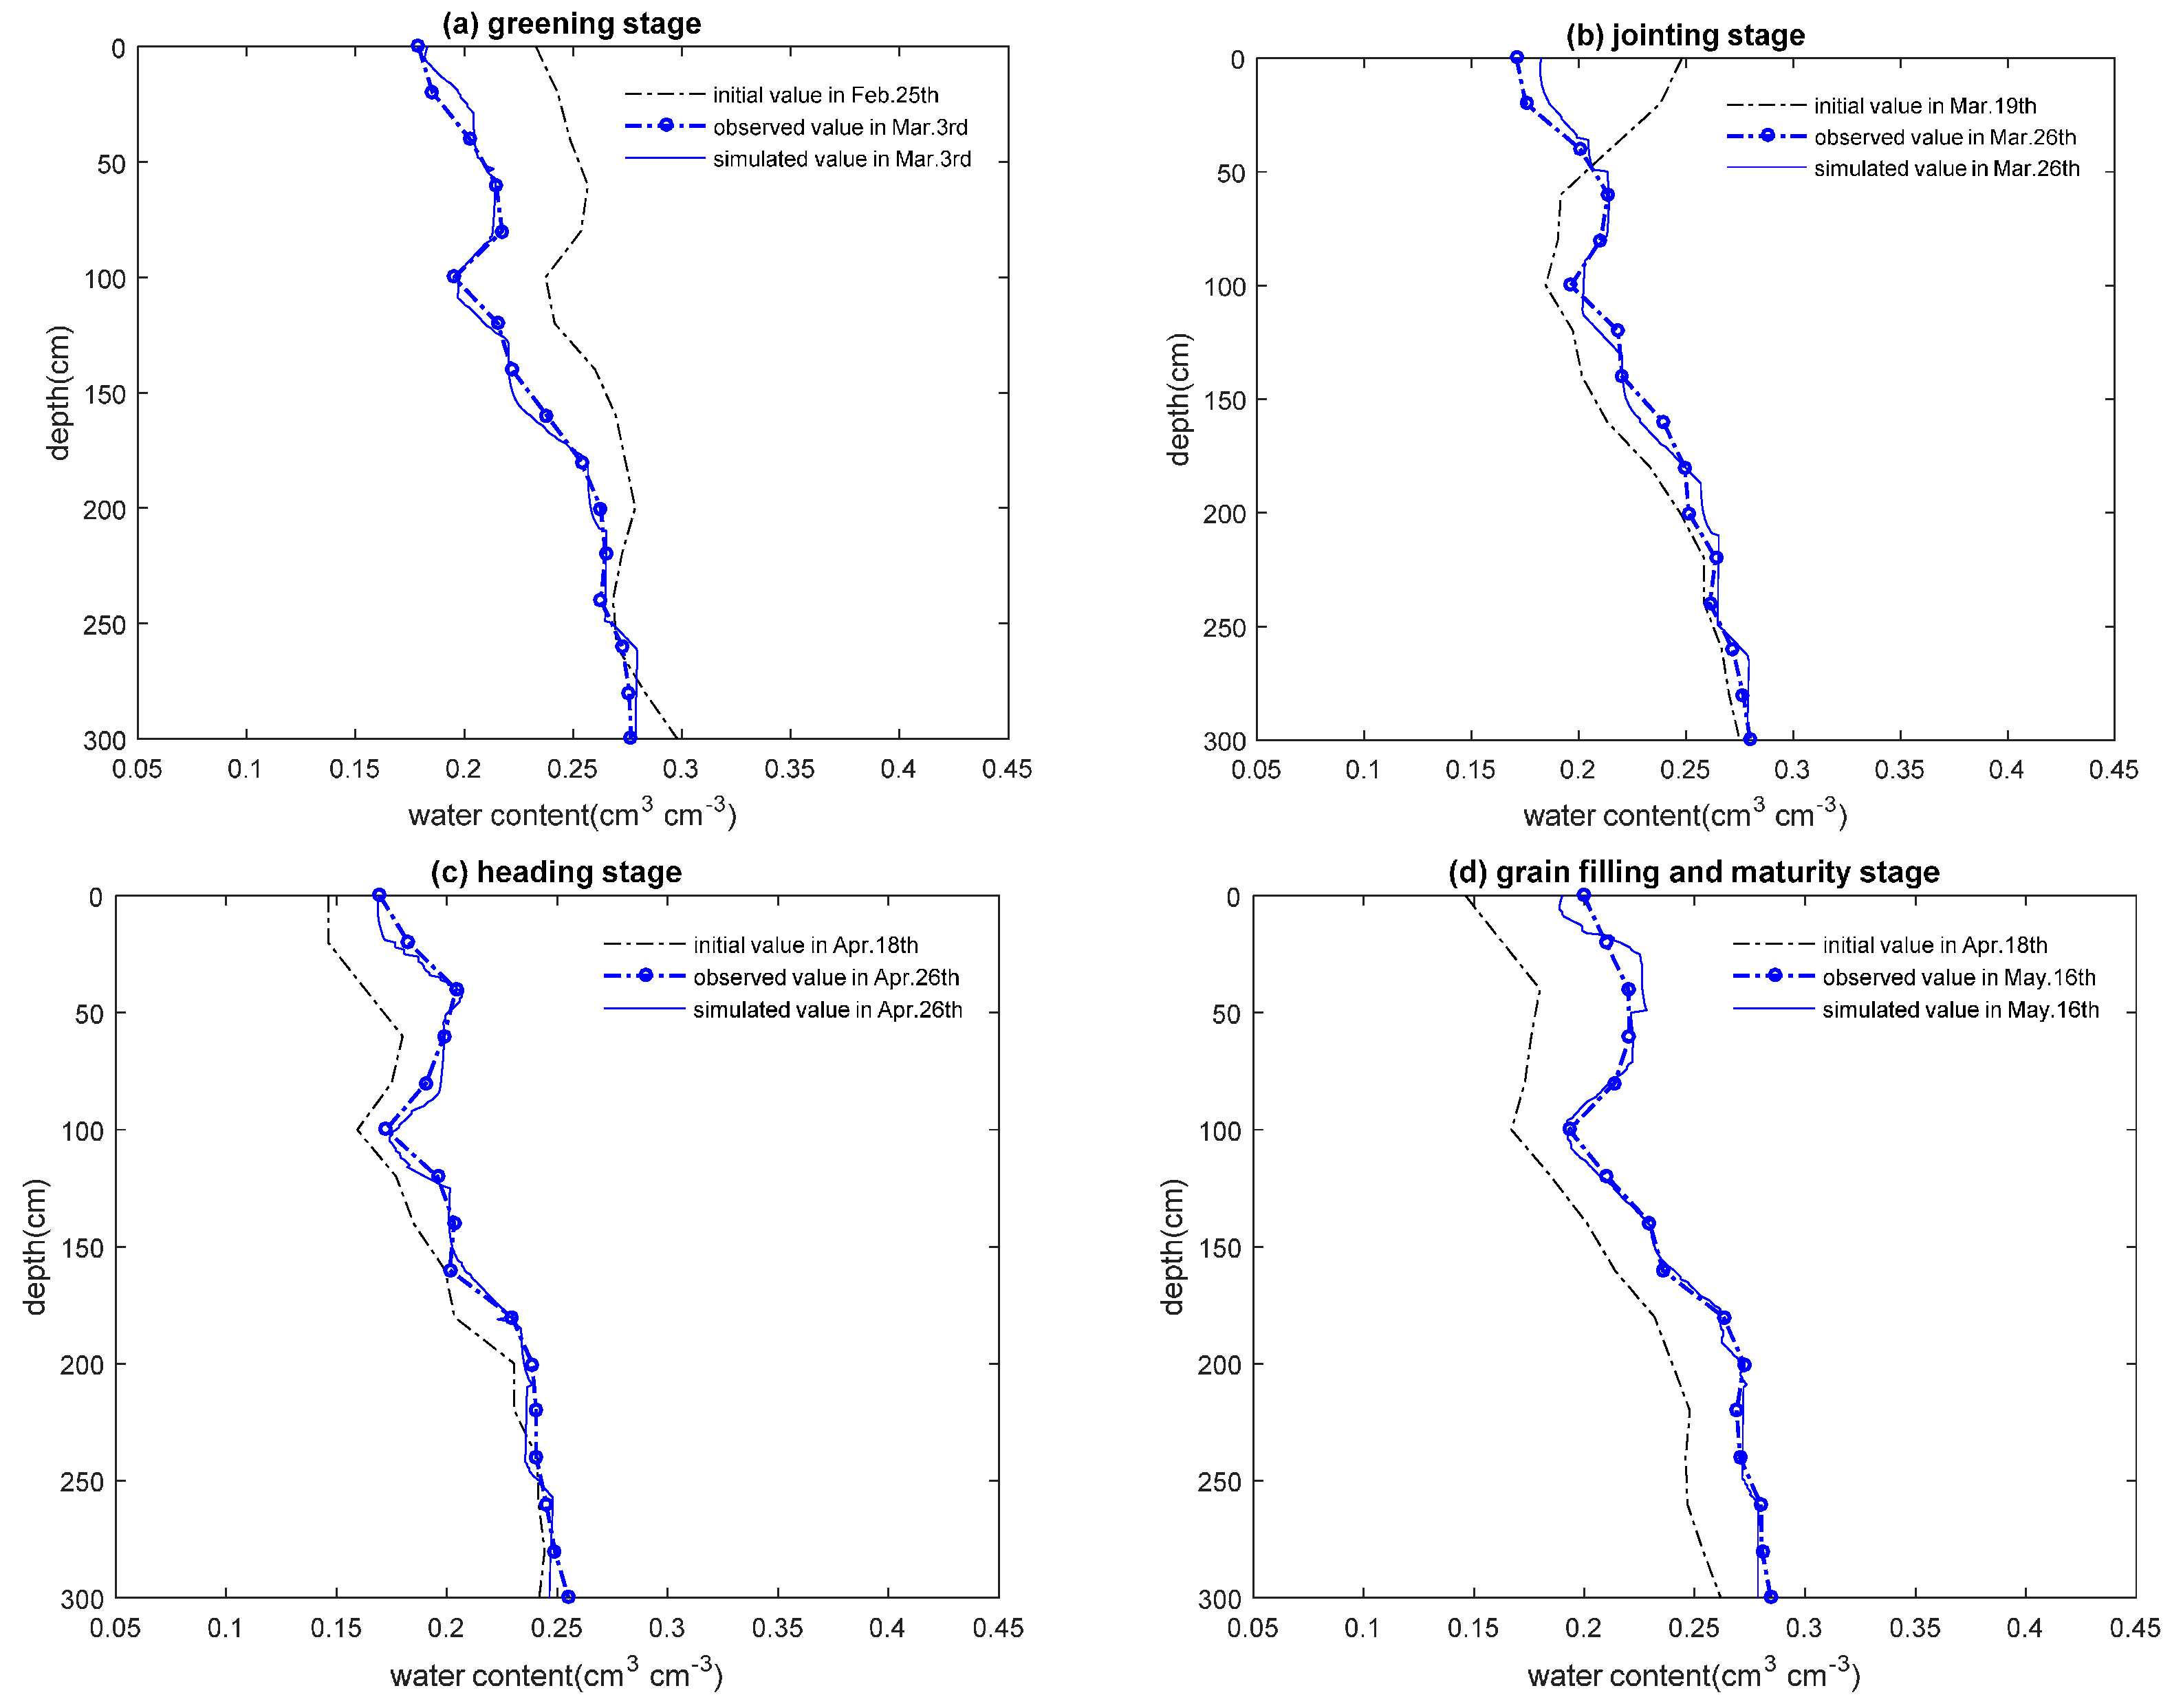
Figure 4 and
Figure 5 show the changes in initial, simulated, and observed values for soil moisture content and temperature, respectively, as a function of soil depth in each growing period of winter wheat. The simulated values for a variable (the water content and temperature) matched the measured values well.
Figure 4a–d show that the trend of simulated values for soil water content was the first to increase (peaked at a depth of nearly 50 cm), and then decreased (a valley existed at approximately 100 cm deep), and then gradually increased again (the maximum value was observed at the bottom of the soil column). The trend for simulated value was consistent with the measured soil water content, demonstrating that the model was effective, and that the results were reliable. Moreover, the simulated and measured values for the degree of agreement increased with soil depth. A large difference was observed between the simulated value of water content in soil surface (0–20 cm) and the measured value, mainly because the soil surface was the layer that was most affected by weather. Weather changes affected evapotranspiration in soil surface and crop transpiration, as well as the water content of the surface soil. Moreover, the structure of the soil surface was less stable than that of the deep soil. When the rainfall was frequent or when the amount of rainfall was high, either the surface soil was compacted, or wetting was produced. These phenomena would alter the soil structure [
48], resulting in deviation between the simulated and measured surface soil water contents. Furthermore, changes in temperature of the surface soil would affect soil moisture transfer. Compared with the surface soil, the deep soil was less affected by weather conditions, and its structure was relatively stable. Therefore, the water content of the fitting effect was better at demonstrating that the model produces accurate long-term simulation results.
Figure 4a shows that the soil water content decreased gradually with time during the simulated period characterized by the absence of rain and irrigation. This result was observed mainly because some soil moisture evaporated from the surface, while some of the moisture was released from the soil through transpiration. Soil water content decreased with soil depth, mainly because evapotranspiration of soil moisture decreased gradually with soil depth. Moreover, the root length density of winter wheat showed exponential decline with soil depth (the root length accounted for 81% of the total root length at 0–50 cm, and the proportion decreased to 19% at 50–120 cm). The average root water uptake rates at 0–50 cm and 50–120 cm were 0.004 (cm
3 cm
−3 day
−1) and 0.0015 (cm
3 cm
−3 day
−1), respectively. Thus, the water uptake of roots decreased significantly with soil depth during this period.
Figure 4b shows that the simulated value decreased first and then increased slightly compared with the initial value with soil depth when wheat was irrigated only during the simulated period. It was mainly caused by the loss of soil water through evaporation from the surface and through crop transpiration (the root length accounted for 79% of the total root length and the average root water uptake rate of the layer was 0.0075 (cm
3 cm
−3 day
−1)) in the shallow soil layer, which is characterized as being <50 cm deep. A greater amount of soil water was transported into the lower soil layer because of the action of gravity. At >50 cm deep, soil water content increased gradually relative to the initial value as a result of transportation of soil moisture from the upper soil layer. However, the increase in soil water content decreased with soil depth, indicating that the lower soil layers were less affected by rainfall compared with the upper layer.
Figure 4c shows that the simulated value of soil water content increased with time relative to the initial value. The increase in soil water content progressively decreased with soil depth. At >220 cm deep, the predicted value was nearly similar to the initial value. This was because the maximum root depth of winter wheat was 220 cm during this period, and the lower soil layers were less affected by crop root water uptake and rainfall than the upper layer.
Figure 4d shows that during the simulated period characterized by the presence of rainfall and irrigation, the simulated soil water content increased obviously with time, mainly because considerable soil water exists, and was transported after surface evaporation and crop transpiration and transporting took place. Moreover, the increase in soil water content progressively decreased with soil depth, mainly because the maximum root depth of winter wheat was 240 cm during this period. The percentage of root length to total root length decreased to 65% in the shallow soil layer, which is characterized as being <50 cm deep. However, the root length density of winter wheat showed exponential decline with increase of soil depth. Moreover, the wheat roots in shallow soil became old, and there was little difference between the shallow and deep soil layer on the root vigor; the root activity decreased to 34.15 (µg g
−1 h
−1) in the shallow soil layer, and the root activity increased to 26.56 (µg g
−1 h
−1) in the deep soil layer. Therefore, the water absorption capacity of the deeper roots increased gradually.
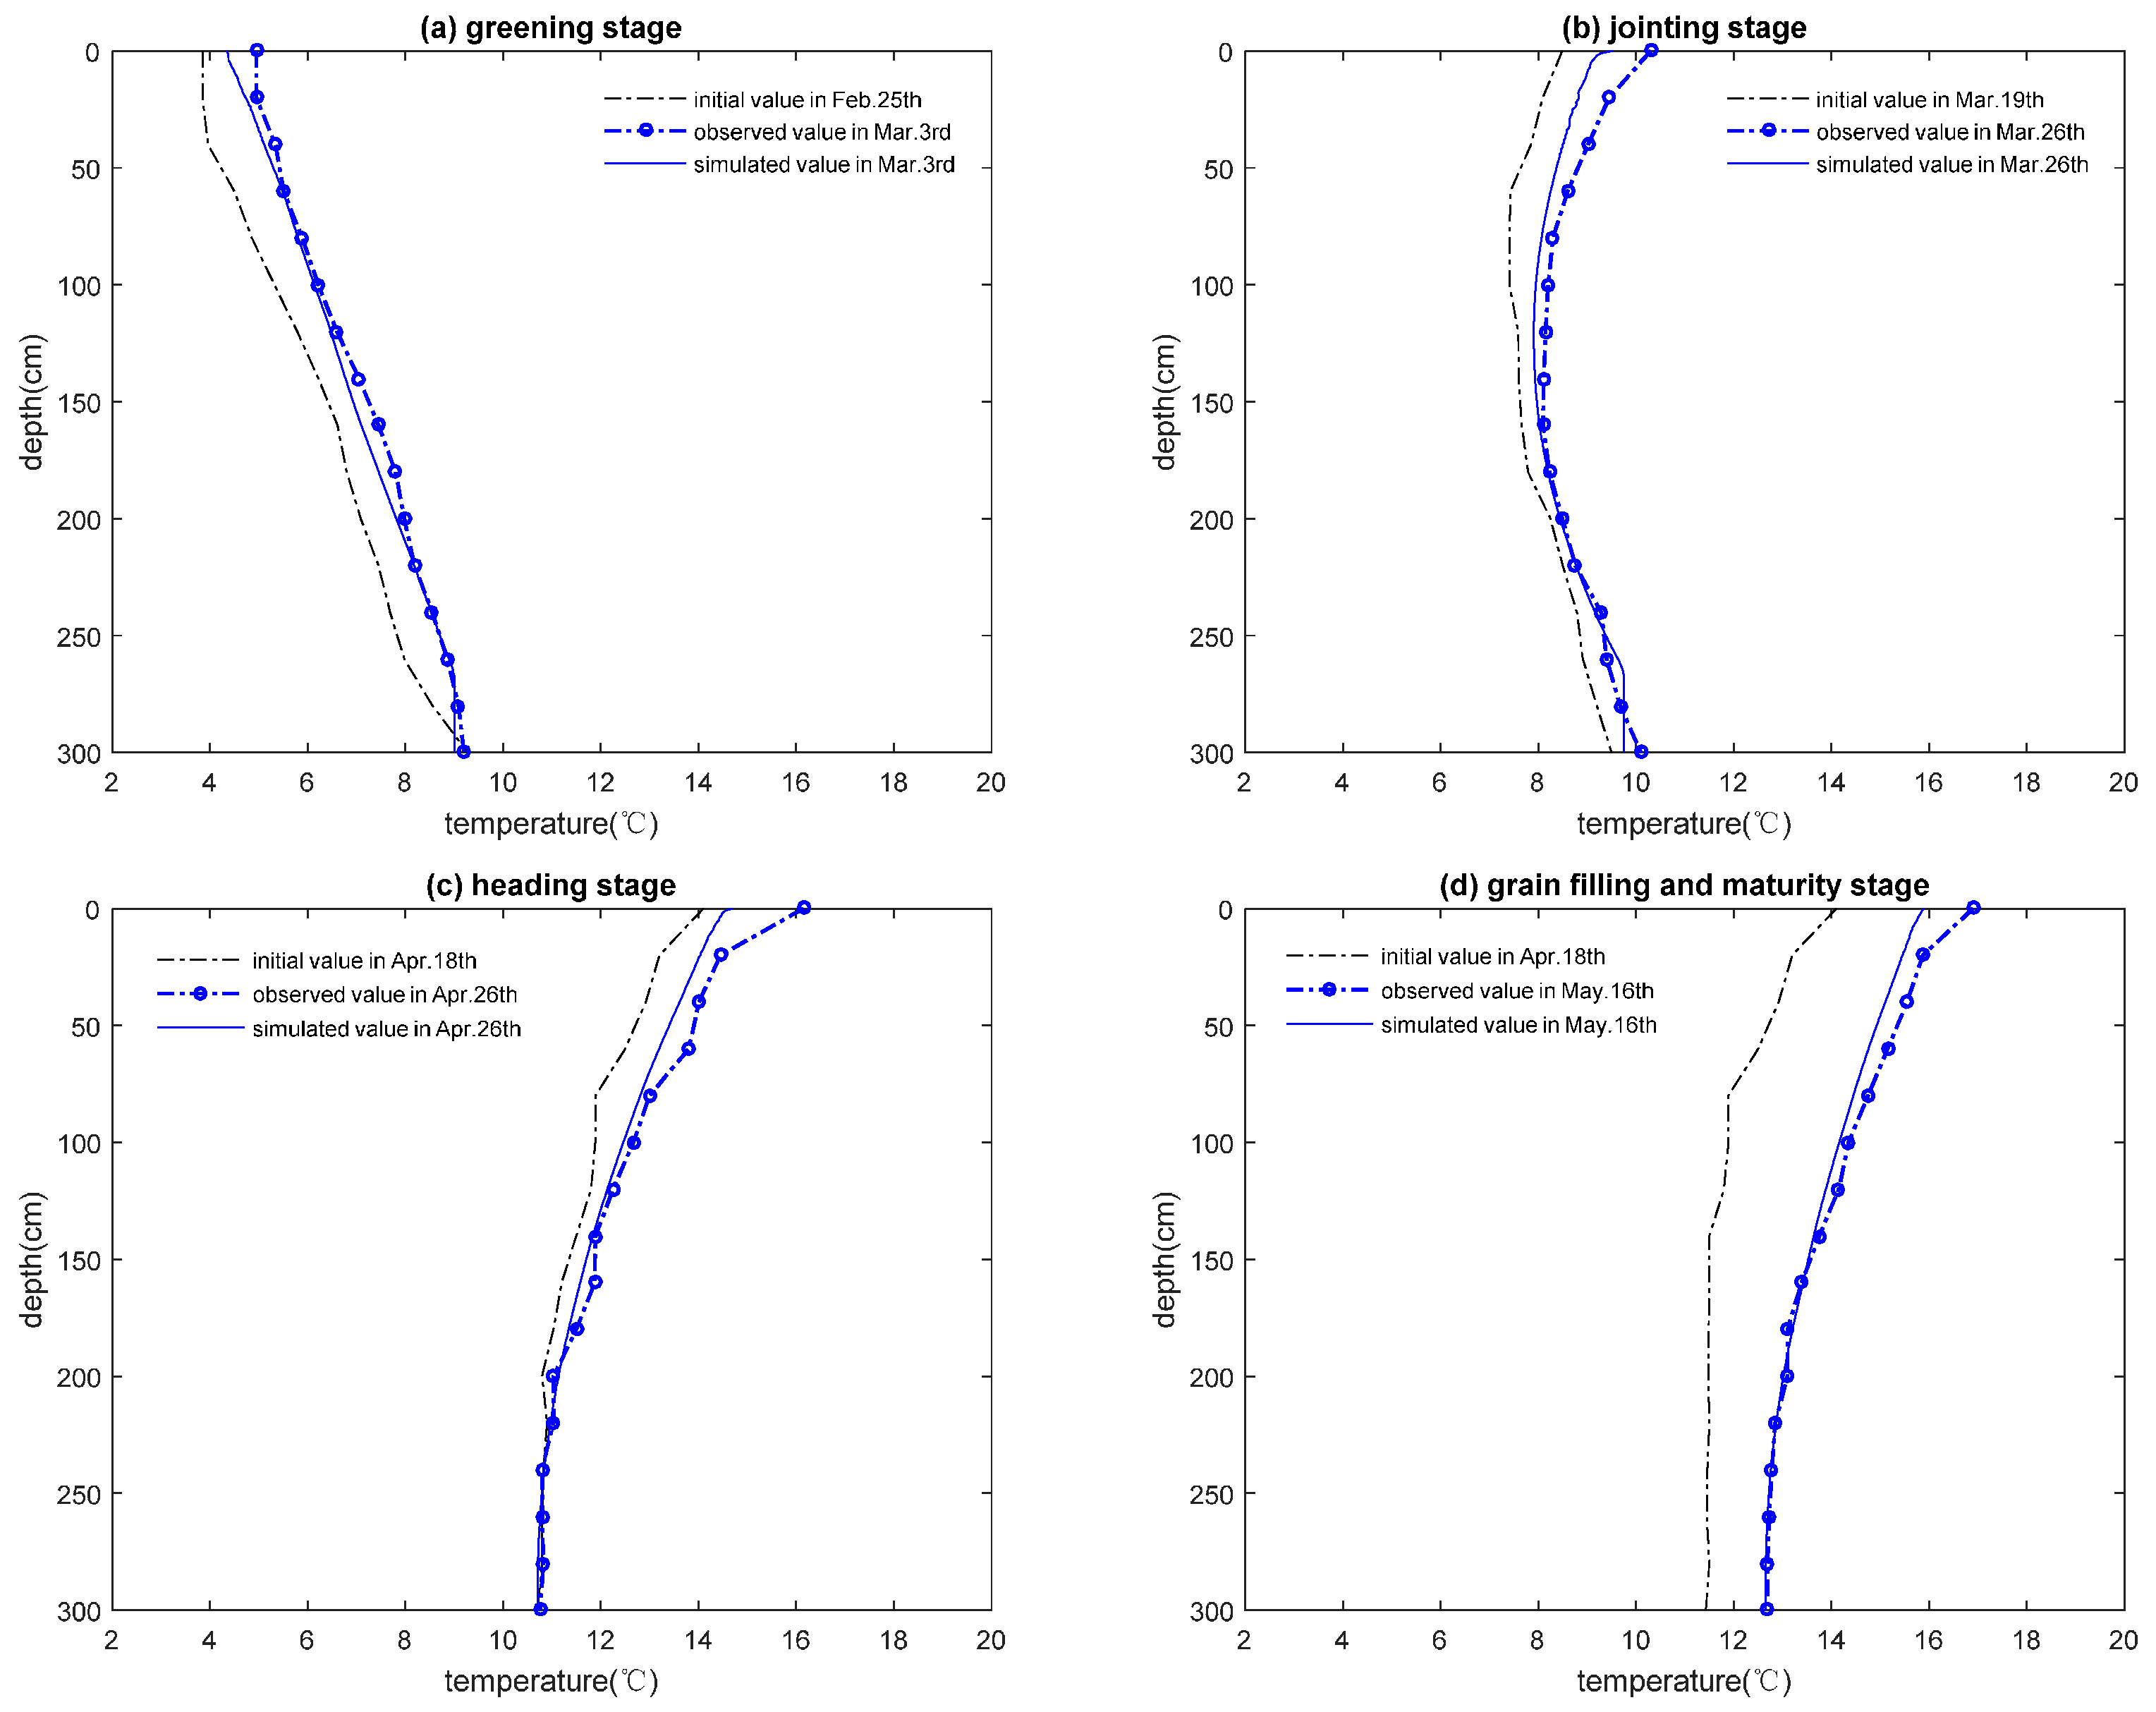
Figure 5a–d show that the simulated soil temperature in each soil layer increased as growth progressed. This trend was consistent with the reality, demonstrating that the model was effective, and that the results were reliable. The difference between the simulated and observed values decreased with soil depth. This was mainly attributed to factors such as changes in climate, day and night alternation, rainfall, or accumulation of calculation error.
Figure 5a shows that the simulated value increased gradually with soil depth during the green period. The temperature of the topsoil was lowest at the greening stage; the soil temperature gradually increased with soil depth, reaching the maximum at the bottom of the soil column. This was because the average atmospheric temperature was 1.8 °C lower than the topsoil temperature, and the heat eventually transferred from the bottom to the upper soil layer. Then, the air temperature gradually increased with time. Thus, the simulated soil temperature was higher than the initial value.
Figure 5b shows that the temperature of the topsoil and the bottom of the soil column did not considerably differ (only 3.3 °C difference). The soil temperature decreased first and then increased gradually with soil depth, forming a C-shaped curve. The result is mainly caused by the average atmospheric temperature, which was 3.3 °C higher than the topsoil temperature. The topsoil temperature rose because of solar radiation. The heat eventually transferred to the lower soil layer and thus the temperature of the topsoil decreased gradually. During heat transfer, the moisture—which displays a heat capacity higher than that of the soil—permeated the lower soil. Thus, at <120 cm deep, the temperature of the lower soil remained lower than that of the upper soil layer, although the temperature of the lower soil layer increased. At >120 cm deep, the soil temperature rose gradually because of the heat coming from the bottom of the soil column. Eventually, the atmospheric temperature rose gradually. Thus, the simulated value was higher than the initial value.
Figure 5c shows that the soil temperature decreased slowly and the reduction rate gradually decreased with soil depth during the wheat heading stage. This was because the average atmospheric temperature was 7.8 °C higher than the topsoil temperature. Moreover, the topsoil temperature was increased by solar radiation. The heat eventually transferred to the lower soil layer. However, the lower soil layer obtained less energy than the upper layer because of the energy dissipation in the process of heat transfer. Conversely, the soil moisture increased with soil depth, which is shown in
Figure 4. The upper soil temperature increased rapidly because the heat capacity of water was larger than that of the soil. At >220 cm deep, the simulated and initial values nearly formed a curve, indicating that the temperature of the soil layer was stable during the period.
Figure 5d shows that in the filling stage, the soil temperature decreased gradually with soil depth, and the reduction rate also gradually decreased with soil depth. This phenomenon was similar to that in the heading stage. However, the temperature difference between the topsoil and the bottom of the soil column was smaller in the filling stage than in heading stage, as shown in
Figure 5c. This phenomenon was observed because of the higher rainfall and irrigation during this period (the total rainfall was 45.5 mm, and the irrigation amount was 141.62 mm), resulting in increased soil moisture. Moreover, soil water transfer directly affected the soil temperature. Thus, the increase in temperature was slightly lower in the surface soil than in the bottom of the soil column.
4.3. Sensitivity Analysis
Given the effect of temperature gradient on the water movement and the effect of root water uptake on the heat transfer, the simulated curves of the soil water content and temperature were obtained under the three conditions.
Table 6 shows the error between simulated and observed values for soil water content and temperature under different conditions. The results are shown as follows:
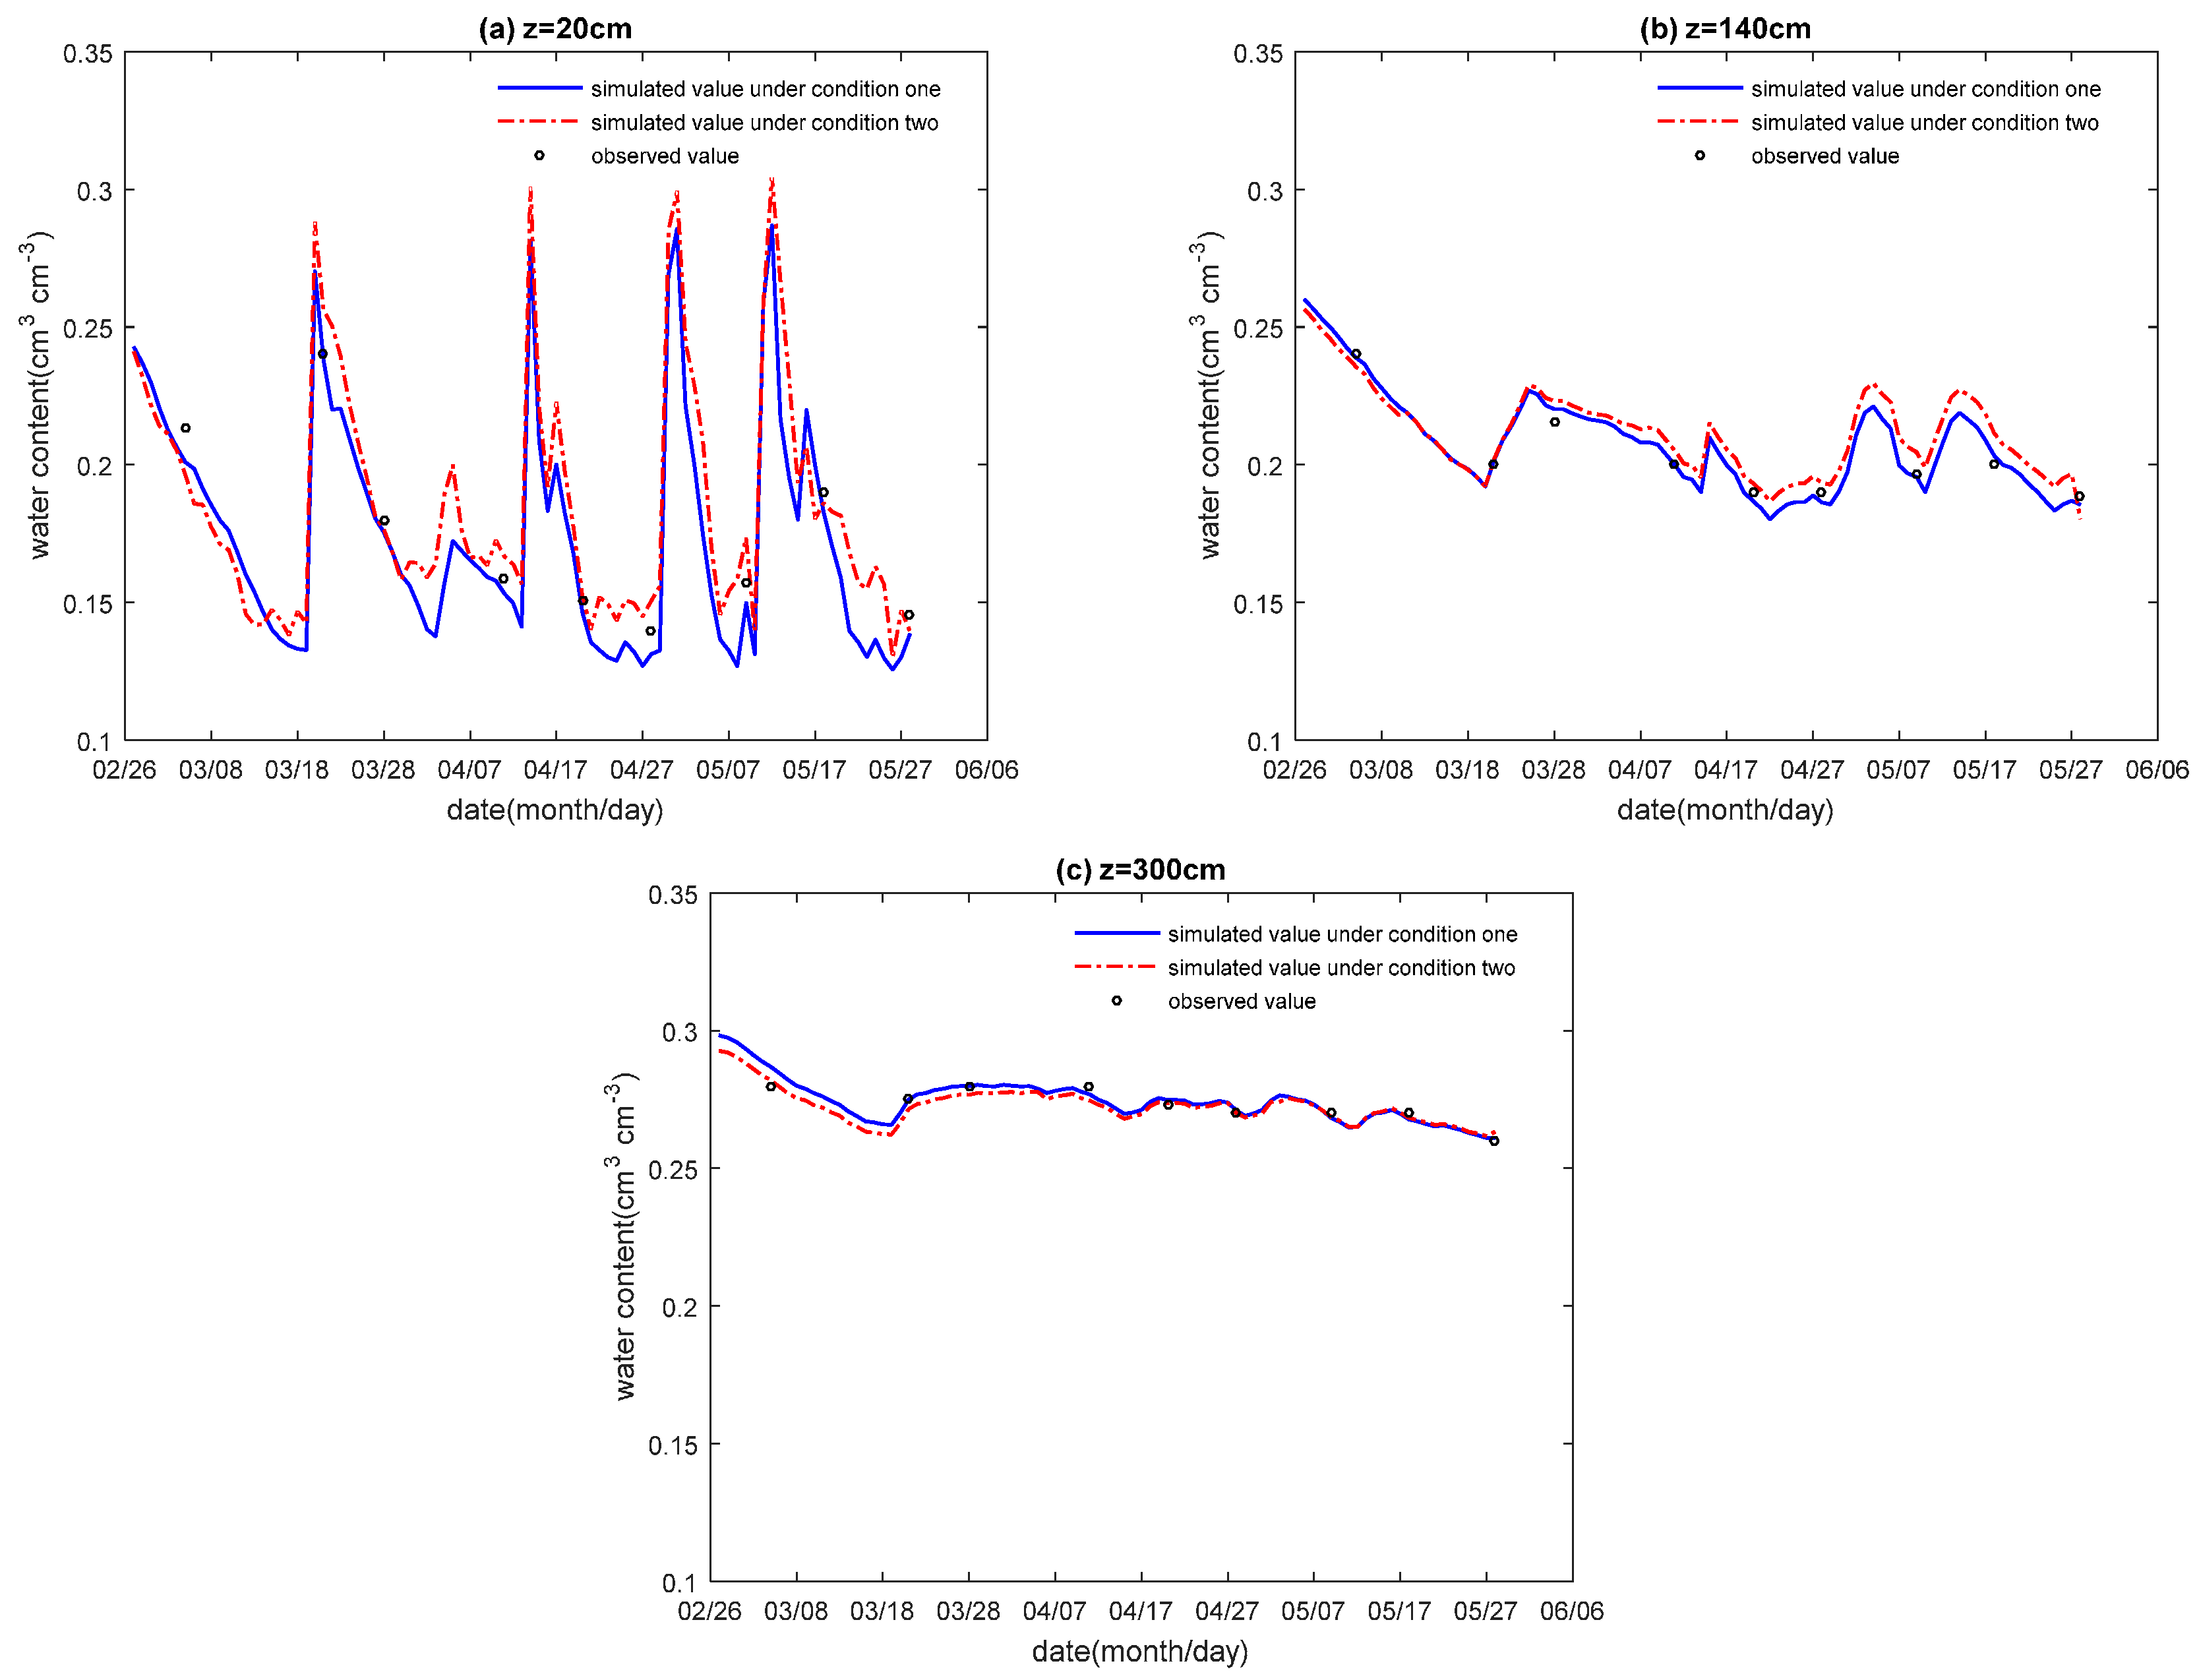
Figure 6a–c show that whether or not the effect of temperature gradient on the water movement was taken into consideration, the simulated curves showed roughly the same trend. The simulated curves show that the soil water content decreased with time, but increased when there was rainfall or irrigation. Compared with the measured values at the depths of 20 cm, 140 cm, and 300 cm, the maximum relative error of the soil water content under condition two was 1.716 times, 1.851 times, and 1.543 times, respectively, all of which were greater than that of condition one; the average relative error of the soil water content under condition two was 1.614 times, 1.702 times, and 1.730 times, respectively, all of which were greater than that of condition one. These indicate that the simulated accuracy for the water content under condition one was higher than condition two.
Moreover, at depths of 20 cm, 140 cm, and 300 cm, the maximum relative error of the soil water content under condition one was 4.467%, 2.508%, and 1.357%, respectively, all of which were lower than that of condition two; and the average relative error of the soil water content under condition one was 2.427%, 1.262%, and 0.528%, respectively, all of which were lower than that of condition two. These show that the difference of the simulated curves under the two conditions and the influence of temperature gradient on the water movement decreased with soil depth. This was because at depths of 20 cm, 140 cm, and 300 cm, the highest soil temperature was higher than the minimum soil temperature, measuring at 17.13 °C, 9.5 °C, and 4.3 °C, respectively, throughout the whole simulated period. In the topsoil, the surface soil temperature gradient was large because of the diurnal and seasonal changes. Therefore, the effect of the temperature gradient on water movement was greater than that of the lower soil depth.
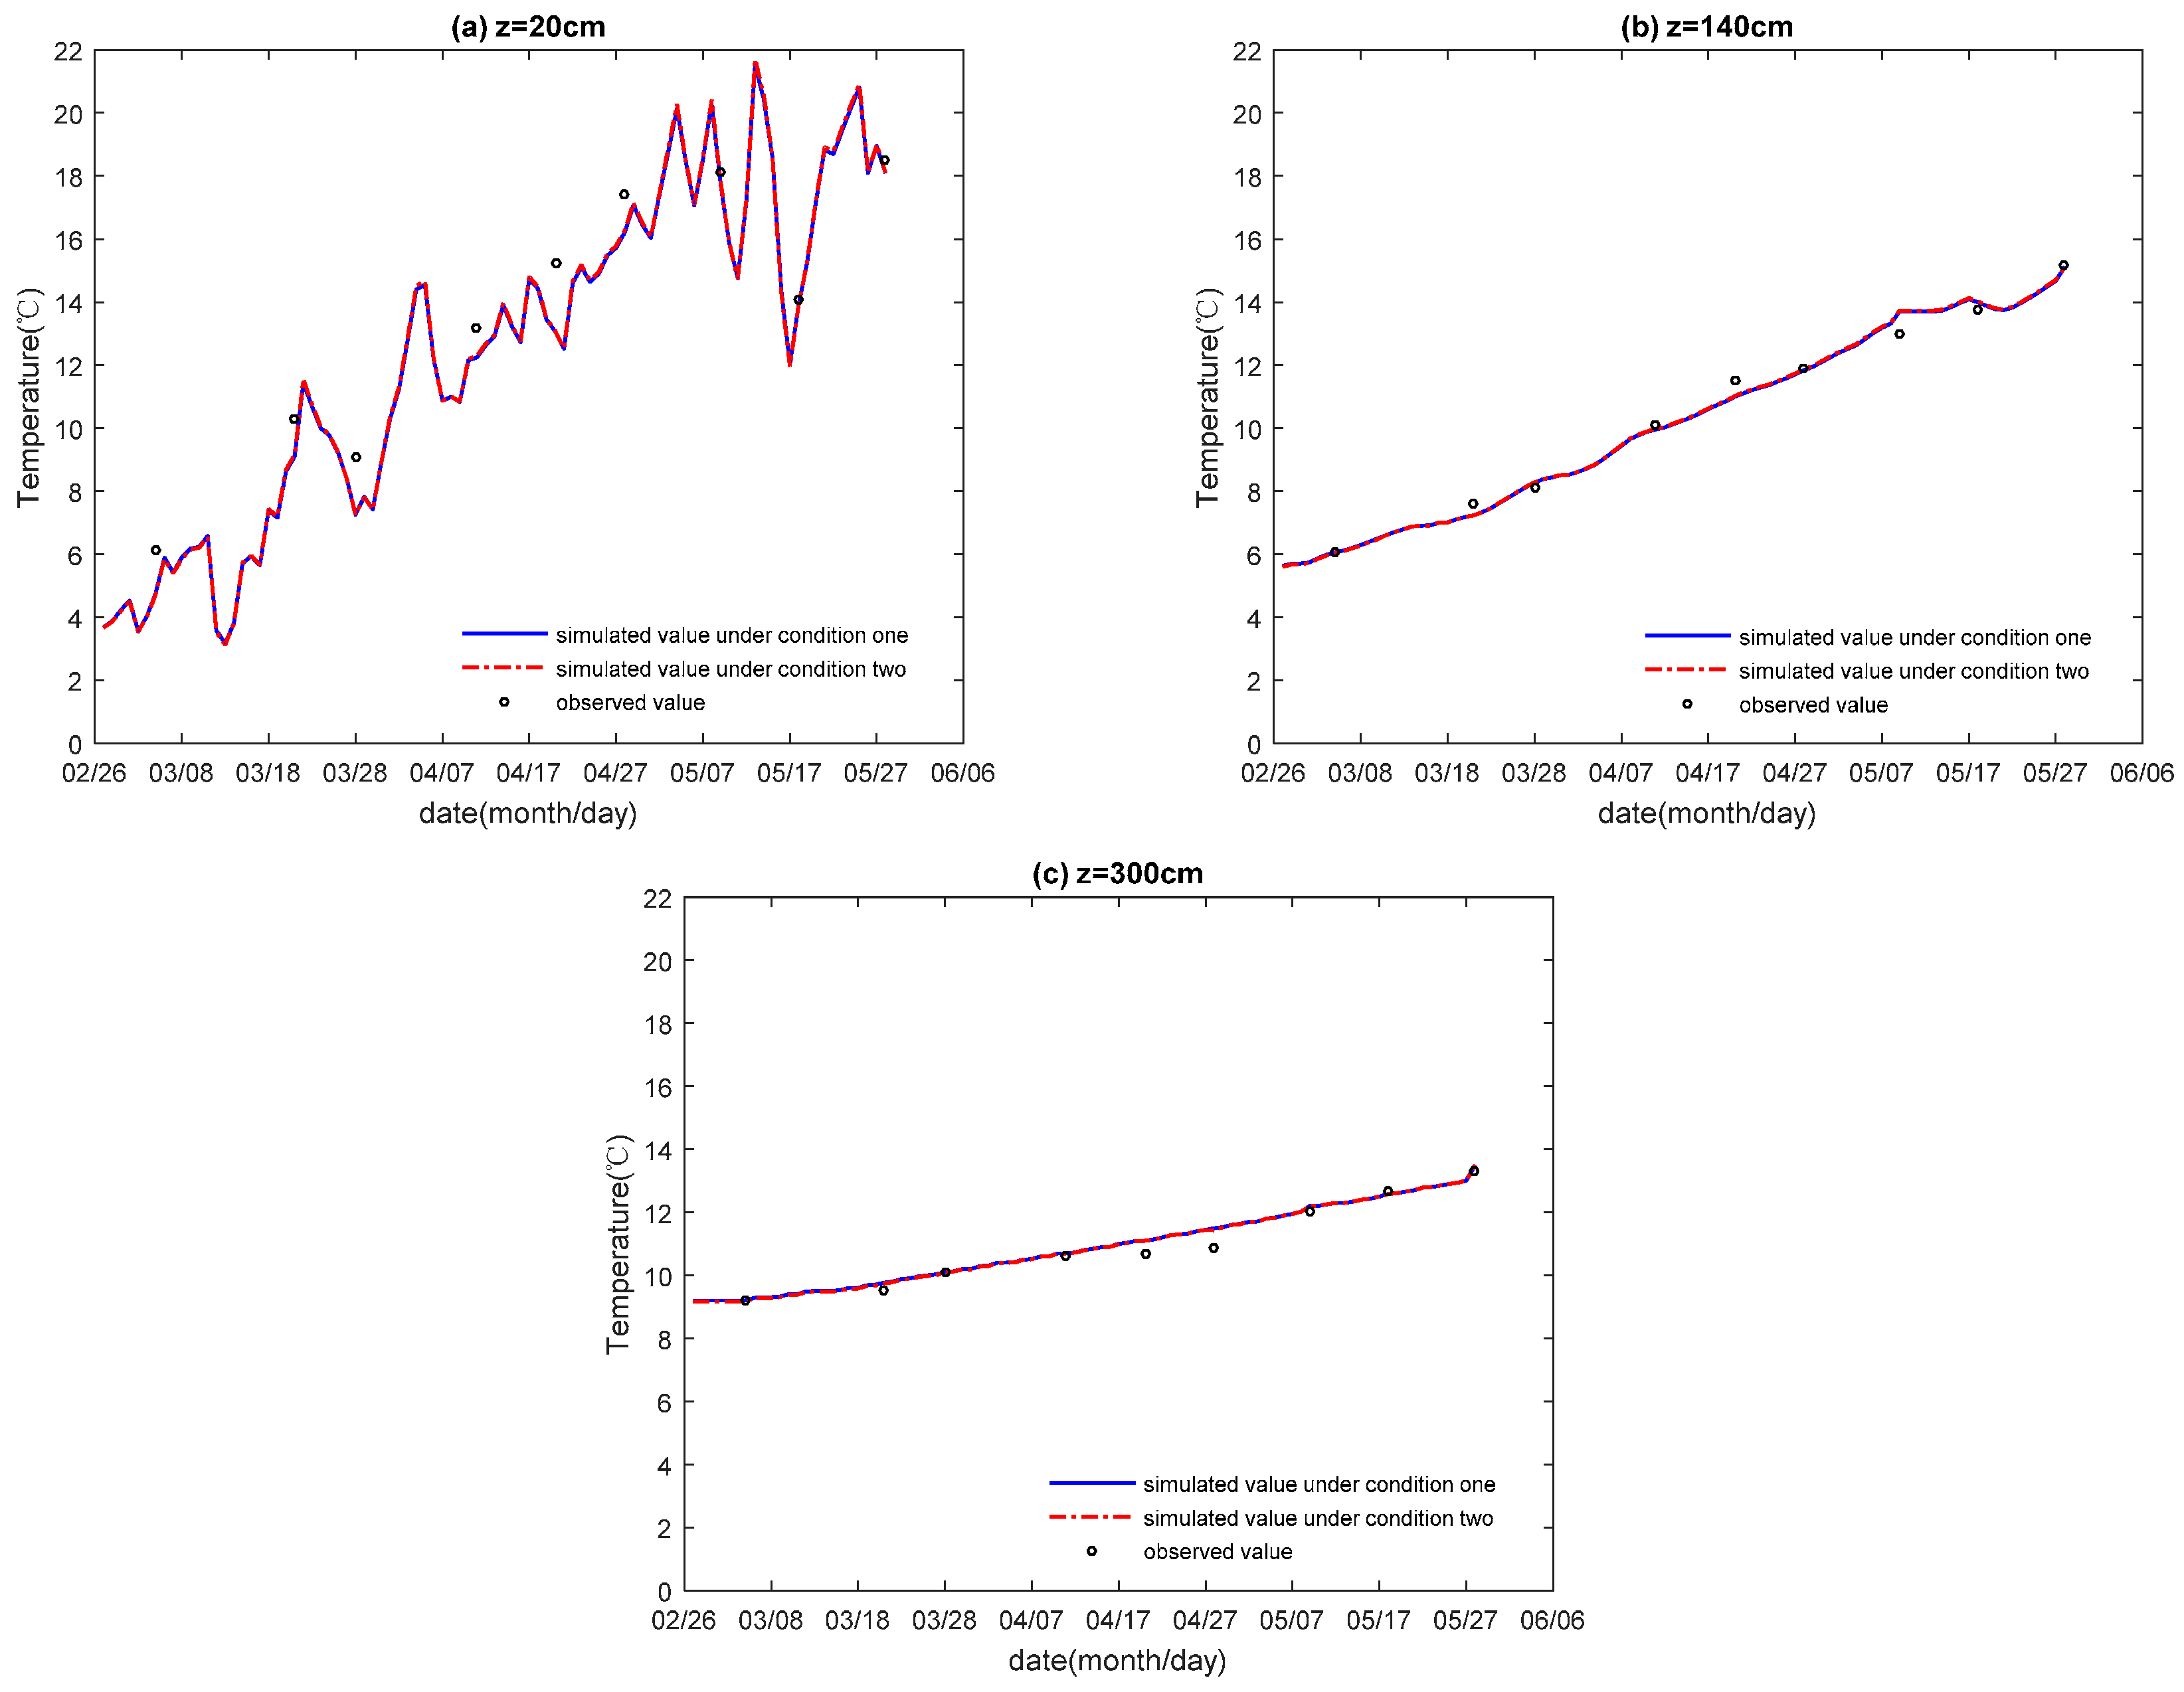
Figure 7a–c show that the two simulated curves of the soil temperature under the two conditions coincide during the simulated period. This shows that there was little difference on the simulated curve regardless of whether the effect of the temperature gradient on the flow was taken into account. At depths of 20 cm, 140 cm, and 300 cm, the maximum relative error of the soil temperature under condition two was 1.014 times, 1.062 times and 1.062 times, respectively, all of which were greater than that of condition one; and the average relative error of the soil temperature under condition two was 1.020 times, 1.080 times and 1.095 times, respectively, all of which were greater than that of condition one. These indicate that the simulated accuracy for the soil temperature under condition one was higher than condition two. However, this advantage was not obvious. This was mainly because thermal parameters can be changed by the change of water content, which resulted in the change of soil temperature. However, the simulated values for the water content of the maximum difference was 0.0352 (cm
3 cm
−3) under both conditions throughout the whole simulated period. With this difference, the thermal conductivity and diffusivity would be changed by 1.5 × 10
−3 (J cm
−1 °C
−1 min
−1) and 0.66 × 10
−5 (cm
2 min
−1), respectively. This small difference did not cause significant changes in the soil temperature.
Figure 8a–c show that the two simulated curves of the soil water content under both conditions (conditions one and three) coincide during the simulated period. This shows that there was little difference on the simulated curve regardless of whether the effect of heat conduction in the root water uptake on the heat transfer equation was considered. At depths of 20 cm, 140 cm, and 300 cm, the maximum relative error of the soil water content under condition three was 1.015 times, 1.026 times, and 1.073 times, respectively, all of which were greater than that of condition one; the average relative error of the soil water content under condition three was 1.018 times, 1.048 times, and 1.047 times, respectively, all of which were greater than that of condition one. These indicate that the simulated accuracy for the soil water content under condition one was higher than that of condition three. However, this advantage was not obvious. This was mainly because the soil water movement could be affected by the change of soil temperature. However, the simulated values for the soil temperature of the maximum difference was 0.19 °C under these two conditions throughout the whole simulated period. The soil water diffusivity would be changed by 3.710 × 10
−6 °C min
−1 with this difference, which did not cause significant changes in the soil water content.
Figure 9a–c show that whether or not the effect of heat conduction in the root water uptake on the heat transfer is taken into account, the simulated curves showed roughly the same trend. The simulated curves show that the soil temperature increased with the fluctuation of the external climate trend with time. Compared with the measured values, at depths of 20 cm, 140 cm, and 300 cm, the maximum relative error of the soil temperature under condition three was 1.242 times, 1.685 times, and 1.103 times, respectively, all of which were greater than that of condition one; the average relative error of the soil temperature under condition three was 1.531 times, 1.945 times, and 1.075 times, respectively, all of which were greater than that of condition one. These indicated that the simulated accuracy for the soil temperature under condition one was higher than that of condition three.
Moreover, at depths of 20 cm, 140 cm, and 300 cm, the maximum relative error of the soil temperature under condition one was 5.543%, 4.018%, and 0.552%, respectively, all of which were lower than that of condition three; the average relative error of the soil temperature under condition one was 5.121%, 2.302%, and 0.137%, respectively, all of which were lower than that of condition three. These show that the difference of the simulated curves under these two conditions and the influence of heat conduction in the root water uptake on the heat transfer decreased with soil depth. This was because that the winter wheat root was mainly distributed in the range of 0–30 cm in depth, and the range of root length accounted for 64% of the total root length. Moreover, in the greening stage, jointing stage, heating stage, and grain filling and maturity stage, at a depth of 20 cm, the root length density values were 3.063 (cm cm−3), 6.755 (cm cm−3), 7.889 (cm cm−3), and 5.195 (cm cm−3), respectively; the root water uptake rate values were 0.004 (cm3 cm−3 day−1), 0.0075 (cm3 cm−3 day−1), 0.0108 (cm3 cm−3 day−1), and 0.0087 (cm3 cm−3 day−1), respectively; at a depth of 140cm, the root length density values were 0 (cm cm−3), 0.2295 (cm cm−3), 0.4393 (cm cm−3), and 0.4432 (cm cm−3), respectively; the root water uptake rate values were 0 (cm3 cm−3 day−1), 0.00015 (cm3 cm−3 day−1), 0.00045 (cm3 cm−3 day−1), and 0.00066 (cm3 cm−3 day−1), respectively. There was no winter wheat root at a depth of 300 cm. Thus, the root water uptake rate was always 0 (cm3 cm−3 day−1). In the topsoil, the effect of heat conduction in the root water uptake on the heat transfer was more obvious than in the lower soil. The effect of root water uptake on the heat transfer decreased because of the weakened root absorption with soil depth.
In summary, the results show that the model under condition one demonstrated higher accuracy in simulating the soil water content and temperature than that of conditions two and three. Regardless of whether the effect of temperature gradient on the water movement was taken into account, there was a great influence on the simulated values of soil water content. Moreover, whether or not the effect of heat conduction in the root water uptake on the heat transfer was considered, there was a great influence on the simulated values of soil temperature. Therefore, both the effect of temperature gradient on the water movement and the effect of heat conduction in the root water uptake on the heat transfer should not be ignored.


