3. Materials and Methods
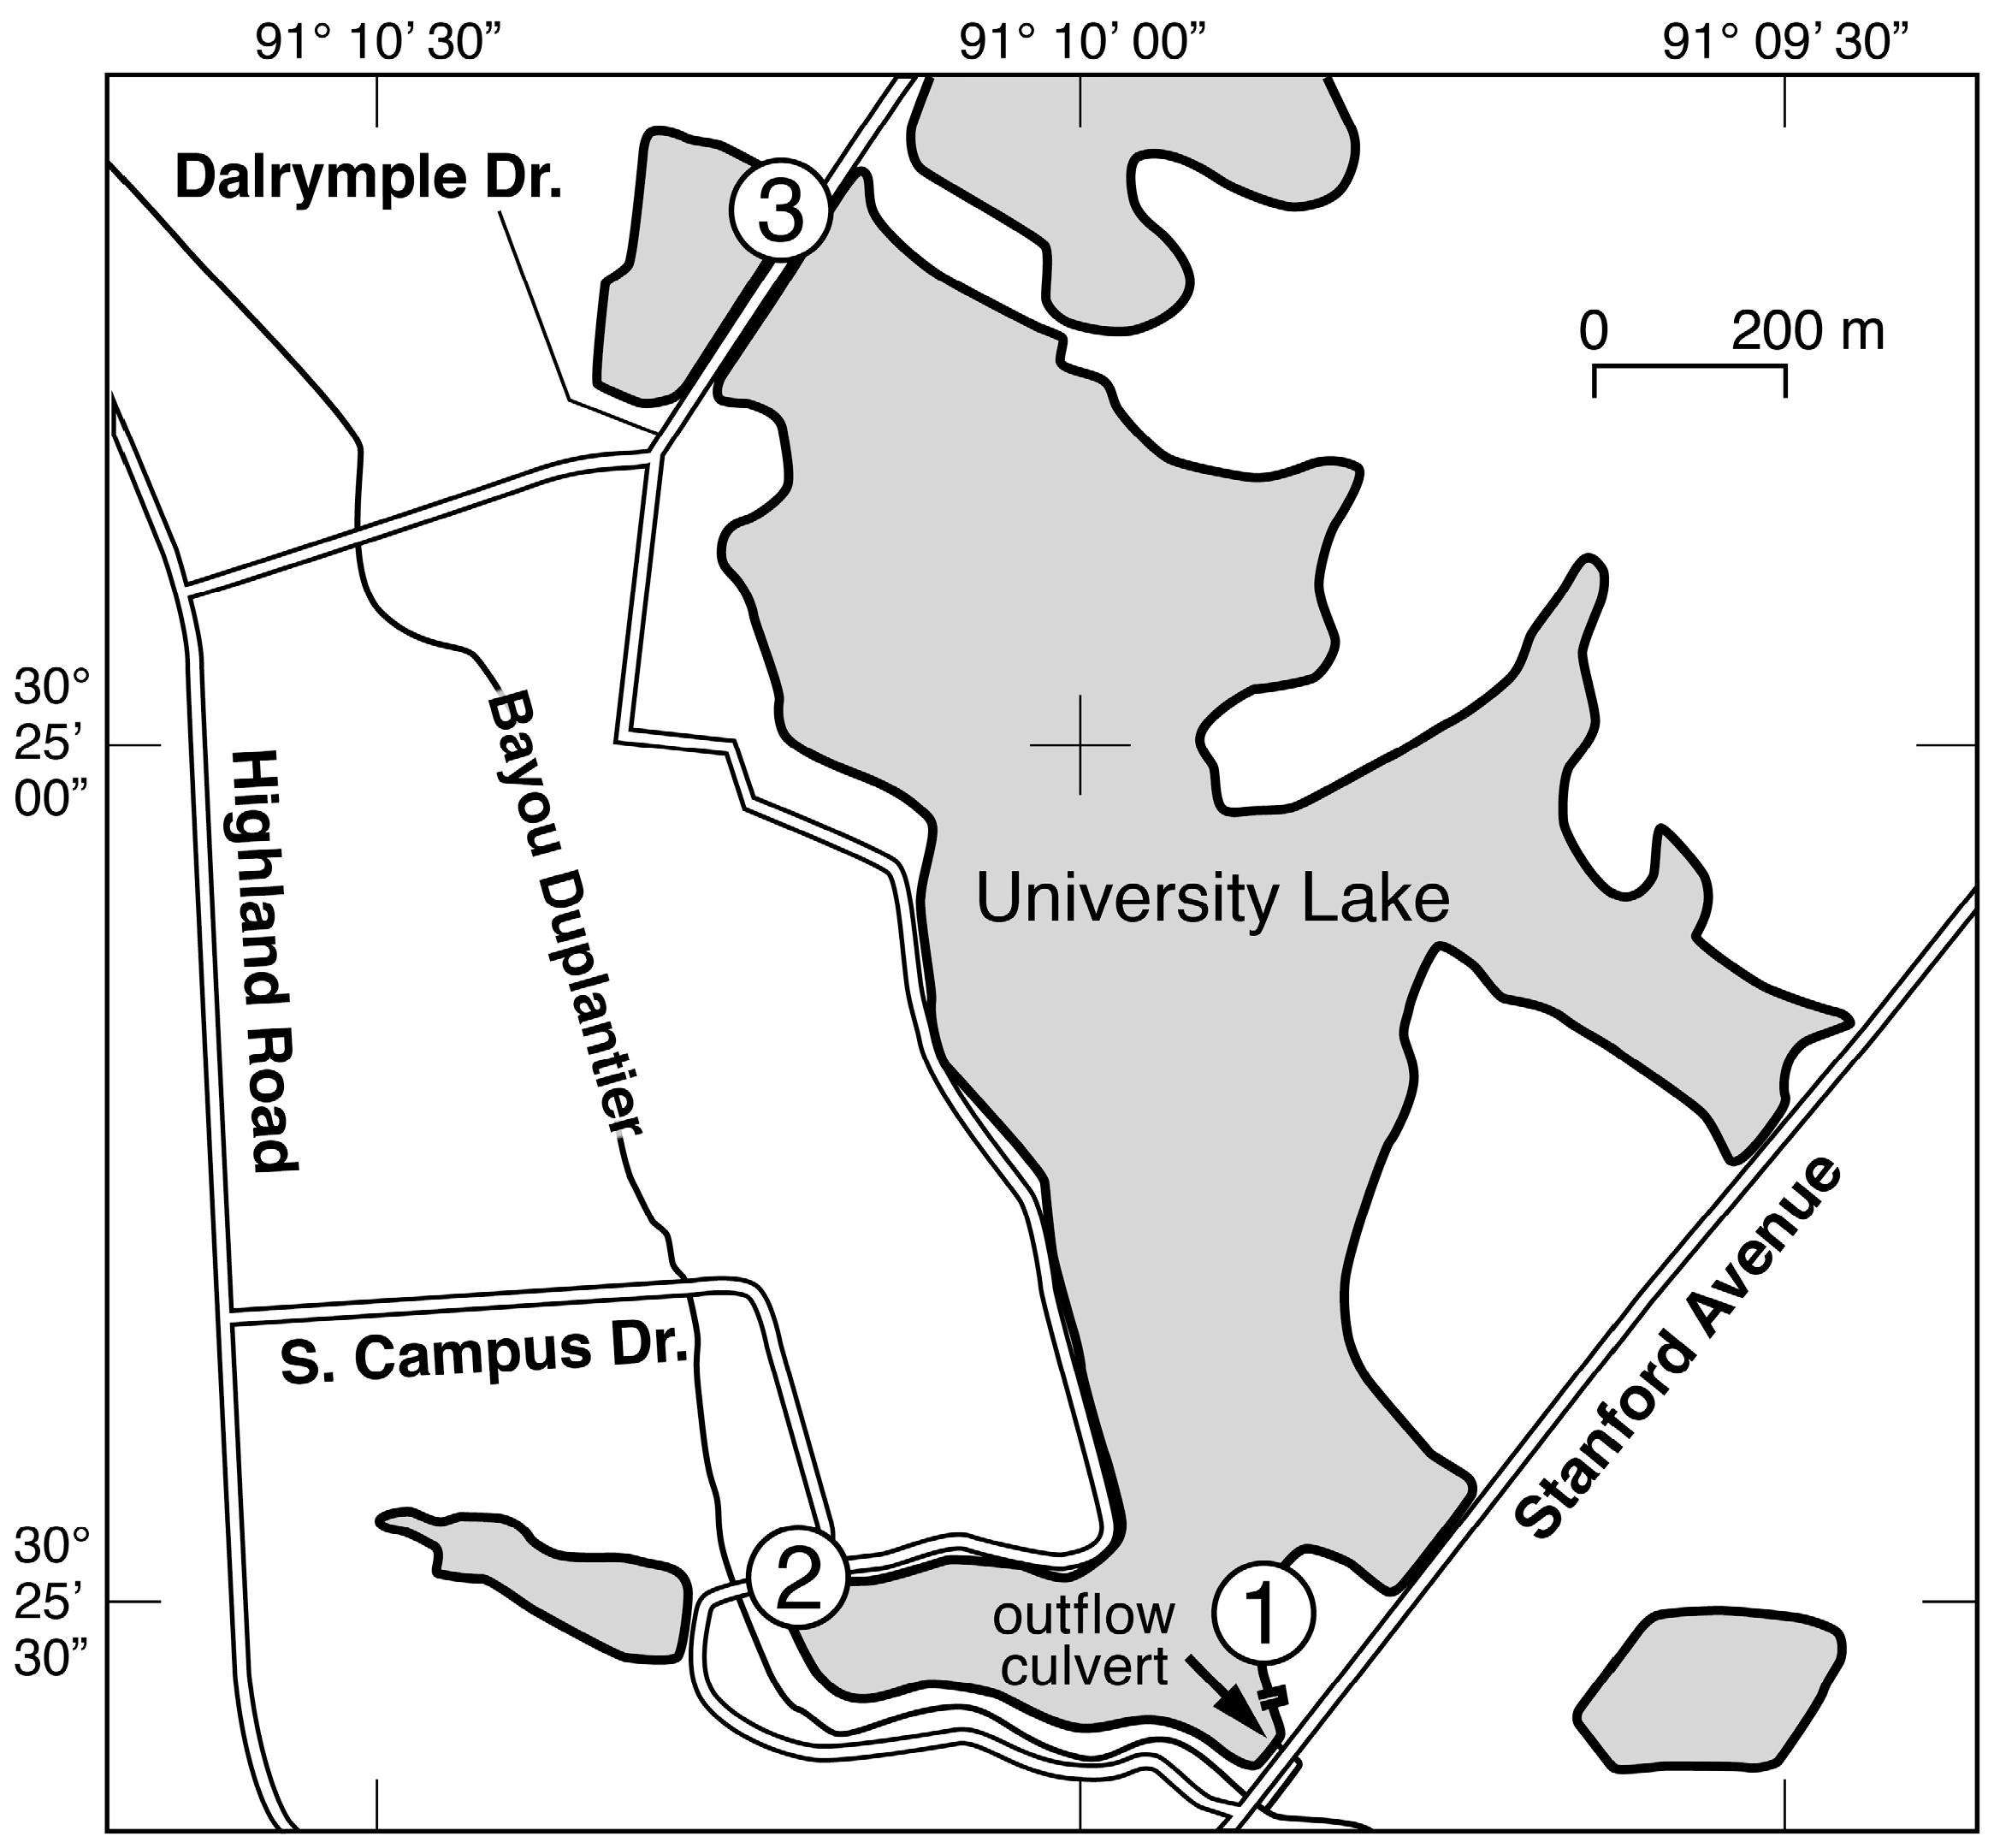
Water samples were collected on approximately a weekly basis from 23 February 2011 to 15 February 2012 from three sites around the perimeter of the lake (
Figure 1). In addition to this routine water sampling, additional samples were collected 1–2 days after an episodic event. An episodic event was defined to be at least one centimeter of precipitation recorded during a one-hour period at the LSU Southern Regional Climate Center weather station on the perimeter of University Lake. The time interval of 1–2 days was chosen to allow time for a response from the phytoplankton community. At each site, four 500 mL samples were collected from a depth of 30 cm with a Niskin bottle and transferred to pre-cleaned polypropylene bottles. Samples were collected at approximately 8 a.m. on each day. Site 1 was located adjacent to a popular recreational area, where a boat launch and dock facilitated collection of water samples. Site 2 was located adjacent to several LSU dormitories at a location where samples could be easily collected from the lake bank. Site 3 was located on a land bridge that separates University Lake from the adjacent Crest Lake, and a railed bridge provided a convenient location for sample collection.
After collection, all water samples were transported to a laboratory in the LSU Environmental Sciences Department, the transit time being approximately 10 min. The samples were processed for measurements of photosynthetic rates, respiration rates, and the concentrations of inorganic nutrients and photosynthetic pigments. The inorganic nutrients included ammonium + ammonia (hereafter ammonium), phosphate, nitrate + nitrite (hereafter nitrate), and silicate. Aliquots of water were filtered through glass fiber (Whatman GF/F) filters for pigment and inorganic nutrient analyses. The filters were immediately frozen, and the pigments collected on the filters subsequently extracted in acetone. Pigment analyses were carried out with a high-pressure liquid chromatograph (HPLC) (Agilent Technologies, Santa Clara, CA) according to the protocol of Bidigare et al. [
15]. The HPLC system consisted of a Varian model 9012 HPLC equipped with a Varian model 9300 auto-sampler, a Timberline column heater, and a Waters Spherisorb 5 μm ODS-2 analytical column (diameter: 4.6 mm, length: 250 mm) and corresponding guard cartridge. Pigments were detected with a ThermoSeparation Products UV2000 detector. Inorganic nutrients were assayed on the sample filtrates with an OI Analytical Flow Solutions IV autoanalyzer using the colorimetric procedures described in Strickland and Parsons [
16], with modifications for automated analysis.
Photosynthetic rates and respiration rates were determined from changes in the oxygen concentrations in whole-water samples incubated separately in replicate 60 mL glass BOD bottles in the light and dark for four hours. In all cases, both sets of incubations were carried out at a temperature of 20 °C. The light incubations were carried out at an irradiance of 400 μmol photons m
−2 s
−1 of 400–700 nm radiation provided by a bank of fluorescent lamps. We assumed this irradiance to be sufficient to saturate photosynthetic rates [
17,
18]. Oxygen concentrations were measured during the first eight months by Winkler titration [
16] and during the final four months with a YSI model 5905 oxygen meter. The change in methodology was based on the fact that the oxygen meter measurements could be performed more quickly and easily than the Winkler titrations. Comparisons of oxygen concentrations measured on identical samples with the two methods revealed no significant difference (
p > 0.10). To avoid artifacts associated with the formation of oxygen bubbles during the light incubations, water samples were initially bubbled with N
2 gas for approximately 30 s to ensure that O
2 concentrations remained below saturation during the subsequent incubations. Oxygen concentrations were assayed initially (after bubbling with N
2) and at the end of all incubations. Gross oxygen production was calculated as the difference in the O
2 concentrations in the light and dark bottles at the end of the incubation. Respiration was equated to the difference between the O
2 concentrations in the dark bottle at the beginning and end of the incubation. Photosynthetic rates and respiration rates were converted to a carbon basis by assuming a photosynthetic quotient of 1.1 and a respiratory quotient of 0.9, respectively [
19]. Assimilation ratios (grams carbon per gram chlorophyll per hour) were then calculated from the ratio of the carbon-normalized gross photosynthetic rate and the chlorophyll
a (chl
a) concentration.
Seasons of the year were defined as follows: spring, 22 March to 21 June; summer, 22 June to 21 September; fall, 22 September to 21 December; winter, 22 December to 21 March. A Kruskal–Wallis (KW) test was used to determine whether there were significant differences between event and non-event values of inorganic nutrient concentrations, assimilation ratios, pigment concentrations, and the ratio of respiration to photosynthesis. A KW test was also used to determine whether there were significant differences of chl a concentrations between sampling sites. Pearson product-moment correlation coefficients were used to determine whether there were significant correlations between pigment concentrations. In all statistical tests, the null hypothesis was rejected if the type I error rate (p) was less than 0.05. Multiple linear regression analysis was used to identify diagnostic pigments that accounted for a significant (p < 0.05) percentage of the variance of the chl a concentrations. Principal components analysis was used to identify patterns in the relationships between the diagnostic pigments identified in the multiple linear regression analysis.
4. Results
Rainfall during the one-year study totaled 141 mm, about 92% of the long-term average (154 mm y
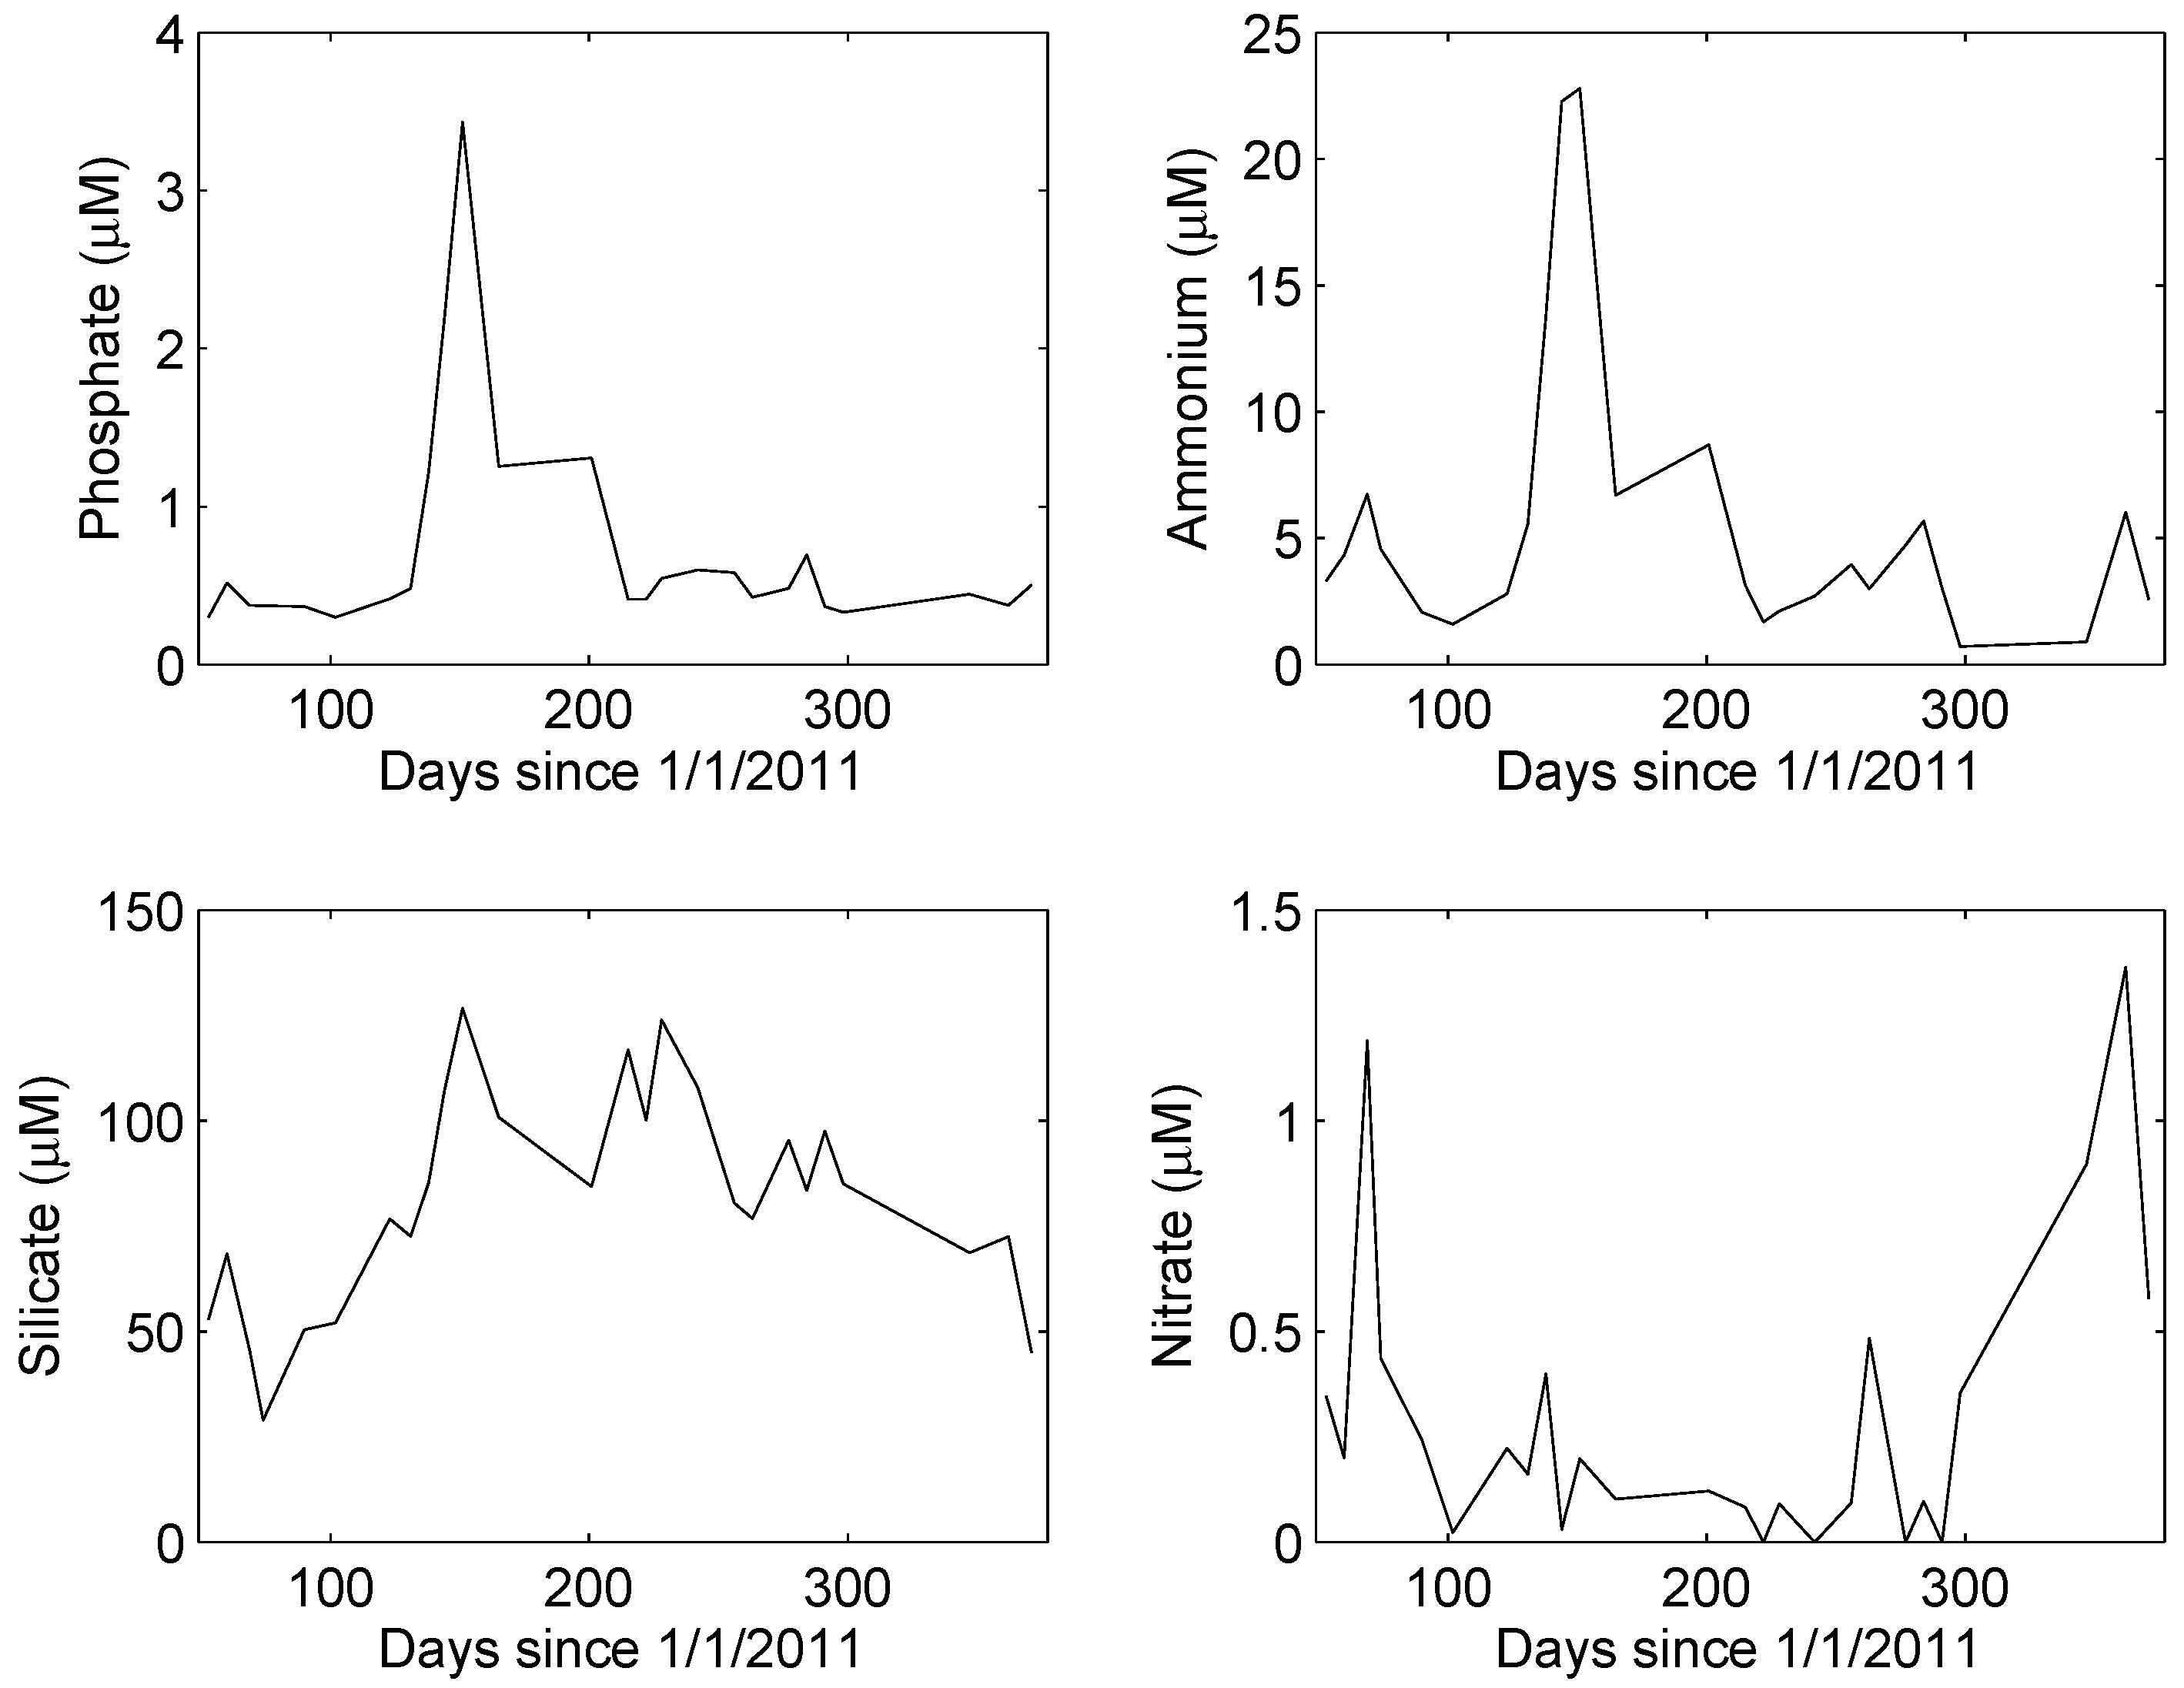
−1). Inorganic nutrient concentrations in University Lake under non-event conditions followed a distinctly non-random temporal pattern (
Figure 2). Concentrations of phosphate and ammonium were highest during the spring, although rainfall was below average during the months of April, May, and June. Silicate concentrations were high during the late spring and summer and low during the winter. Nitrate concentrations, in contrast, were highest in the winter. A Kruskal–Wallis (KW) test revealed no significant differences in ammonium, phosphate, or silicate concentrations during non-event and post-event conditions (
p > 0.32). However, the KW test revealed a significant difference in nitrate concentrations (
p < 7 × 10
−5), median concentrations during non-event, and post-event conditions being 0.16 and 0.60 μM, respectively.
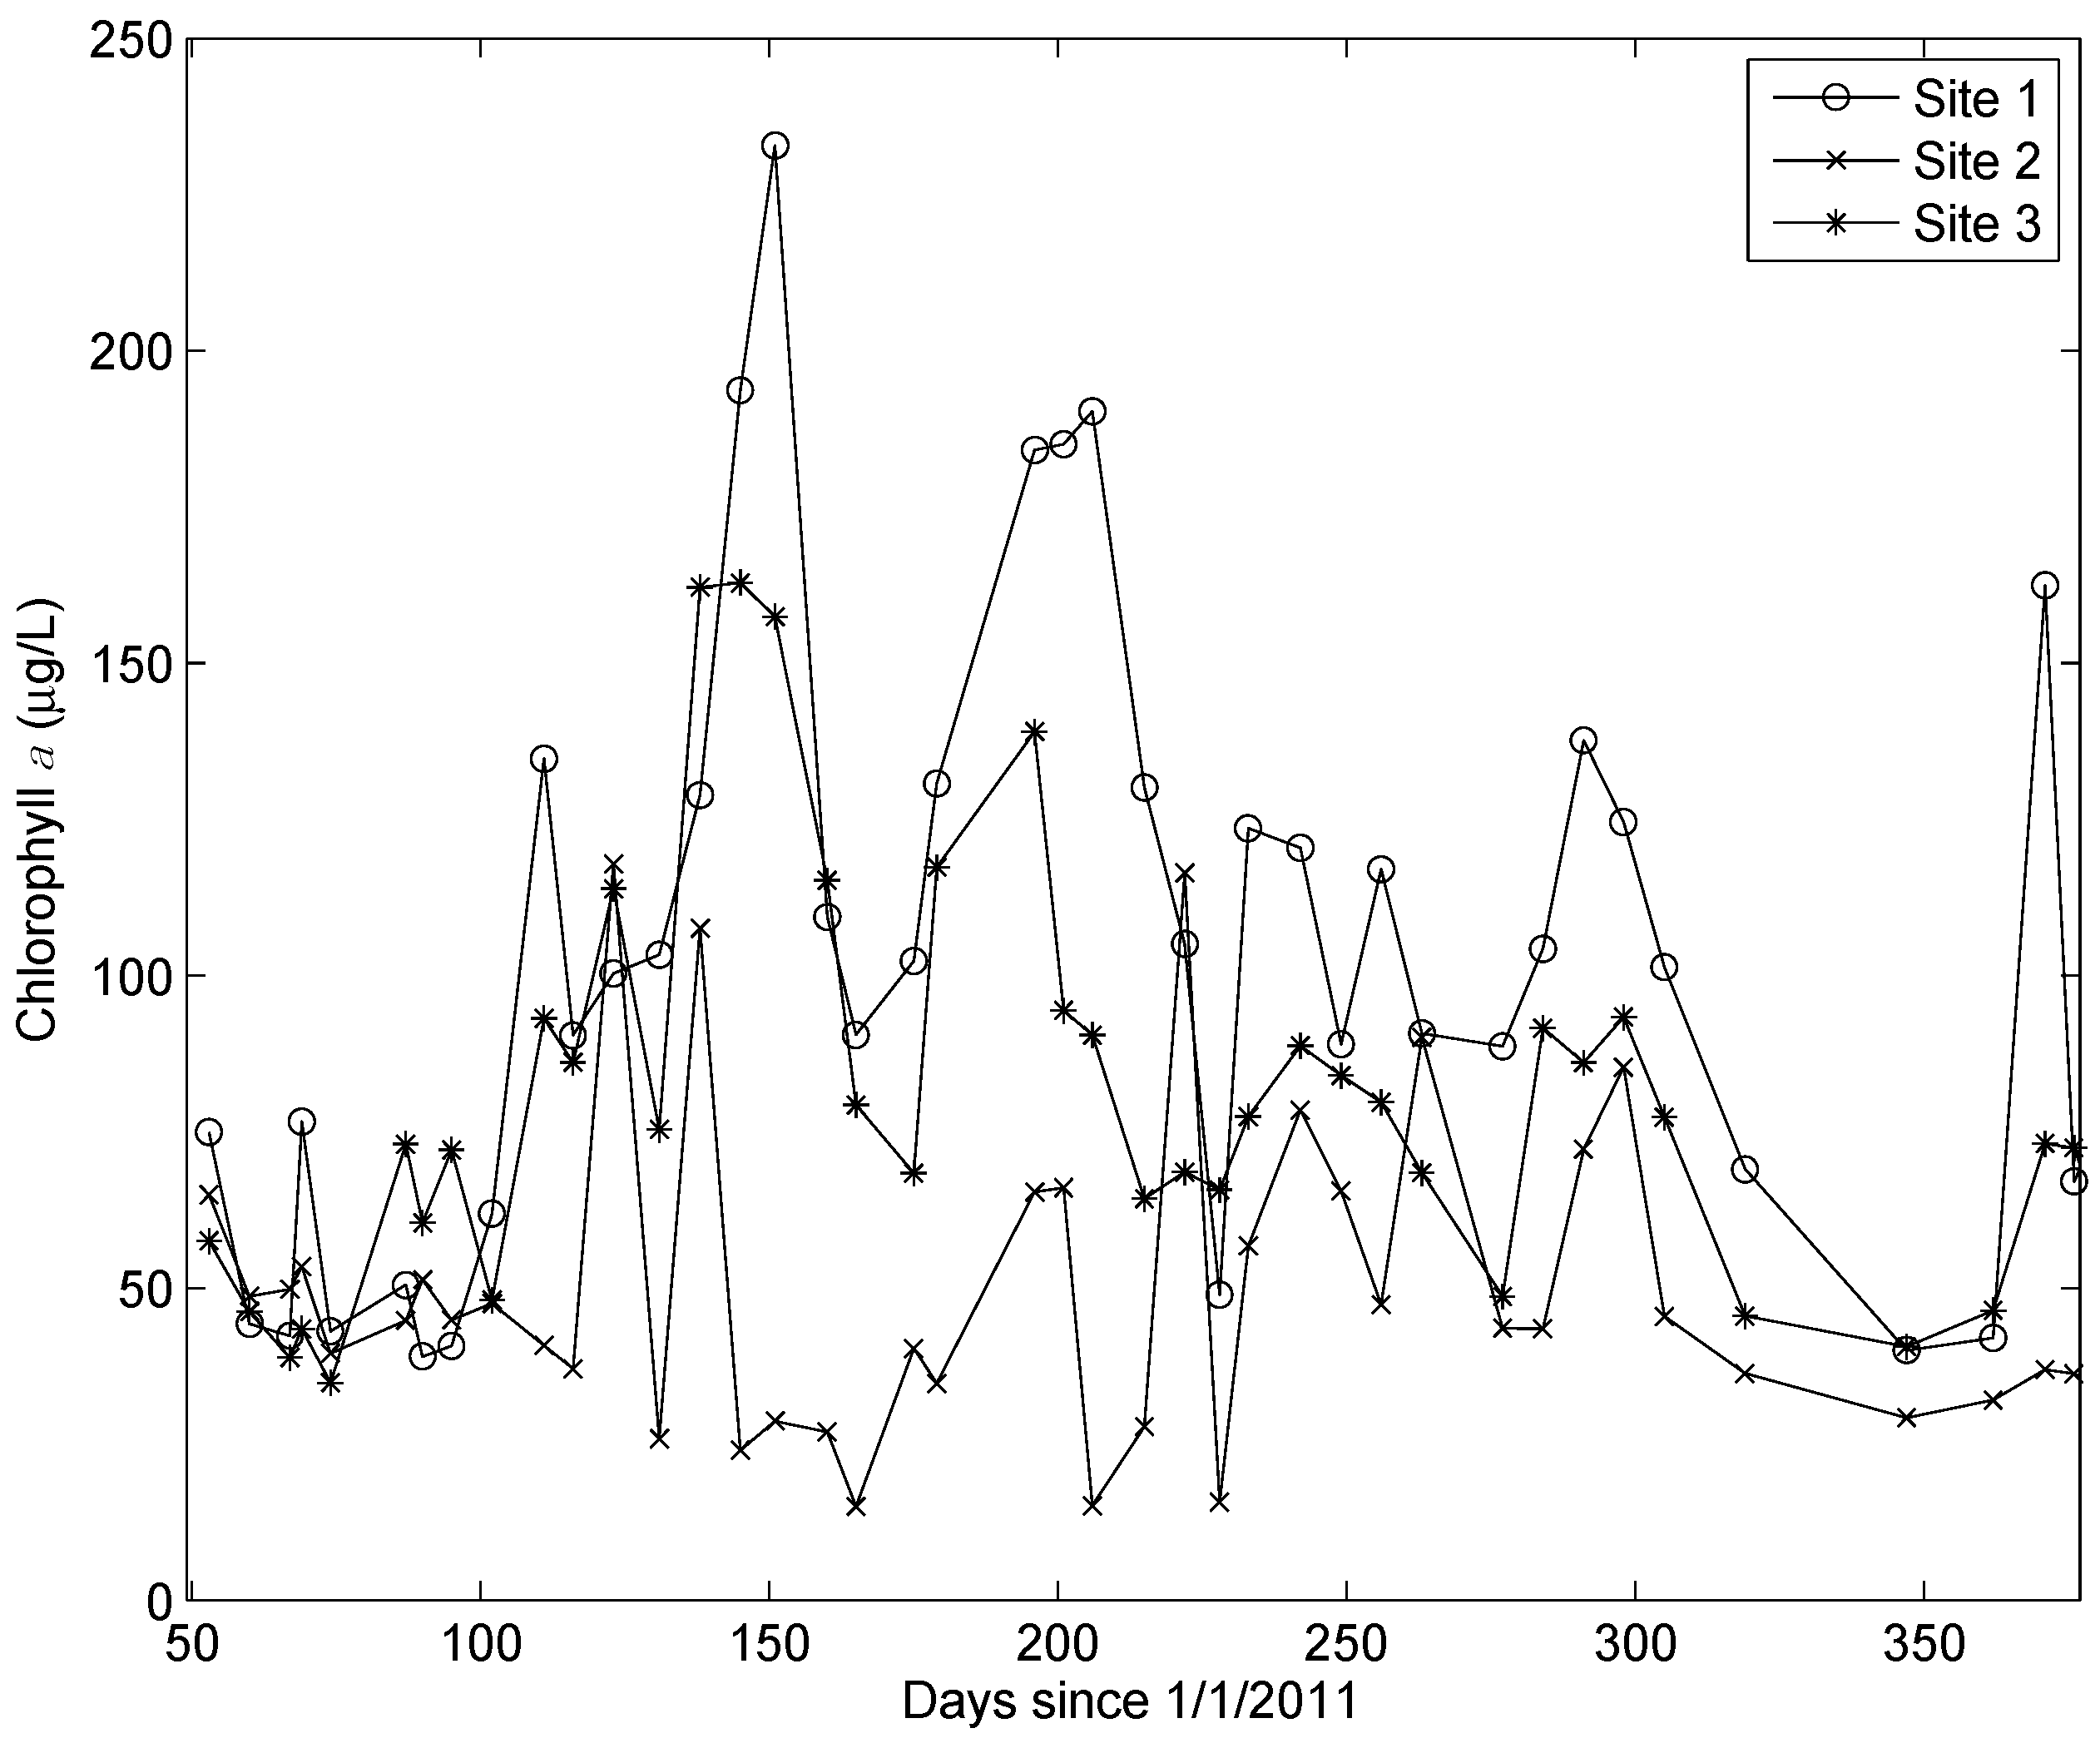
There was a highly significant difference in the chl
a concentrations at the three sites. The highest concentrations consistently occurred at Site 1 and the lowest concentrations at Site 2 (
Figure 3). The HPLC analyses revealed that 19’butanoyloxyfucoxanthin, 19’hexanoyloxyfucoxanthin, peridinin, and prasinoxanthin were undetectable on all occasions at all stations. These results imply the absence of Pelagophyceae, Prymnesiophyceae, Dinophyceae, and Prasinophyceae, respectively, in the algal community [
20]. The accessory pigments routinely detected in the samples included α and β carotene, chl
b, and the xanthophylls alloxanthin, diadinoxanthin, fucoxanthin, lutein, violaxanthin, and zeaxanthin. Chlorophyll
c was detected in 20% of the samples. There was a very high correlation between chl
b and lutein (
r = 0.94,
p < 10
−64) and a very significant correlation between fucoxanthin and diadinoxanthin (
r = 0.81,
p < 10
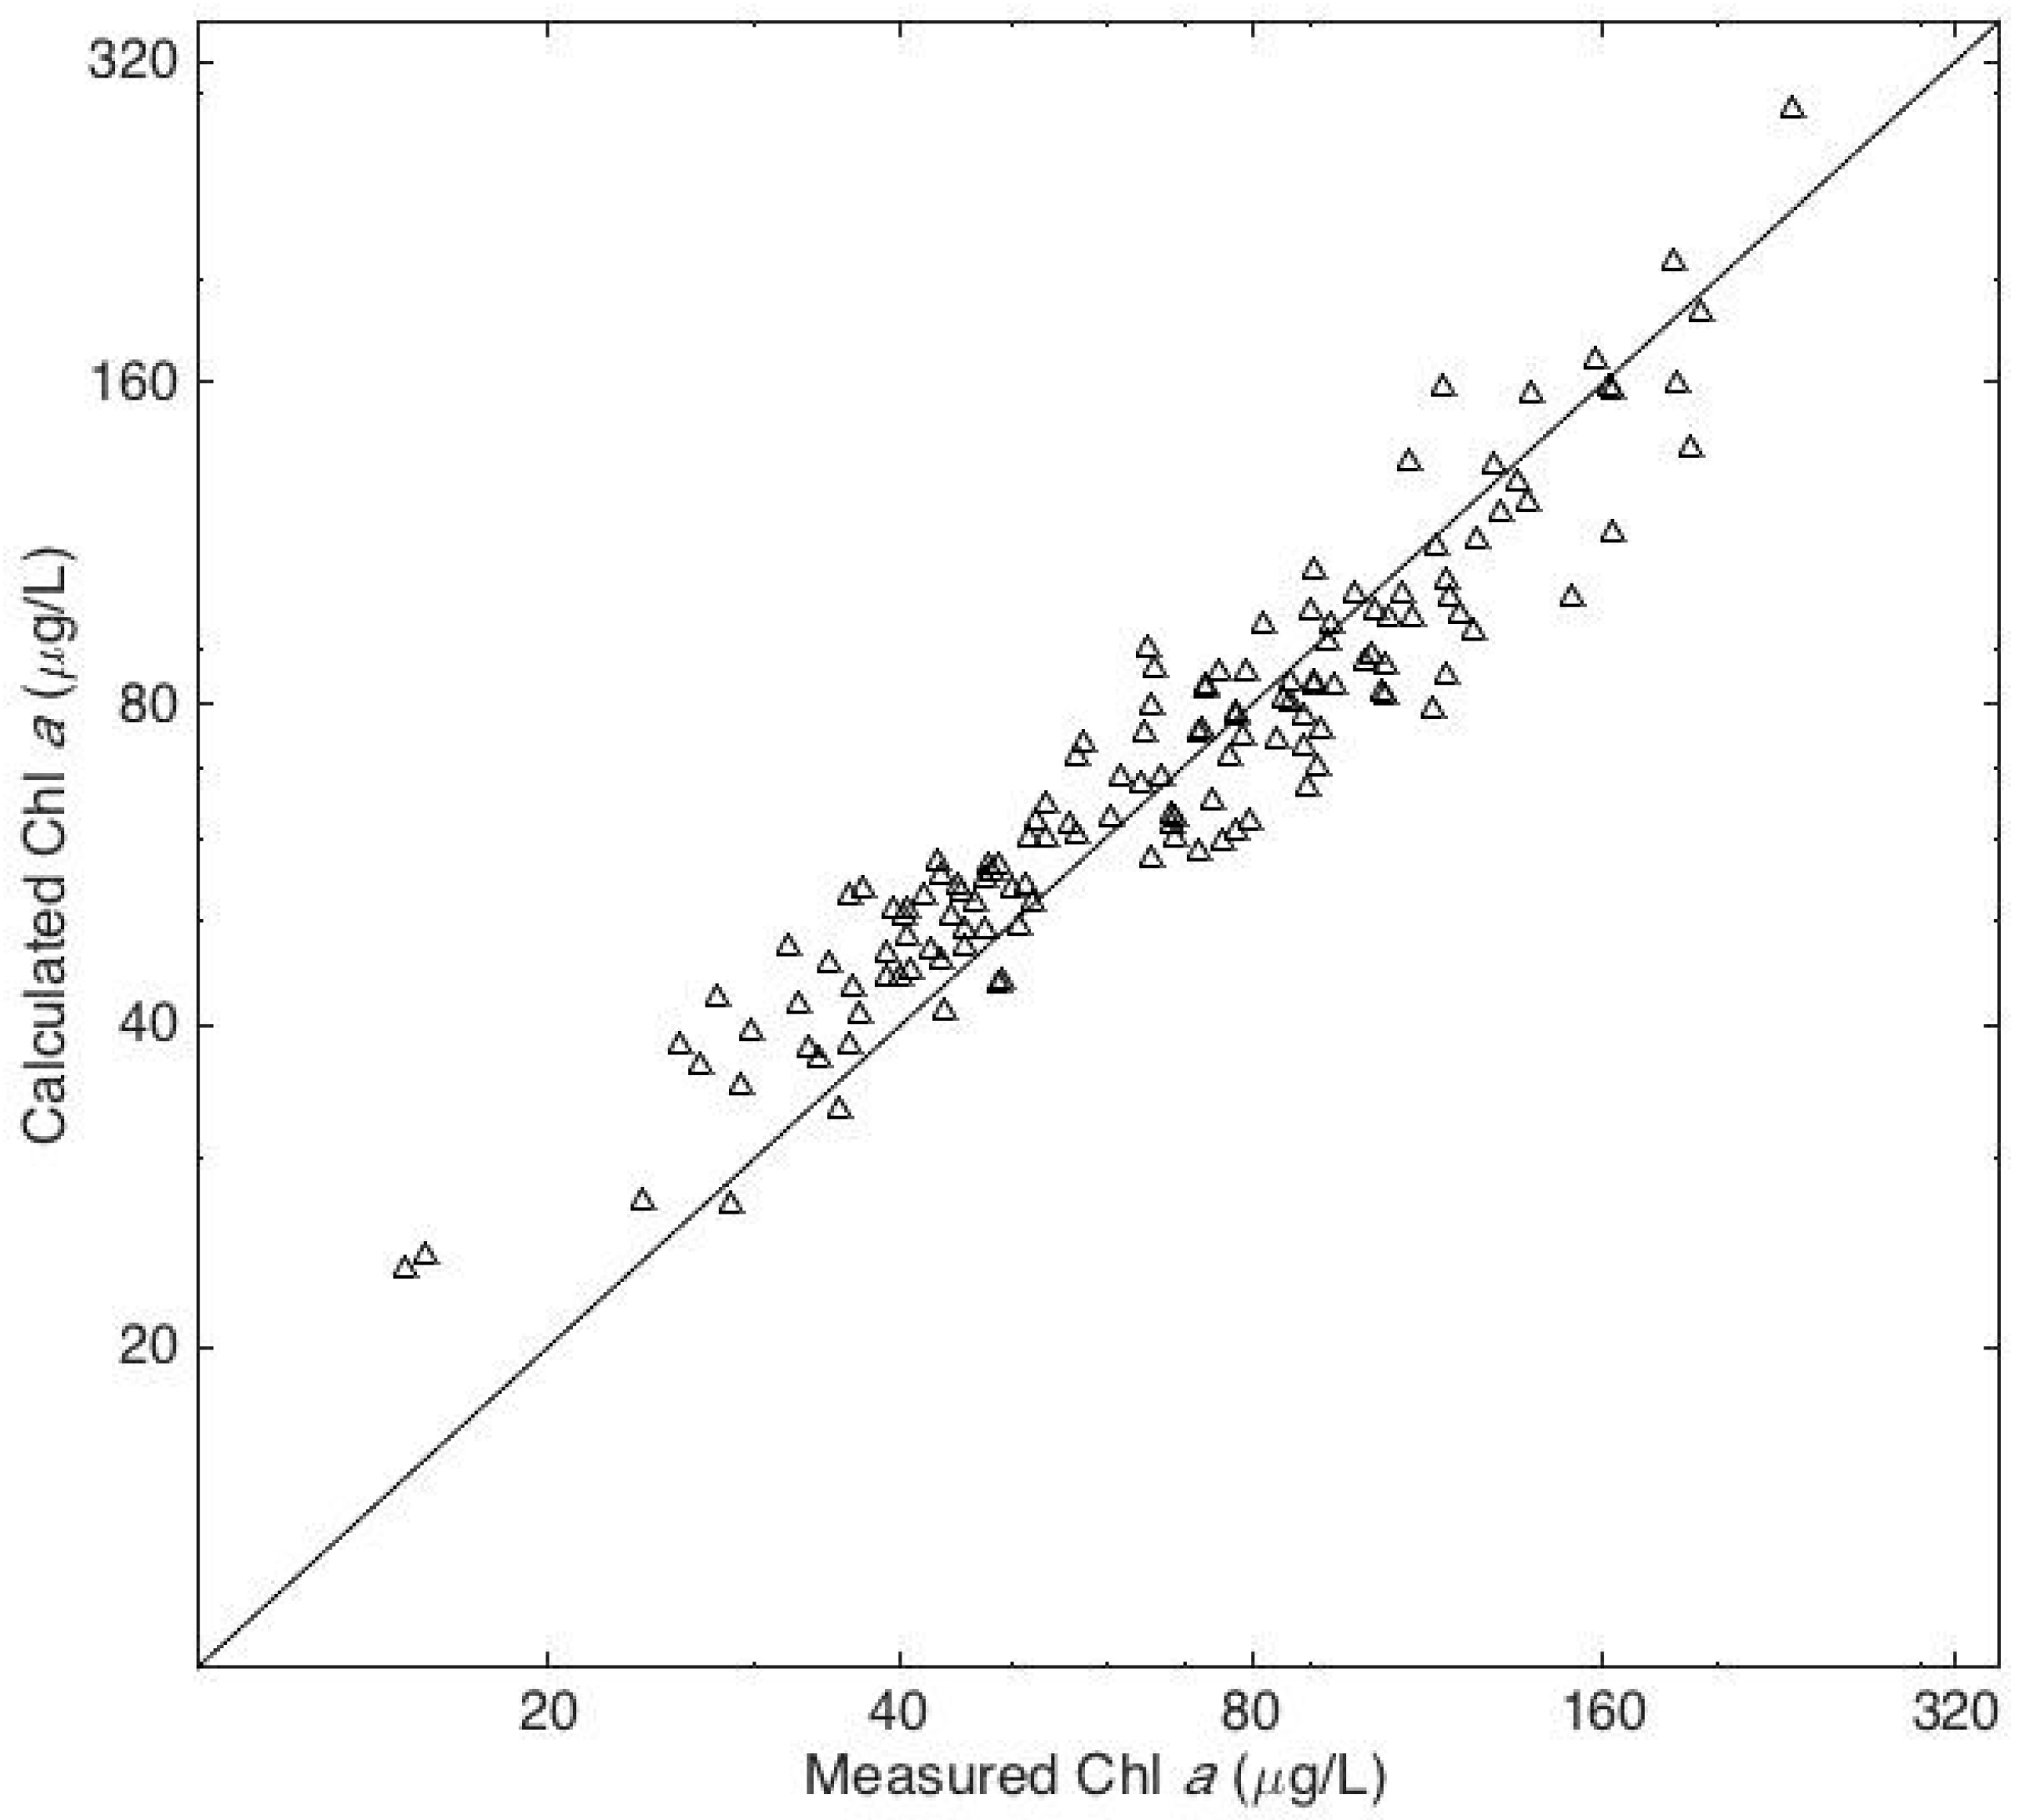
−32). Multiple linear regression analysis revealed that 87% of the variance in the chl
a concentrations could be accounted for by variations in three accessory pigments: chl
b, fucoxanthin, and zeaxanthin (
Figure 4). The predictive equation was as follows:
where fuco and zea are the concentrations of fucoxanthin and zeaxanthin, respectively, and all concentrations are in units of micrograms per liter.
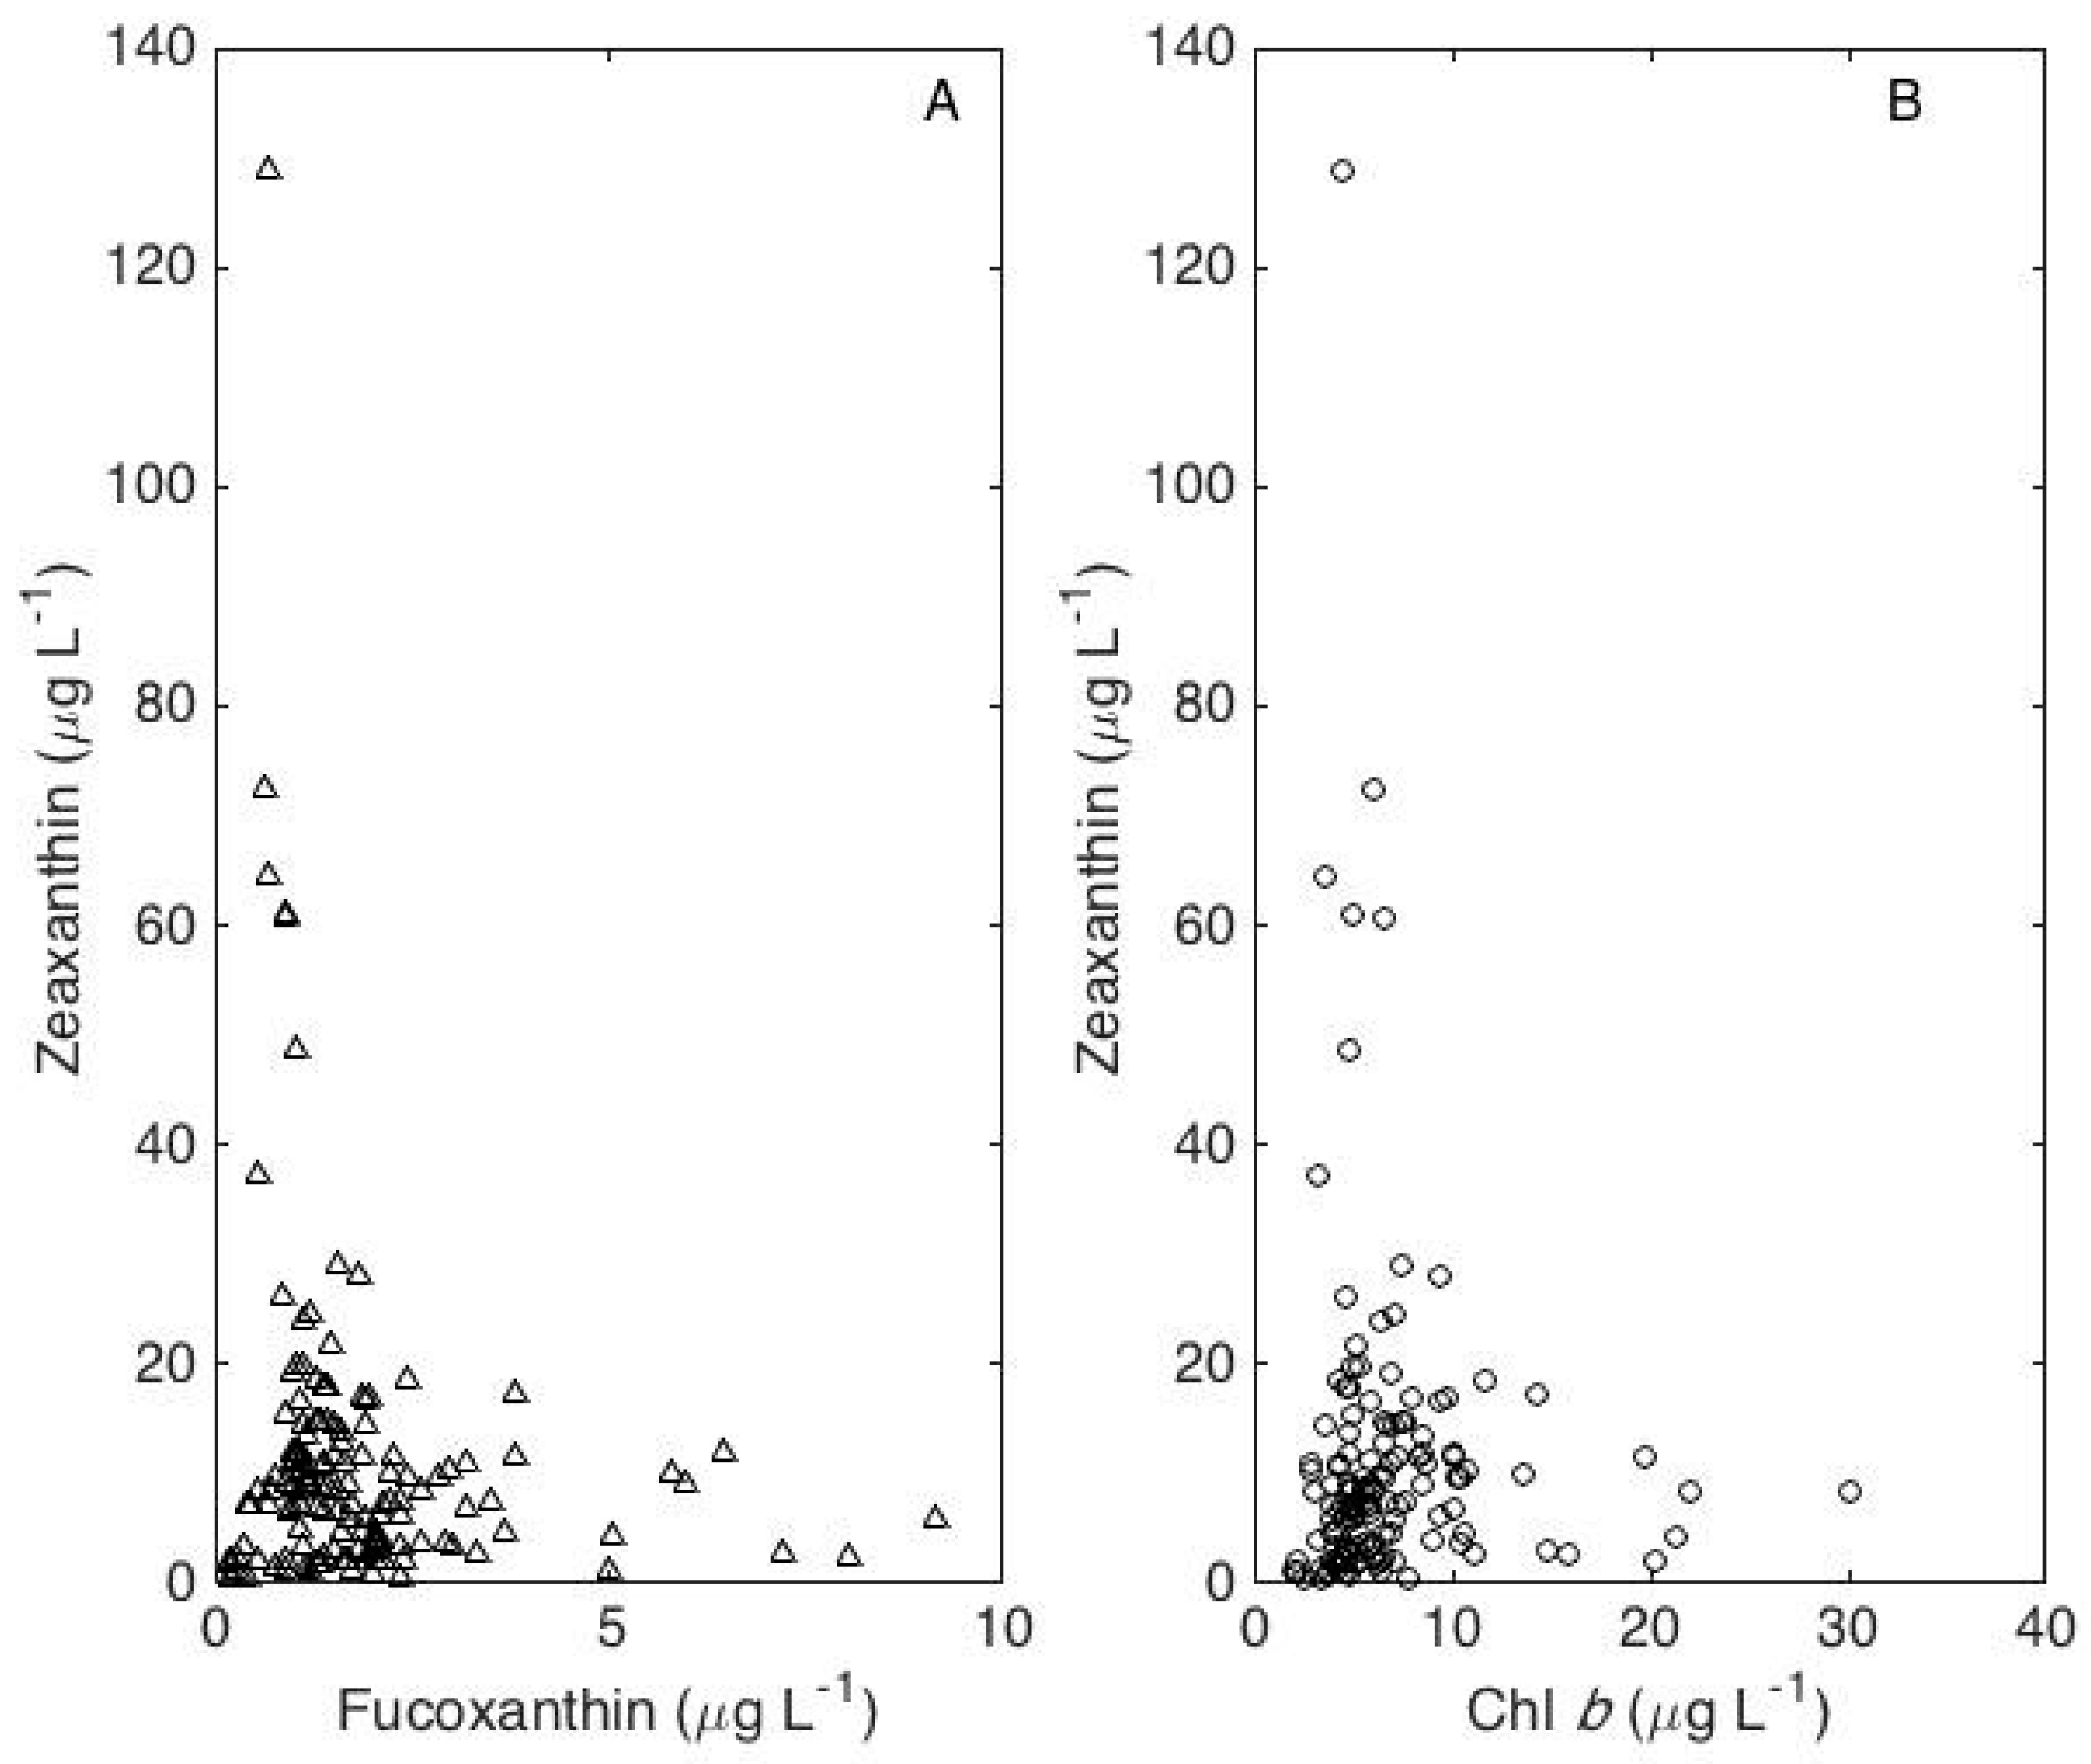
A principal components analysis of the chl
b, fucoxanthin, and zeaxanthin concentrations identified a first principal component that accounted for 46% of the total variance and consisted of positive contributions from chl
b and fucoxanthin and a negative contribution from zeaxanthin. High concentrations of fucoxanthin occurred only when zeaxanthin concentrations were low, and high concentrations of zeaxanthin occurred only when fucoxanthin concentrations were low (
Figure 5A). Likewise, high concentrations of chl
b occurred only when zeaxanthin concentrations were low, and high concentrations of zeaxanthin occurred only when chl
b concentrations were low (
Figure 5B).
There were 17 episodic events during the course of the study. A KW test revealed no significant difference (p > 0.3) in the concentrations of chl a, chl b, fucoxanthin, and zeaxanthin on non-event and post-event days. However, assimilation ratios were significantly higher (KW test, p < 0.0056) on post-event days; median values on non-event and post-event days were 3.1 (2.5–3.4) and 4.0 (3.3–4.9) g C g−1 chl a h−1, respectively, where the values in parentheses are the 95% confidence intervals. Ratios of respiration to photosynthesis were virtually identical on non-event and post-event days, median values being 0.14 and 0.13, respectively.
5. Discussion
Chlorophyll
b is found in both Chlorophyceae and Prasinophyceae, but the absence of prasinoxanthin implies that all the chl
b in University Lake is associated with Chlorophyceae [
21]. This conclusion is supported by the very high correlation between chl
b and lutein (
r = 0.94,
p < 0.001), which is diagnostic for Chlorophyceae [
21]. Fucoxanthin is found in Bacillariophyceae, Prymnesiophyceae, Pelagophyceae, and Chrysophyceae [
21]. However, the absence of 19’butanoyloxyfucoxanthin and 19’hexanoyloxyfucoxanthin rules out Pelagophyceae and Prymnesiophyceae, respectively [
20,
21]. Although both Bacillariophyceae and Chrysophyceae contain fucoxanthin, of the two only Bacillariophyceae contain diadinoxanthin [
22]. In the absence of Prymnesiophyceae, Pelagophyceae, and Dinophyceae, diadinoxanthin is diagnostic for Bacillariophyceae. We found a good correlation between fucoxanthin and diadinoxanthin (
r = 0.78,
p < 0.001), the suggestion being that most of the fucoxanthin was associated with Bacillariophyceae. In the absence of Prasinophyceae, zeaxanthin would be associated only with Cyanobacteria and Chlorophyceae [
20,
22]. However, the absence of a significant correlation between zeaxanthin and either chl
b (
p = 0.56) or lutein (
p = 0.39) suggests that most of the zeaxanthin was associated with Cyanobacteria.
The average composition of the phytoplankton community in University Lake can be estimated from the regression coefficients in Equation (1) and the average concentrations of chl a, chl b, fucoxanthin, and zeaxanthin, 75.3, 6.8, 1.8, and 11.5 μg L−1, respectively. Assuming the regression coefficients to be the ratios of chl a to chl b, fucoxanthin, and zeaxanthin in Chlorophyceae, Bacillariophyceae, and Cyanophyceae, respectively, we estimate that these three classes of phytoplankton accounted for 51%, 10%, and 31%, respectively, of the chl a in University Lake.
Variations in alloxanthin did not explain a significant percentage of the chl
a variance, but alloxanthin was consistently present at low concentrations. Because alloxanthin is diagnostic for Cryptophyceae, it is clear that a small percentage of the phytoplankton community consisted of Cryptophyceae. Descy et al. [
23] estimated the alloxanthin:chl
a ratio to be 0.3 in freshwater cryptophytes. Dividing the average alloxanthin concentration in University Lake, 765 ng L
−1, by 0.3 implies that Cryptophyceae accounted for about 3.4% of the chl
a in University Lake. The pigment analysis could thus identify the classes of phytoplankton that accounted for about 95% of the chl
a in University Lake.
The explanation for the negative contribution from zeaxanthin to the first principal component is apparent from an examination of the relationships between zeaxanthin and fucoxanthin (
Figure 5A) and between zeaxanthin and chl
b (
Figure 5B). The fact that high concentrations of Cyanophyceae were invariably associated with low concentrations of both Chlorophyceae and Bacillariophyceae, and conversely, may reflect allelopathic interactions. Natural waters containing high concentrations of algae are frequently very inhibitory, and when large populations of Cyanophyceae are present, the filtrate from the water is algistatic to all species [
24] (p. 469).
The assimilation ratios can be converted to growth rates by dividing them by the C:chl
a ratio in the phytoplankton. Riemann et al. [
25] estimated this ratio to average about 38.5 in several eutrophic lakes. After combining lacustrine results with data from marine enclosures, they noted that most of the C:chl
a ratios fell in the range 27–67. If we assume the C:chl
a ratio of the phytoplankton in University Lake to be 38.5, assimilation ratios of 3.1 and 4.0 g C g
−1 chl
a h
−1 translate to growth rates of 0.08 and 0.10 h
−1, respectively. Because the incubations were carried out at an irradiance of 400 μmol photons m
−2 s
−1, these rates can be considered light-saturated [
26]. Assuming respiration rates during the day and night to be the same and equal to 13.5% of the gross photosynthetic rates (vide supra), these rates translate to 0.70 d
−1 and 0.91 d
−1 for growth on a 12:12 light/dark cycle. The former rate is very consistent with the average growth rate of 0.6 d
−1 estimated by pigment labeling of phytoplankton growing in mesocosms in the Neuse River [
27]. Despite the high chl
a concentrations in the lake (75.3 μg L
−1), light was probably sufficient to saturate photosynthetic rates at all depths. Assuming a mean spectral extinction coefficient of 14 m
2 g
−1 chl
a [
28], we estimate the visible light extinction coefficient to be 1.05 m
−1. The irradiance at the bottom of the lake (0.86 m) is therefore estimated to be about 40% of the surface irradiance. Surface irradiance in Baton Rouge varies between an average of 510 and 885 μmol photons m
−2 s
−1 of 400–700 nm radiation in January and June, respectively.
One concern in a hypereutrophic lake such as University Lake is the possibility that oxygen concentrations will drop to dangerously low levels at night. At a chl
a concentration of 75.3 μg L
−1, respiration rates following storm events would be expected to be about (75.3 μg chl
a L
−1) × (4.0 μg C μg
−1 chl
a h
−1) × (0.13) = 39 μg C L
−1 h
−1 = 3.3 μmol C L
−1 h
−1. Assuming a respiratory quotient of 0.9 and 12 hours between sunset and sunrise, this respiration would be sufficient to reduce oxygen concentrations by (3.3/0.9) × (12) = 44 μmol O
2 L
−1 = 1.41 mg O
2 L
−1. At a temperature of 31 °C, the saturation oxygen concentration in freshwater is about 7.4 mg L
−1. The highest chl
a concentration that we measured in our study was about 240 μg L
−1, which would translate to a decrease of the O
2 concentration during the night of 4.49 mg O
2 L
−1 following a storm. It is thus possible that, during the late summer, respiration rates following a storm might be sufficient to reduce the O
2 to a concentration of ~3 mg L
−1 but still above the concentration of 2 mg L
−1 that is typically associated with hypoxia [
29].
These calculations suggest that the creation of anoxic conditions in University Lake is unlikely to result from the respiration of the phytoplankton in the lake, but it might result from the dieoff and subsequent decomposition of a phytoplankton bloom. Assuming a C:chl a ratio of 38.5, it follows that a chl a concentration of 240 μg L−1 would be associated with a phytoplankton carbon concentration of 9.2 mg L−1. Assuming a respiratory quotient of 0.9, the complete decomposition of this carbon would theoretically consume about 27.4 mg O2 L−1. Thus, decomposition of roughly 25–35% of the biomass in such a bloom could lead to complete anoxia, depending on the temperature and extent of gas exchange with the atmosphere.
The fact that assimilation ratios increased by 30% 1–2 days after rain events is noteworthy. Median concentrations of ammonium, nitrate, phosphate, and silicate in the lake were 4.0, 0.2, 0.5, and 81 μM, respectively. The ammonium concentrations were consistently above concentrations that would be expected to limit phytoplankton growth [
30], and silicate concentrations were consistently above concentrations that would be expected to limit diatom growth [
24,
31]. Phosphate concentrations that are limiting to phytoplankton growth are on the order of 10 nM [
32,
33], but the standard assay for molybdate-reactive phosphorus [
34] gives a positive response for a large number of dissolved organo-phosphorus compounds [
35], and it is therefore likely that the average molybdate-reactive phosphorus concentration of 0.5 μM is an overestimation of the inorganic phosphate concentration in University Lake. To the extent that phytoplankton biomass in the lake is limited by the concentration of a macronutrient, phosphate appears to be the most likely candidate, as is the case in many freshwater systems [
36,
37]. Assuming that phosphate is the limiting nutrient in University Lake, it is likely that an influx of phosphate from land runoff following a rain event would stimulate phytoplankton photosynthetic rates.
Given the 30% increase in assimilation ratios 1–2 days after rain events, the absence of a comparable change in phytoplankton biomass warrants comment. Grazing by herbivores seems an unlikely explanation. The very high biomass of phytoplankton in the lake would almost certainly be sufficient to saturate zooplankton feeding rates [
38]. If the phytoplankton were in fact growing at roughly 0.7 d
−1 prior to an event, then a 30% increase of that growth rate, in the absence of any increase in zooplankton grazing, would imply an increase of about 23% per day in the phytoplankton biomass.
Several factors may have contributed to the lack of a consistent increase in phytoplankton biomass after rain events. First, some time lag would be expected between the addition of nutrients and a change in the growth rate of the phytoplankton [
39]. Second, and perhaps most importantly, in a lake as shallow as University Lake, many cells undoubtedly settle to the bottom during quiescent conditions and are then resuspended by even a small amount of turbulence. During periods of little or no rain, chl
a concentrations in University Lake frequently varied by more than a factor of four from one week to the next. Such large changes, if caused by a combination of wind mixing and settling, could effectively obscure changes associated with nutrient input from land runoff.


