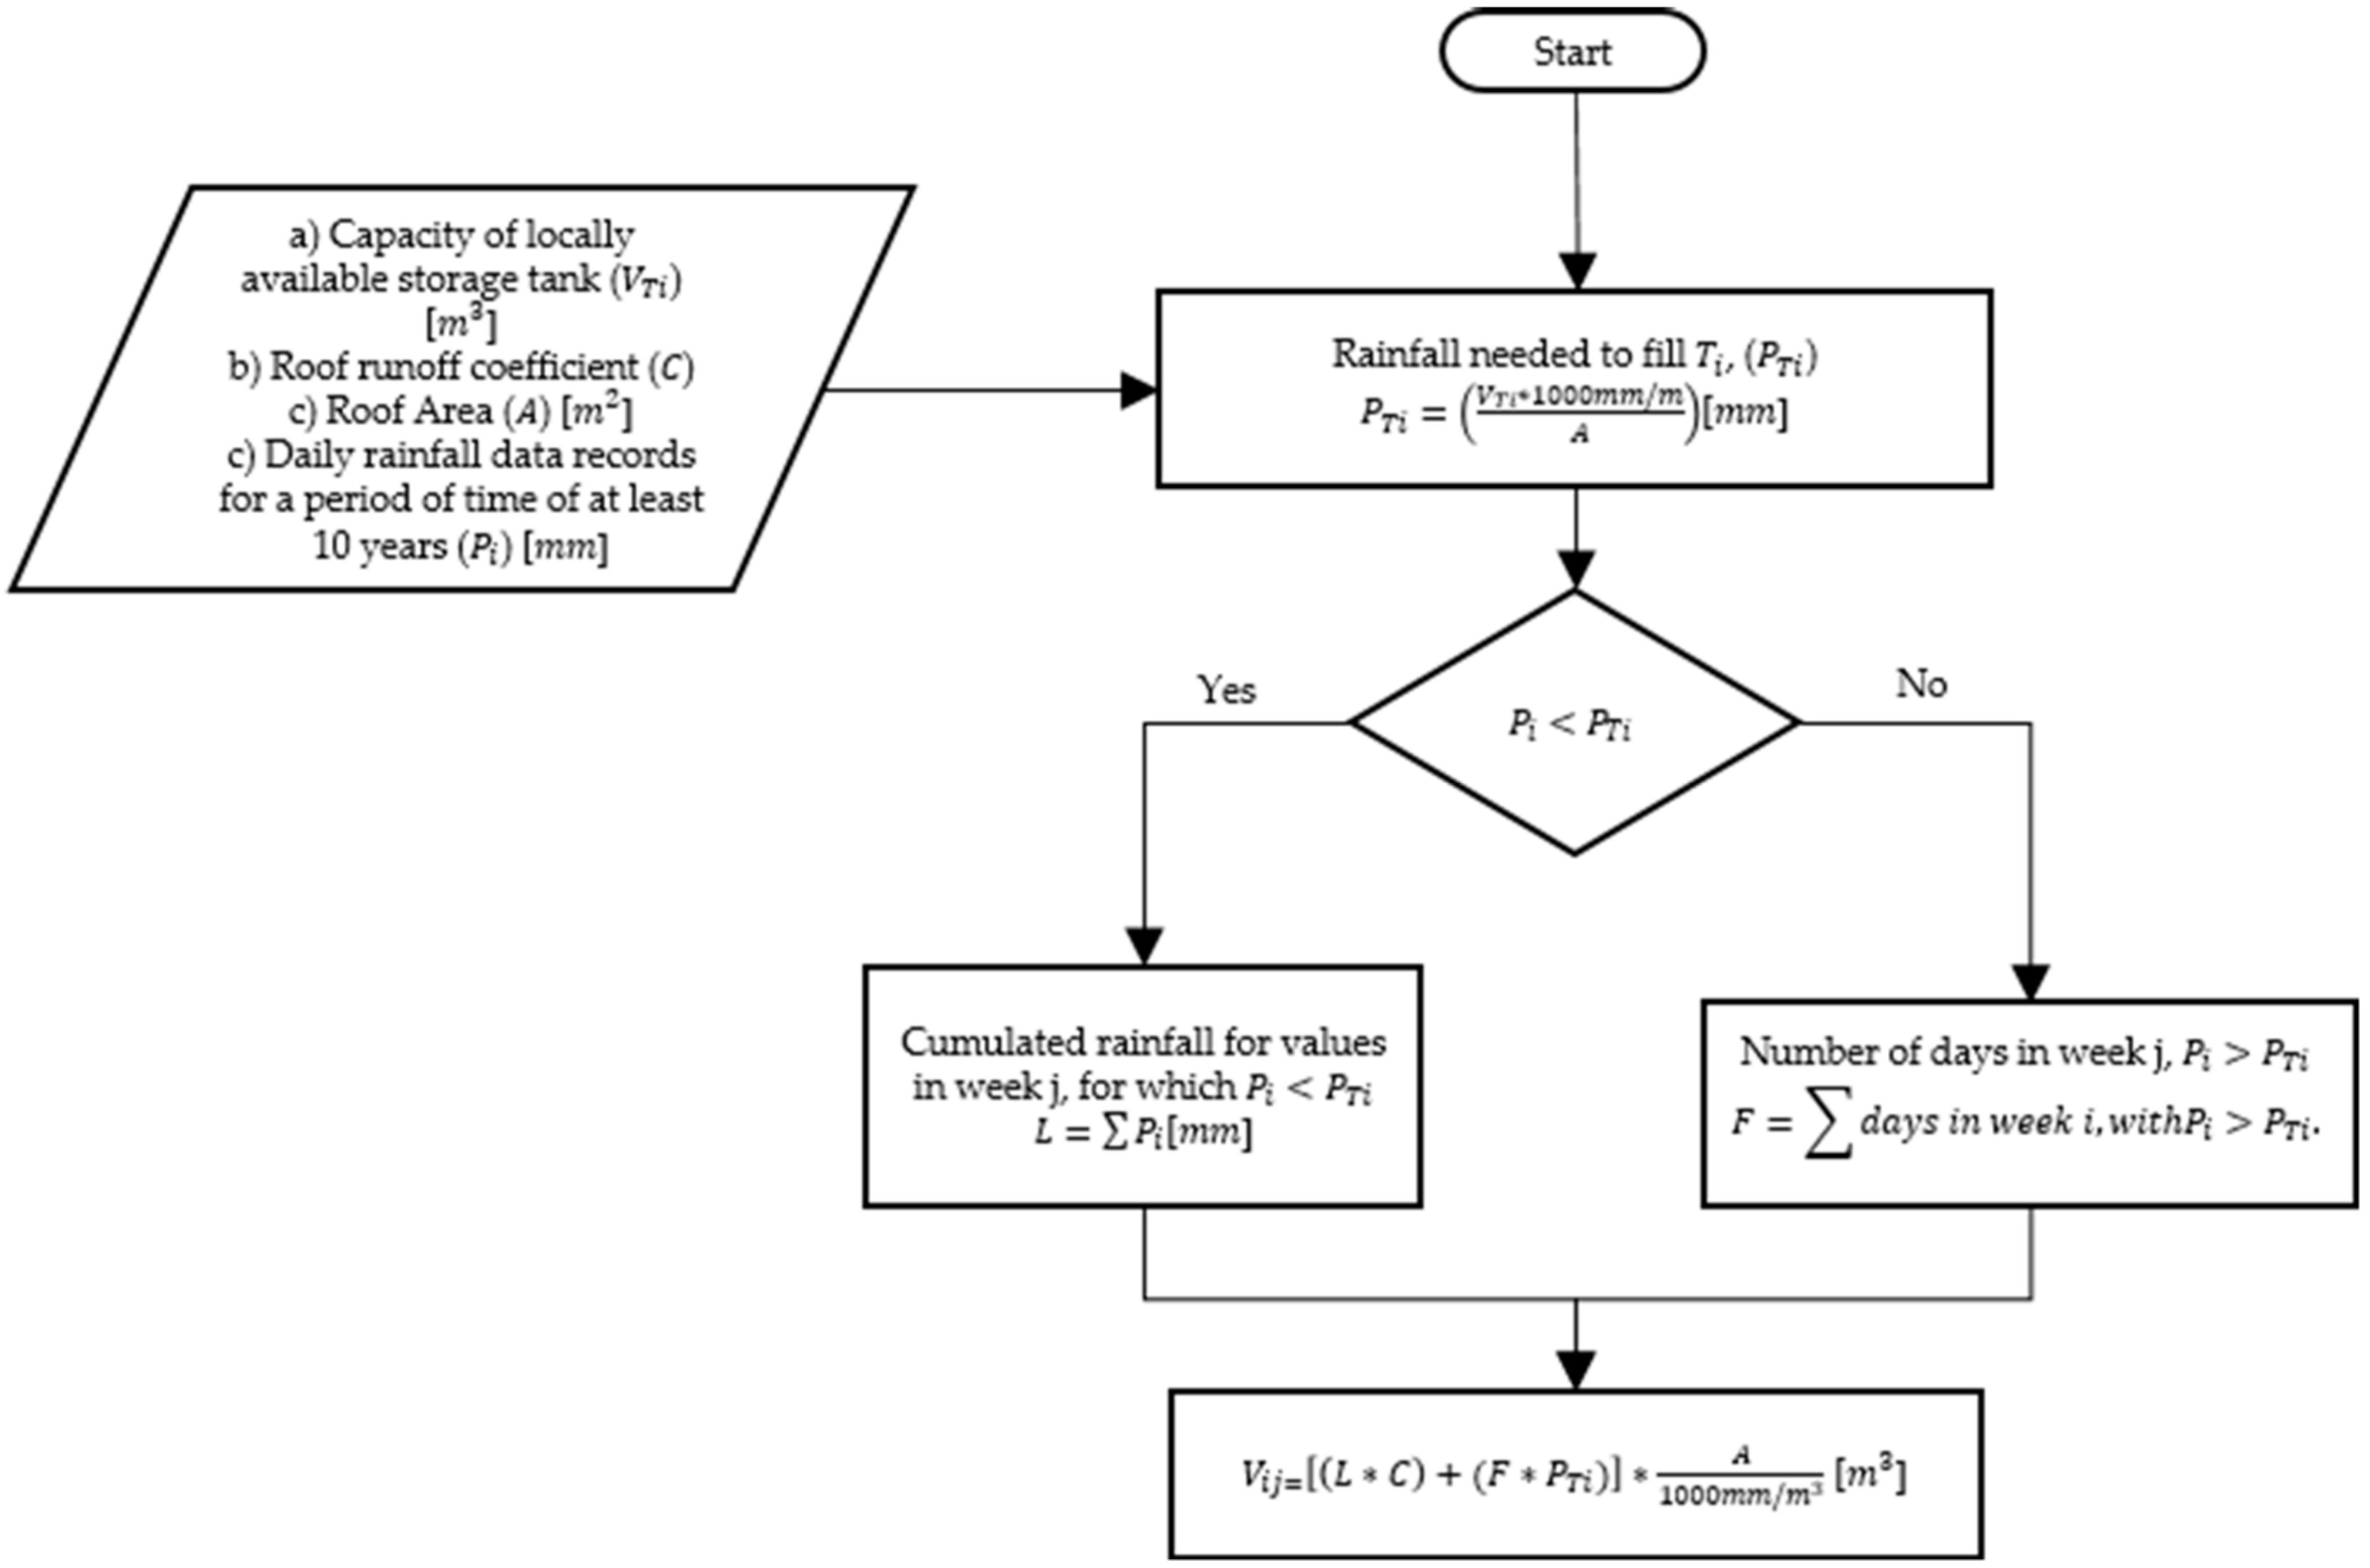
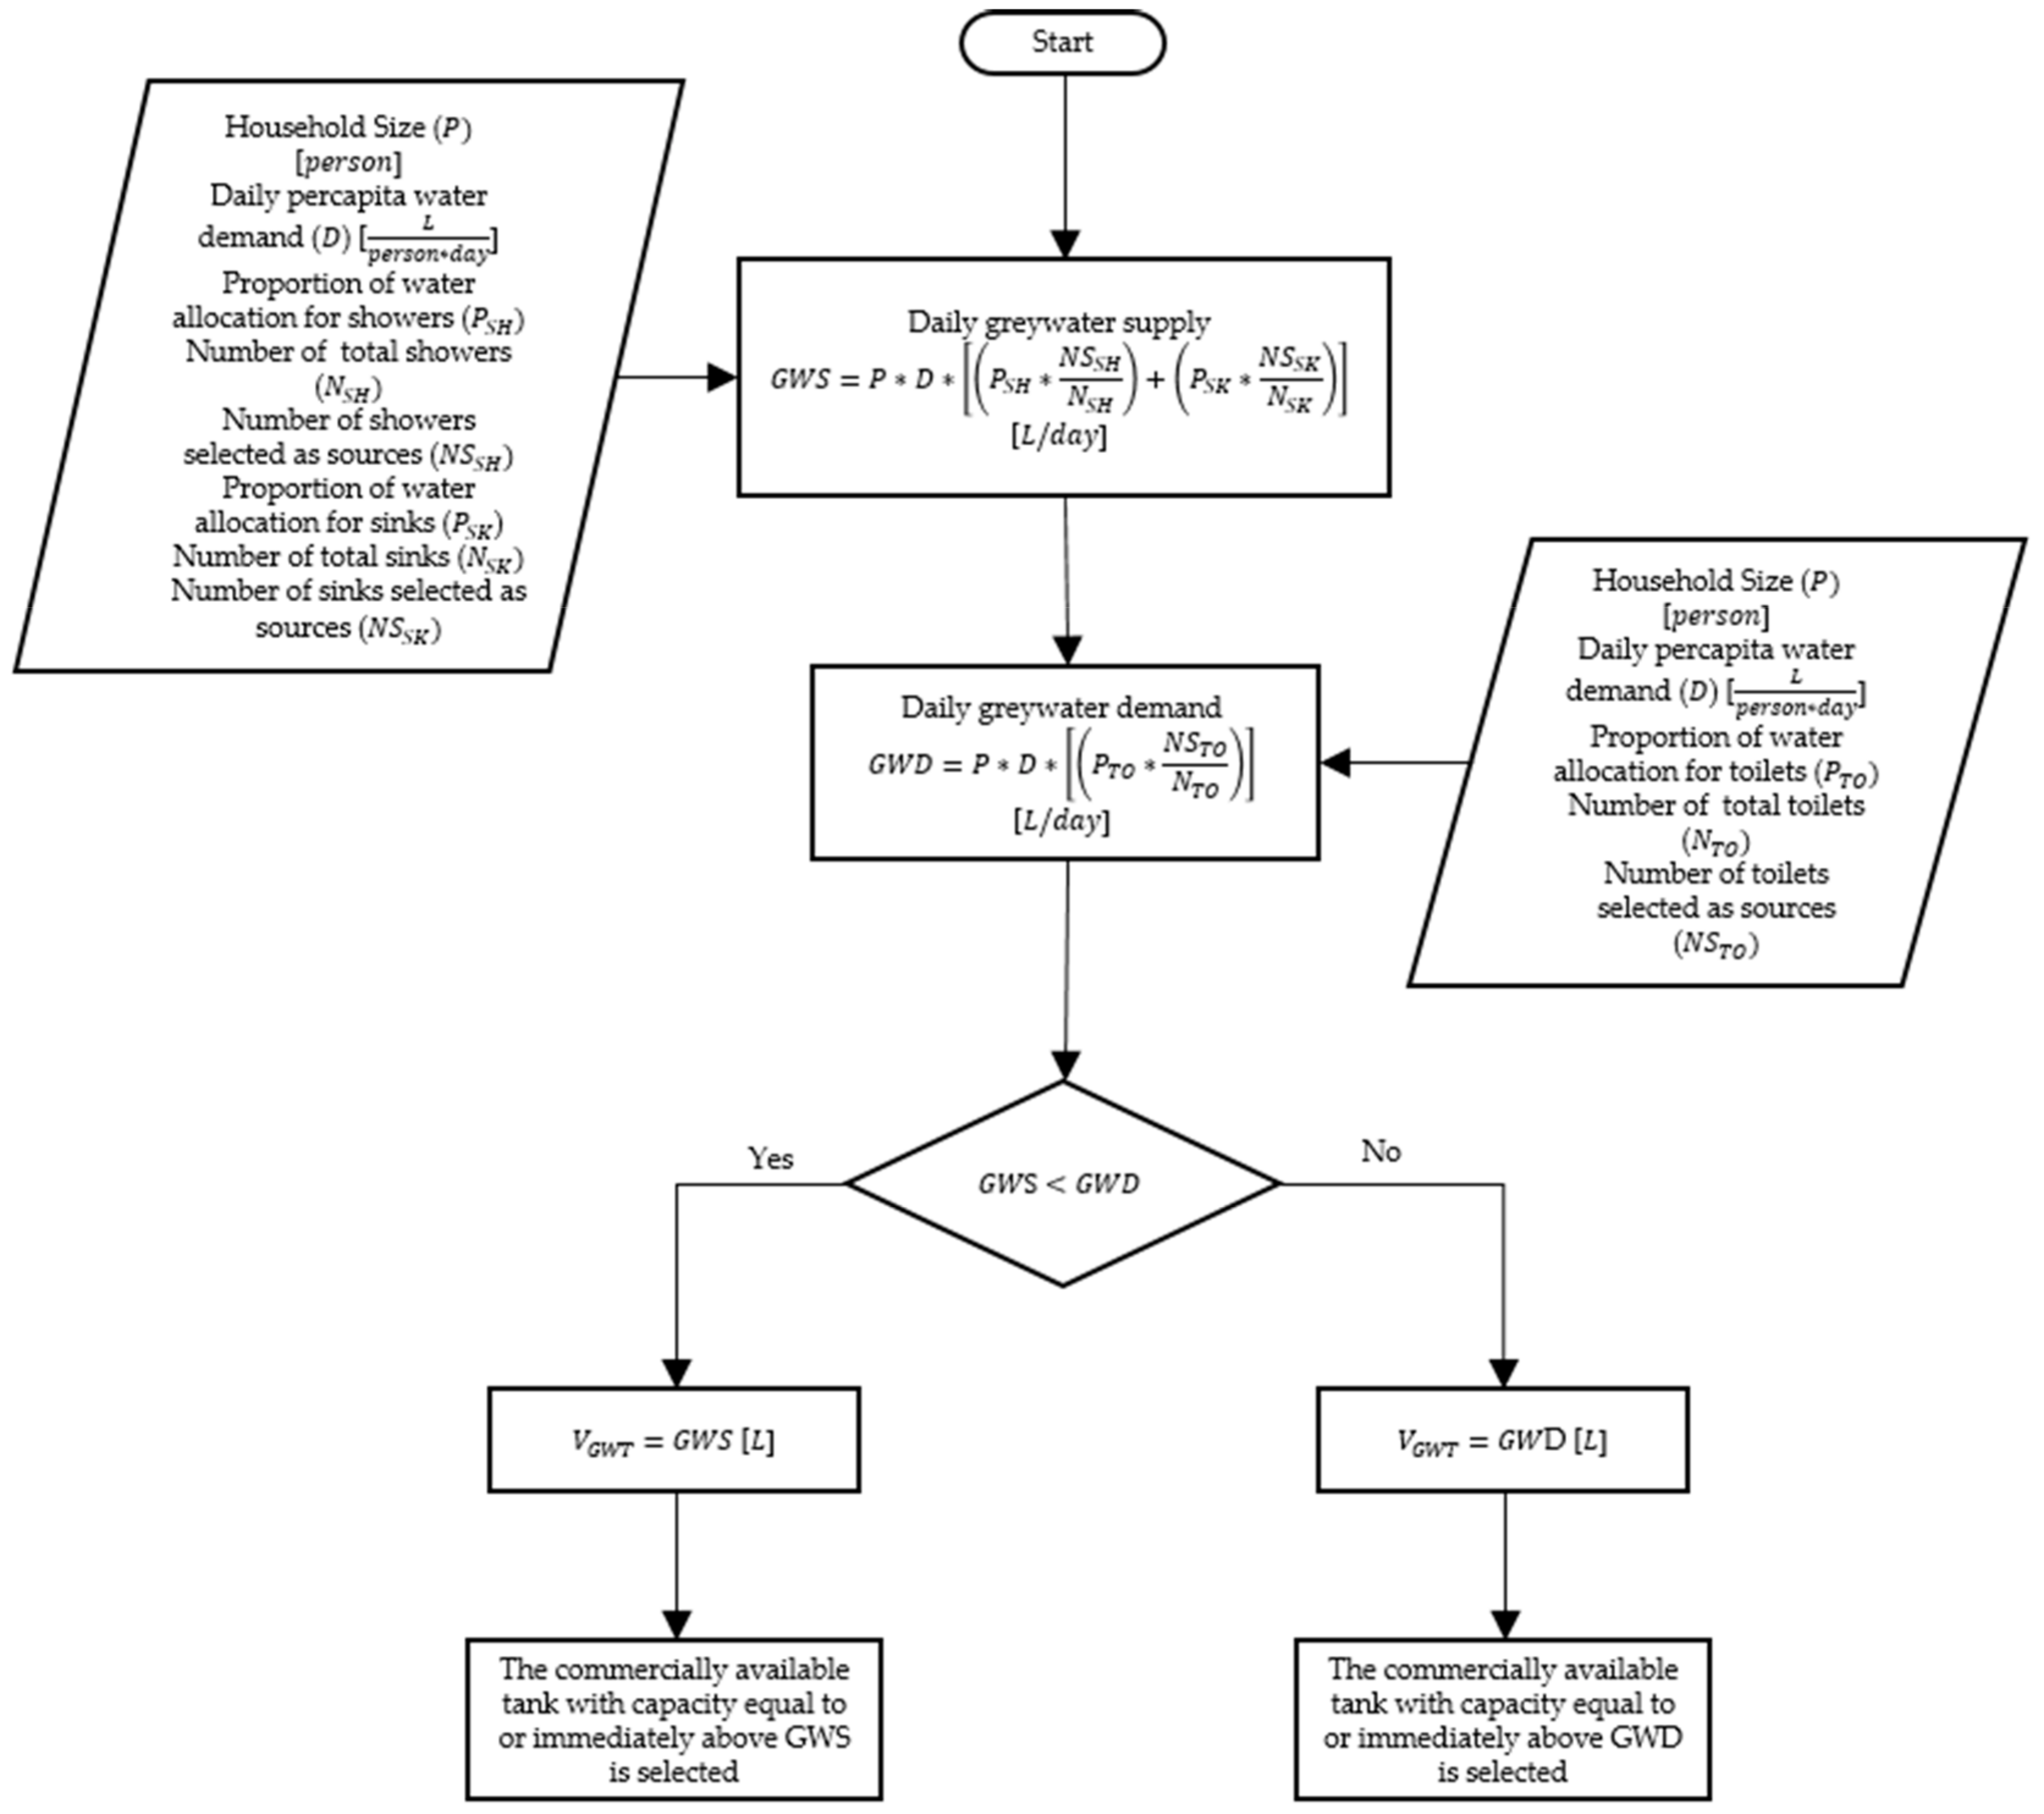
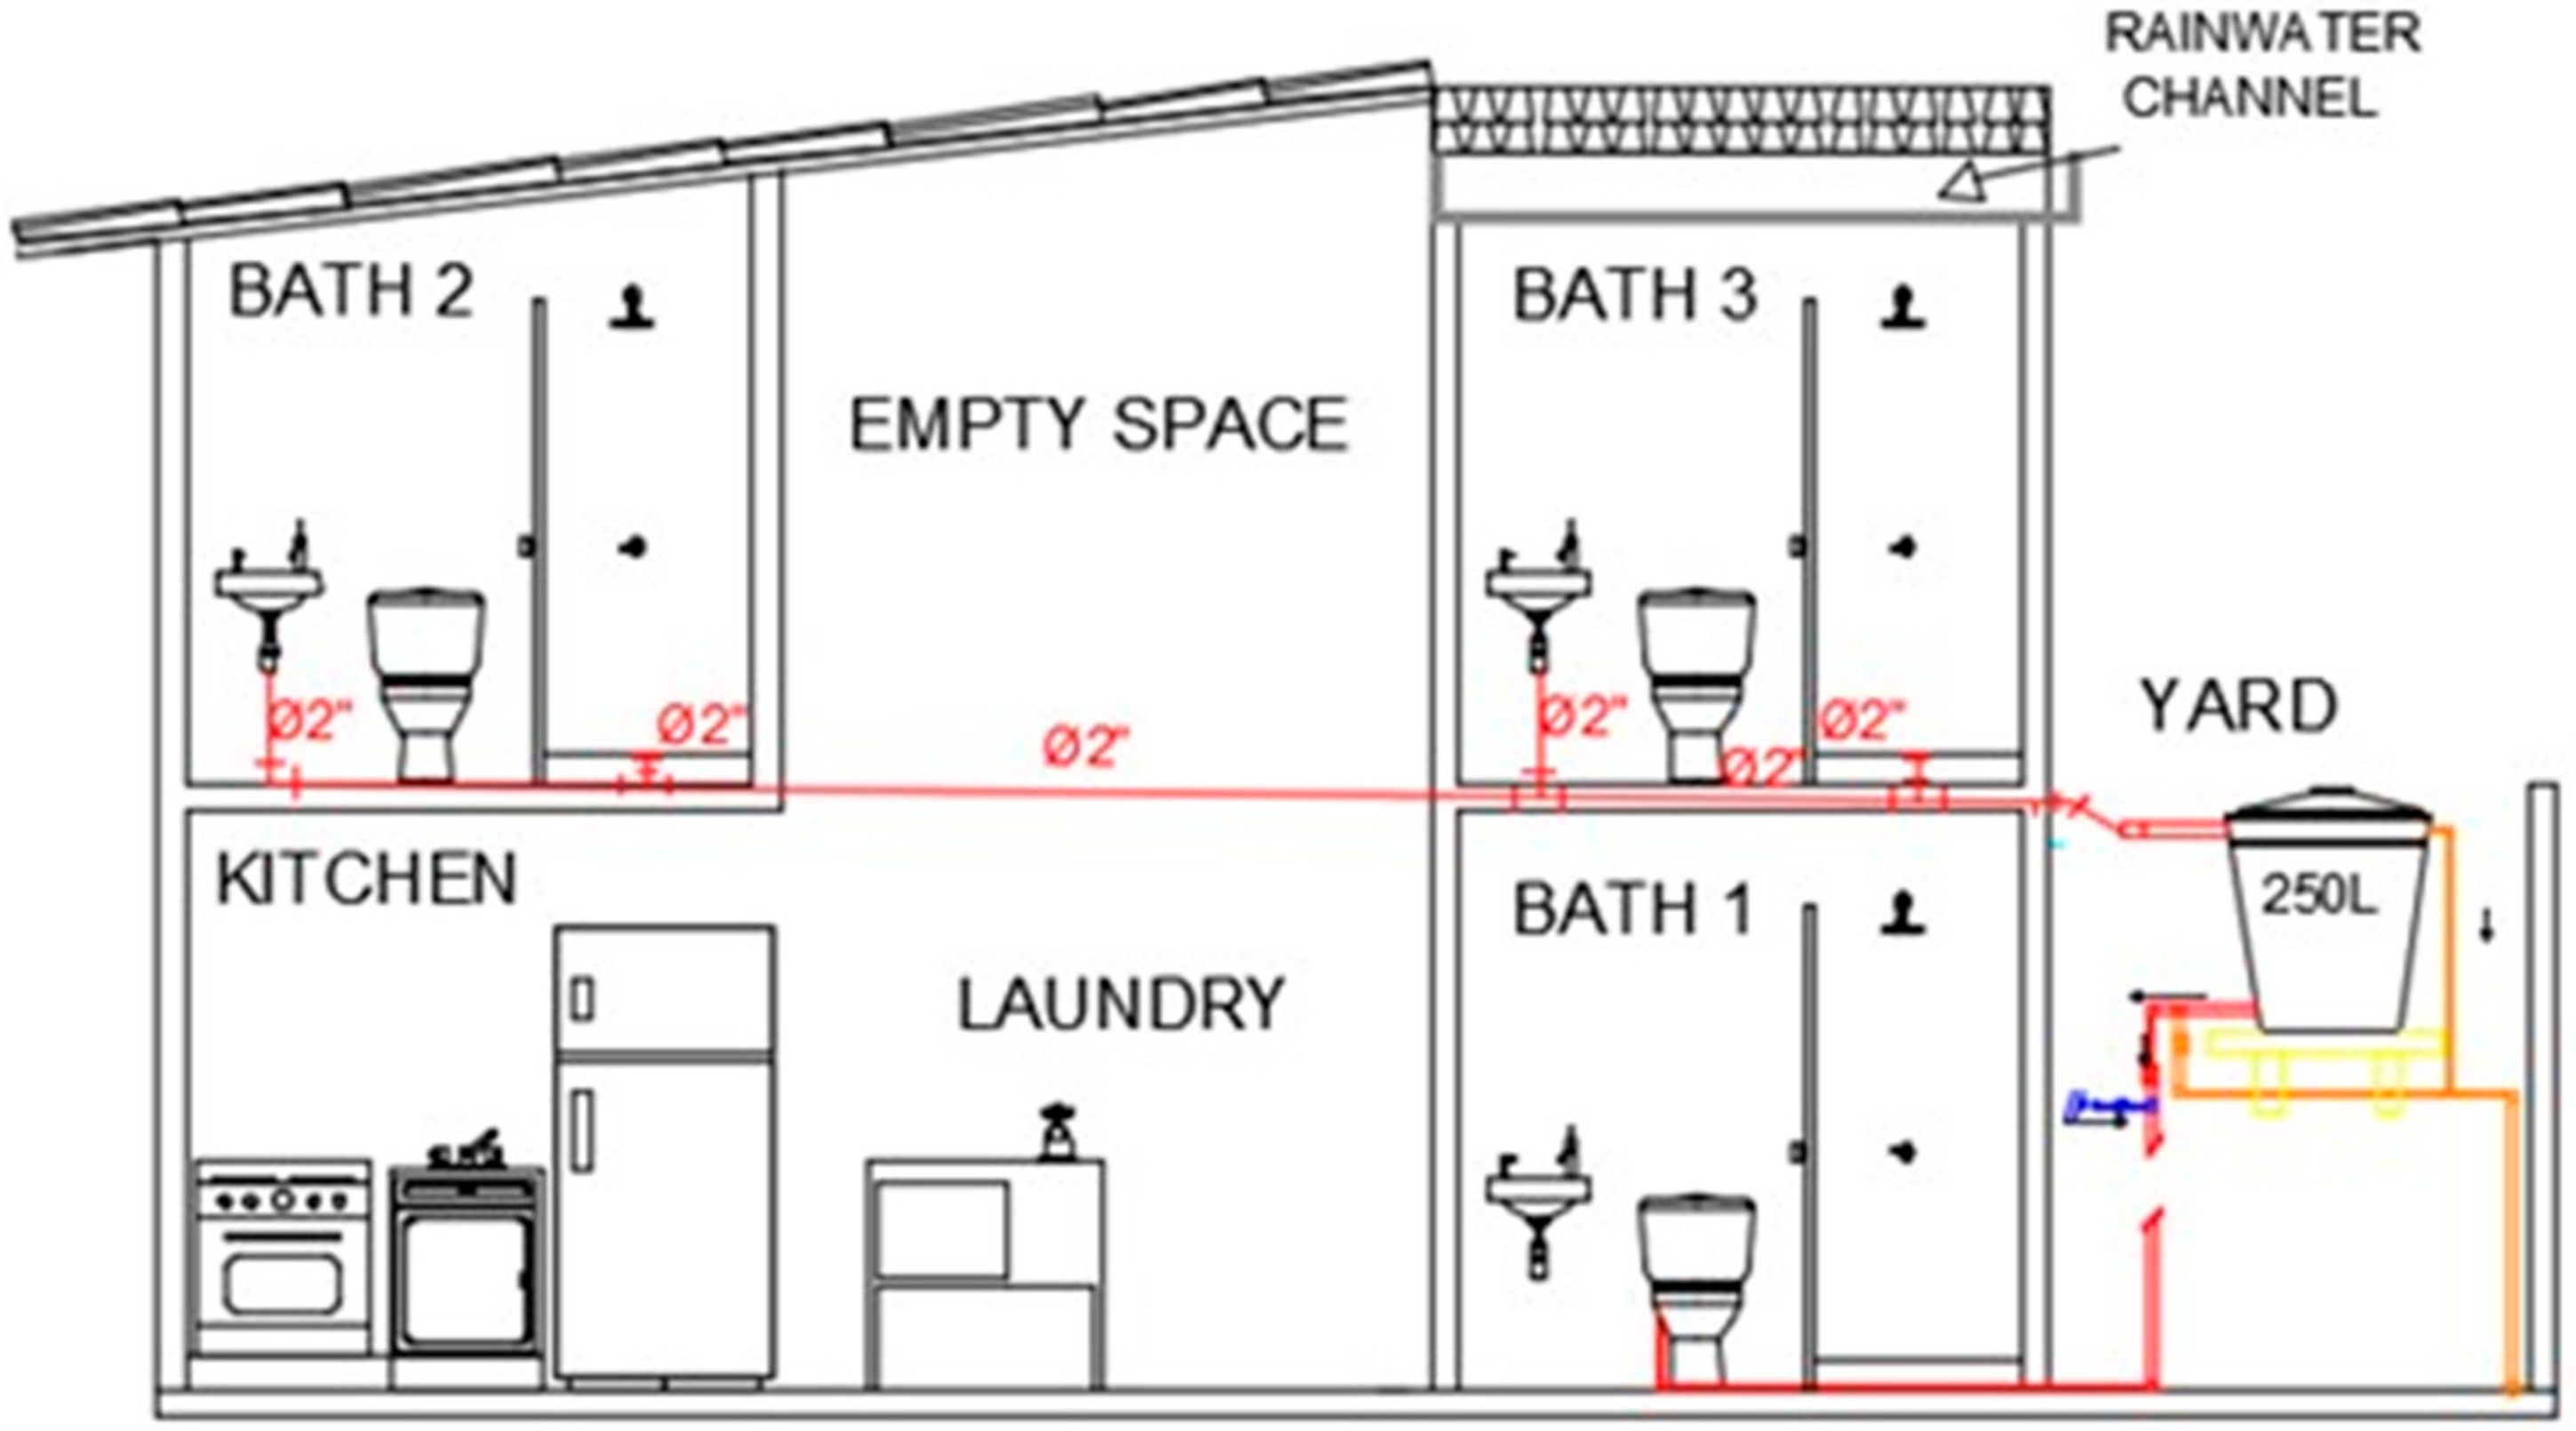
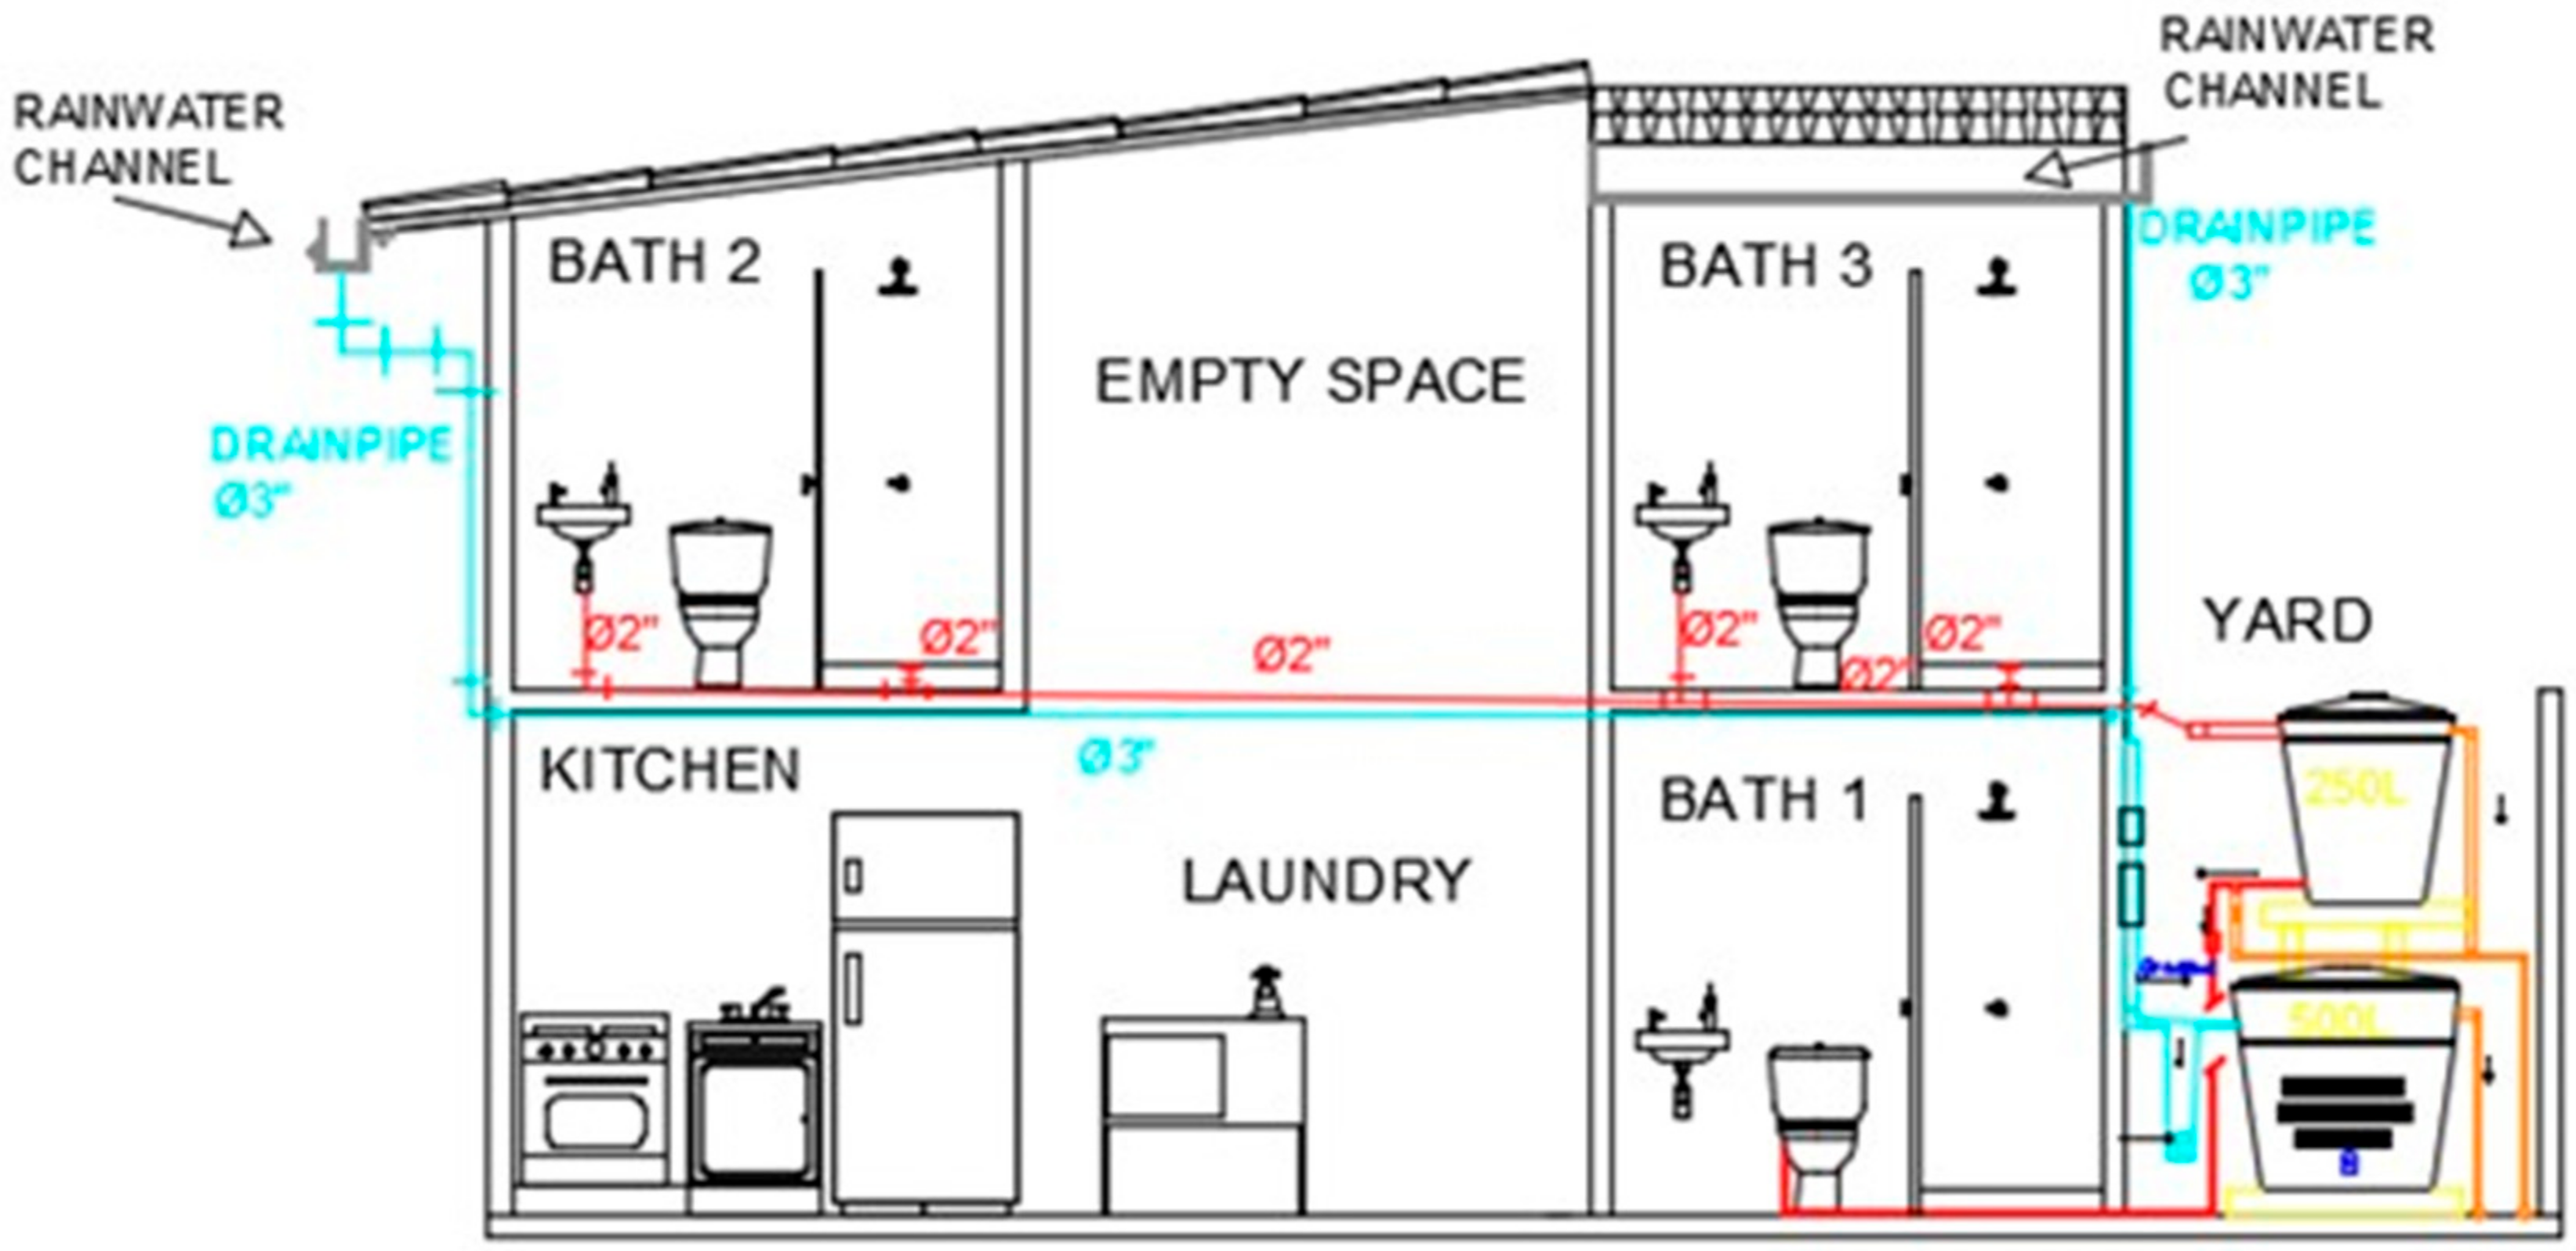
To enable the prioritization preferences of the householders to be examined, the formulation of alternative RWH/GWR system designs with an integrated financial assessment was undertaken, as per the steps presented in the previous section. The results of the first five steps are presented together to aid continuity and the results of the final two steps are then presented.
3.1. Formulation and Integrated Financial Assessment of Alternative RWH/GWR System Designs
For the sample of householders from the study context, the end-user acceptability for GWR and RWH was 78% and 91%, respectively (
Figure 3), which aligns with the findings of Oviedo-Ocaña, Dominguez [
14] (86% and 97%, respectively), in households from a higher socioeconomic stratum (stratum six) in Bucaramanga. This is also in line with other international studies such as for the UK [
32] (64 and 93%, respectively), and in Oman, where the GWR acceptability was 87% [
33]. In relation to RWH, participants indicated that they were willing to use it in: (i) flushing toilets (86%), (ii) house cleaning (75%), (iii) watering plants (61%), and (iv) laundry (45%). Reasons stated for RWH were environmental concern (66%) and saving money (61%). Participants not willing to use RWH justified their decision based on hygiene concerns. With regards to GWR, participants stated that they were willing to reuse it in: flushing toilets (78%), house cleaning (34%), and watering plants (22%). This aligns with other studies where the willingness to use GWR for toilet flushing, the irrigation of gardens, house cleaning, and external applications has been demonstrated [
34]. Reasons stated for accepting GWR included: environmental concern (70%) and saving money (56%), whilst water saving was the main reason for acceptability in water scarce regions such as Spain and Jordan [
8]. The rejection of GWR was 20.6% based on hygiene concerns. In a study from Spain, the perception of health risks from GWR showed a high influence on acceptability. Concerning the willingness to undertake operation and maintenance activities, 86% of participants were willing to perform these activities fortnightly, 69% twice a week, and 33% daily, coinciding with findings from previous studies [
14].
The average water consumption was 130 + 61 litres per capita per day (lpcd) with a coefficient of variation (CV) of 47%. This consumption is similar to that reported in Colombia for stratum one households by Ángel, Rozo [
26] (124 lpcd), and considerably lower than that reported by Oviedo-Ocaña, Dominguez [
14] in stratum six households in the study area (203 lpcd). This value is also within the range of the indoor domestic water demand (excluding garden irrigation and other external uses) reported by Friedler and Hadari [
9] and Londra, Theocharis [
35] in developed countries. The high value of the CV can be associated with the existence of small-scale commercial activities in the surveyed households (e.g., selling food), in line with the reported presence of subsistence activities that depend on water in poor urban areas [
36]. Alternatively, this high variation could also be associated with potential irregularities in the flow measurement, since some households had water consumption levels well below the average (e.g., 25, 33, 39, and 44 lpcd), which seemed unreasonable in relation to the reported household occupancy (average of five occupants).
To assess the water quality, no empirical testing of microbiological or physicochemical parameters was undertaken for households in the study area. However, a literature review identified a range of results for the Colombian context, which are summarised in
Table 1 and
Table 2.
Table 1 shows the harvested rainwater quality reported by different authors in Colombia and international regulations.
Table 2 shows the results from physicochemical characteristics of domestic collected greywater and international regulations. As shown in
Table 1 and
Table 2, both RWH and GWR have concentrations of TSS and BOD5 exceeding limits established by Bastian and Murray [
37] for the urban non-potable reuse of GWR and RWH. The most critical values are for GWR, which can be associated with the inclusion of dishwashing greywaters that may have a high concentration of organic matter, increasing the value of parameters such as BOD5, TSS, turbidity, and Total Coliforms. GW may contain a variety of microbial pathogens that can cause diseases, thus posing a risk to public health [
38]. The risks are associated with accidental ingestion, inhalation, and contact with greywater [
39]. The types and number pathogens vary with the source, storage time, and background levels in the community source [
39]. However, a review on the safe on-site use of greywater suggested that reusing greywater from a single house system is much safer than reusing greywater from a neighbourhood-scale system [
38]. Based on these considerations, the use of GWR from the kitchen was discarded and only greywaters from showers and washbasins were used for toilet flushing. As a consequence and in line with the reviewed literature [
40,
41,
42], GWR treatment was limited to the appropriate selection of source water and filtration. Although membrane filtration is more effective to achieve the required level of certain parameters, these systems have higher energy and maintenance requirements, which limit their implementation in the context under study. Untreated wastewater was tested in Australia, which revealed that up to 28% of participants of a survey were reusing GW without treatment [
43]. Since waste from toilets and water from kitchens were not included in this study as GW, it is expected that faecal contamination should be minimal, possibly from activities such as washing faecally contaminated laundry, childcare, and showering. Several studies have shown that the quality of raw GW deteriorates after 24 to 48 h of storage for parameters such as dissolved oxygen, ammonia, nitrogen, and suspended solids, in addition to the proliferation of indicators such as
E. coli and
Enterocci and pathogens such as
Salmonella [
39]. Thus, recommendations for handling untreated GW include excluding kitchen effluents as they may introduce third party pathogens, washing hands after use, avoid using it when household occupants are sick, and limiting storage for a period from 24 to 48 h [
38]. After 24 h, one should remove unused GW from greywater tanks. In this study, the use of untreated GWR was selected with a reuse cycle of 24 h. For RWH, the focus was on simple systems that could be implemented in low-income households, for example, using first-flush devices that improve microbial quality but have a low impact on system costs (around 5%) [
44]. Silva Vieira, Weeber [
45] indicate that simple devices such as self-cleaning filters contribute to reducing turbidity and TSS levels. These systems are characterized for a lower user participation in operation and maintenance and are low cost (around
$60). Consequently, given the potential contact with harvested rainwater in this case, RWH treatment included the protection of gutters and downpipes with an anti-pest mesh, self-cleaning leaves filter, self-cleaning filter to remove turbidity and SS, and a first-flush diversion device, similar to that proposed by Oviedo-Ocaña, Dominguez [
14].
It was considered that in social housing, the water savings per household may be low compared to households from higher socioeconomic strata and that simple and economic systems not generating impacts (i.e., solid or liquid waste) or requiring electromechanical equipment (i.e., pumping systems) were needed. Based on these assumptions and end-user, water consumption, and water treatment criteria, three alternative GWR and RWH systems were designed:
- (i)
Alt 1—GWR: collecting GWR water from showers and sinks from the second floor, conveyance to an elevated storage tank, and distribution to the toilet cistern on the first floor, where all GWR would be used;
- (ii)
Alt 2—RWH: collecting RW from the rooftop, draining to gutters and downpipes, and conveyance to a storage tank located on a concrete base 20 cm above the patio level. A tap near the base of the storage tank enabling end-uses to be fulfilled: watering plants, household cleaning, and in some cases, laundry. In this alternative, the end-user needs to carry the harvested rainwater from the storage tank to the point of use using containers to reduce costs from pumping and retrofitting pipework;
- (iii)
Alt 3—GWR and RWH: combination of Alt 1 and 2.
Collection and conveyance networks were kept simple and for GWR, a ¾′′ diameter was selected taking into account the physicochemical characteristics of greywater. For the RWH network, a diameter of 3′′ was obtained for all the elements: gutters, downpipes, and horizontal pipes. For GWR storage, it was estimated that the demand (126.1 L) was greater than the supply (108.3 L) and therefore storage was minimal, but due to commercial availability, a 250 L tank was selected and located at 1.7 m from the floor to ensure the required head pressure and comply with Colombian Plumbing Code NTC1500 [
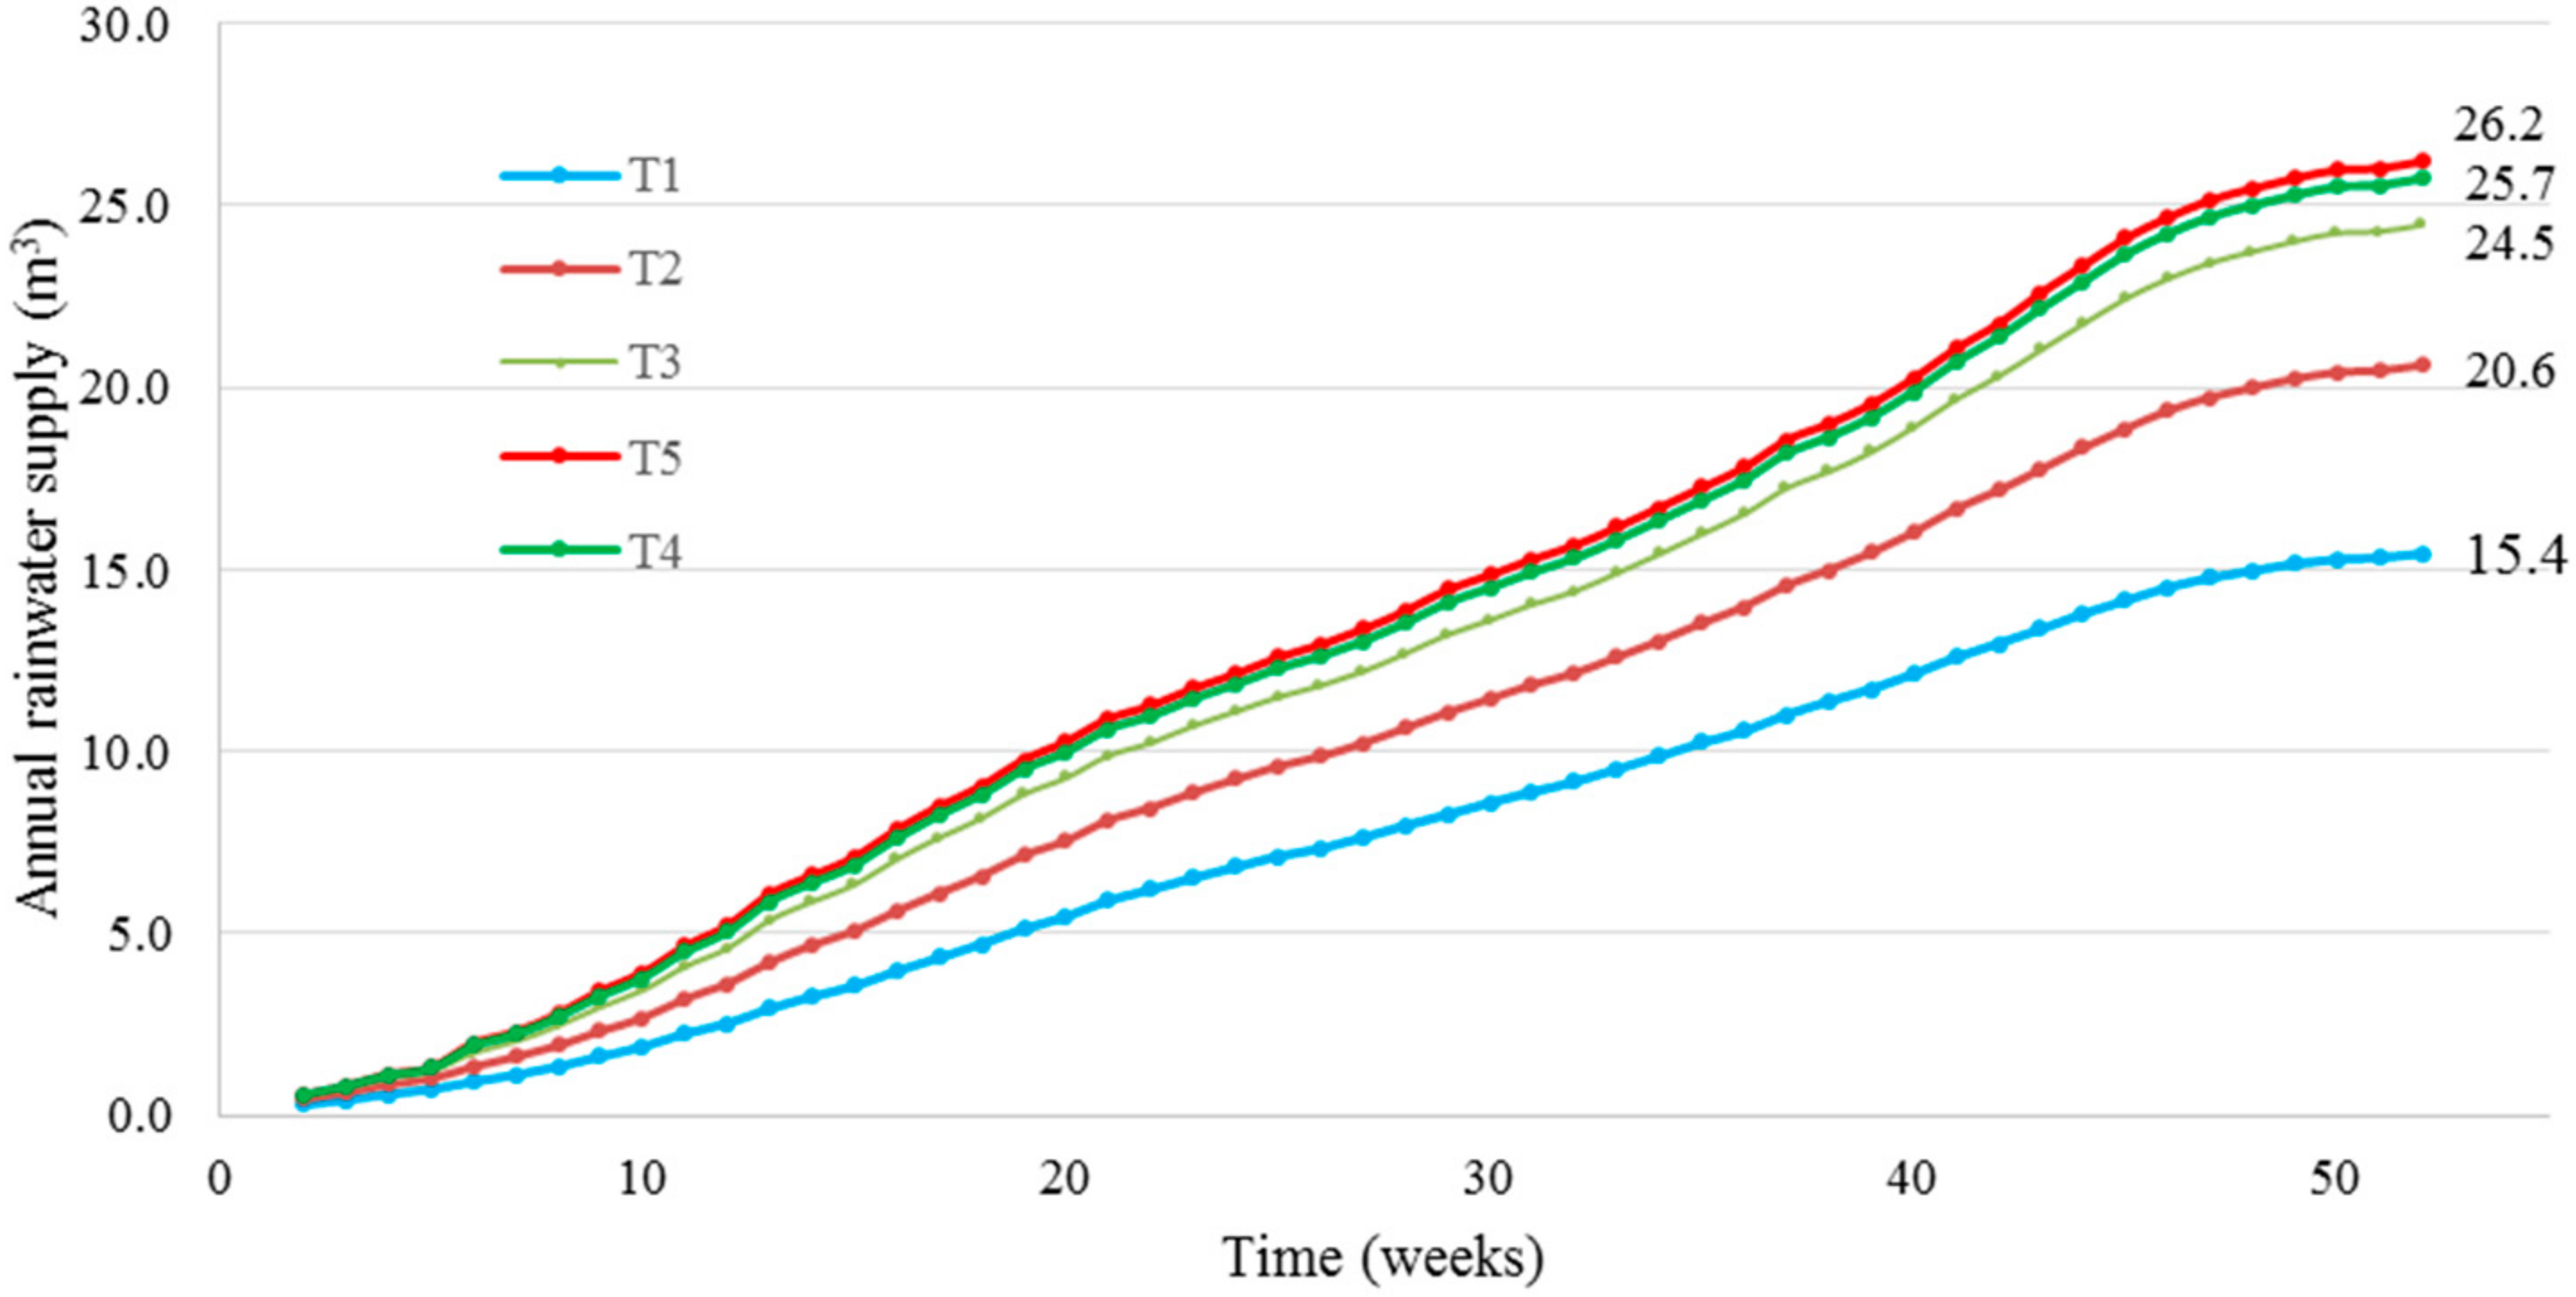
53]. For RWH storage tank sizing analysis, shown in
Figure 7, as the tank size increased, the difference between the cumulative supply from tanks of consecutive sizes was smaller. Therefore, the increase in the supply of a larger tank is not offset by the higher investment cost. For example, by the end of the year, T5 and T4 offer a greater rainwater supply (26.2 and 25.7 m
3) compared to that from T3 (24.5 m
3). However, the difference in the annual accumulated supply between the tanks is low (T5 − T3 = 1.7 m
3 and T4 − T3 = 1.2 m
3) compared to their investment costs (T5 − T3 = US
$ 78.3, and T4 − T3 = US
$ 56.9). T1 was discarded due to the low rainwater supply it would provide (15.4 m
3). Therefore, T2 and T3 were selected for further analysis, since they provided a potential annual rainwater supply of 20.6 and 24.5 m
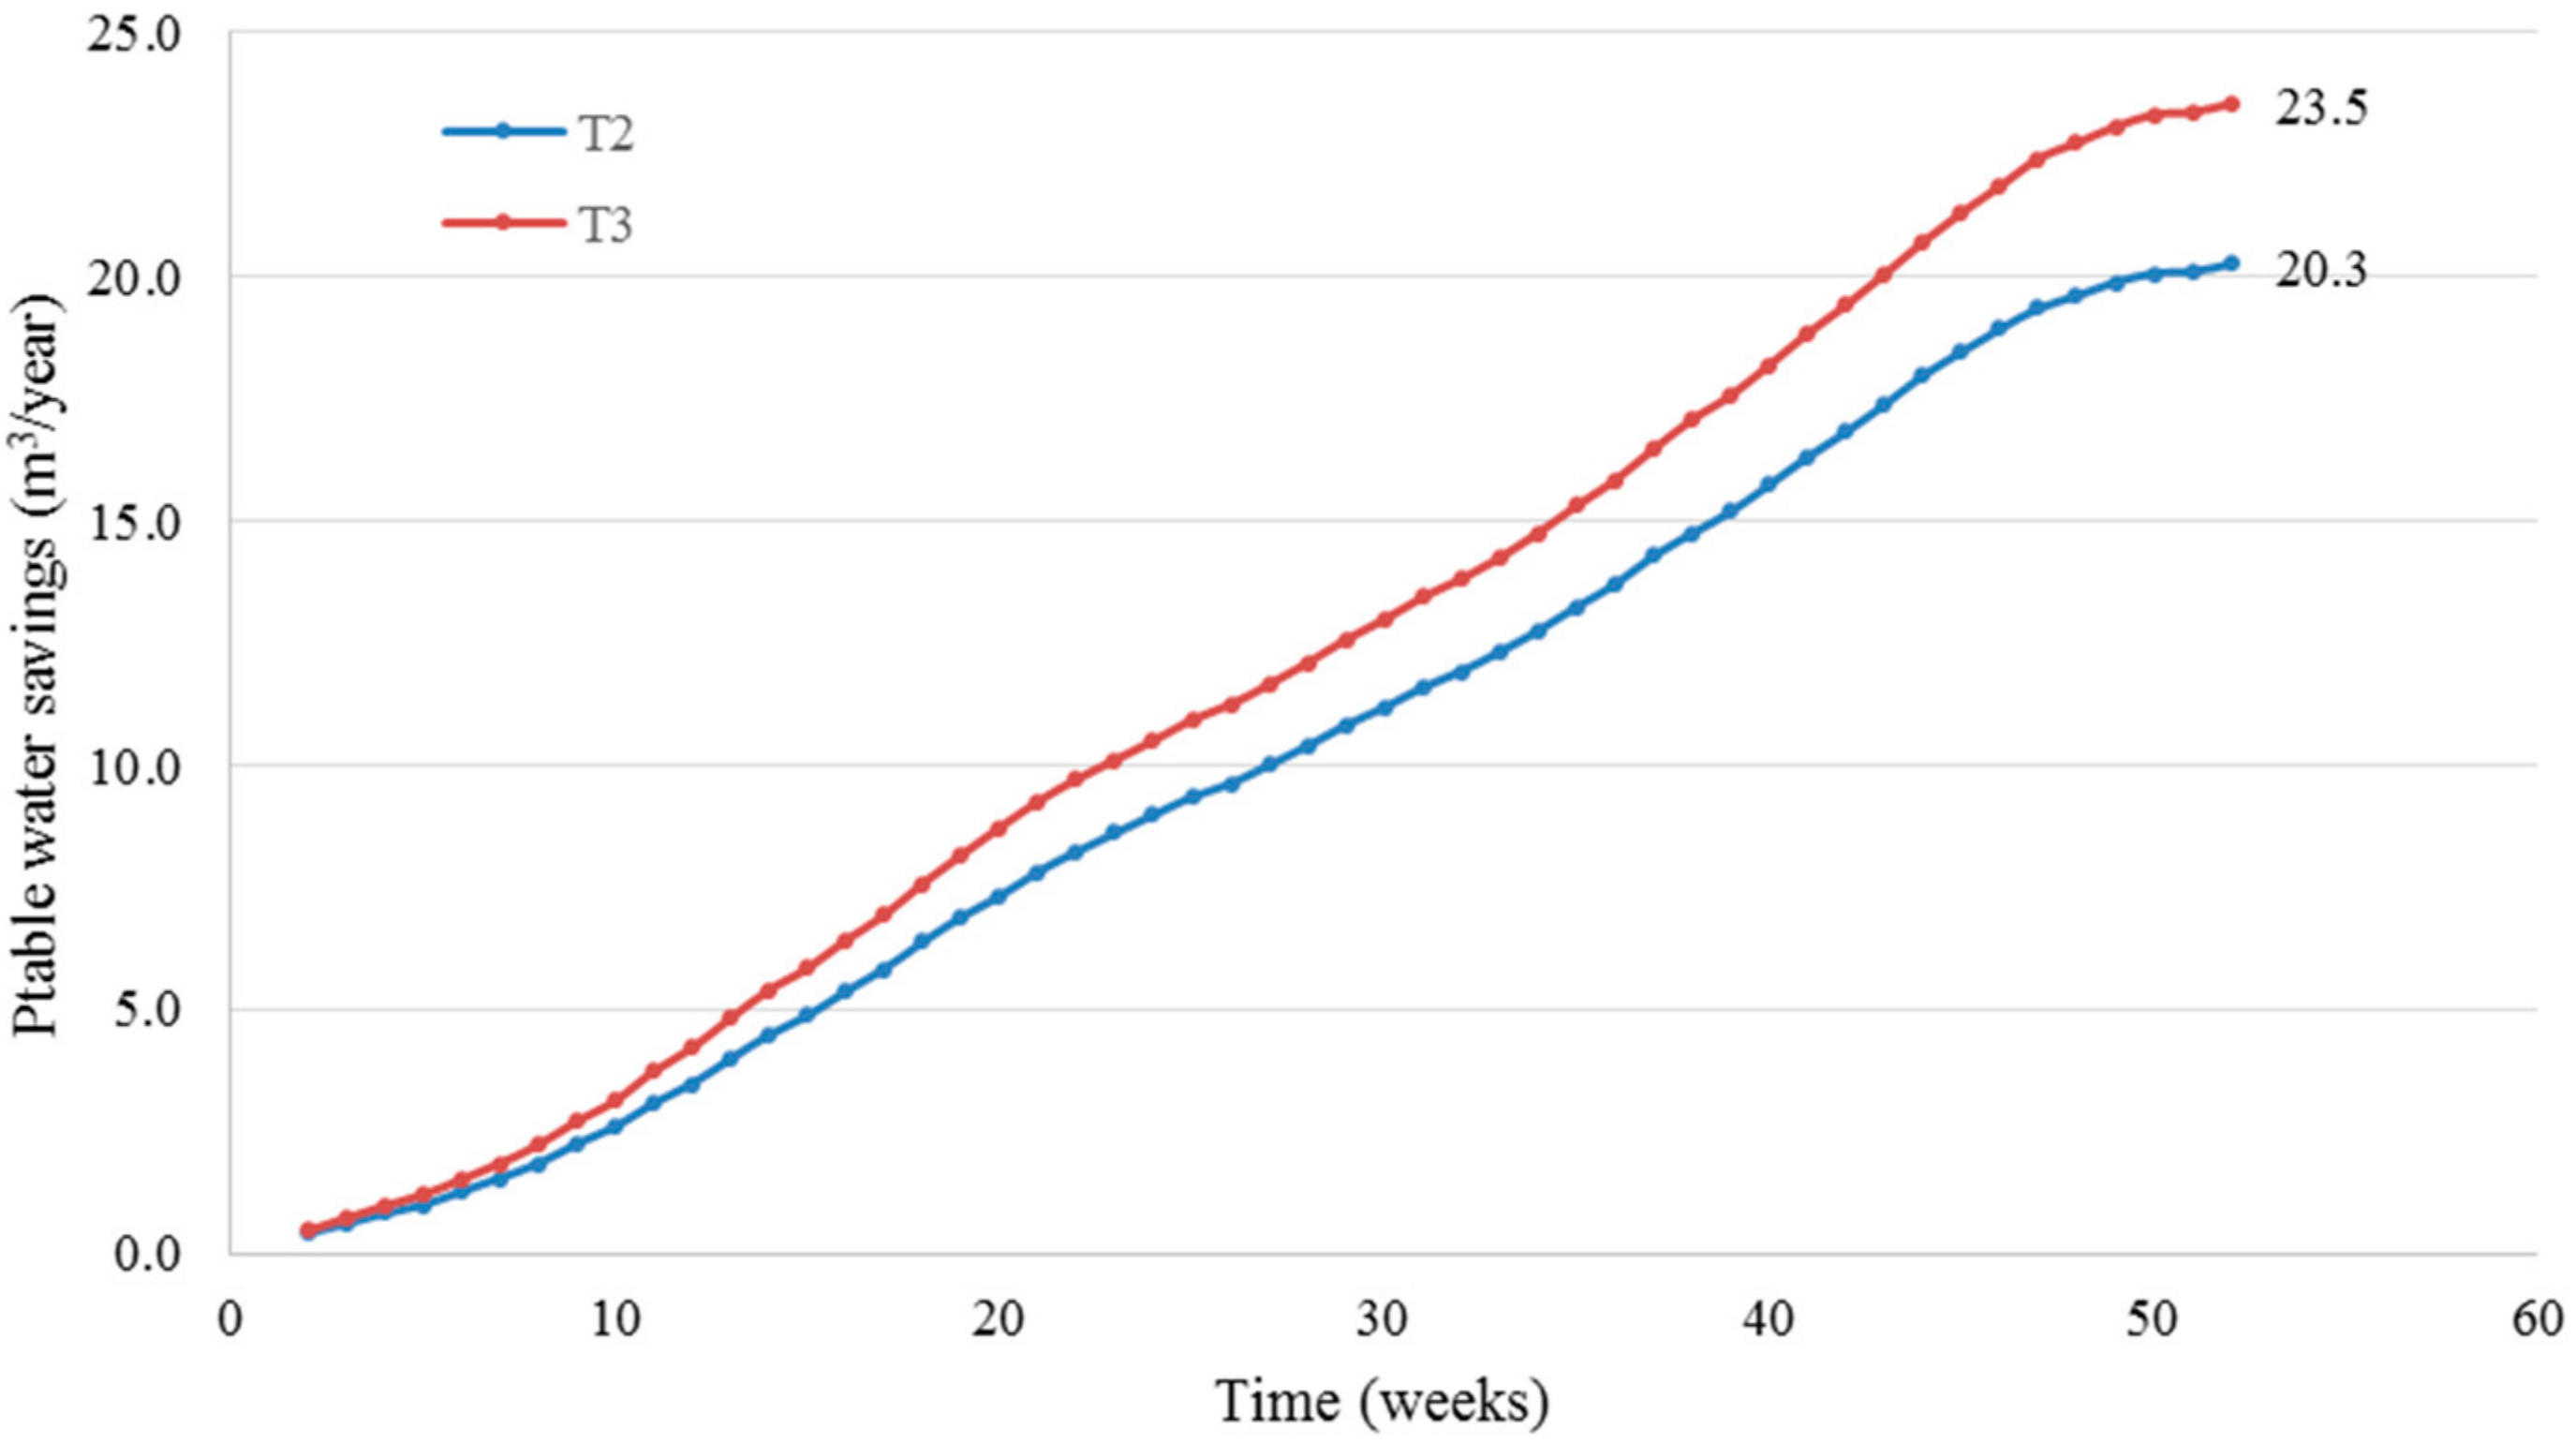
3, respectively. Annual potable water savings were estimated for T2 and T3 and
Figure 8 shows that the potable water savings are 20.3 m
3 (T2) and 23.5 m
3 (T3). The difference in potable water savings between these tanks is 3.2 m
3/year, equivalent to monetary savings of US
$ 2.4/year. Based on these results, a storage tank of 500 L was selected, since the 1000 L tank represented a difference in investment costs of US
$ 33.5 (compared to the difference in savings of US
$ 2.4/year), but the additional quantity of RWH that could be collected was not substantial and demanded a larger space in the household. In general, the space occupied for both the RWH and GWR systems is less than 2 m
2.
Regarding costs, the initial investment costs are summarised in
Table 3 for the three proposed alternatives. Alt 3 has the higher initial investment cost (US
$ 1041), compared to Alt 1 (US
$ 524) and Alt 2 (US
$ 533). For maintenance, costs relate to the cleaning of tanks and gutters. As shown in
Table 4, Alt 3 has the higher maintenance costs.
In terms of volumetric savings, the total volume of potable water that could be saved annually with the implementation of Alt 2 is 20.31 m
3 (i.e., 8.5% of the of the household annual water consumption). The potable water saving due to Alt 1 is 39.5 m
3/year (16.6% of the of the household annual water consumption). Therefore, the total saving of potable water in a year for Alt 3 is 59.8 m
3 (25.2% of the of the household annual water consumption). This equates to a monetary saving due to water supply and sewerage services in the first year of operation, as summarised in
Table 5. In 2016, the water bill for stratum one was 0.31 US
$/m
3 [
54], and the sewage bill was 0.22 US
$/m
3 [
55].
3.2. Benefit-Cost Ratio and Prioritization Consultation
Based on the costs and benefits summarized in the previous section, the IRR, NPV, PP, and B/C ratio were calculated.
Table 6 shows the results from a cash flow for 50 years for the three proposed alternatives. From these results, it is observed that Alt 1 and Alt 3 have an IRR higher than the discount rate, an NPV higher than zero, and a B/C ratio higher than one. Therefore, considering all these indicators, Alt 1 and Alt 3 are financially feasible. With regards to Alt 2, although it does not appear to be financially feasible, a more comprehensive economic assessment that quantifies the externalities resulting from the implementation of this system could change this result.
Results from research in this area have obtained similar results to those reported here (refer to
Table 7). Oviedo-Ocaña, Dominguez [
14], Ghisi and Mengotti de Oliveira [
56], and Domnech and Saurí [
8] obtained similar PPs of 22, 29, and 37 years, respectively. These results are comparable to the findings from Alt 1 and Alt 3 (23.3 and 29.8 years, respectively). With regards to IRR, Oviedo-Ocaña, Dominguez [
14] reported a value of 6.80% compared to 6.67% and 4.69% for Alt 1 and Alt 3 in this case study. For systems in buildings [
57] and offices [
58], given the economies of scale, the PP value was 11 years, which is significantly lower than the results for individual households obtained here.
In the present study, to calculate NPV and the B/C ratio, a discount rate of 3.51% was adopted, as recommended for environmental projects in Colombia [
31]. Even though a discount rate for NPV typically used by other authors to analyze the financial performance of RWH systems in other countries is 5% [
56,
61,
62], the lower value adopted in this study can be justified by the present analysis only including the direct costs and benefits for the homeowner—it lacks a broader study of the costs and benefits that the implementation of alternative water source systems represents for the society as a whole. Therefore, the results of this study should be complemented by evaluating the externalities of this type of project in the social and environmental dimensions. This type of analysis should include not only the individual consumer, but also the entire society from the city or region, which under the current circumstances, does not assume any cost but enjoys a wide range of benefits with the implementation of alternative water sources systems [
9]. Future studies should include aspects such as those suggested by Liang and van Dijk [
63], for example: (i) social awareness towards water availability and protection; (ii) noise pollution; (iii) avoided water pollution; (iv) avoided aquifer overexploitation; (v) chemical and biological risks associated with wastewater reuse; and (vi) avoided treatment water costs. Incorporating these relevant externalities could have a significant impact on the results of economic feasibility. Similarly, environmental criteria are increasingly been considered more rigorously in these analyses, by complementing the financial evaluation with life cycle analysis (LCA), environmental impact assessment (EIA) [
61], or energy indicators [
64].
The final step in the assessment was to engage potential end-users with the financial and B/C ratio results in order to examine their prioritization preferences.
Table 8 synthesizes the summary presented to potential the end-users during a follow-up consultation.
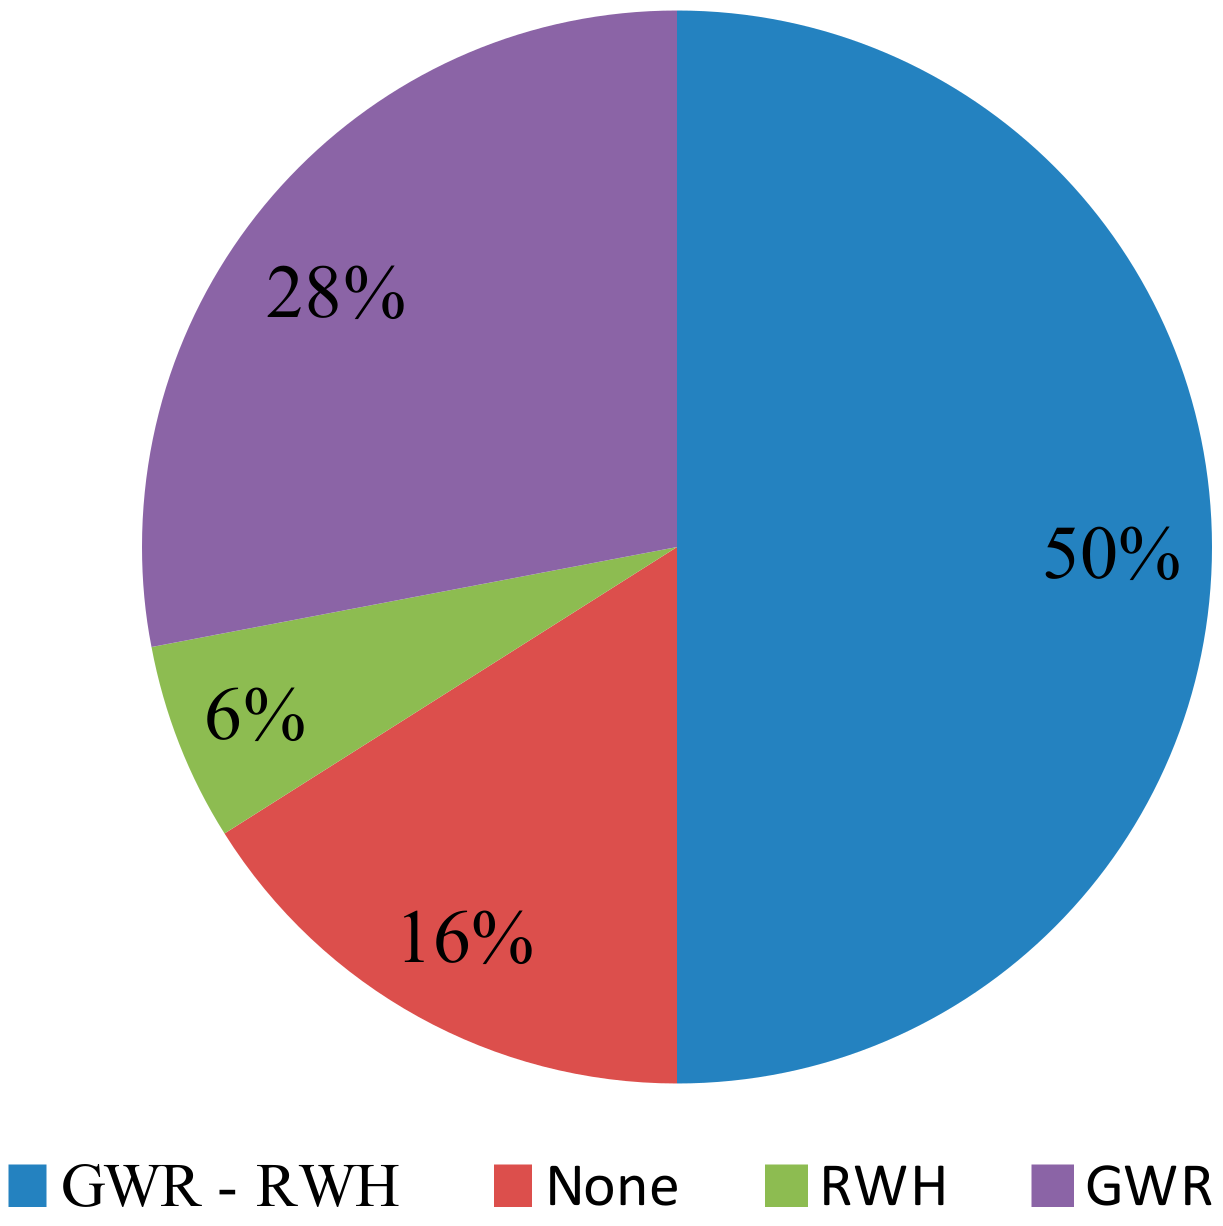
Results from the follow-up consultation indicated that 100% of participants were interested in saving potable water and as shown in
Figure 9, 84% were willing to invest in the implementation of one of the three proposed alternatives.
Although Alt 3 had the higher initial investment costs, it had the greatest acceptability among participants (50%), who prioritised saving a larger water quantity over minimising costs. A total of 28% of participants prioritised using the GWR system, considering it had the better potable water savings and costs ratio. Only 6% prioritized the RWH system due to the rejection of using GWR. End-users who indicated they would not implement any of the three alternatives (16%) argued that there was a lack of resources for investment, despite their interest in saving water and money. That most potential end-users selected the most expensive alternative, which generated the greatest water savings, is a counterintuitive result for a low-income community, but is in line with results suggesting that the main reason for public support for the use of alternative sources in some contexts is the awareness towards water conservation [
8,
9]. The reasons for the selection of the other alternatives expressed by the participants, such as public health risk and investment costs, have also been widely identified in the literature on the subject [
34].
