Abstract
A membrane bioreactor (MBR)-based wastewater treatment plant in Saudi Arabia was assessed over a nine-month period for virus removal efficiency. Viral diversity was detected using omics-based approaches. Log reduction values (LRV) of Adenoviruses (AdV) and Enteroviruses (EV) were enumerated using digital polymerase chain reaction (dPCR) and assessed for infectivity using fluorescence-based infection assays. MBR treatment was successful in reducing viral diversity. Plant viruses remained abundant in the treated effluent. Human enteric viruses were present in lower abundance than plant viruses, and were reduced by MBR at varying LRV. AdV copy numbers were reduced by 3.7-log. Infectious AdV was not detected in the effluent. EV copy numbers were reduced by 1.7-log post MBR and infectious EV decreased by an average of 2.0-log. Infectious EV was detected in the chlorinated effluent, occasionally in concentrations that approximate to its 50% infectious dose. Overall, results indicated that a MBR-based wastewater treatment plant (WWTP) effectively reduces viral diversity, viral load, and infectious capacity by up to 4-logs. These findings suggest potential concerns associated with plant and human enteric viruses for reuse events in this country. Local guidelines for assessment of treated water quality should take into consideration both infectious viral concentration and LRV.
1. Introduction
Water scarcity in arid countries like Saudi Arabia necessitates a search for innovative sources of water for agricultural irrigation. Wastewater, adequately treated to remove organic nutrients and pathogens, offers an alternative water resource. In developing countries, wastewater treatment plants utilize biological activated sludge for nutrient removal and physical processes to separate biomass from treated wastewater. Secondary biological treatment processes achieve satisfactory treatment with regards to fecal coliforms in wastewater, and generally are able to meet a local discharge requirement that includes a permissible level of fecal coliforms in wastewater <1000 CFU/100 mL for restricted irrigation or <2.2 CFU/100 mL for unrestricted irrigation [1,2].
However, secondary treatment processes do not necessarily address other classes of pathogens that are more difficult to remove. For example, secondary biological treatment processes typically achieve less than 2-log reduction of viruses [3], indicating that farms where treated water is used for irrigation are at risk of contamination with enteric viruses. Adenoviruses (AdV) and Enteroviruses (EV) are among the more common enteric viruses in human waste and are found at high prevalence in wastewater. Despite the potential problems related to human enteric viruses in treated wastewater, Saudi Arabia currently does not require a wastewater treatment plant (WWTP) to monitor virus concentrations in the final effluent, even if the effluent is intended for use in irrigation [2]. This is similar to the requirement by the Environmental Protection Agency in the United States which also does not require a waste water treatment plant (WWTP) to monitor virus concentrations in the final effluent, although certain states in US have strict guidelines on the log reduction value (LRV) required for viruses in effluent prior to reuse. For example, California requires >5-log reduction in viruses from postsecondary treatment for unrestricted use of recycled water in irrigation [4] and >12-log reduction for indirect potable reuse via groundwater recharge [5]. The strict guidance imposed in California was, however, not feasible for a developing country like Saudi Arabia due to economic and technological constraints.
Regardless, exploratory studies that aim to determine the WWTP efficiency in virus removal are important, especially in light of the potential health impact of enteric viruses transmitted through the fecal-oral route [6]. AdV type 40 and 41 have been identified as etiological agents of gastroenteritis and are commonly detected in wastewater [7,8]. These viruses are members of the Mastadenovirus genus of the Adenoviridae family, containing a double-stranded DNA genome [6]. Similarly, EV belongs to the single-stranded RNA Picornaviridae family, which includes poliovirus, coxsackievirus A and B, echovirus, and the numbered enteroviruses. Notably, EV71 was spotlighted recently for causing global outbreaks of hand, foot, and mouth disease in children [9]. Hence, ensuring that the local WWTP suffices as a barrier for virus removal remains crucial.
In recent years, membrane separation processes have been gradually retrofitted into WWTP that utilize a secondary biological treatment process to achieve improved effluent quality in Saudi Arabia and in many other countries worldwide. Earlier studies monitored the efficiency of membrane bioreactors (MBRs) in removing viral loads from wastewater and were done mainly in developed countries, relying on molecular methods, i.e., qPCR or RT-qPCR to detect dsDNA and ssRNA viruses [10,11]. Results of these monitoring efforts showed that MBR typically achieve LRV of approximately 5-log, sufficient to meet guidelines for use in irrigation. However, genome integrity (monitored by qPCR) decreased more slowly than viral viability (infectivity assay) since qPCR may include detection of very small gene fragments [12]. In any case, health hazard assessment is limited since current RT-qPCR assays do not inform on viability. Although there are several studies that assessed infectious viral loads using culture-based methods, they were limited to monitoring postsecondary treated water [13]. However, such studies have not been conducted in a developing country like Saudi Arabia.
To address this knowledge gap, a comprehensive assessment of treated wastewater and activated sludge, including both molecular gene fragment analysis and infectious viral load, would be required to assure safety and feasibility of reusing treated post-MBR effluent in Saudi Arabia. This would provide significant support to change the perception of those in the local community who regard treated wastewater as an untouchable commodity [14]. The objective of this study was to determine the effectiveness of a wastewater treatment plant (WWTP) in Saudi Arabia, specifically a WWTP that operates a submerged MBR followed by chlorination, to reduce viral diversity, viral load, and infectious capacity in wastewater. It is further hypothesized that different viral species may have different LRV, and that infectious viral particles may still be present in the final treated effluent. To achieve these aims and confirm hypotheses, wastewater was sampled from a local MBR-based WWTP at various points in the treatment process over a nine-month period. Viral diversity was determined by omics-based sequencing, and viral load reduction was estimated by quantifying copy numbers of AdV and EV by digital PCR. Fluorescence-based infectious assays were used to enumerate infectious particles throughout the WWTP process.
2. Materials and Methods
2.1. Wastewater Sampling
Wastewater was sampled at selective points from a WWTP over a nine-month period, at King Abdullah University of Science and Technology (KAUST), Thuwal, Saudi Arabia. Incoming wastewater was initially channeled through screens to remove bulky, insoluble solids. Remaining colloidal matter was allowed to settle in a primary clarifier preceding sludge treatment. The WWTP sludge tanks have a combined capacity of 1600 m3. Hydraulic retention time (HRT) and sludge retention time (SRT) in the activated sludge tank were 2.5 h and 40 d, respectively. Excess sludge was dewatered and the supernatant fed back into the influent for treatment, with dewatered sludge disposed as solid waste at an off-site landfill. A second oxic sludge tank is equipped with a 0.4 µm pore sized-submerged microfiltration membrane to form the membrane bioreactor (MBR) (Figure 1). Membranes are operated at a flux of approximately 15.5 L/(m2·h) and a trans-membrane pressure below 20 kPa. The membranes, in service for six years, are cleaned monthly using 5% ClO− solution. The MBR has a retention time of 4 h and produces 4000 m3 of effluent daily. Effluent is stored in an 8500 m3 holding tank and mixed with 400 m3/d of blow-down from a nearby seawater cooling tower. Mixed effluent is disinfected with a free chlorine residual of 0.5 mg/L and contact time of 2.5 h, three times per day (i.e., Contact Time (CT) value of approximately 75 mg-min/L). There is currently no regulation in Saudi Arabia related to the minimum required chlorine dose for disinfection. However, this WWTP chose to voluntarily abide to the recommended minimum value (i.e., >30 mg-min/L) by US-EPA for disinfection of waters for reuse purposes [15]. The CT value used in this local plant was also above the effective CT value shown in earlier studies required to achieve a minimum of 2.5-log reduction of AdV and EV [16]. The chlorinated effluent is pumped out of the WWTP at a flow rate of 200 m3/h and stored in an evaporation pond and subsequently used for golf course irrigation for a small community (i.e., restricted water reuse). A portion of the chlorinated effluent is blended with 97.7% v/v brine and intermittently discharged through a 2.8 under-sea pipeline into the Red Sea. The oxic activated sludge, influent, effluent, and chlorinated effluent (Figure 1) wastewaters were sampled in July 2015, August 2015, September 2015, 1 October 2015, 22 October 2015, November 2015, December 2015, January 2016, and March 2016. Temperatures in July, August, and September, as well as on 1 October were >38 °C and referred to as “hot months”. The rest are referred to as “cold” months (Table S1). During each sampling, 20 L of influent and 60 L of both effluents were collected. Wastewater were collected in clean containers which were rinsed in the wastewater sample prior to sampling. Chlorinated effluent was sampled first, followed by effluent then influent. Activated sludge was collected in 1 L containers that had been rinsed twice prior to sampling. Sodium thiosulfate was not added to the chlorinated effluent to ensure that subsequent infectivity analysis mimics the actual condition of the reused water, considering that the local WWTP reuses treated wastewater that is not neutralized for the chlorine content. The wastewater samples were concentrated by tangential flow filtration (TFF) within a week of collection. Samples awaiting concentration were stored at 4 °C. Sludge samples were analyzed without any further concentration. Wastewater samples were measured for nutrient content and chemical oxygen demand, using procedures detailed in Text S1. Chlorinated effluent samples were also measured for fecal coliform counts by the local plant operator (Table S2). Water quality of each wastewater sample is listed in Tables S3 and S4.

Figure 1.
Membrane Bioreactor (MBR) Wastewater Treatment Plant (WWTP) located in King Abdullah University of Science and Technology (KAUST). Collection points are numbered as follows; 1 = influent, 2 = activated sludge, 3 = effluent, 4 = chlorinated effluent. During each sampling, 20 L of influent, 60 L of effluent, 60 L of chlorinated effluent, and 1 L of activated sludge were collected.
2.2. Tangential Flow Filtration (TFF) Concentration of Wastewater Samples
Each wastewater sample was passed through a tangential flow filtration (TFF) system fitted with a T-Series cassette with 100 kDa cut-off (approximately 0.005 µm) (Pall Corporation, Port Washington, NY, USA). Collection of viral particles by filtration is a product of size exclusion, and a filter of 100 kDa pore size would retain most viruses. The capsid sizes of AdV and EV are 77,760 kDa and 5280 kDa respectively and would be retained by the 100 kDa cut-off filter based on size exclusion [17,18]. Influent samples were centrifuged at 7500 g for 10 min to obtain 12 L of clarified sample which was concentrated by TFF. Only the clarified fraction of the influent was analyzed in this study. Since there would be a fraction of viruses associated with the non-clarified fraction, the viral count of the influent may be an underrepresentation of the actual load. Chlorinated effluent was filtered first, followed by the effluent and then the influent. Wastewater samples were concentrated to 5 mL retentate. These samples are labeled as Influent-Retentate, Effluent-Retentate, and Chlorinated Effluent-Retentate. Viral particles adhering to the 100 kDa cassette were collected in 50 mL of wash solution (1× Phosphate Buffered Saline (PBS) and 0.01% Tween 60) and concentrated to 5 mL wash retentate by TFF. These samples are labeled as Influent-Wash, Effluent-Wash, and Chlorinated Effluent-Wash. Each concentrated retentate was stored at −80 °C. The filter was washed with sterile deionized water and 0.1 N NaOH between each filtration event, as per manufacturer’s instructions. The recovery efficiency of the TFF method is detailed in Text S2.
2.3. Nucleic Acid Extraction and Viral Metagenomics Sequencing Analysis
DNA and RNA were extracted from the concentrated samples using the DNeasy Blood and Tissue kit and RNeasy Midi kit (Qiagen, Hilden, Germany), respectively and were quantified using the Qubit 2.0 fluorometer (Thermo Fisher Scientific, Carlsbard, CA, USA). To obtain 1 µg of DNA and RNA for metagenomic analysis, DNA or RNA extracts were pooled from samples collected at different time points. DNA libraries were constructed using the TruSeq DNA LT kit and sequenced on the HiSeq2000 system (Illumina, San Diego, CA, USA). Prior to RNA library generation, ribosomal RNA was removed using the Ribo-ZeroTM Magnetic Gold Kit (Illumina, Madison, WI, USA). RNA libraries were generated using the TruSeq Stranded mRNA plus Ribo-Zero Epidemiology kit and sequenced with the Illumina NextSeq 500 system. Prior to sequencing, 1 µL of the constructed libraries was loaded onto an Agilent Technologies 2100 Bioanalyzer for quality control. All samples obtained and sequenced in this study yielded a single band at approximately 260 bp and had RNA Integrity Index (RIN) of >1.5. All sequencing reactions were carried out at the KAUST Bioscience Core Laboratory. Unassembled metagenomic sequencing reads were directly analyzed by the CosmosID Bioinformatics software package (CosmosID Inc., Rockville, MD, USA), as described elsewhere [19] to achieve multikingdom community analysis at the species, subspecies, and/or strain level and quantification of relative abundance. A brief description of the algorithm employed is described in Text S3. All virome sequencing files were deposited in the European Nucleotide Archive (ENA) under study accession number PRJEB15519.
2.4. Quantification of Enterovirus and Adenovirus by dPCR
AdV and EV copy numbers were quantified by the Clarity dPCR system (JN Medsys, Singapore) as described in Text S4. Extracted DNA was used as template for AdV dPCR with primers that recognize all human AdV, AQ1: 5′-GCCACGGTGGGGTTTCTAAACTT-3′, AQ2: 5′-GCCCCAGTGGTCTTACATGCACATC-3′ and probe, AP: 5′-6FAM-TGCACCAGACCCGGGCTCAGGTACTCCGA-BHQ1-3′ [20]. Template DNA (3 µL) was mixed with 10 µM AQ1 and AQ2 (0.45 µL each), 0.38 µL of 10 µM AP, 0.75 µL of JN Solution (JN MedSys, Singapore), 7.5 µL of 2× Applied Biosystems TaqMan Fast Advanced Master Mix (Thermo Fisher Scientific, Carlsbad, CA, USA), and 2.5 µL of water. Thermocycling conditions for AdV dPCR included an initial denaturation step at 95 °C for 5 min, 40 cycles of 50 s denaturation at 95 °C and a combined annealing-extension step at 58 °C for 90 s.
Similarly, extracted RNA was used as template for dPCR to quantify EV. Primers recognizing 24 different EV strains were used; Ent1: 5′-CGGTACCTTTGTACGCCTGT-3′ and Ent2: 5′-ATTGTCACCATAAGCAGCCA-3′ [21]. The 15 µL reaction mix for EV comprised 3 µL of RNA template, 0.45 µL of Ent1 and Ent2 primers, 0.75 µL of 20× SYBR Green, 0.75 µL of JN Solution (JN MedSys, Singapore), 7.5 µL of 2× RT buffer, 0.3 µL of Life Technologies SuperScriptTM II RT enzyme (Thermo Fisher Scientific, Carlsbad, CA, USA), and 1.8 µL of water. Reaction mixtures were loaded and partitioned onto the high-density chip as described above. EV dPCR thermocycling conditions included cDNA synthesis at 55 °C for 30 min, followed by amplification with initial denaturation step at 94 °C for 2 min and 40 cycles of 94 °C for 15 s, annealing at 52 °C for 30 s, and extension at 68 °C for 60 s. A final extension at 68 °C for 5 min was performed. Sensitivity of viral detection on the digital PCR platform was assayed as described in Text S4.
2.5. Diagnostic Immunofluorescence to Determine Infectious Viral Particle Counts
HEp-2 cells were selected after infectivity tests on five separate cell lines indicated susceptibility to AdV and EV infection (Table S5). HEp-2 (ATCC CCL-23) cells were seeded in flat-surfaced glass culture tubes at 1.2 × 10⁶ cells/tube in Dulbecco's Modified Eagle Medium (DMEM) supplemented with 10% Fetal Bovine Serum (FBS) and Penicillin/Streptomycin (Thermo Fisher Scientific, Carlsbad, CA, USA). Cells were incubated at 37 °C under 5% atmospheric CO2. Post overnight incubation, the medium was replaced with 250 µL concentrated wastewater clarified at 200 g for 5 min to remove bacterial and fungal contaminants and incubated at 37 °C under 5% atmospheric CO2 for 1 h. As a negative control, cells were inoculated with 250 µL of PBS instead. Tubes were removed from the incubator every 15 min for gentle agitation to ensure even distribution of viruses. The inoculum was aspirated off and cells were washed with PBS twice before adding DMEM supplemented with 2% FBS, 1× Penicillin/Streptomycin and 1× Antibiotic AntiMycotic reagent (Corning Incorporated, Corning, NY, USA). The tubes were incubated at 37 °C under 5% atmospheric CO2. Cells were observed under a light microscope daily for cytopathic effect (CPE). A modified approach, as detailed in Text S5, was taken for sludge samples. Once significant CPE was observed (more than 75% of the cells detached or rounded up), cells were scraped to resuspend in the medium and centrifuged at 200 g for 5 min. The pelleted cells were washed twice with 2 mL PBS before resuspension in 100 µL PBS and 10 µL were spotted onto acetone-cleaned Teflon printed diagnostic slides (Immuno-Cell Int., Mechelen, Belgium). The cells were air-dried before fixing in ice-cold acetone for 10 min, stained with Light Diagnostics pan-enterovirus reagent blend (Merck Millipore, Billerica, MA, USA) for 30 min at 37 °C, and washed three times with 1× PBS before staining with anti-mouse IgG-FITC conjugate (Merck Millipore, Billerica, MA, USA) for 30 min at 37 °C. Separate wells were prepared and stained using the Light Diagnostics AdV Direct Immunofluorescence Assay kit (Merck Millipore, Billerica, MA, USA). Slides were observed under an epifluorescence microscope to detect for EV and AdV. Positively-infected cells were identified by the exclusion of nucleus and a strong FITC fluorescence signal coinciding with Evans Blue counterstain. AdV-infected cells also showed several extra-nuclear punctate staining while EV-infected cells displayed several inclusion body-like structures throughout the cytoplasm. These traits were not observed in control cells. The number of fluorescently labeled cells (foci) present in each well were counted under an epifluorescence microscope at 20× magnification. Infectious particles in the original sample were calculated by the following formula:
where FFU/L: Foci Forming Units per litre, f: number of fluorescently labelled cells, d: number of days for CPE to be reached, v: volume of wastewater sample in litres. This calculation is based on a replication rate of 12 h and 24 h, for EV and AdV, respectively [6,22]. The lowest possible concentration of EV and AdV that could be detected by this method is 0.12 FFU/L and 0.24 FFU/L of wastewater.
3. Results
3.1. Viral Families and Species Detected in the WWTP
To determine the composition of viruses present in the wastewater samples, extracted nucleic acids were sequenced by omics-based sequencing, and compared against a collated viral database. Enterobacteria phage and Pseudomonas phage, which comprised the bulk of the sequencing reads, were excluded to improve detection sensitivity of viruses of public health relevance.
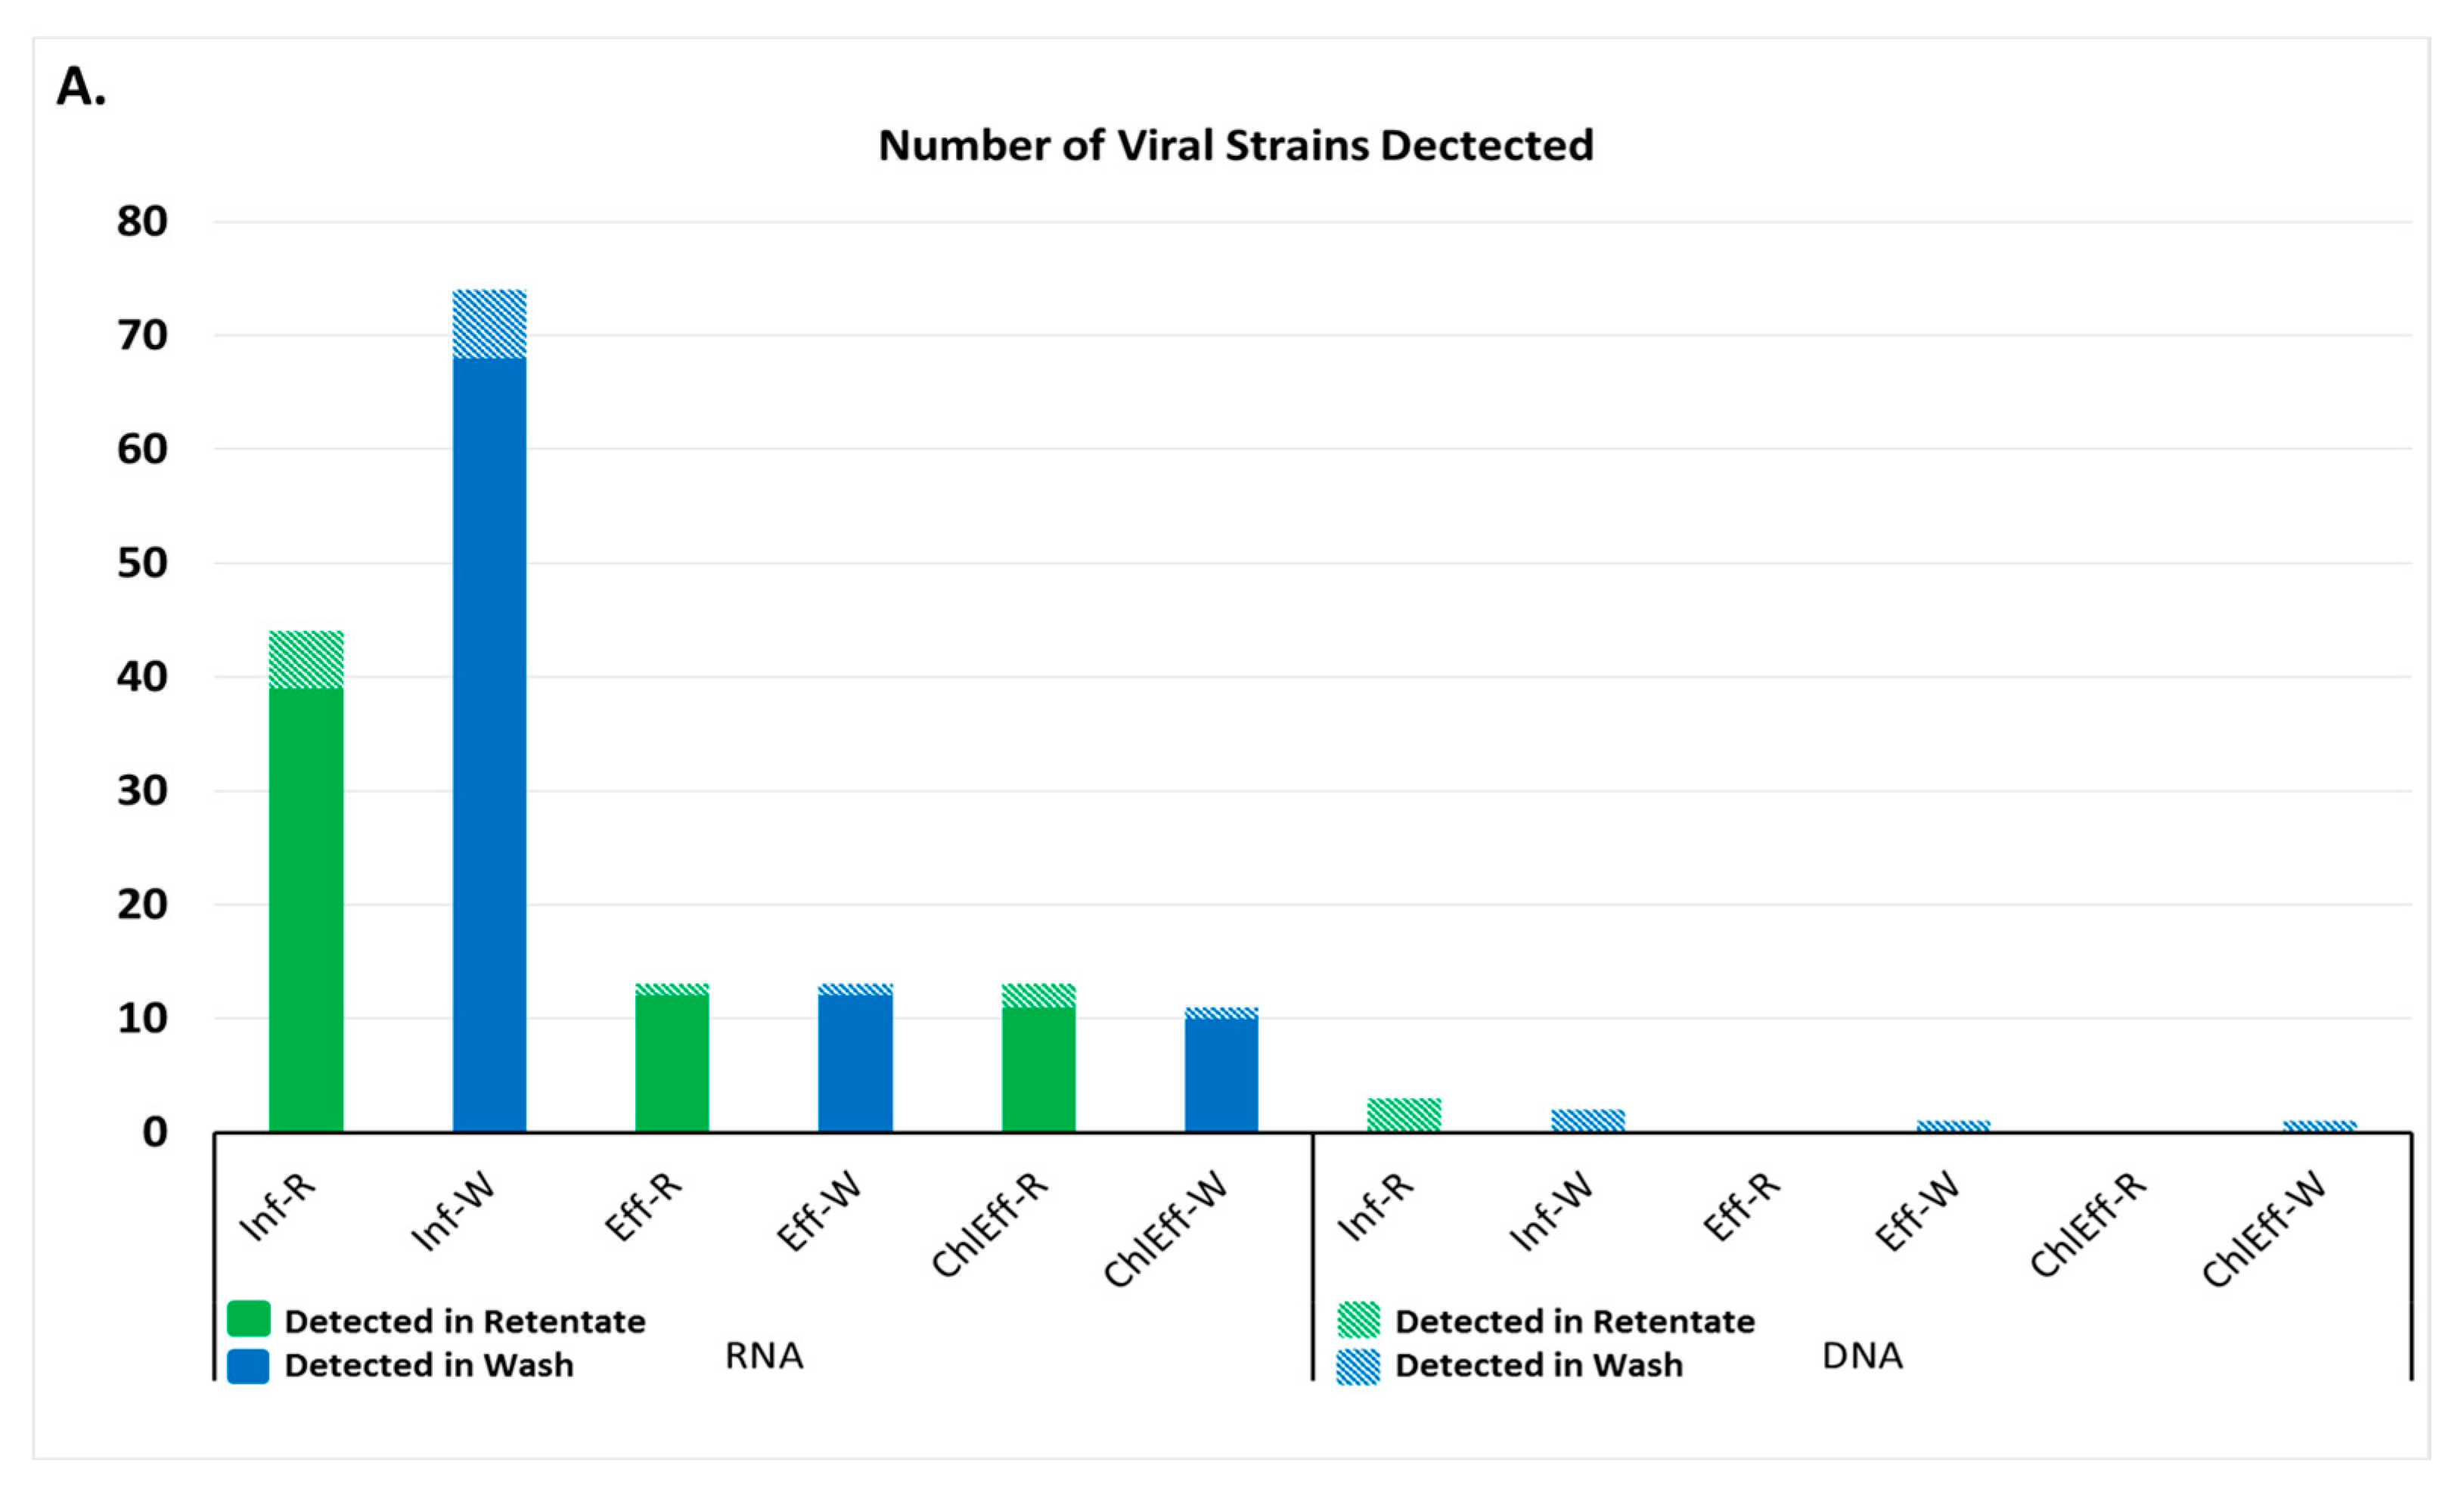
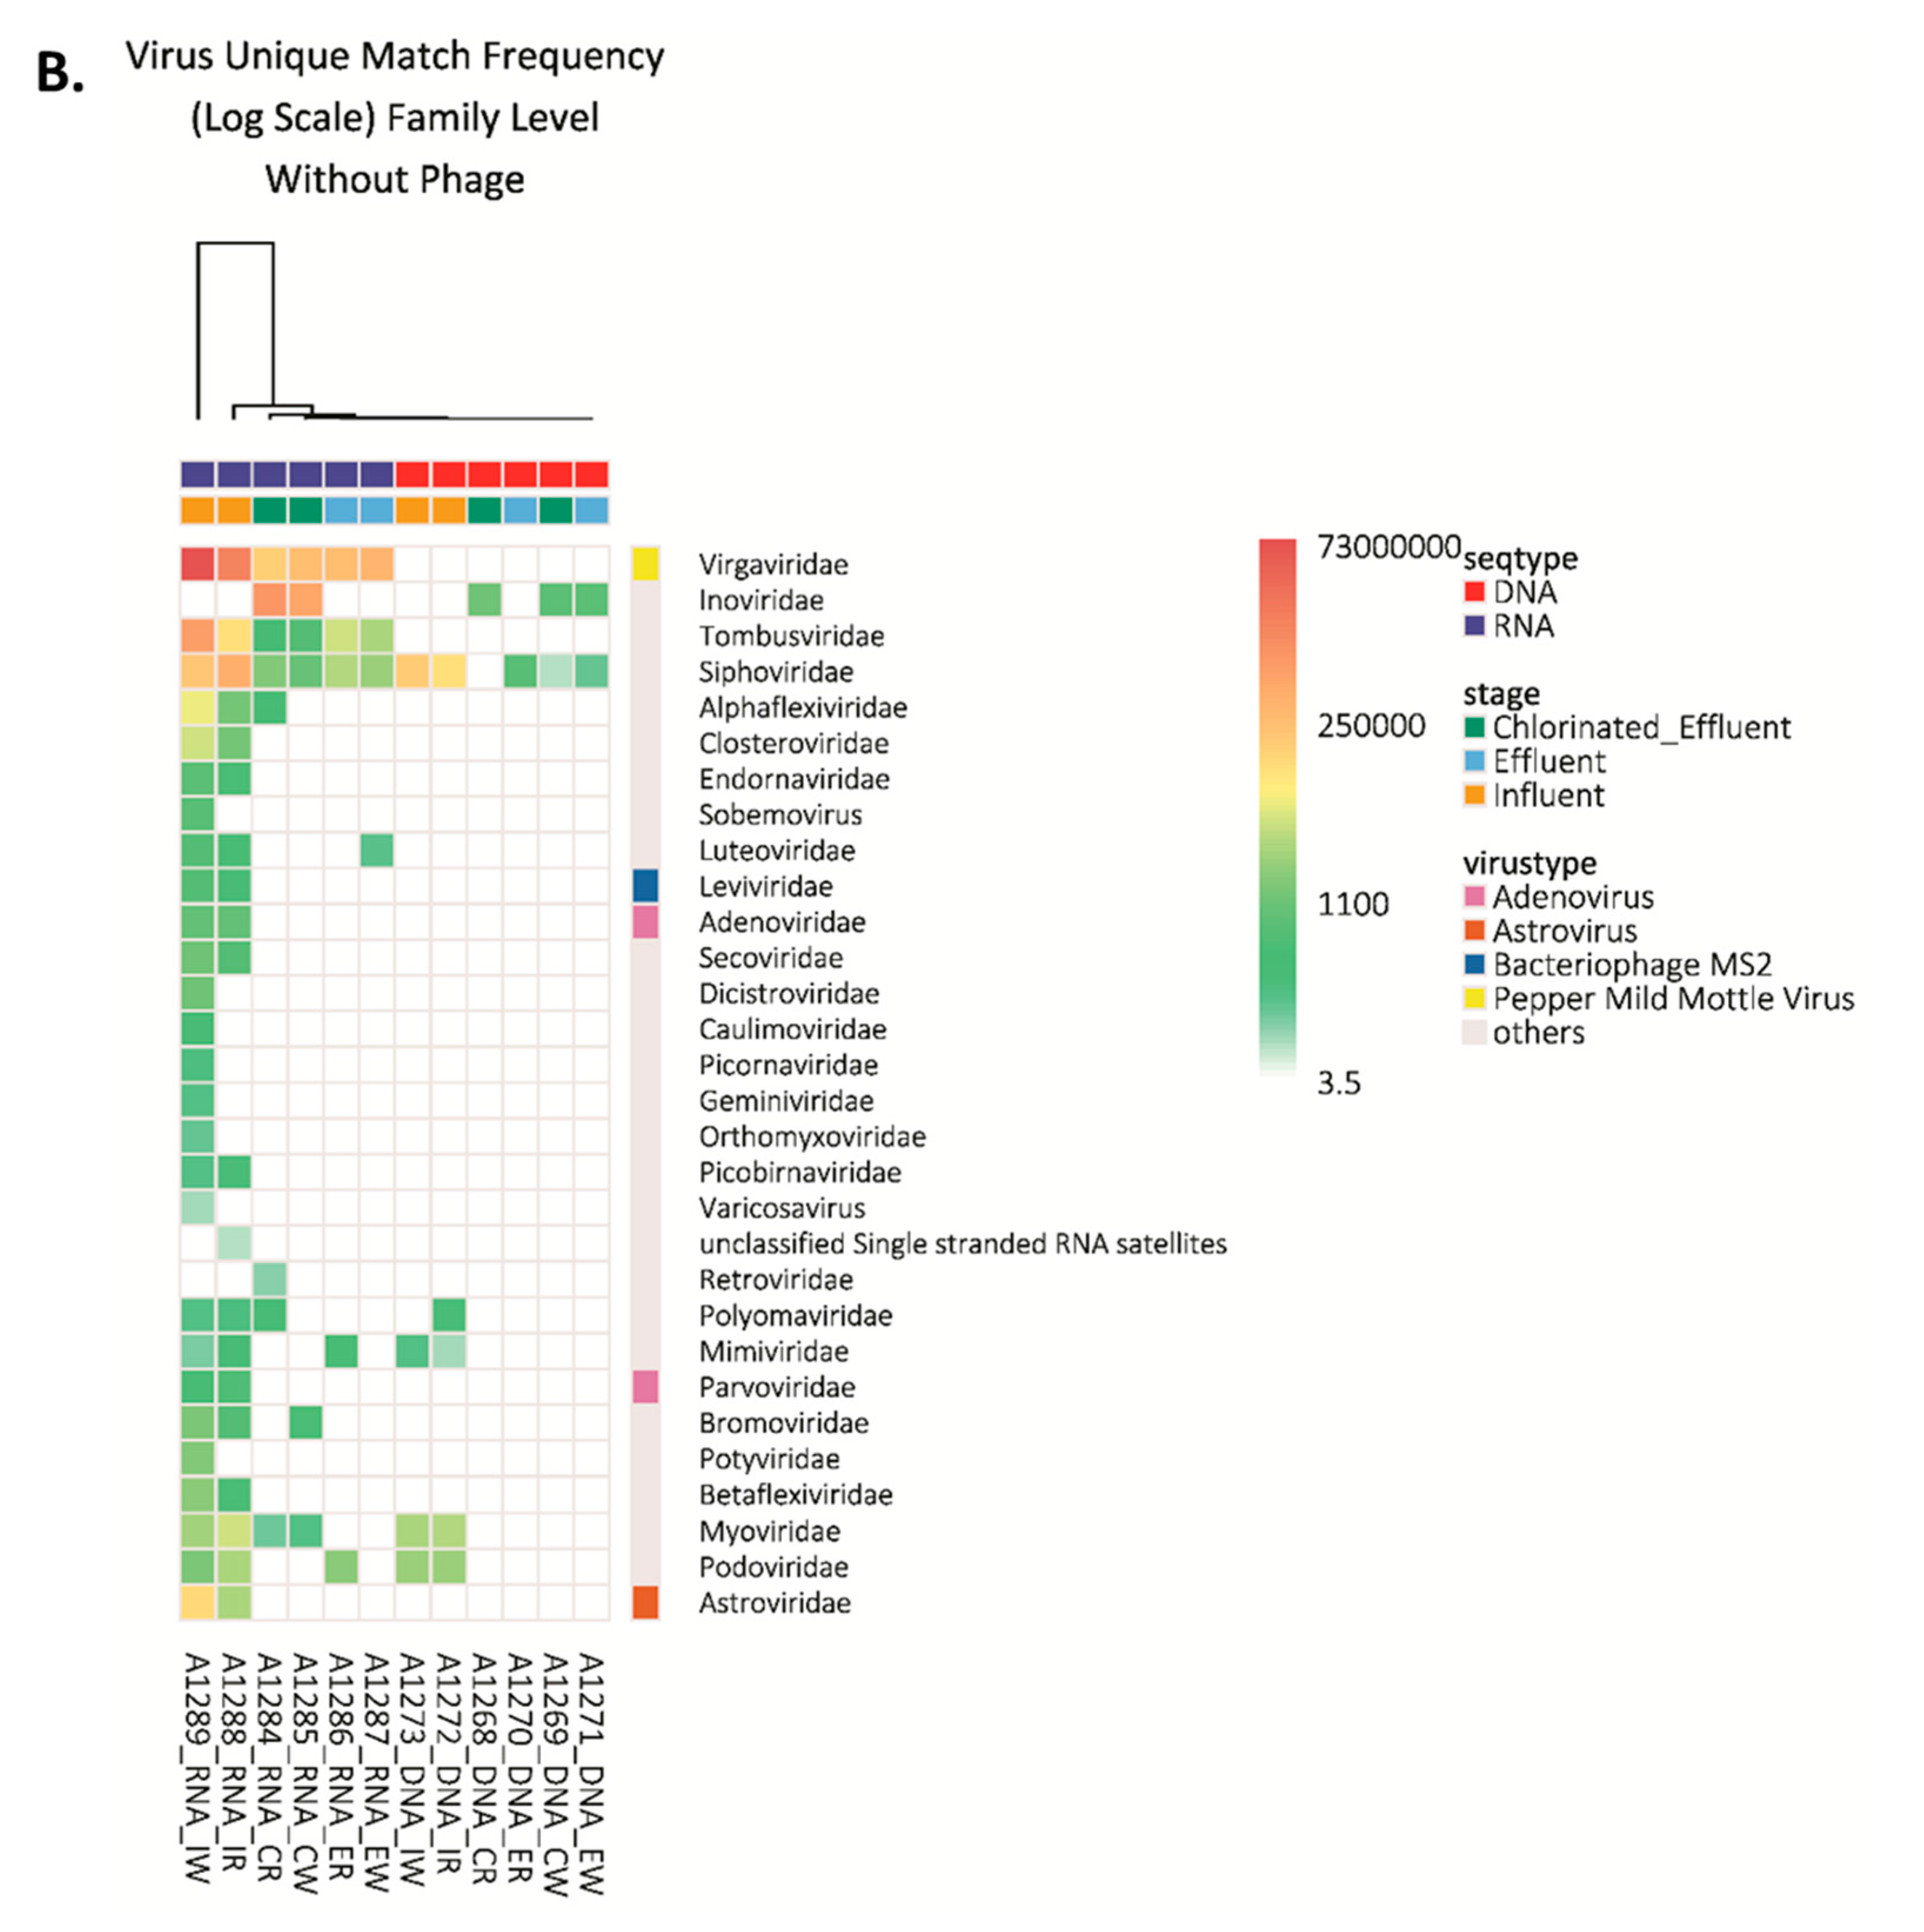
A total of 44 RNA viral strains were detected in the influent-retentate and 76 in the influent-wash, comprising 27 and 20 RNA viral families, respectively. Post-MBR treatment, the number of RNA viral strains in the effluent-retentate and wash were 18 and 16 from 5 and 4 different viral families, respectively. A total of 18 and 15 different RNA viral strains from eight and six families were detected in the chlorinated effluent-retentate and wash, respectively (Figure 2A). Plant RNA viruses belonging to the family Virgaviridae were detected throughout the WWTP process and were the most abundant in each sample (Figure 2B). Viruses belonging to this family had a relative abundance of 94.9% and 97.7% in the influent-retentate and influent-wash. The relative abundances of the same virus family were 82.6% and 89.9% in the effluent-retentate and effluent-wash, and decreased to 3.6% and 18.9% in the chlorinated effluent. The most abundant was Cucumber Green Mottle Mosaic virus with a relative abundance of 84.44% and 88.3% in influent-retentate and wash, respectively (Supplementary Materials Figure S1), decreasing to 69.9% and 79.1% in the effluent and to 2.9% and 16.0% in the chlorinated effluent. The second most abundant member of the Virgaviridae family was Pepper Mild Mottle virus with a relative abundance of 5.3% and 6.2% in the influent-retentate and wash, respectively (Figure S1). These values decreased to 6.4% and 5.0% in the effluent and to 0.5% and 1.8% in the chlorinated effluent.
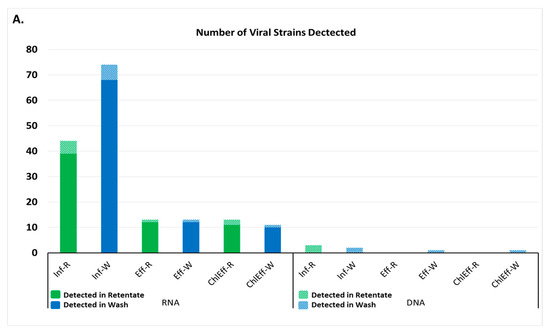
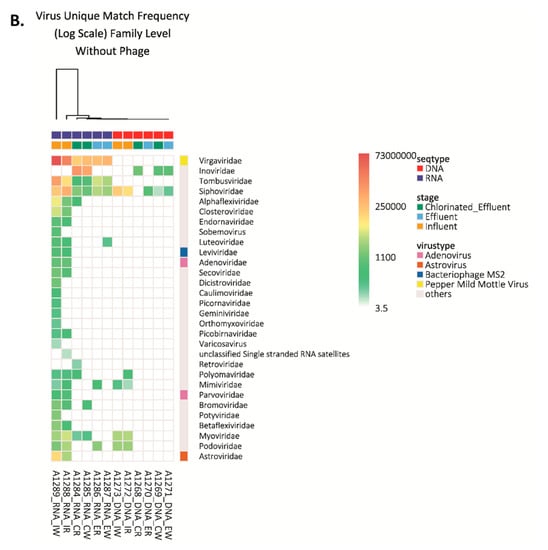
Figure 2.
Viruses detected in wastewater by next generation sequencing. (A) Number of strains of virus detected in each wastewater sample. Inf-R = Influent-retentate, Inf-W = Influent-wash, Eff-R = Effluent-retentate, Eff-W = Effluent-wash, ChlEff-R = Chlorinated Effluent-retentate, ChlEff-W = Chlorinated Effluent-wash; (B) Heatmap of viral families detected in wastewater samples. Colored scale bar represents the unique hit frequency for each family. IR = Influent-retentate, IW = Influent-wash, ER = Effluent-retentate, EW = Effluent-wash, CR = Chlorinated Effluent-retentate, CW = Chlorinated Effluent-wash.
A similar observation was made with viruses from the Tombusviridae family, albeit these were not as abundant as Virgaviridae (Figure 2B). Viruses from the Tombusviridae family, such as Melon Necrotic Spot Virus (Figure S1), had a relative abundance of 1.2% and 1.8% in the influent-retentate and wash. The effluent retentate and wash had a relative abundance of 3.8% and 1.9%, and further decreased to below the detection limit and 0.1% in the chlorinated effluent, respectively. This suggests Melon Necrotic Spot Virus to be particularly labile to chlorine disinfection although further investigation is required to verify its susceptibility towards chlorine.
RNA viruses belonging to families Closteroviridae, Endornaviridae, Sobernoviridae, Leviviridae, Secoviridae, Dicistroviridae, Picornaviridae, Orthmyxoviridae, Picorbirnaviridae, Varicosaviridae, Potyviridae, Betaflexviridae, and Astroviridae were present in the influent but were removed by MBR treatment. As expected, none of the 72 RNA viral species were detected in the DNA extracts (Figure S1).
The influent-retentate contained three different DNA viral species (Mimivirus, BK Polyoma Virus, and Bppunalikevirus), while the influent-wash contained Mimivirus and Bppunalikevirus, belonging to the Mimiviridae, Polyomaviridae, and Podoviridae families, respectively. None were detected in effluent or chlorinated effluent. Only unclassified siphoviruses were detected in effluent-wash and chlorinated effluent-wash, indicating effective reduction of those in the influent (Figure S1). All four viruses were detected in the RNA samples. Interestingly, seven DNA viruses were detected in the RNA extracts: members of the Adenoviridae, Parvoviridae, Myoviridae, Caulimoviridae, Polyomaviridae, and Geminiviridae families. Most of the viruses were detected only in the RNA extract of influent-retentate or wash, except Merkel Cell Polyomavirus (Polyomaviridae) which was detected in the RNA extract of chlorinated effluent-retentate (Figure 2B and Figure S1).
3.2. Reduction Efficiency of AdV by WWTP
While results of the omics-based sequencing provided quantification of viral species detected throughout the WWTP process, viral species present at low relative abundance were masked by more abundant species. Hence, dPCR was employed to quantify AdV for two reasons. The Adenoviridae family is the only DNA viral family represented by two different viral species, namely human mastadenovirus A and F, and the AdV is commonly cited as an indicator of fecal contamination [23].
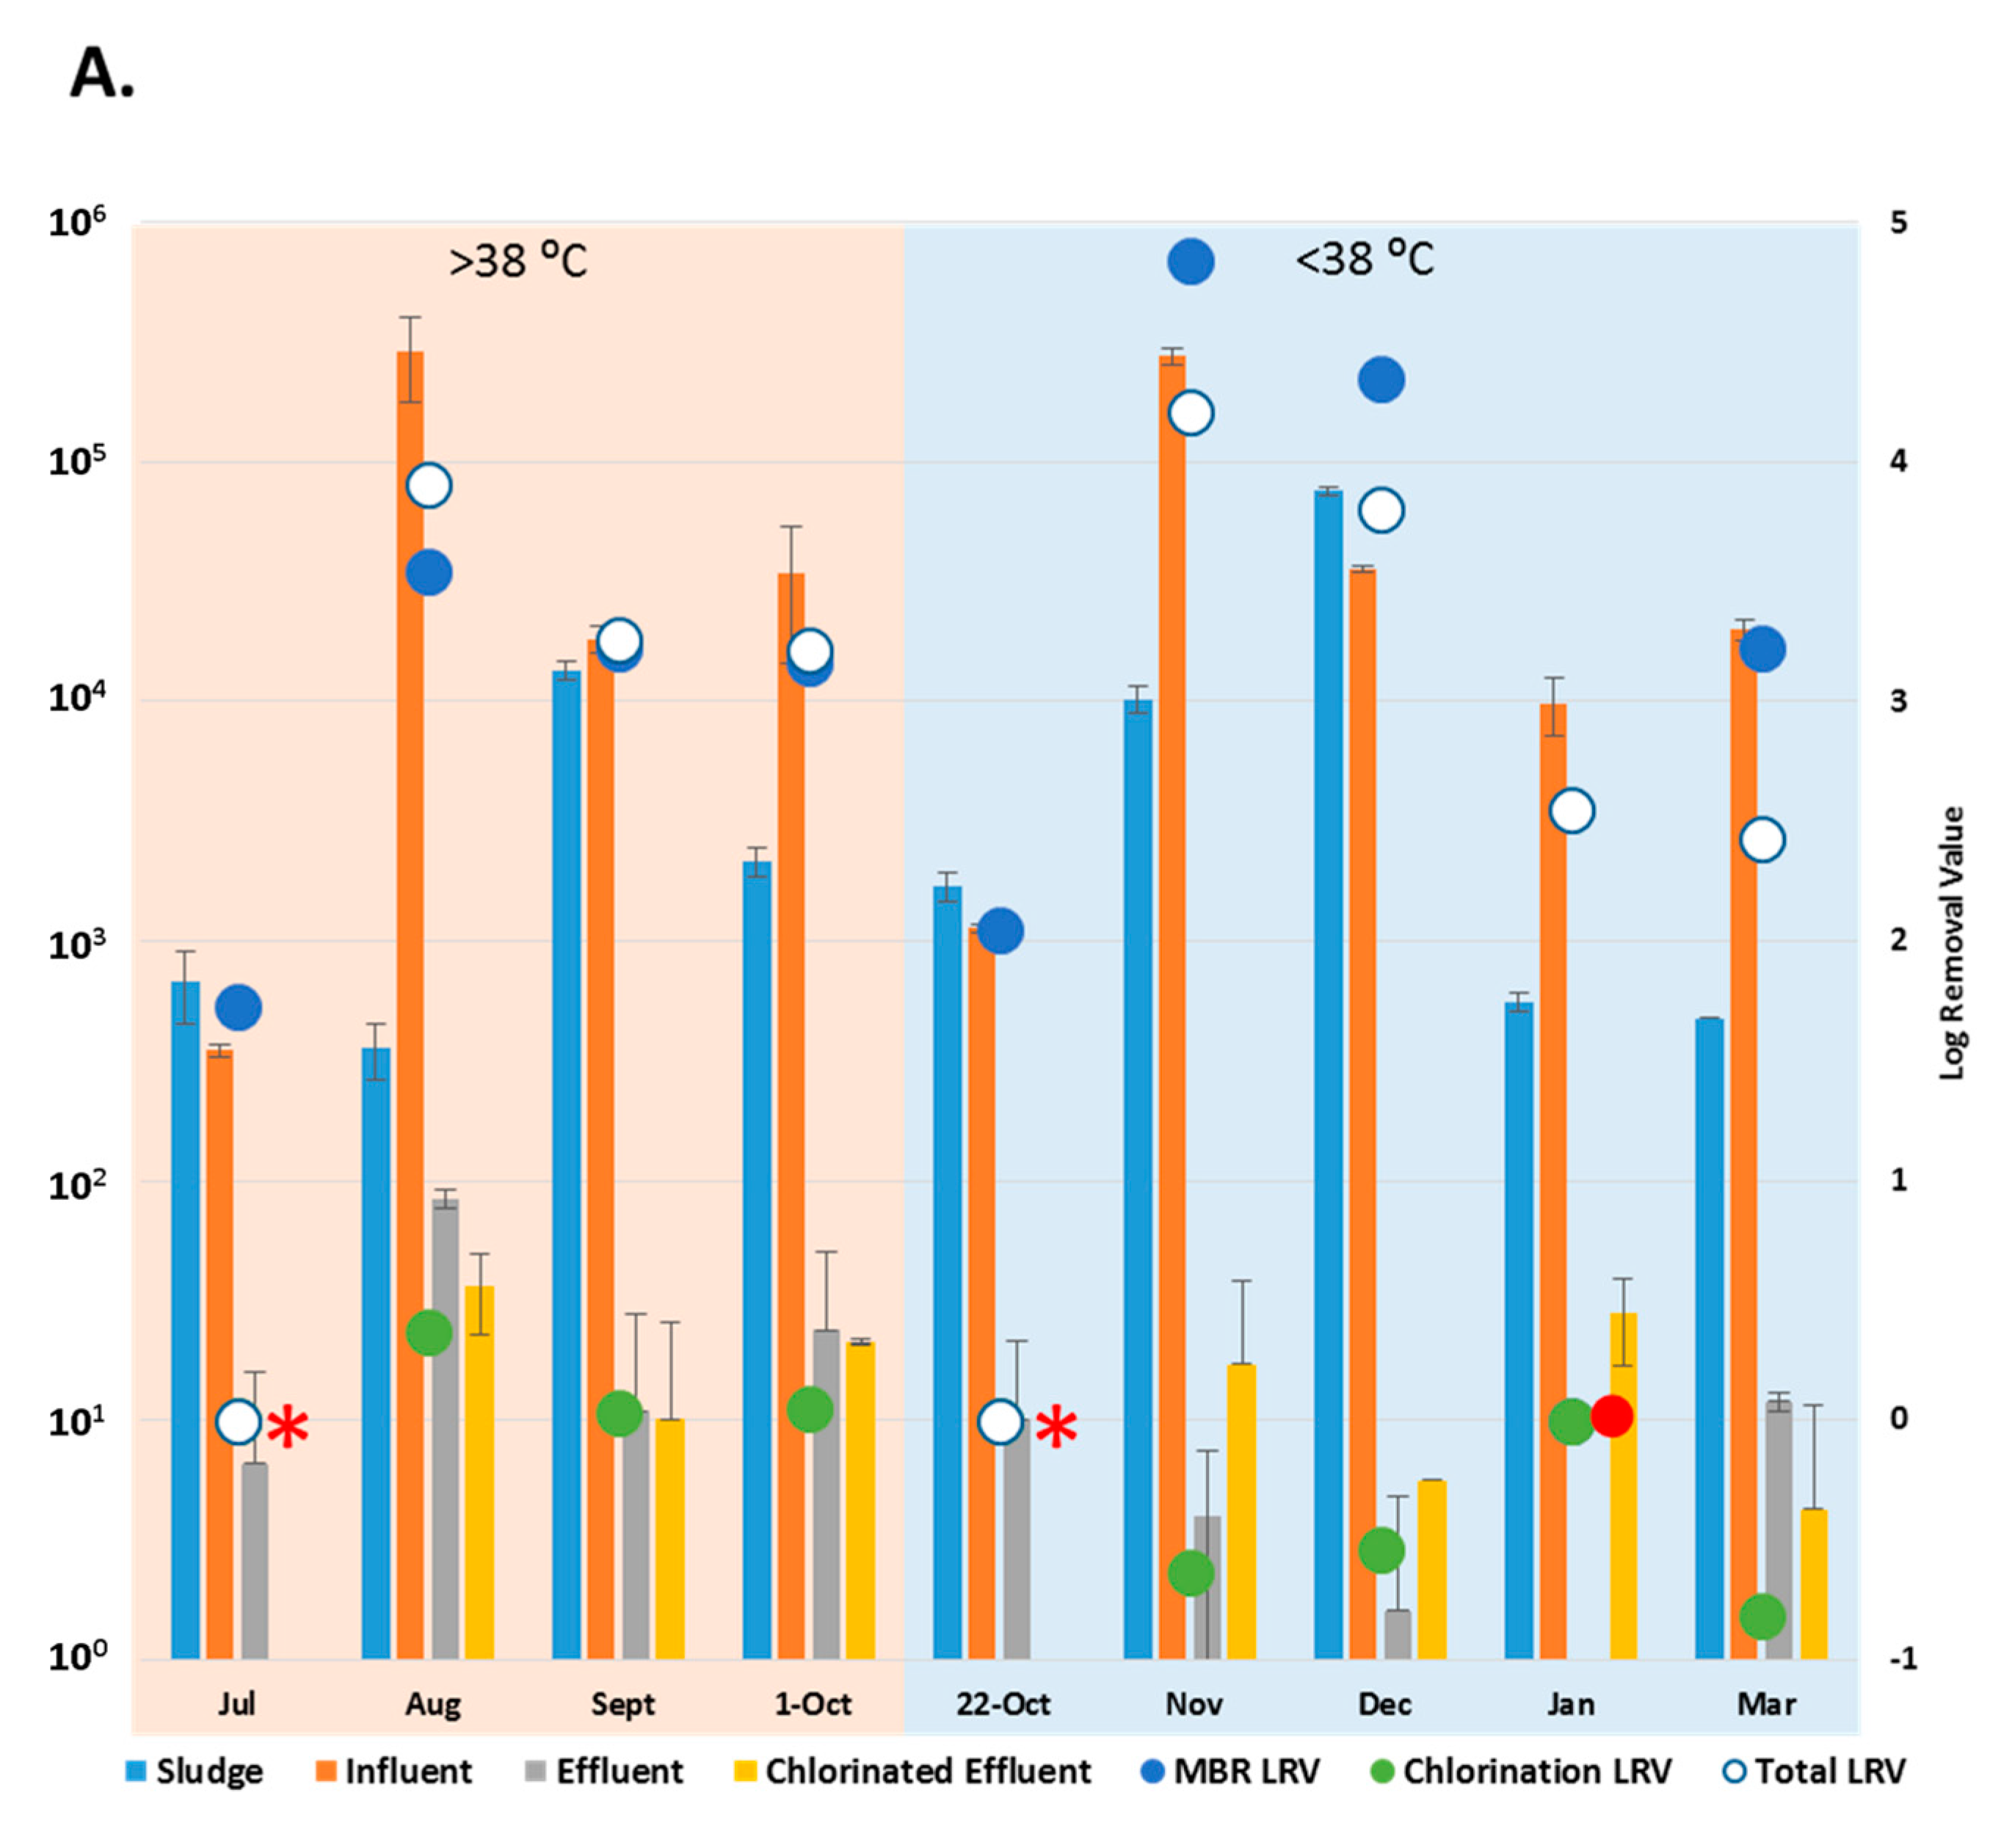
AdV were detected in influent throughout the collection period. Influent AdV copy numbers ranged from 3.5 × 10² ± 20 copies/L (July 2015) to 2.9 ± 1.2 × 10⁵ copies/L (August 2015). No copies of AdV were detected in the effluent collected in January 2016, but were detected at a maximum of 8.4 ± 0.7 × 101 copies/L in the effluent in August 2015. AdV were not detected in chlorinated effluent samples collected in July and on 22 October, but had the highest concentration of 3.6 ± 1.3 × 101 copies/L in the chlorinated effluent collected in August 2015 (Figure 3A). Activated sludge samples were positive for AdV throughout the sampling period. The lowest number of AdV in sludge was detected in August (3.6 ± 1.0 × 10² copies/g) and highest was in December 2015 (7.6 ± 0.4 × 10⁴ copies/g).
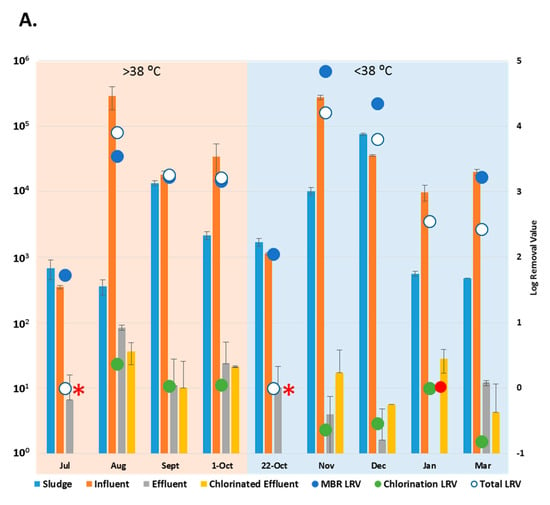
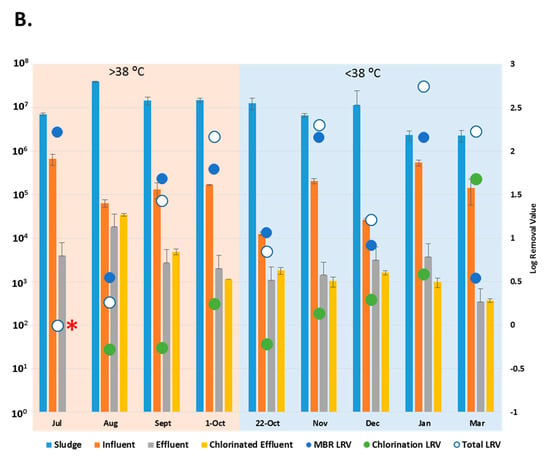
Figure 3.
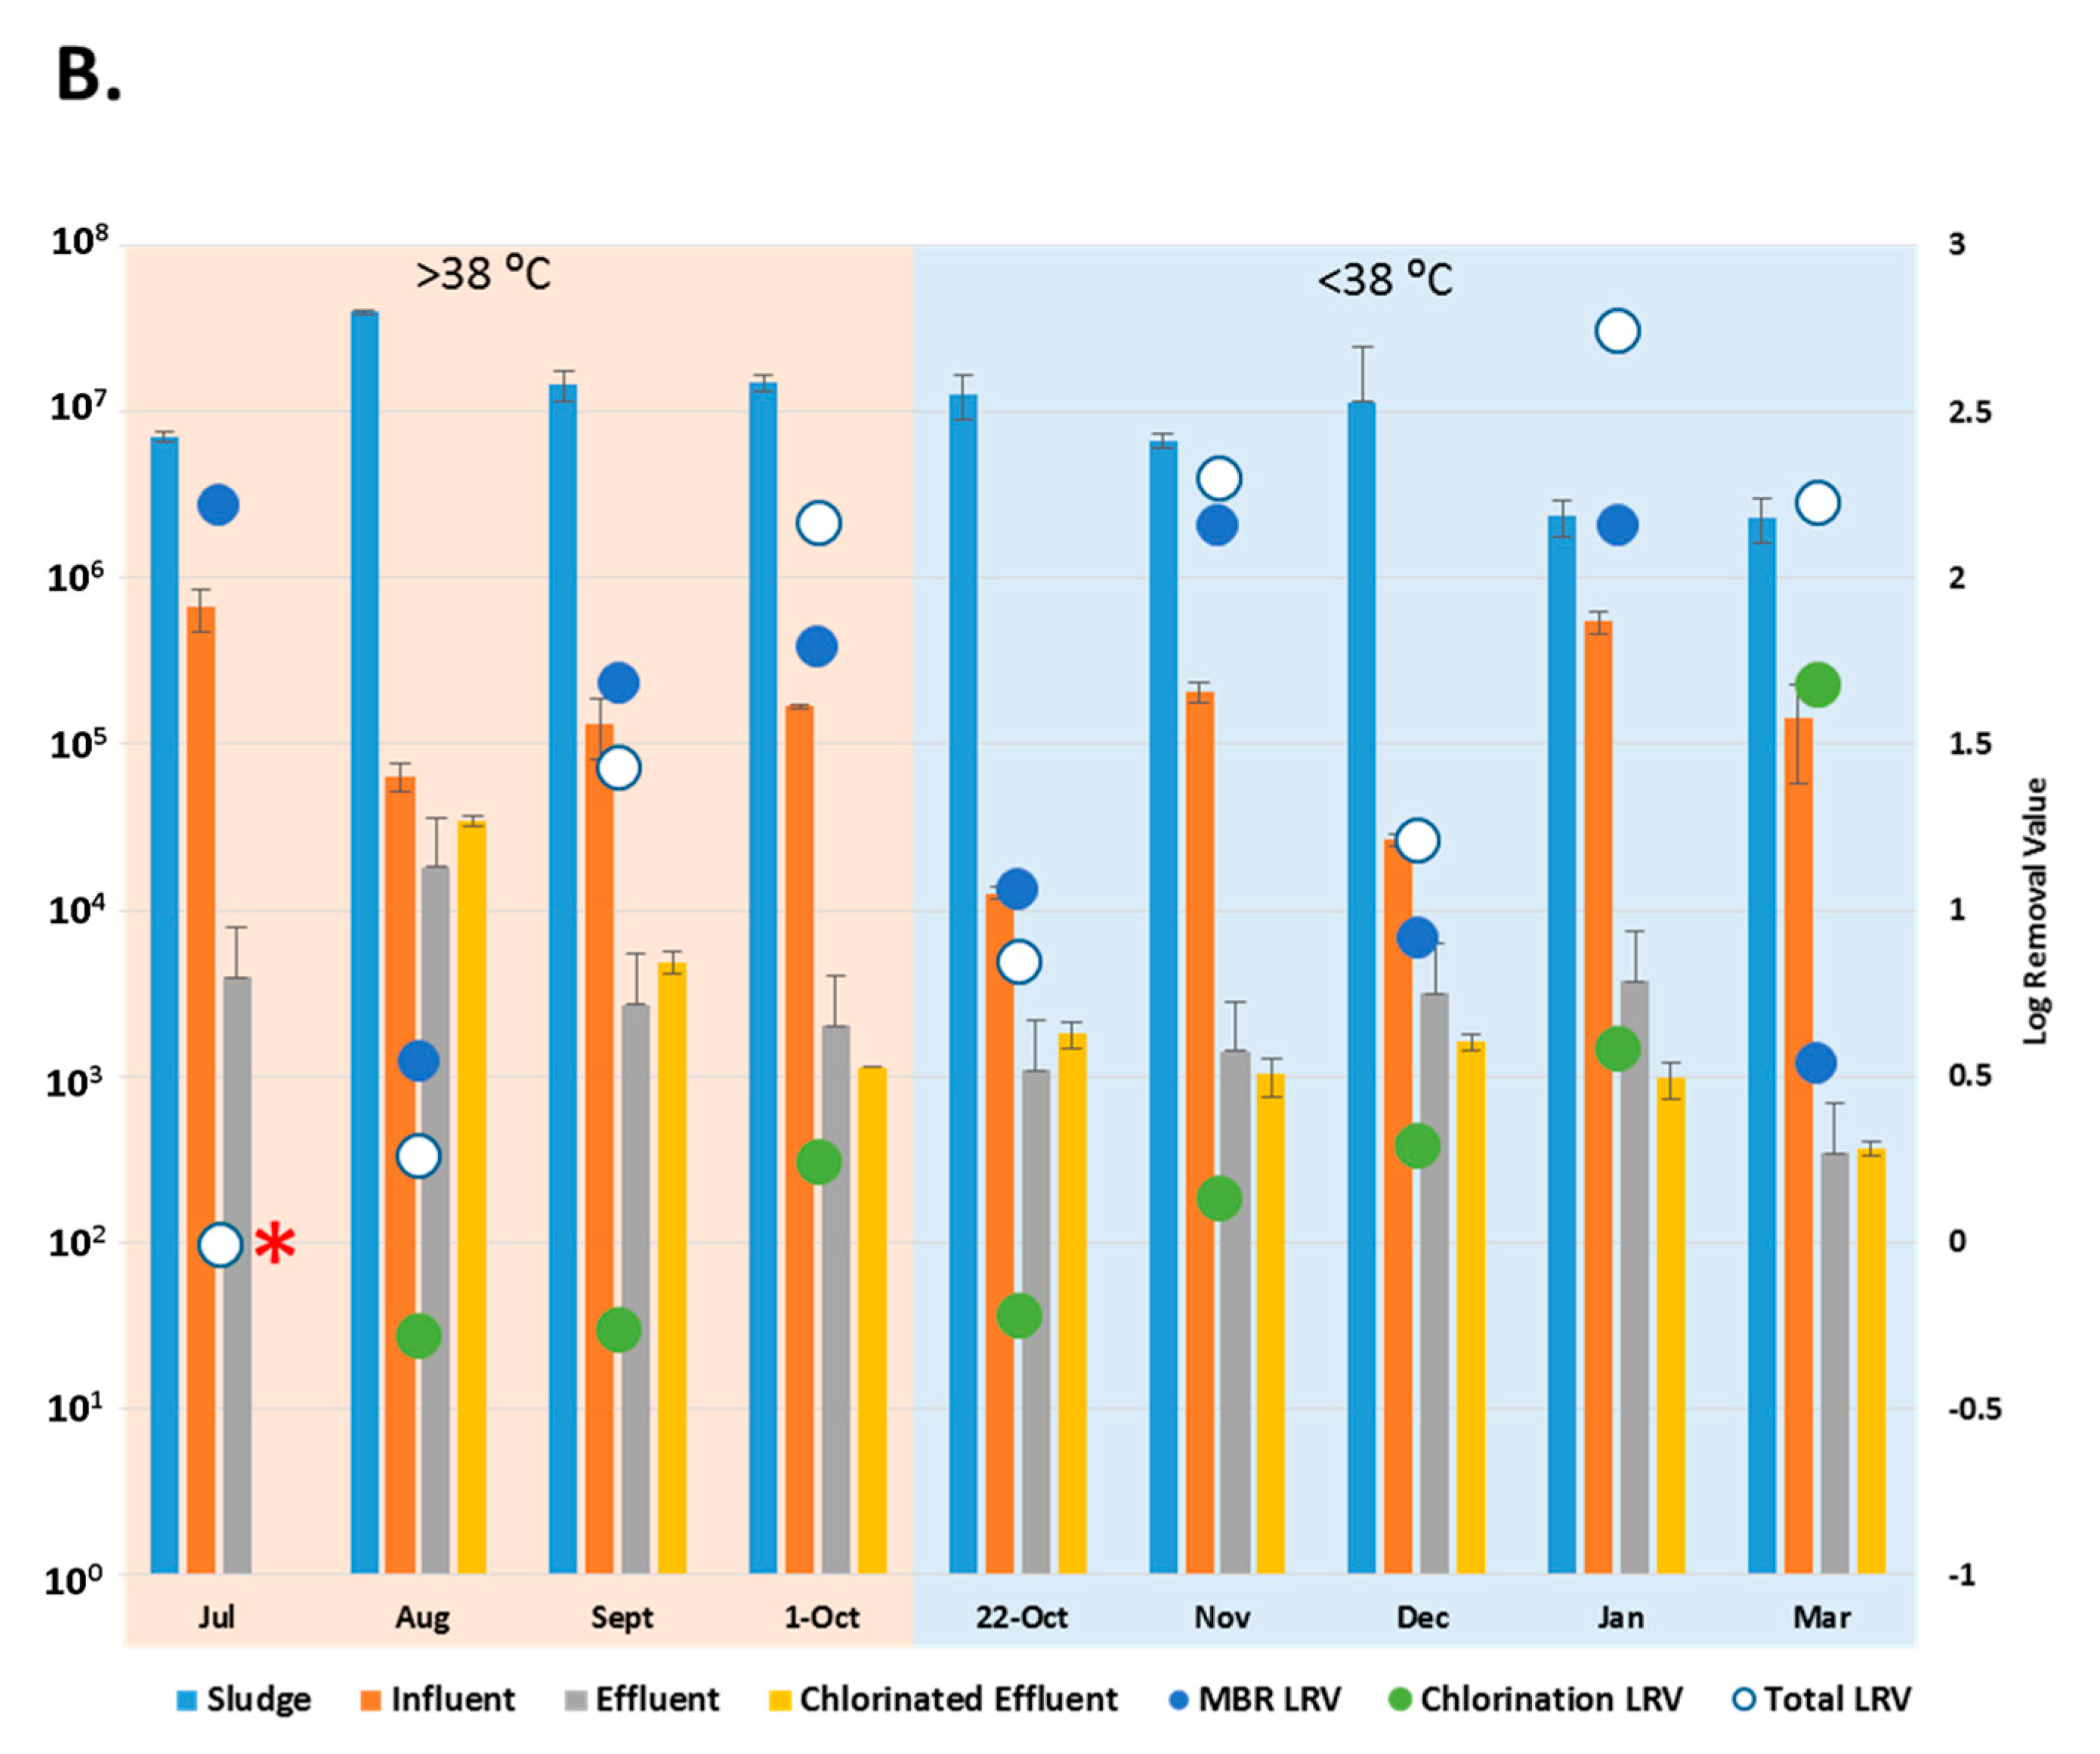
Copy number of enteric viruses detected by digital PCR (dPCR). (A) Copy number of Adenoviruses (AdV) in each wastewater (copies/L) and sludge sample (copies/g); (B) Copy number of Enteroviruses (EV) in each wastewater (copies/L) and sludge sample (copies/g) * = No copies detected in the chlorinated effluent. • = No copies detected in the effluent. LRV = Log Removal, represented on the secondary axis. Collection dates listed according to maximum temperature (>38 °C = “hot” and <38 °C = “cold”). Sample size, n = 3.
With the exception of the July and 22 October 2015 samples, when no AdV copies were detected in the chlorinated effluent, (*, Figure 3A), the entire WWTP process achieved reduction of AdV by 2.4 to 4.2-log (March, November 2015). The MBR results showed removal of AdV that had been present in the influent in January (•, Figure 3A) while achieving a reduction of 1.7 to 4.8-log (July, November 2015) throughout the rest of the sampling period. Aside from July and 22 October, when AdV was not detected post-chlorination, the chlorination process reduced copy number in the effluent by up to 0.4-log (August 2015) (Figure 3A). AdV copy numbers did not vary significantly between effluent and the chlorinated effluent (p > 0.05). The AdV viral load did not vary significantly between “hot” and “cold” months (p > 0.05). However, for three of the five “cold” months, more AdV copies were detected in chlorinated effluent than in the effluent samples (Figure 3A).
3.3. Reduction Efficiency of EV by WWTP
Influent EV numbers were higher than effluent and chlorinated effluent, with a range of 1.3 ± 0.1 × 10⁴ copies/L (22 October 2015) to 6.7 ± 1.9 × 10⁵ copies/L (July 2015). EV ranged from 3.5 ± 0.1 × 10² copies/L (March 2016) to 1.8 ± 0.05 × 10⁴ copies/L (August 2015) in the effluent. EV was not detected in chlorinated effluent in July 2015, but were in the range of 3.7 ± 0.4 × 10² copies/L (March 2016) to 3.5 ± 0.2 × 10⁴ copies/L (August 2015) throughout the study period (Figure 3B). Sludge contained abundant EV during each month sampled. EV ranged from 2.3 ± 0.7 × 10⁶ (March 2016) to 4.0 ± 0.1 × 10⁷ copies/g (August 2015) in sludge.
The entire WWTP process achieved a log reduction of 0.3–2.8 during most sampling months except July 2015 where no EV were detected (*, Figure 3B), The MBR process reduced the EV load in influent by 0.5 to 2.2-log (March 2016, July 2015). EV were not detected in chlorinated effluent in July 2015, but more EV were detected in the chlorinated effluent than the effluent in four of the sampling months. EV copy numbers, like AdV, did not vary significantly between “hot” and “cold” months (p > 0.05) or between the effluent and chlorinated effluent (p > 0.05).
3.4. Infectious AdV and EV Were Reduced in Number by WWTP
Infectious assays were employed to determine if the presumptive AdV and EV in wastewater and sludge samples were infectious. Table 1 lists incubation periods required for HEp-2 cells to reach significant cytopathic effect (CPE) upon inoculation with wastewater samples. On average, cells infected with influent reached CPE by 6 ± 1 d, effluent by 7 ± 1 d, and chlorinated effluent by 8 ± 1 d. The t-test results showed that the difference between number of days for influent-infected samples and both types of effluent-infected samples were statistically significant (p < 0.05), while the difference between effluent and chlorinated effluent was not. No statistically significant difference was observed for results obtained in “hot” and “cold” months (Table 1).

Table 1.
Incubation period for cytopathic effect (CPE). Number of days for HEp-2 cells inoculated with wastewater to reach significant CPE. a Average ± standard deviation values specific to each wastewater sample (n = 9). b Average ± standard deviation values specific to the different seasons of >38 °C (n = 4) and < 38 °C (n = 5).
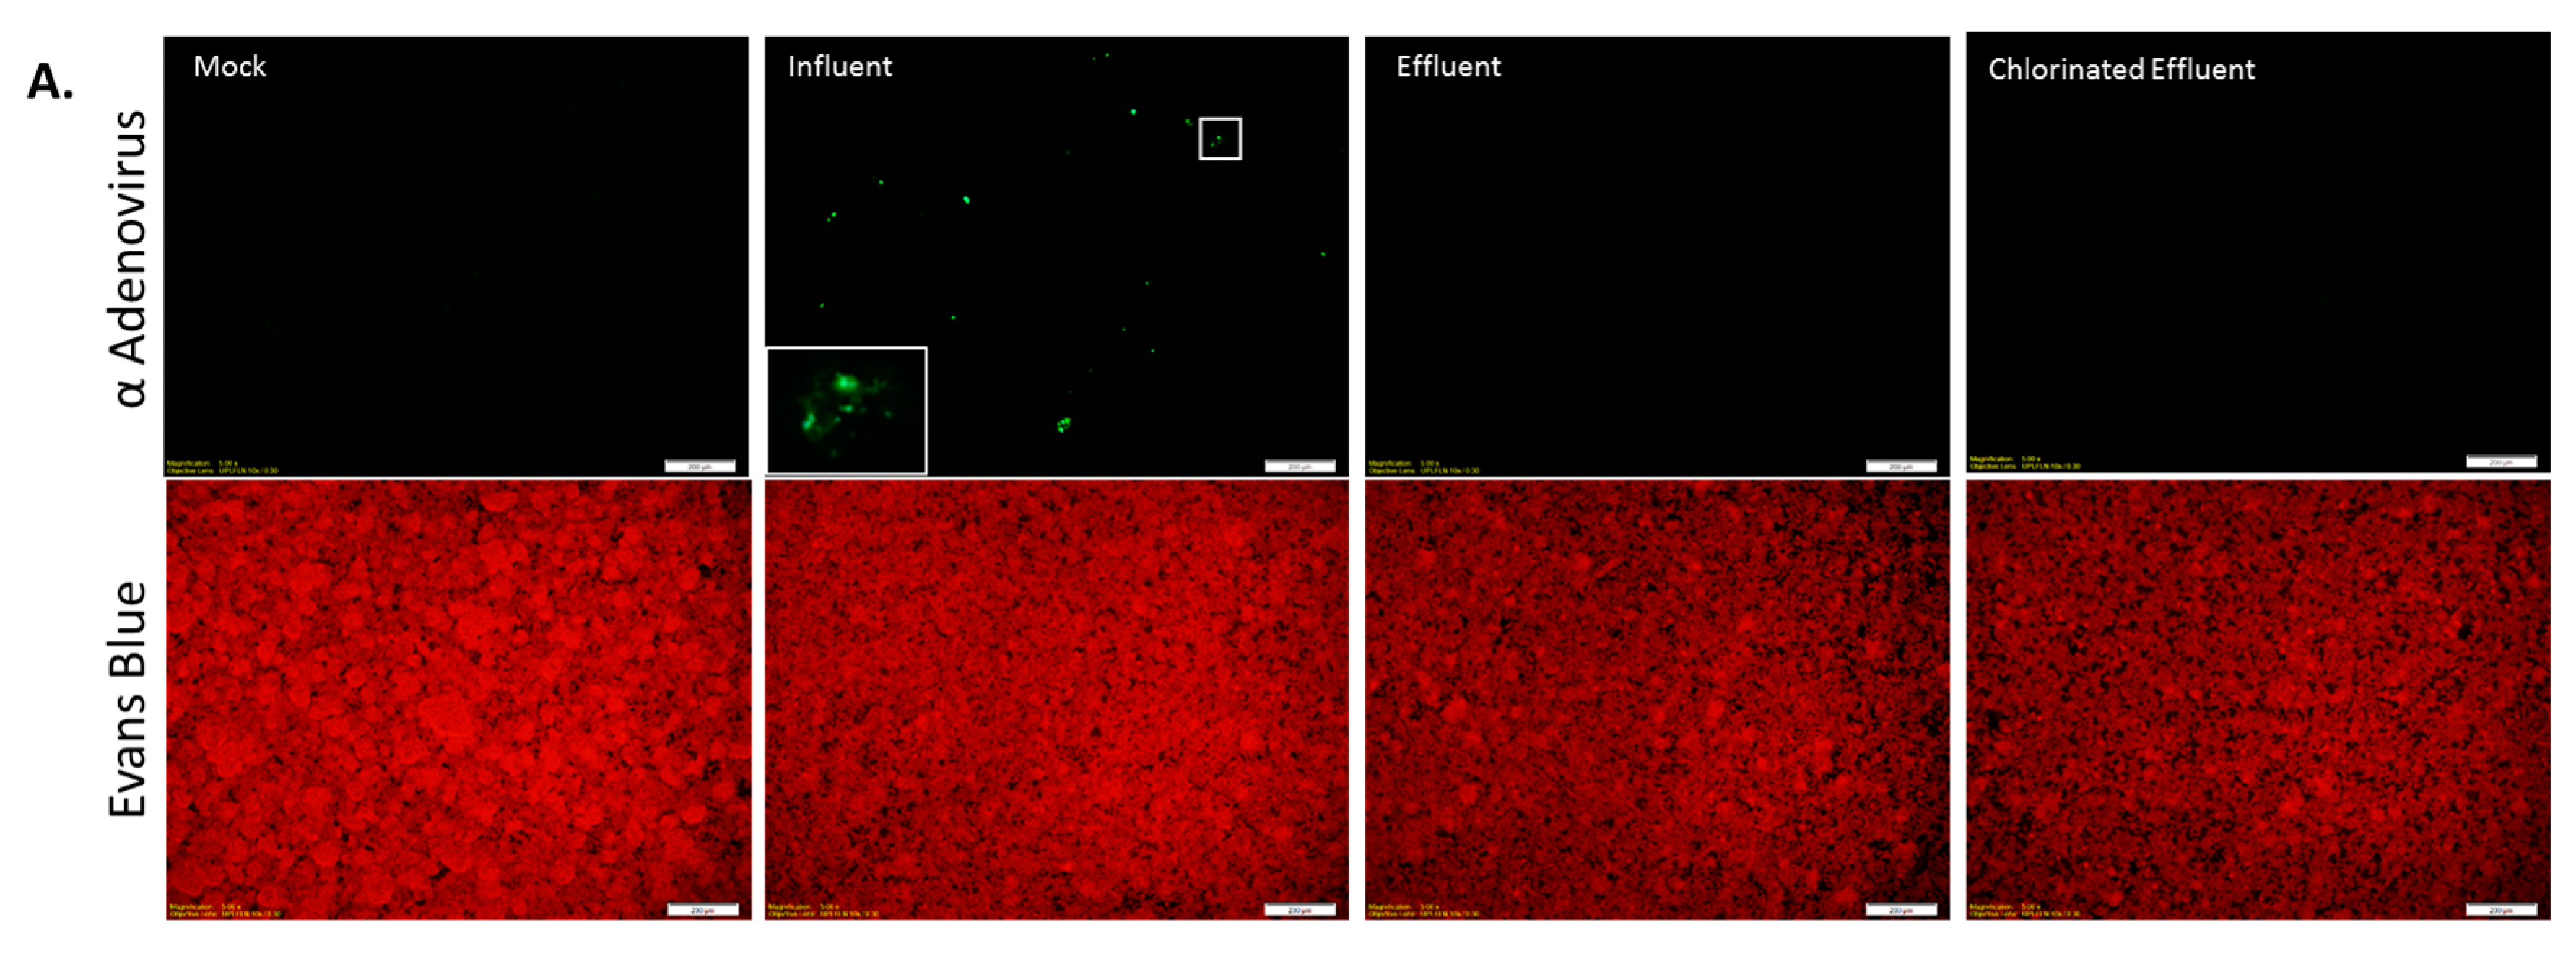
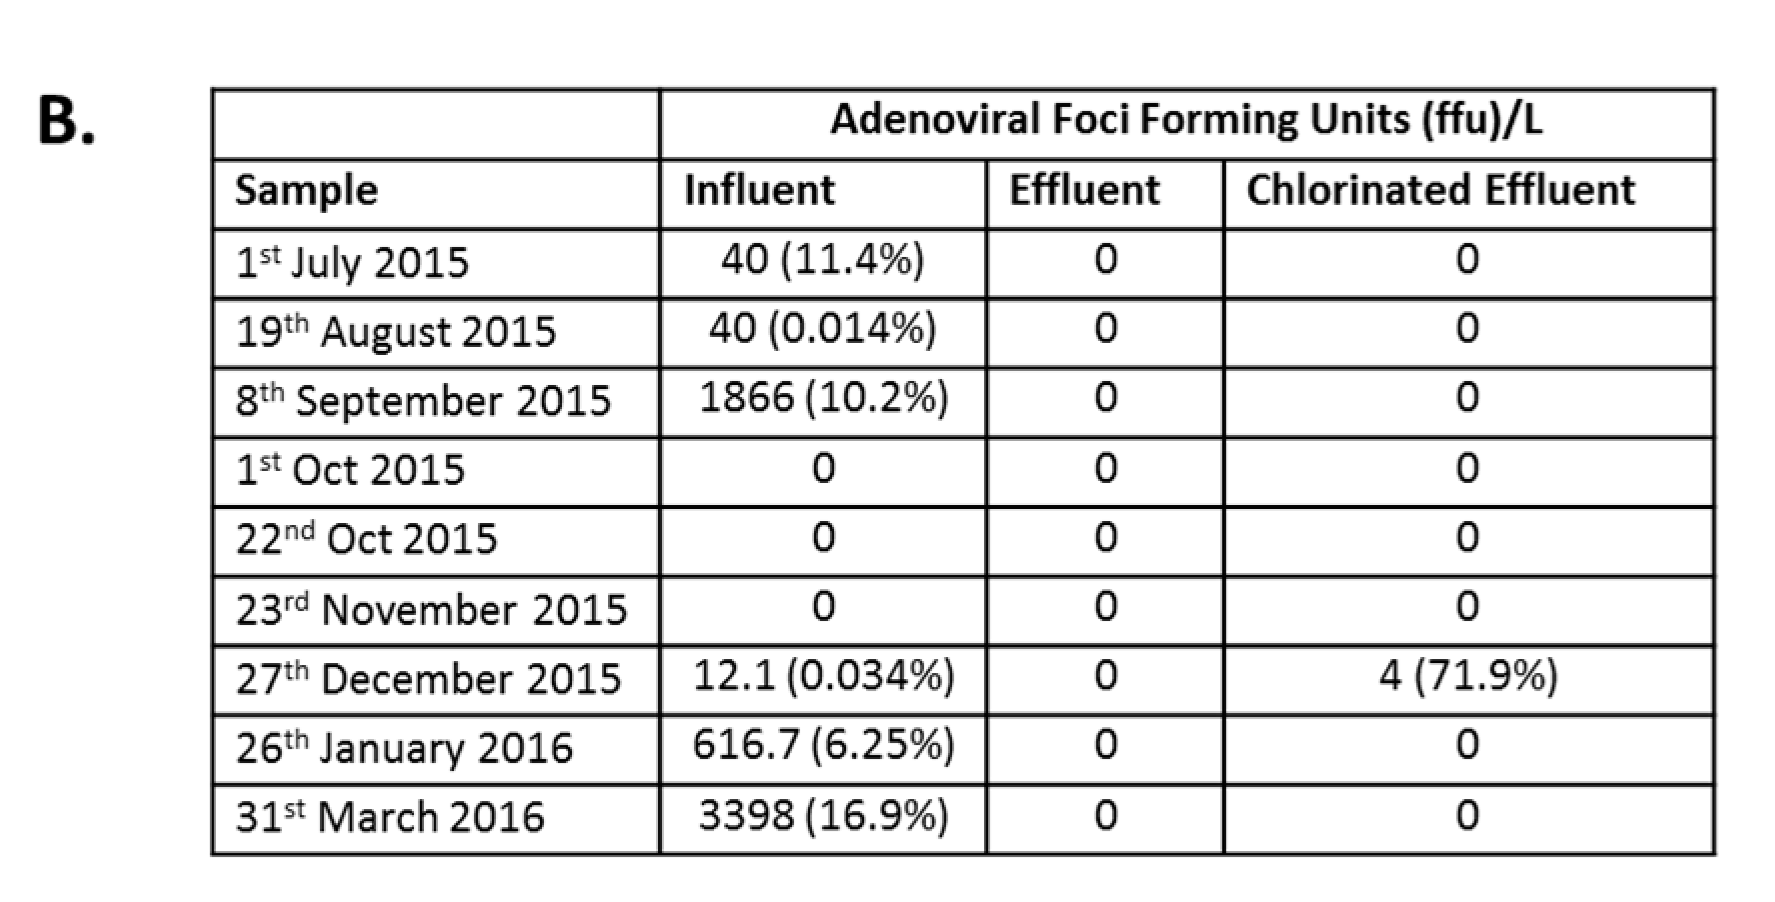
Infectious AdV were detected in the influent of six of the nine collection points at varying concentrations (Figure 4A). The highest average concentration of infectious AdV, 3.4 × 10³ foci forming units/L (FFU/L), was detected in influent samples collected in March 2016, comprising 16.9% of total AdV detected by dPCR (Figure 4B). No infectious AdV particles were detected post MBR (Figure 4A), except in December 2015, when an average of 4 FFU/L were detected, comprising 71.9% of AdV detected by dPCR and a LRV of 0.5 (Figure 4B).
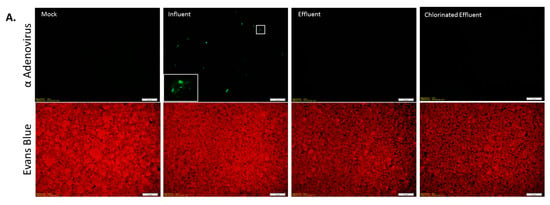
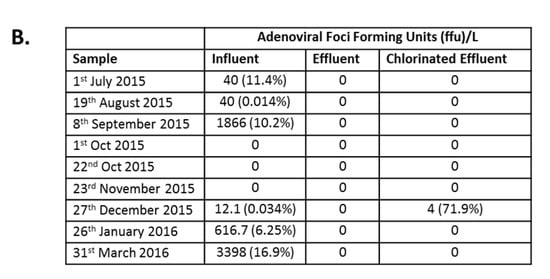
Figure 4.
Immunofluorescence assay for Adenovirus (AdV) infection. (A) Epifluorescence images of HEp-2 cells inoculated with wastewater: Cells were either mock-infected (Mock) or inoculated with wastewater (Influent, Effluent, and Chlorinated Effluent). Cells were labeled with anti-adenovirus antibody-FITC (upper panel) co-stained with Evans Blue (lower panel). Inset = magnified view of an AdV infected cell; (B) Average numbers of foci forming units (FFU) of AdV in the original wastewater samples (n = 2). Numbers in brackets denote the percentage of infectious particles of total copy number detected by digital PCR.
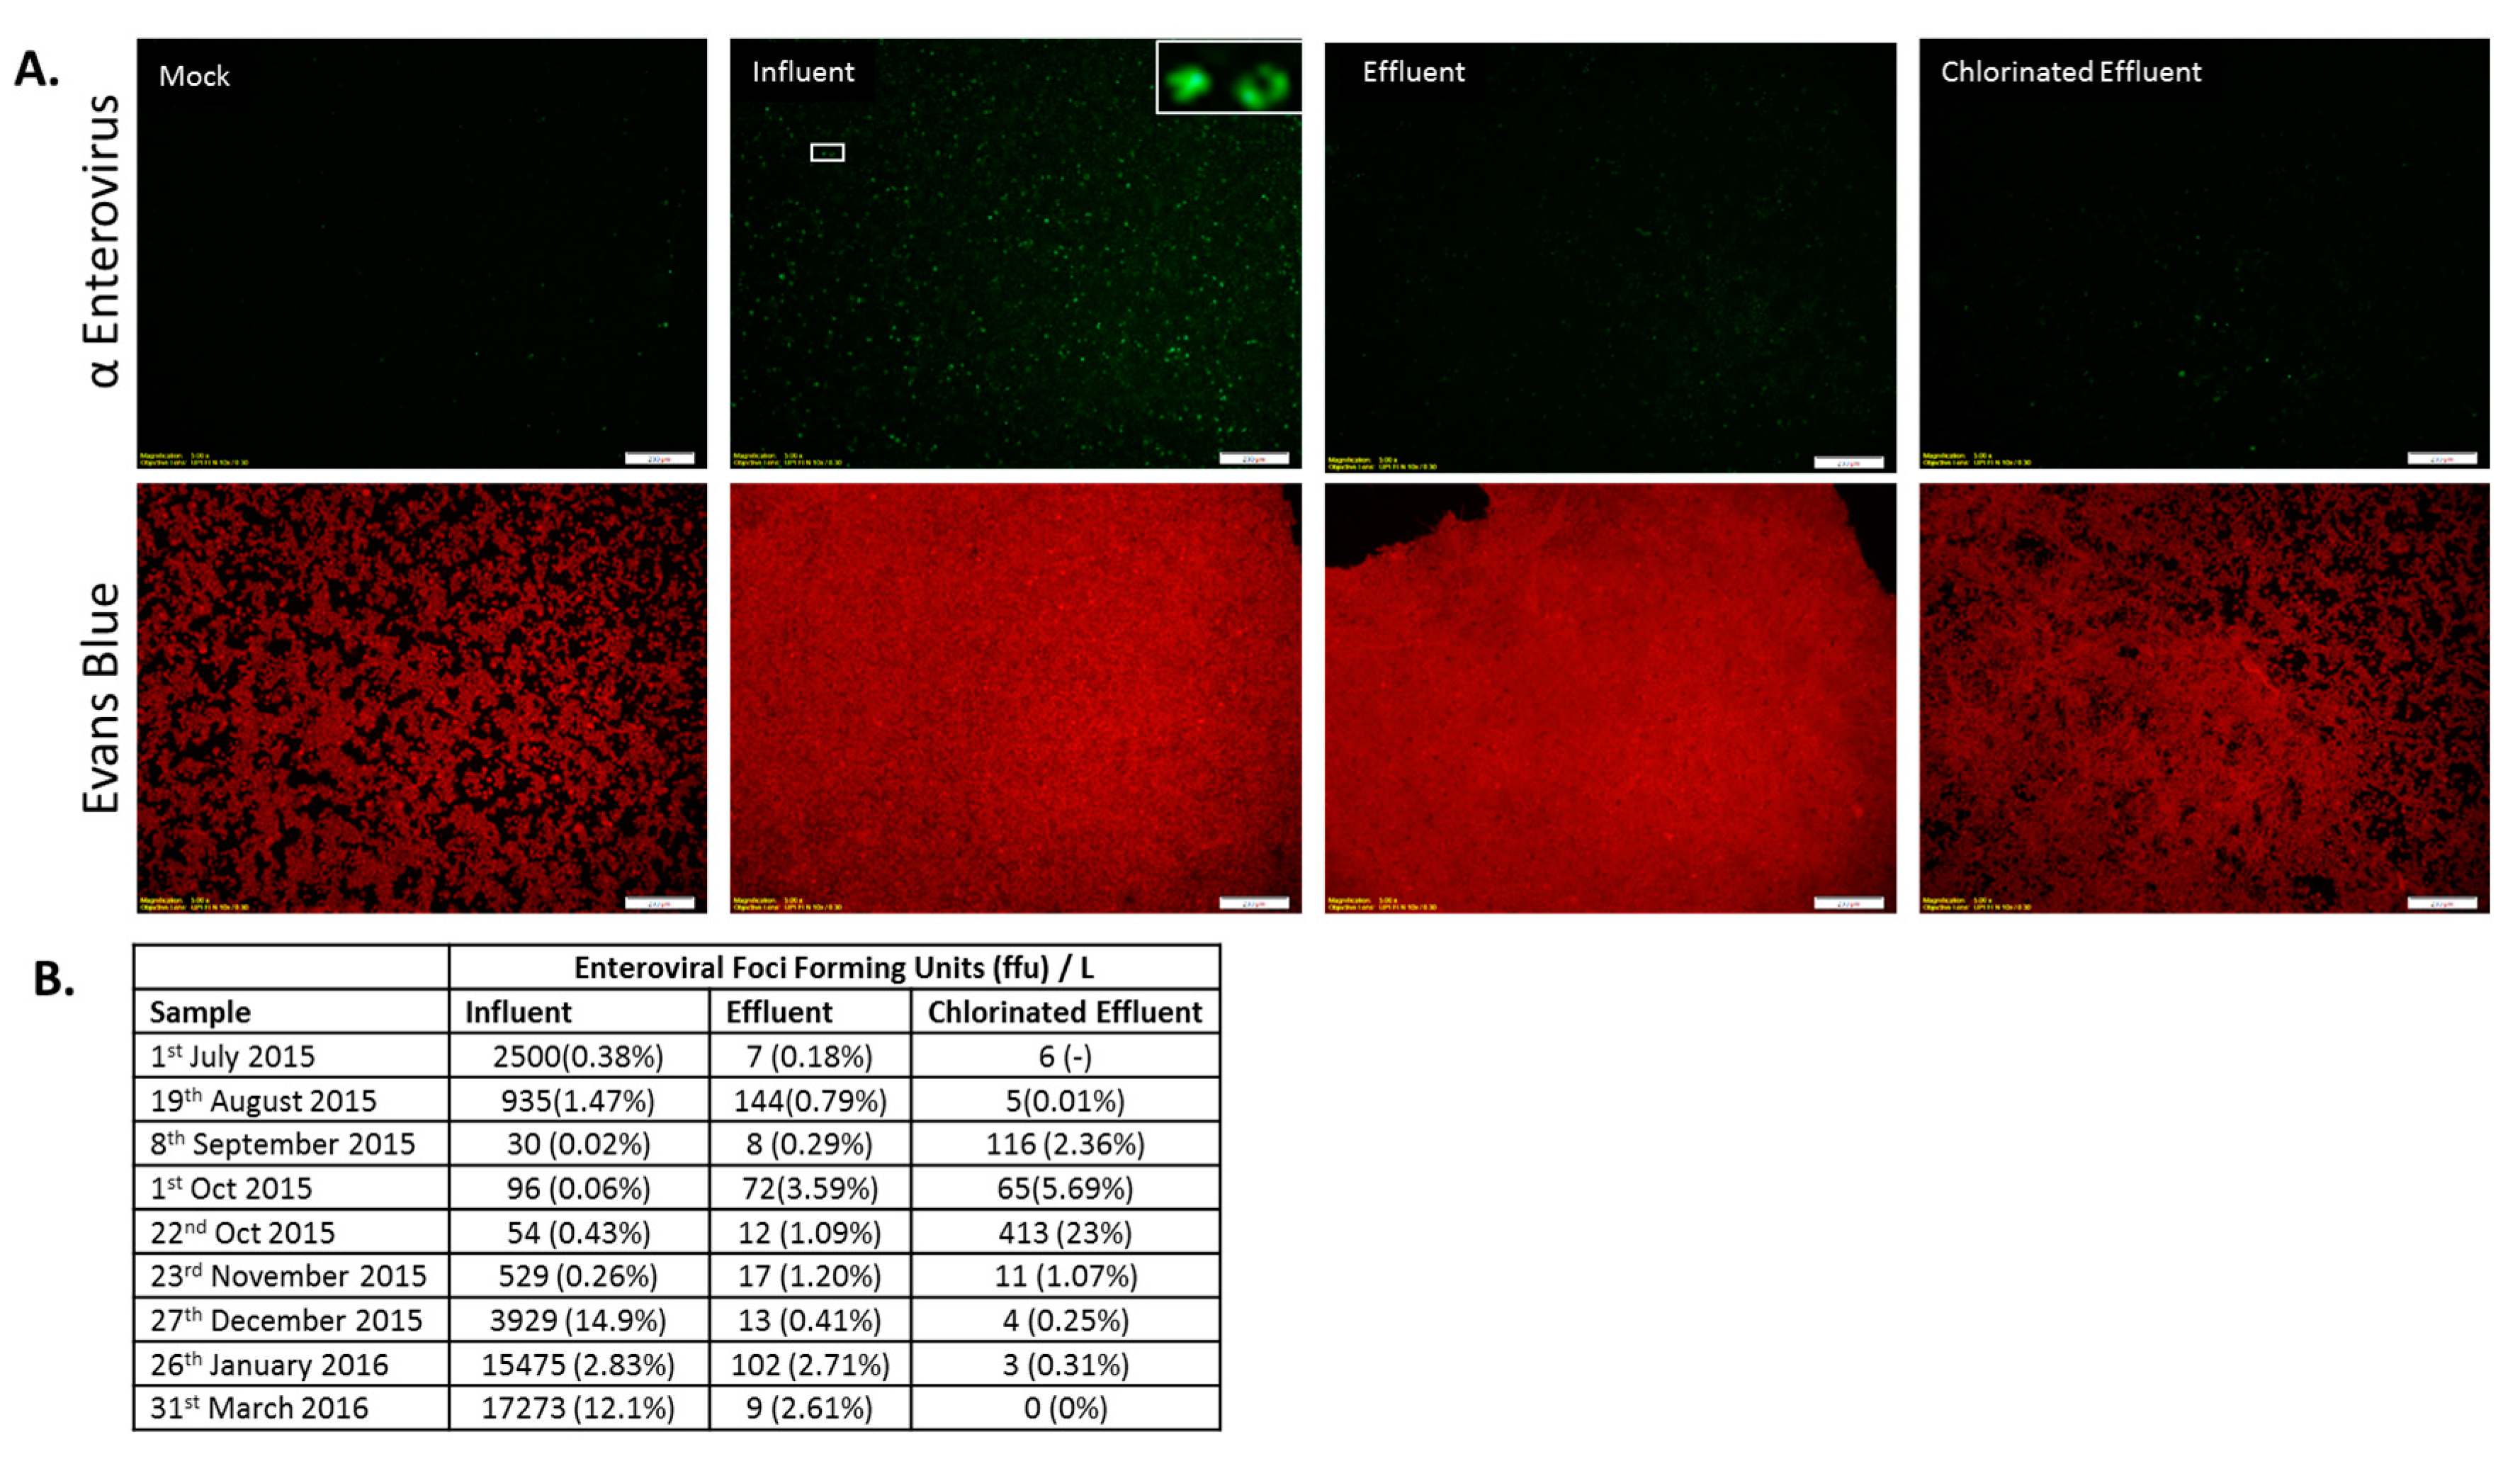
Infectious EV were detected in all wastewater samples except for the chlorinated effluent sample collected in March 2016 (Figure 5A). MBR was successful in reducing the infectious EV load (0.1 to 3.3-log) in samples collected in 1st October 2015 and March 2016. Chlorination reduced the effluent load of EV in March 2016 to undetectable levels and yielded a log reduction of 0.1–1.5 (July 2015, January 2016) for the rest of the sampling period, with the exception of September 2015 and 22nd October 2015, when the infectious EV load increased post-chlorination. The March 2016 sample showed all of the infectious EV were removed. The entire WWTP process reduced infectious EV by −0.6 to 3.7-log (September 2015, January 2016) (Figure 5B).
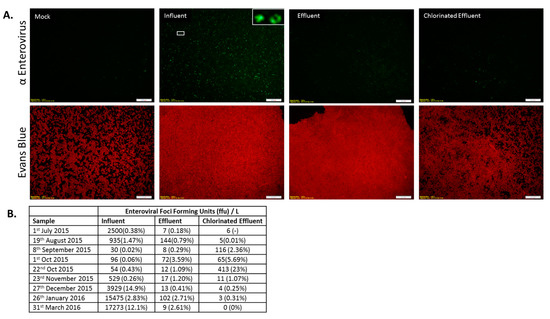
Figure 5.
Immunofluorescence assay of Enterovirus (EV) infection. (A) Epifluorescence images of HEp-2 cells inoculated with wastewater samples: Cells were either mock-infected (Mock) or inoculated with wastewater (Influent, Effluent, and Chlorinated Effluent). Cells were labeled with anti-pan enterovirus reagent blend, co-stained with FITC (upper panel) and Evans Blue (lower panel). Inset = magnified view of an AdV infected cell; (B) Average numbers of foci forming units (FFU) of EV in the original wastewater samples (n = 2). Numbers in brackets denote the percentage of infectious particles of total copy number detected by digital PCR.
Infectious AdV were detected in the sludge at average concentrations as low as 20 FFU/g in August 2015, and as high as 3200 FFU/g in 1 October 2015. Similarly, infectious EV were detected at the lowest average concentration in July 2015, and showed the highest average concentration of at 2000 FFU/g on 1 October 2015. Infectious AdV decreased post October 2015, remaining at higher concentrations than detected previously (Table 2).

Table 2.
Infectious AdV and EV titers of sludge samples.
3.5. Fecal Coliform Counts in Chlorinated Effluent
All samples have a coliform count lower than 2.2 CFU/100 mL and meet the maximum discharge requirement for unrestricted irrigation [1,2]. The coliform counts increased in the months experiencing a lower temperature (Table S2).
The Spearman’s rank correlation coefficient values (rs) between fecal coliform counts and AdV or EV in the chlorinated effluent were determined. The Spearman’s rank correlation value was 0.21 and 0.3, for AdV and EV, respectively, with fecal coliform counts. These values indicate a lack of strong correlation between the coliform counts to both AdV and EV copy numbers (n = 9, p > 0.05).
4. Discussion
The 9th Development Plan (2010–2014) for Saudi Arabia, following the Draft 2010 Saudi Water Act, provides a long-term strategy to achieve sustainable development in the Kingdom. In the Development Plan, reuse water is cited as a secure and sustainable alternate resource for a non-potable water supply. To improve reuse rates, one of the strategy goals is to develop and implement Best Management Practice (BMP) guidelines in wastewater treatment and reuse for protection of public health and the environment. Despite the effort to explore treated wastewater for reuse, Saudi Arabia currently has only limited guidance on LRV required for viruses in effluent intended for use in irrigation [2]. This study addresses stipulated needs of the 9th Development Plan (2010–2014) by employing both molecular and culture methods to assess removal efficiency of viral contaminants in wastewater by a local MBR-based WWTP.
To assess virus removal efficiency in a MBR wastewater treatment plant, influent, effluent, chlorinated effluent, and activated sludge were sampled over a 9-month period. Although Saudi Arabia is located in a hot arid region without severe winter temperatures, the sampling period spanned two seasons with temperature differences of approximately 10 °C (Table S1). Influent, effluent, and chlorinated effluent samples were concentrated by TFF. However, similar to other concentration methods, e.g., cesium chlorine ultracentrifugation, full recovery of particles in wastewater cannot be achieved by TFF. Studies have shown that different methods of viral purification result in different families being detected [24]. TFF has been chosen for this current study for its relatively high recovery rate and is common in studies involving wastewater, hence allowing for direct comparison between studies [25,26]. In this study, a 100 kDa membrane was used to concentrate particles smaller than 100 kDa in the retentate, and recovery efficiencies of spiked viruses ranged from 20% to 46% for AdV and 48–87% for EV across all samples (Text S2 and Table S6). These recovery efficiency assays were carried out in 50 mL of each wastewater sample. Carrying out these process controls in a smaller volume of sample may not be truly representative and is a limitation of this study.
Nevertheless, virome analysis revealed plant viruses were the predominant type of virus after bacteriophages, recovered from wastewater. Specifically, cucumber green mottle mosaic virus (CGMMV) and pepper mild mottle virus (PMMoV) were the most abundant plant viruses. Both viruses have been recovered from feces in densities of 109 virions per gram [27,28]. Notably, PMMoV has been identified as the dominant virus in municipal wastewater from a WWTP in Arizona, US [29]. The ubiquity of PMMoV throughout different geographical locations suggests this virus to be a potential marker for tracing anthropogenic contamination [27,30]. While it remains unclear whether plant viruses cause disease in humans [31], PMMoV recovered from food samples and human feces were shown to infect hypersensitive Nicotiana tabcum var Xanthi NN at a dose of 108 copies [30]. Compared to other viral species, both CGMMV and PMMoV were not removed by MBR completely (Figure S2), rather their molecular signatures were detected in high abundance in the final chlorinated post-MBR effluent. The prevalence of plant viruses in treated effluent can be potentially detrimental to crop health employed locally for agricultural irrigation. However, because members of the Virgaviridae family have previously been described as susceptible to 0.6% sodium hypochlorite [32], plant viruses are unlikely to be viable after chlorination.
Eight different viral families detected in the wastewater samples were potentially pathogenic to humans (Figure 2B). While more studies have to be carried out to determine if their pathogenicity persisted post treatment, 6 of those families (i.e., Adenoviridae, Picornaviridae, Parvovoridae, Astroviridae, Picornabviridae, and Polyomaviridae) have also been reported as potentially pathogenic viral families in raw sewage by another study [24]. However, the disparity in the number of pathogenic viruses detected could be due to the difference in geographic location, genetic-make up, diet, population sizes, and purification methods [24]. Furthermore, more viral families were noted in the Influent-Wash as compared to the Influent-Retentate (Figure 2). This could be due to the presence of unclarified, colloidal matter laden with adsorbed viral particles, which settled in the filter and are recovered only in the wash fraction. An increase in the number of families was also observed in the chlorinated effluent compared to the effluent. This increase could be attributed to three reasons; first, an increase in detection sensitivity after removal of more abundant viral families; second, an increase in viral RNA extraction efficiency in the chlorinated effluent; and third, less inhibitory effect in chlorinated effluent than effluent during the PCR amplification process.
Compared to plant viruses, human enteric viruses, e.g., AdV and EV, were detected only at very low numbers in the virome (Figure 2). The omics-based approach proved suitable for elucidating viral diversity but detection sensitivity can be compromised if the sequencing depth is insufficient to provide full coverage of diverse viromes in environmental samples. Results of an earlier study suggested omics-based sequencing provided lower detection sensitivity for EV compared to conventional RT-PCR [33]. Other studies have also shown that the concentrations of commonly used fecal indicators are not proportional to concentrations of other viruses (Table S2), hence direct quantification of AdV and EV was undertaken in this study [34]. In this study, with the use of dPCR having a detection sensitivity of ca. 13.5 copies/L for AdV and 64.7 copies/L for EV, abundance of both enteric viruses, as well as LRV achieved by MBR WWTP, could be determined. dPCR was employed as it allowed for absolute quantification, bypassing the need for standards. dPCR has also been shown to be more precise, sensitive, requires low amount of template, and has higher resolution than conventional real time quantitative PCR [35,36]. The results of this study showed that abundance of AdV and EV ranged from 3.5 × 10² ± 20 copies/L to 2.9 ± 1.2 × 10⁵ copies/L and 1.3 ± 0.1 × 10⁴ copies/L to 6.7 ± 1.9 × 10⁵ copies/L, respectively (Figure 3). Estimated abundance appeared to be in concordance with the range reported previously by other investigators. Myrmel and coworkers detected 105.8 to 106.2 genomic copies/L of AdV in a study conducted in Norway [37], while Kuo et al. detected approximately 3.8 ± 0.5 × 10⁵ viral particles per liter of raw sewage in Taiwan [38]. Similarly, EV concentrations ranged from 102.7 copies/L in a New Orleans, US study [39] and as high as 1.5 × 10⁵ to 1.2 × 10⁸ copies per L in an analysis done in Japan [3]. Similar to the findings from earlier studies [34,40], there was a lack of strong correlation between the abundance of fecal coliforms and human enteric viruses. This indicates the need to directly quantify the abundance of the various enteric viruses.
In this study, MBR was successful in reducing the AdV load by 1.7 to 4.8-log, in contrast to LRV of 0.3 to 2.7-log for EV. For both types of enteric viruses, there was at least one sample that the MBR process reduced the viral load to undetectable levels. LRVs achieved using a 0.4 µm microfiltration membrane were understandably lower than by 0.04 µm ultrafiltration membrane, as shown in an earlier study [41]. Two independent studies showed that UF membranes can achieve AdV reduction by 3.9 to 5.5-log [11], and by 4.1 to 6.3-log [42]. These LRVs achieved by UF membranes are therefore at least approximately 2-log higher than that reported in this study.
Higher LRV achieved for AdV, compared to EV, has been reported in earlier studies [10,43]. Reduction of virus in the treatment process derives mainly from three mechanisms: (i) viral decay in the activated sludge tank; (ii) membrane rejection imposed by size exclusion either due to pore size limitations or by biofilm layer; and (iii) adsorption onto mixed liquor suspended solids in the sludge or onto the biofilm matrix [3,11]. Of the three, membrane rejection is most effective for virus removal, while virus decay and MLSS attachment contribute only 1.1-log and 0.8-log AdV LRV [11]. Therefore, the higher LRV for AdV may be accounted for, in part, by the larger size of AdV (~90 nm) compared to EV (~40 nm). Monthly variations in the LRV as observed in Figure 3 may be due to different extent of membrane biofouling throughout the sampling period. It was found that as membranes fouled, removal rates for viral particles improved [41]. This may be due to direct size exclusion or due to adsorption of viral particles onto the extracellular matrix of fouled membranes [44]. Differences in surface charge and hydrophobicity of both viruses can also account for differences in removal rates by sludge [42]. Nevertheless, sludge contained high numbers of both EV and AdV in certain cases, higher than the influent. Sludge disposal in Saudi Arabia is poorly regulated and monitored. Most WWTPs in the Kingdom dispose of dewatered sludge as solid waste in landfills without stabilization and with viral contaminants potentially disseminating and contaminating shallow groundwater aquifers. This would be a concern if AdV and EV remain infectious.
Comparative analysis of decay kinetics for both AdV and EV has not yet been done. Thus, it is not known if AdV and EV treated wastewaters and sludge remain viable and infectious. An earlier virome analysis suggested genes related to DNA and RNA synthesis and replication remain abundant in wastewater and activated sludge [45]. Therefore, to monitor for infectivity of AdV and EV, assays were carried out in this study to enumerate infectious particles in the wastewater and sludge. In all tested sludge samples, infectious AdV and EV were detected, reiterating the need for proper stabilization of sludge prior to disposal. AdV were detected in effluent and chlorinated effluent by dPCR but none were infectious except for a single positive detection in the chlorinated effluent sample collected in December 2015. This observation demonstrates that PCR-based analysis relies on detection of small gene fragments and does not signify viability. The infectious AdV detected in the December 2015 chlorinated effluent sample required a longer incubation period to cause CPE in HEp-2 cells. In an earlier study, free chlorine treatment was shown to delay genome replication or earlier steps of the replication cycle, as well as late mRNA transcription [22], hence explaining the longer incubation period.
In contrast to AdV, infectious EV were detected throughout the wastewater treatment train, except for the chlorinated effluent sample collected in March 2016. A pig-model dose-response study determined that the required infectious dose to affect 50% of the tested population is 1.85 × 10² PFUs [46]. Hence, depending on duration of exposure, farmers may incur a substantial risk from EV over a prolonged period, particularly in certain months when chlorinated effluent contains an EV abundance of ca. 102 infectious particles (e.g., September and October 2015). On average, the MBR in the local WWTP reduced EV by 2.03-log. However, in certain instances, more infectious EV was detected in chlorinated effluent than effluent (Figure 5B). dPCR analysis indicated higher abundance of EV in chlorinated effluent than effluent in four of the sampling months (Figure 3B). The cause of the slight increase in EV in chlorinated effluent cannot be determined since free residual chlorine was monitored at least three times per day by plant operators and found to be maintained at 0.5 mg/L. However, because of the low discharge flow rate, chlorinated effluent was housed in the holding tank for up to 20 h and virus detected in the holding tank may have accumulated over time. Another explanation could be due to the way the samples were processed, where the chlorinated effluent was filtered first, while the other samples were held at 4 °C to avoid an additional freeze-thaw cycle which would affect viral viability. This might allow for degradation of viruses in the effluent and influent, and hence result in a slightly higher abundance of virus detected in the chlorinated effluent than effluent. This may result in an underestimation of the actual LRVs achieved by this local WWTP. Earlier studies showed that enteric viruses are stable in a wastewater matrix, especially at temperatures lower than 20 °C [47,48]. Therefore, the exact extent to which sample preservation procedures utilized in this study would affect viral counts remains unknown, and should be resolved in future studies. While this increase of viral particles in chlorinated effluent could be due to experimental design, it is interesting to note that each time more FFU were detected in the chlorinated effluent, it corresponds to an increased viral copy count in the chlorinated effluent, as detected by dPCR (Figure 3, Figure 4 and Figure 5). This observation indicates the robustness of the methods used and how their results complement each other.
Results of omics and dPCR methods further showed that the local submerged MBR-based WWTP was effective in reducing the load and diversity of viruses. Differences in AdV and EV LRV were observed but the overall LRV achieved by this local WWTP was comparable to that obtained by MBR-based WWTP in developed countries [10,11,42]. In most instances, MBR WWTPs did not achieve the USEPA-stipulated 5-log reduction in viruses from post-secondary treatment that would permit unrestricted use of recycled water in irrigation [4], nor achieve 12-log reduction in viruses for indirect potable reuse, as required in California, US [4]. Instead, most studies, including this one, demonstrate MBRs reliably provide approximately 3 to 4-log removal, with the exception of EV as monitored in this study, in which LRV consistently fell below 3-log reduction. Furthermore, culture-based assays showed AdV was inactivated by chlorine and degraded in the activated sludge. However, infectious EV was detected in the chlorinated effluent and occasionally in concentrations approximating its 50% infectious dose. These results and those of an earlier study identified antibiotic-resistant bacteria and associated resistance genes in chlorinated effluent [1], indicating a need to implement good management practices (e.g., wearing personal protective gear or clothing) when irrigating fields with treated wastewater in the local context. The presence of plant viruses in chlorinated effluent raises concerns about reuse in commercial agricultural irrigation. Infectivity assays using plant hosts are needed to verify whether plant viruses recovered from chlorinated post-MBR effluent can affect crop health. This study corroborates reduction in viral copy number to decreased infectious capacity of AdV and EV after WWTP. Although this study did not sample for concurrent replicate samples at each sampling event to evaluate for variability of virus measurements in identical samples, the findings suggest a significant decrease in infectious enteric virus numbers post MBR and chlorination achieved by a local WWTP throughout the 9-month sampling period, spanning two seasons. These findings support implementation of MBR technology to treat wastewater in a developing country prior to reuse. However, future assessment of treated water quality should include not only LRV-centric guidelines, but to also take into consideration infectious viral concentration. These complementary approaches would provide more comprehensive insights to the potential risk to public health by reuse.
Supplementary Materials
The following are available online at www.mdpi.com/2073-4441/9/7/534/s1, Text S1: Measurement of Nutrient content and COD, Text S2: Recovery efficiency of Tangential Flow Filtration (TFF), Text S3: Metagenomic sequence analysis via MetaGenID software (CosmosID), Text S4: Principle behind digital PCR, Text S5: Cell culture infection with sludge samples, Table S1: Average minimum and maximum temperatures in Saudi Arabia during the sampling period, Table S2: Coliform counts of the chlorinated effluent, Table S3: COD, NPOC and TN measurements of the wastewater samples collected in this study, Table S4: MLSS, Ammonium and Nitrate concentrations of wastewater samples, Table S5: Viral screening on HEK 293T, HeLa, HEp-2, Vero and MRC-5 cells, Table S6: Adenovirus and Enterovirus Recovery Efficiency of Tangential Flow Filtration (TFF), Figure S1: Heatmap of virus species detected by virome analysis of wastewater samples (excluding phages), Figure S2: “Observed versus Expected” Enterovirus (EV71) (blue line) and Adenovirus (AV40) (orange line).
Acknowledgments
The authors would like to thank George Princeton Dunsford for access to the KAUST wastewater treatment plant and Moustapha Harb for providing sampling assistance. The research reported in this publication was supported by the KAUST baseline funding BAS/1/1033-01-01 awarded to Pei-Ying Hong.
Author Contributions
Pei-Ying Hong and Muhammad Raihan Jumat conceived the research and wrote the manuscript. Muhammad Raihan Jumat carried out the laboratory experiments. Nur A. Hasan, Poorani Subramanian, and Colin Heberling analyzed the metagenomics data. Pei-Ying Hong, Muhammad Raihan Jumat, Nur A. Hasan, and Rita R. Colwell interpreted results. Rita R. Colwell and Nur A. Hasan assisted in writing the manuscript. All authors reviewed the manuscript.
Conflicts of Interest
The authors declare that the research was conducted in the absence of any commercial or financial relationships that could be construed as a potential conflict of interest.
References
- Al-Jassim, N.; Ansari, M.I.; Harb, M.; Hong, P.-Y. Removal of bacterial contaminants and antibiotic resistance genes by conventional wastewater treatment processes in Saudi Arabia: Is the treated wastewater safe to reuse for agricultural irrigation? Water Res. 2015, 73, 277–290. [Google Scholar] [CrossRef] [PubMed]
- Al-Jasser, A.O. Saudi wastewater reuse standards for agricultural irrigation: Riyadh treatment plants effluent compliance. J. King Saud Univ. Eng. Sci. 2011, 23, 1–8. [Google Scholar] [CrossRef]
- Miura, T.; Okabe, S.; Nakahara, Y.; Sano, D. Removal properties of human enteric viruses in a pilot-scale membrane bioreactor (MBR) process. Water Res. 2015, 75, 282–291. [Google Scholar] [CrossRef] [PubMed]
- California Code of Regulations. Water Recycling Criteria, Section 60301; California Department of Public Health: Sacramento, CA, USA, 2006.
- California Code of Regulations. Indirect Potable Reuse: Groundwater Replenishment—Surface Application, Section 60320; California Department of Public Health: Sacramento, CA, USA, 2014.
- Knipe, D.M.; Howley, P.M. Fields Virology, 6th ed.; Wolters Kluwer/Lippincott Williams & Wilkins Health: Philadelphia, PA, USA, 2013; p. 2. [Google Scholar]
- Jiang, S.; Dezfulian, H.; Chu, W. Real-time quantitative PCR for enteric adenovirus serotype 40 in environmental waters. Can. J. Microbiol. 2005, 51, 393–398. [Google Scholar] [CrossRef] [PubMed]
- Banerjee, A.; De, P.; Manna, B.; Chawla-Sarkar, M. Molecular characterization of enteric adenovirus genotypes 40 and 41 identified in children with acute gastroenteritis in kolkata, india during 2013–2014. J. Med. Virol. 2016, 89, 606–614. [Google Scholar] [CrossRef] [PubMed]
- Wang, J.; Pu, J.; Liu, L.; Che, Y.; Liao, Y.; Wang, L.; Guo, L.; Feng, M.; Liang, Y.; Fan, S.; et al. Clinical and associated immunological manifestations of HFMD caused by different viral infections in children. Glob. Pediatr. Health 2016, 3. [Google Scholar] [CrossRef] [PubMed]
- Francy, D.S.; Stelzer, E.A.; Bushon, R.N.; Brady, A.M.; Williston, A.G.; Riddell, K.R.; Borchardt, M.A.; Spencer, S.K.; Gellner, T.M. Comparative effectiveness of membrane bioreactors, conventional secondary treatment, and chlorine and UV disinfection to remove microorganisms from municipal wastewaters. Water Res. 2012, 46, 4164–4178. [Google Scholar] [CrossRef] [PubMed]
- Chaudhry, R.M.; Nelson, K.L.; Drewes, J.E. Mechanisms of pathogenic virus removal in a full-scale membrane bioreactor. Environ. Sci. Technol. 2015, 49, 2815–2822. [Google Scholar] [CrossRef] [PubMed]
- Nascimento, M.A.; Magri, M.E.; Schissi, C.D.; Barardi, C.R. Recombinant adenovirus as a model to evaluate the efficiency of free chlorine disinfection in filtered water samples. Virol. J. 2015, 12. [Google Scholar] [CrossRef] [PubMed]
- Hewitt, J.; Leonard, M.; Greening, G.E.; Lewis, G.D. Influence of wastewater treatment process and the population size on human virus profiles in wastewater. Water Res. 2011, 45, 6267–6276. [Google Scholar] [CrossRef] [PubMed]
- Kavli Institute for Cosmological Physics (KICP). The Kaust Industry Collaboration Program (Kicp) Annual Strategic Study—Promoting Wastewater Reclamation and Reuse in the Kingdom of Saudi Arabia: Technology Trends, Innovation Needs, and Business Opportunities; KICP: Chicago, IL, USA, 2010. [Google Scholar]
- National Risk Management Research Lab, Office of Research and Development; Agency for International Development; Environmental Protection Agency; Office of Wastewater Management. Guidelines for Water Reuse, 2012; U.S. EPA: Washington, DC, USA, 2012.
- Cromeans, T.L.; Kahler, A.M.; Hill, V.R. Inactivation of adenoviruses, enteroviruses, and murine norovirus in water by free chlorine and monochloramine. Appl. Environ. Microbiol. 2010, 76, 1028–1033. [Google Scholar] [CrossRef] [PubMed]
- Subramanian, S.; Altaras, G.M.; Chen, J.; Hughes, B.S.; Zhou, W.; Altaras, N.E. Pilot-scale adenovirus seed production through concurrent virus release and concentration by hollow fiber filtration. Biotechnol. Prog. 2005, 21, 851–859. [Google Scholar] [CrossRef] [PubMed]
- Grzenia, D.L.; Carlson, J.O.; Wickramasinghe, S.R. Tangential flow filtration for virus purification. J. Membr. Sci. 2008, 321, 373–380. [Google Scholar] [CrossRef]
- Hasan, N.A.; Young, B.A.; Minard-Smith, A.T.; Saeed, K.; Li, H.; Heizer, E.M.; McMillan, N.J.; Isom, R.; Abdullah, A.S.; Bornman, D.M.; et al. Microbial community profiling of human saliva using shotgun metagenomic sequencing. PLoS ONE 2014, 9. [Google Scholar] [CrossRef] [PubMed]
- Heim, A.; Ebnet, C.; Harste, G.; Pring-Akerblom, P. Rapid and quantitative detection of human adenovirus DNA by real-time PCR. J. Med. Virol. 2003, 70, 228–239. [Google Scholar] [CrossRef] [PubMed]
- Puig, M.; Jofre, J.; Lucena, F.; Allard, A.; Wadell, G.; Girones, R. Detection of adenoviruses and enteroviruses in polluted waters by nested pcr amplification. Appl. Environ. Microbiol. 1994, 60, 2963–2970. [Google Scholar] [PubMed]
- Gall, A.M.; Shisler, J.L.; Mariñas, B.J. Analysis of the viral replication cycle of adenovirus serotype 2 after inactivation by free chlorine. Environ. Sci. Technol. 2015, 49, 4584–4590. [Google Scholar] [CrossRef] [PubMed]
- Hundesa, A.; Maluquer de Motes, C.; Bofill-Mas, S.; Albinana-Gimenez, N.; Girones, R. Identification of human and animal adenoviruses and polyomaviruses for determination of sources of fecal contamination in the environment. Appl. Environ. Microbiol. 2006, 72, 7886–7893. [Google Scholar] [CrossRef] [PubMed]
- Hjelmso, M.H.; Hellmer, M.; Fernandez-Cassi, X.; Timoneda, N.; Lukjancenko, O.; Seidel, M.; Elsasser, D.; Aarestrup, F.M.; Lofstrom, C.; Bofill-Mas, S.; et al. Evaluation of methods for the concentration and extraction of viruses from sewage in the context of metagenomic sequencing. PLoS ONE 2017, 12, e0170199. [Google Scholar] [CrossRef] [PubMed]
- Sun, G.; Xiao, J.; Wang, H.; Gong, C.; Pan, Y.; Yan, S.; Wang, Y. Efficient purification and concentration of viruses from a large body of high turbidity seawater. MethodsX 2014, 1, 197–206. [Google Scholar] [CrossRef] [PubMed]
- Cai, L.; Yang, Y.; Jiao, N.; Zhang, R. Evaluation of tangential flow filtration for the concentration and separation of bacteria and viruses in contrasting marine environments. PLoS ONE 2015, 10, e0136741. [Google Scholar] [CrossRef] [PubMed]
- Zhang, T.; Breitbart, M.; Lee, W.H.; Run, J.Q.; Wei, C.L.; Soh, S.W.; Hibberd, M.L.; Liu, E.T.; Rohwer, F.; Ruan, Y. RNA viral community in human feces: Prevalence of plant pathogenic viruses. PLoS Biol. 2006, 4, e3. [Google Scholar] [CrossRef] [PubMed]
- Cotten, M.; Oude Munnink, B.; Canuti, M.; Deijs, M.; Watson, S.J.; Kellam, P.; van der Hoek, L. Full genome virus detection in fecal samples using sensitive nucleic acid preparation, deep sequencing, and a novel iterative sequence classification algorithm. PLoS ONE 2014, 9, e93269. [Google Scholar] [CrossRef] [PubMed]
- Kitajima, M.; Iker, B.C.; Pepper, I.L.; Gerba, C.P. Relative abundance and treatment reduction of viruses during wastewater treatment processes—Identification of potential viral indicators. Sci. Total Environ. 2014, 488, 290–296. [Google Scholar] [CrossRef] [PubMed]
- Colson, P.; Richet, H.; Desnues, C.; Balique, F.; Moal, V.; Grob, J.-J.; Berbis, P.; Lecoq, H.; Harlé, J.-R.; Berland, Y.; et al. Pepper mild mottle virus, a plant virus associated with specific immune responses, fever, abdominal pains, and pruritus in humans. PLoS ONE 2010, 5. [Google Scholar] [CrossRef] [PubMed]
- Mandal, B.; Jain, R.K. Can plant virus infect human being? Indian J. Virol. 2010, 21, 92–93. [Google Scholar] [CrossRef] [PubMed]
- Lewandowski, D.J.; Hayes, A.J.; Adkins, S. Surprising results from a search for effective disinfectants for tobacco mosaic virus–contaminated tools. Plant Dis. 2010, 94, 542–550. [Google Scholar] [CrossRef]
- Prachayangprecha, S.; Schapendonk, C.M.; Koopmans, M.P.; Osterhaus, A.D.; Schurch, A.C.; Pas, S.D.; Van der Eijk, A.A.; Poovorawan, Y.; Haagmans, B.L.; Smits, S.L. Exploring the potential of next-generation sequencing in detection of respiratory viruses. J. Clin. Microbiol. 2014, 52, 3722–3730. [Google Scholar] [CrossRef] [PubMed]
- Liang, L.; Goh, S.G.; Vergara, G.G.R.V.; Fang, H.M.; Rezaeinejad, S.; Chang, S.Y.; Bayen, S.; Lee, W.A.; Sobsey, M.D.; Rose, J.B.; et al. Alternative fecal indicators and their empirical relationships with enteric viruses, salmonella enterica, and pseudomonas aeruginosa in surface waters of a tropical urban catchment. Appl. Environ. Microbiol. 2015, 81, 850–860. [Google Scholar] [CrossRef] [PubMed]
- Day, E.; Dear, P.H.; McCaughan, F. Digital PCR strategies in the development and analysis of molecular biomarkers for personalized medicine. Methods 2013, 59, 101–107. [Google Scholar] [CrossRef] [PubMed]
- Hall Sedlak, R.; Jerome, K.R. The potential advantages of digital PCR for clinical virology diagnostics. Expert Rev. Mol. Diagn. 2014, 14, 501–507. [Google Scholar] [CrossRef] [PubMed]
- Myrmel, M.; Lange, H.; Rimstad, E. A 1-year quantitative survey of noro-, adeno-, human boca-, and hepatitis e viruses in raw and secondarily treated sewage from two plants in norway. Food Environ. Virol. 2015, 7, 213–223. [Google Scholar] [CrossRef] [PubMed]
- Kuo, H.W.; Chen, L.Z.; Shih, M.H. High prevalence of type 41 and high sequence diversity of partial hexon gene of human adenoviruses in municipal raw sewage and activated sludge. J. Appl. Microbiol. 2015, 119, 1181–1195. [Google Scholar] [CrossRef] [PubMed]
- Montazeri, N.; Goettert, D.; Achberger, E.C.; Johnson, C.N.; Prinyawiwatkul, W.; Janes, M.E. Pathogenic enteric viruses and microbial indicators during secondary treatment of municipal wastewater. Appl. Environ. Microbiol. 2015, 81, 6436–6445. [Google Scholar] [CrossRef] [PubMed]
- Ottoson, J.; Hansen, A.; Westrell, T.; Johansen, K.; Norder, H.; Stenstrom, T.A. Removal of noro- and enteroviruses, giardia cysts, cryptosporidium oocysts, and fecal indicators at four secondary wastewater treatment plants in sweden. Water Environ. Res. 2006, 78, 828–834. [Google Scholar] [CrossRef] [PubMed]
- Farahbakhsh, K.; Smith, D.W. Removal of coliphages in secondary effluent by microfiltration-mechanisms of removal and impact of operating parameters. Water Res. 2004, 38, 585–592. [Google Scholar] [CrossRef] [PubMed]
- Simmons, F.J.; Kuo, D.H.; Xagoraraki, I. Removal of human enteric viruses by a full-scale membrane bioreactor during municipal wastewater processing. Water Res. 2011, 45, 2739–2750. [Google Scholar] [CrossRef] [PubMed]
- La Rosa, G.; Pourshaban, M.; Iaconelli, M.; Muscillo, M. Quantitative real-time PCR of enteric viruses in influent and effluent samples from wastewater treatment plants in Italy. Annali dell’Istituto Superiore di Sanita 2010, 46, 266–273. [Google Scholar] [PubMed]
- Lu, R.; Mosiman, D.; Nguyen, T.H. Mechanisms of MS2 bacteriophage removal by fouled ultrafiltration membrane subjected to different cleaning methods. Environ. Sci. Technol. 2013, 47, 13422–13429. [Google Scholar] [CrossRef] [PubMed]
- Tamaki, H.; Zhang, R.; Angly, F.E.; Nakamura, S.; Hong, P.Y.; Yasunaga, T.; Kamagata, Y.; Liu, W.T. Metagenomic analysis of DNA viruses in a wastewater treatment plant in tropical climate. Environ. Microbiol. 2012, 14, 441–452. [Google Scholar] [CrossRef] [PubMed]
- Cliver, D.O. Experimental infection by waterborne enteroviruses. J. Food Prot. 1981, 44, 861–865. [Google Scholar] [CrossRef]
- Bofill-Mas, S.; Albinana-Gimenez, N.; Clemente-Casares, P.; Hundesa, A.; Rodriguez-Manzano, J.; Allard, A.; Calvo, M.; Girones, R. Quantification and stability of human adenoviruses and polyomavirus JCPyV in wastewater matrices. Appl. Environ. Microbiol. 2006, 72, 7894–7896. [Google Scholar] [CrossRef] [PubMed]
- Sobsey, M.D.; Meschke, J.S. Virus Survival in the Environment with Special Attention to Survival in Sewage Droplets and Other Environmental Media of Fecal or Respiratory Origin; World Health Organization: Geneva, Switzerland, 2003; Volume 70, Available online: http://www.unc.edu/courses/2008spring/envr/421/001/WHO_VirusSurvivalReport_21Aug2003.pdf (accessed on 7 July 2017).
© 2017 by the authors. Licensee MDPI, Basel, Switzerland. This article is an open access article distributed under the terms and conditions of the Creative Commons Attribution (CC BY) license (http://creativecommons.org/licenses/by/4.0/).


