Abstract
Abatement of sulfides in sewer systems using iron salts is a widely used strategy. When dosing at the end of a pumping main, the reaction kinetics of sulfide precipitation becomes important. Traditionally the reaction has been assumed to be rapid or even instantaneous. This work shows that this is not the case for sulfide precipitation by ferric iron. Instead, the reaction time was found to be on a timescale where it must be considered when performing end-of-pipe treatment. For real wastewaters at pH 7, a stoichiometric ratio around 14 mol Fe(II) (mol S(−II))−1 was obtained after 1.5 s, while the ratio dropped to about 5 mol Fe(II) (mol S(−II))−1 after 30 s. Equilibrium calculations yielded a theoretic ratio of 2 mol Fe(II) (mol S(−II))−1, indicating that the process had not equilibrated within the span of the experiment. Correspondingly, the highest sulfide conversion only reached 60%. These findings differed significantly from what has been demonstrated in previous studies and what is attained from theoretical equilibrium conditions.
1. Introduction
Biogenic sulfide formation in sewers is directly related to problems such as corrosion of sewer assets, health impacts, and malodors [1]. Sulfide is formed in submerged biofilms, and the formation requires anaerobic conditions, which are found in all parts of the network. Pumping mains are typically sulfide formation hotspots and, in temperate climates, sulfide generation is almost solely related to these parts of the network [2].
A common and well-documented practice to manage sulfide related problems is addition of iron salts. Ferrous iron (Fe2+) reacts with sulfide (S2−) and precipitates as ferrous sulfide (FeS) [3,4]. The low solubility constant of ferrous sulfide (3.7 × 10⁻¹⁹ g·mol2·L−2 at 18 °C) implies that this method should be very effective, and it is unlikely that sulfides will be released back into solution after the precipitate has formed [4,5].
According to [6], addition of iron salts is the most common method used worldwide for abatement of sulfide in wastewater. This was also the finding from a more recent survey performed in Australia on methods applied for chemical sulfide control [7]. However, when applying iron salts for sulfide control in pumping mains, there are several challenges to consider.
Due to practical issues, such as available space for storage of chemicals and access to mains power, the dosing point is most often positioned at the start of the pumping main. This necessitates that the amount of iron added must correspond to the amount of sulfide that later will be generated in the pumping main during transport. However, on a short time scale, wastewater flows and characteristics can be highly variable and unpredictable, and many wastewater characteristics change on the time scale of minutes [8]. The result is that retention time in the pumping main, concentration of biodegradable matter, pH, etc. of the wastewater varies substantially. All of these parameters influence sulfide formation [2], and their high variability and inherent unpredictability makes it impossible to consistently add the correct amount of iron to a specific wastewater plug. Further difficulties occur when start-of-pipe treatment is used for branched pressurized sewer systems. These systems are, for example, used to collect wastewater from dispersed houses in the countryside. Due to the hydraulics of the system, wastewater from side branches does not get mixed into the wastewater of the main pipe, but continues herein as distinctive plugs. Treating only the flow in the main pipe with iron will not have the desired effect, and treatment would be needed at each and every of the many pumping stations in the network.
Injection at the start of a pumping main is still the most common strategy for iron dosing. In many practical applications, however, injection at the end of the main can be the only practical solution. Additionally, it offers the benefit of potentially knowing exactly how much sulfide was formed and hence must be managed. At the end of a main, it is in principle possible to measure the sulfide formed in the upstream pipe, and inject iron or other chemicals at the optimum dosage rate. End-of-pipe treatment using nitrate was shown to be possible by [9,10], and that dosage could be optimized compared to the conventional start-of-pipe strategy.
Injecting iron at the end of a pipe entails that the rate of the precipitation reaction must be sufficiently fast to ensure all hydrogen sulfide is precipitated when the sewage depressurizes and releases unreacted H2S into the headspace. Ferrous iron is preferred over ferric iron, as precipitation of ferric iron with sulfide might not be a significant process under sewer conditions [2,11]. While ferric iron can precipitate with sulfide, this process is comparatively slow, and sulfide precipitation might depend on a biological reduction to ferrous iron, which might simultaneously oxidize sulfide [12]. The biologically formed ferrous iron can then precipitate with sulfide [6]. Ferrous iron (Fe2+) reacts with bisulfide (HS−) to produce ferrous sulfide (FeS) as shown in Equation (1):
Ferrous sulfide precipitation in pure water has been reported to occur with fast kinetics, and the process is often assumed to equilibrate within seconds [13,14]. For the reaction rates in wastewater, the literature gives no conclusive answer. Even though the stoichiometry of ferrous sulfide formation has been extensively studied for decades (e.g. [3,11,15]), the exact kinetics of sulfide precipitation with ferrous iron is not known [2]. Some authors state that the precipitation process is rapid without being more specific [16]. On the contrary, it was found that ferrous sulfide formation because of ferric chloride addition to anaerobic wastewater continued for a few hours [12]. Even though it has been stated that the initial reduction of ferric iron to ferrous iron was quick the subsequent kinetics of the ferrous sulfide formation were not specified. Furthermore, most of the experiments reported on sulfide precipitation using ferrous iron do not specify the exact time allowed for the chemical reaction before analysis. Those who did, reported times of 10–40 min [6,11,15]. However, these previous studies did not state the conversion of the reaction.
The reaction rates at short reaction times is not well understood, which can cause problems when performing end-of-pipe abatement of sulfide, as described previously. In the present work, the short-term reaction of ferrous sulfide precipitation is investigated in buffered water and wastewater by measuring stoichiometric ratios of sulfide precipitation at 1.5 and 30 s, to give an estimate of the minimum time needed for sulfide precipitation in practical applications. The measured stoichiometric ratios and conversions, i.e. how much sulfide had reacted with iron within the tested reaction times, are compared to the results of the precipitation process, as predicted by a theoretically determined chemical equilibrium.
2. Materials and Methods
Stoichiometry was studied by mixing iron solutions into waters containing sulfides in a plug-flow reactor and measuring the aqueous H2S-concentration after 1.5 and 30 s of reaction time. The 1.5 s was chosen to reveal whether precipitation from a practical H2S management point of view could be seen as nearly instantaneous, while 30 s was chosen to confirm or reject that equilibrium of the reaction was reached after the 1.5 s. H2S was measured applying an amperometric sensor with a response time of approximate 5 s. To ensure that the sensor response time did not affect the measurements, a continuous plug-flow system was designed where the desired reaction time in a plug equaled the travel time from the point of mixing to the position of the sensor. Two types of experiments were conducted: One addressing the influence of pH and one where the differences between different wastewaters was tested.
2.1. Continuous Flow System
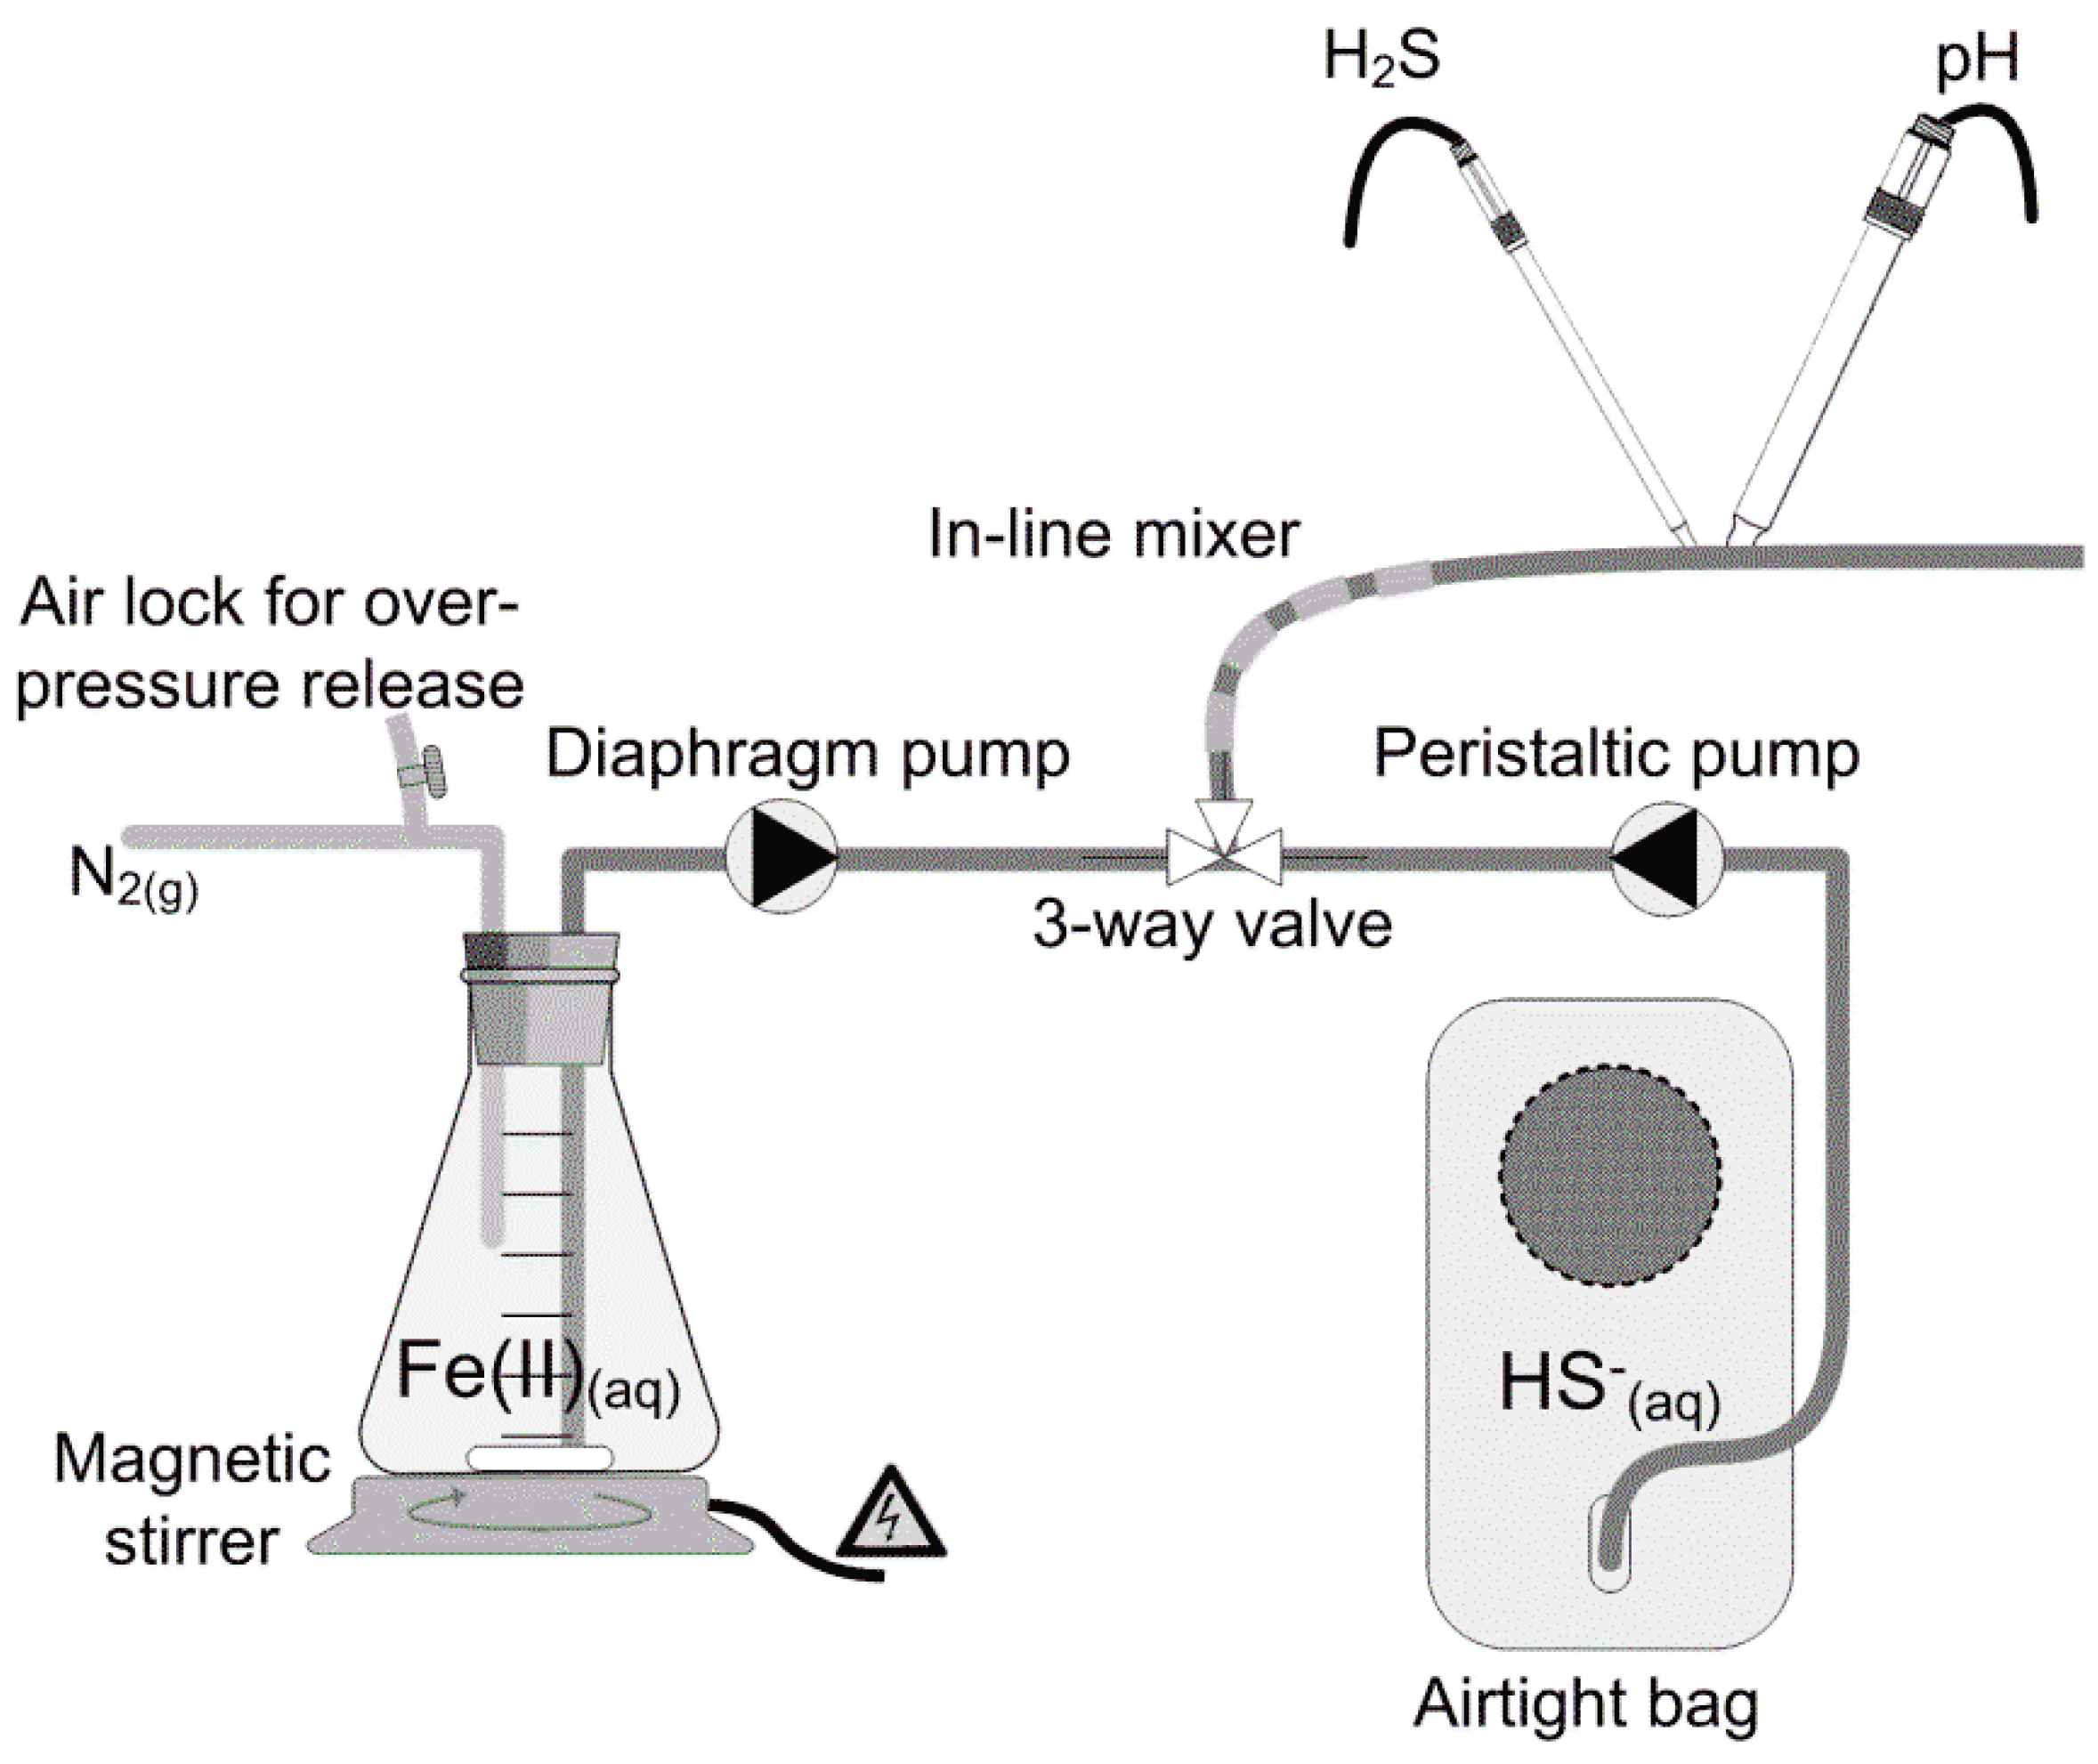
The continuous plug-flow system allowed stable precipitation conditions down to a reaction time of 1.5 s. The setup consisted of a compressible reservoir for the liquid holding sulfide and a flask for holding the iron stock solution (Figure 1). The liquids were pumped separately into a three-way valve followed by an in-line static mixer where mixing occurred rapidly. A Clark type sensor measuring aqueous H2S was placed at a set distance from the junction, allowing the two reaction times to be obtained. pH was measured continuously just next to the sulfide sensor. The H2S sensor was a Unisense Sulfide Gas Minisensor 500 µm (H2S-500) coupled to a Unisense Multimeter (Unisense A/S, Aarhus, Denmark). H2S concentrations could be converted to dissolved sulfide concentrations applying measured pH. For the latter, a Radiometer Analytical PHC2001-8 Combination Red-Rod pH Electrode coupled with a Radiometer Analytical PHM210 standard pH meter, MeterLab® (Radiometer Analytical SAS, Villeurbanne Cedex, France) was used together with a proprietary data acquisition program for the setup. Prior to use, sensors were calibrated as described in the manuals.
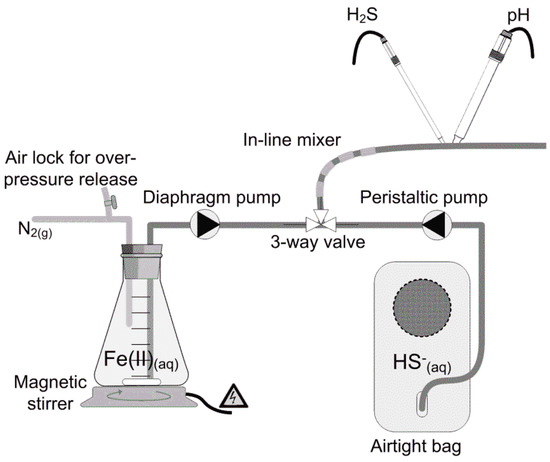
Figure 1.
Experimental setup for measurement of sulfide precipitation with ferrous iron. Sulfide and iron solutions were pumped in separate lines to a mixing point and injected to the reaction tubing where sulfide and pH were measured online. The reaction time of the precipitation reaction was altered by varying the length of the reaction tube.
The liquid holding sulfide was fed by a Masterflex L/S 100 rpm peristaltic pump equipped with a Masterflex L/S Easy-Load II Head (Cole&Parmer, Vernon Hills, Illinois, US) running at a high speed, to yield as equal a flow in the setup as possible. To mimic a dosing situation in real sewer system applications, the ferrous iron stock was dosed at a small flow (13 mL·h−1) compared to the liquid holding the sulfide (2532 mL·h−1), using a DDC 6-10 digital dosing diaphragm pump mounted with a multifunction valve (Grundfos A/S, Bjerringbro, Denmark). The digital dosing diaphragm pump is characterized by having a fast and short suction stroke, followed by a long discharge stroke. However, even though the suction stroke was short, the abruption in ferrous iron supply could be seen on the measured dissolved sulfide levels. These parts of the time series were omitted from the sulfide and pH measurements.
To minimize oxygen ingress into the system, liquids were conveyed in Masterflex Tygon® (Vernon Hills, Illinois, US) chemical tubing (internal diameter 3 mm). Prior to the experiments, oxygen ingress was measured and found to be negligible over the course of the experiments. The pump rate, in combination with the distance between the three-way valve and the sensors, determined the specific reaction time of sulfide precipitation, and the stoichiometry could then be determined from the measured dissolved sulfide. A magnetic stirrer kept the ferrous iron stock mixed. To avoid oxidation to ferric iron, the stock was kept under a nitrogen atmosphere.
The sulfide solution was prepared in an airtight bag prior to use by dissolving di-sodium sulfide crystals (Na2S·9H2O) directly in deoxygenated buffered water or wastewater. Deoxygenation was done by flushing with high-purity nitrogen gas (5.0). A PreSens Fibox 3 fiber optic oxygen meter and an oxygen sensitive optode (PreSens GmbH, Regensburg, Germany) were used to certify oxygen-free conditions. After addition of di-sodium sulfide (to concentrations between 168–299 µM), the headspace of the bag was evacuated, sealed, and pH was subsequently adjusted. The ferrous iron stock (99 mM) was prepared freshly by dissolving anhydrous ferrous chloride (FeCl2) in 2 mM deoxygenated HCl. Ferrous iron and sulfide were mixed in the three-way valve at a constant flow ratio of 1:195.
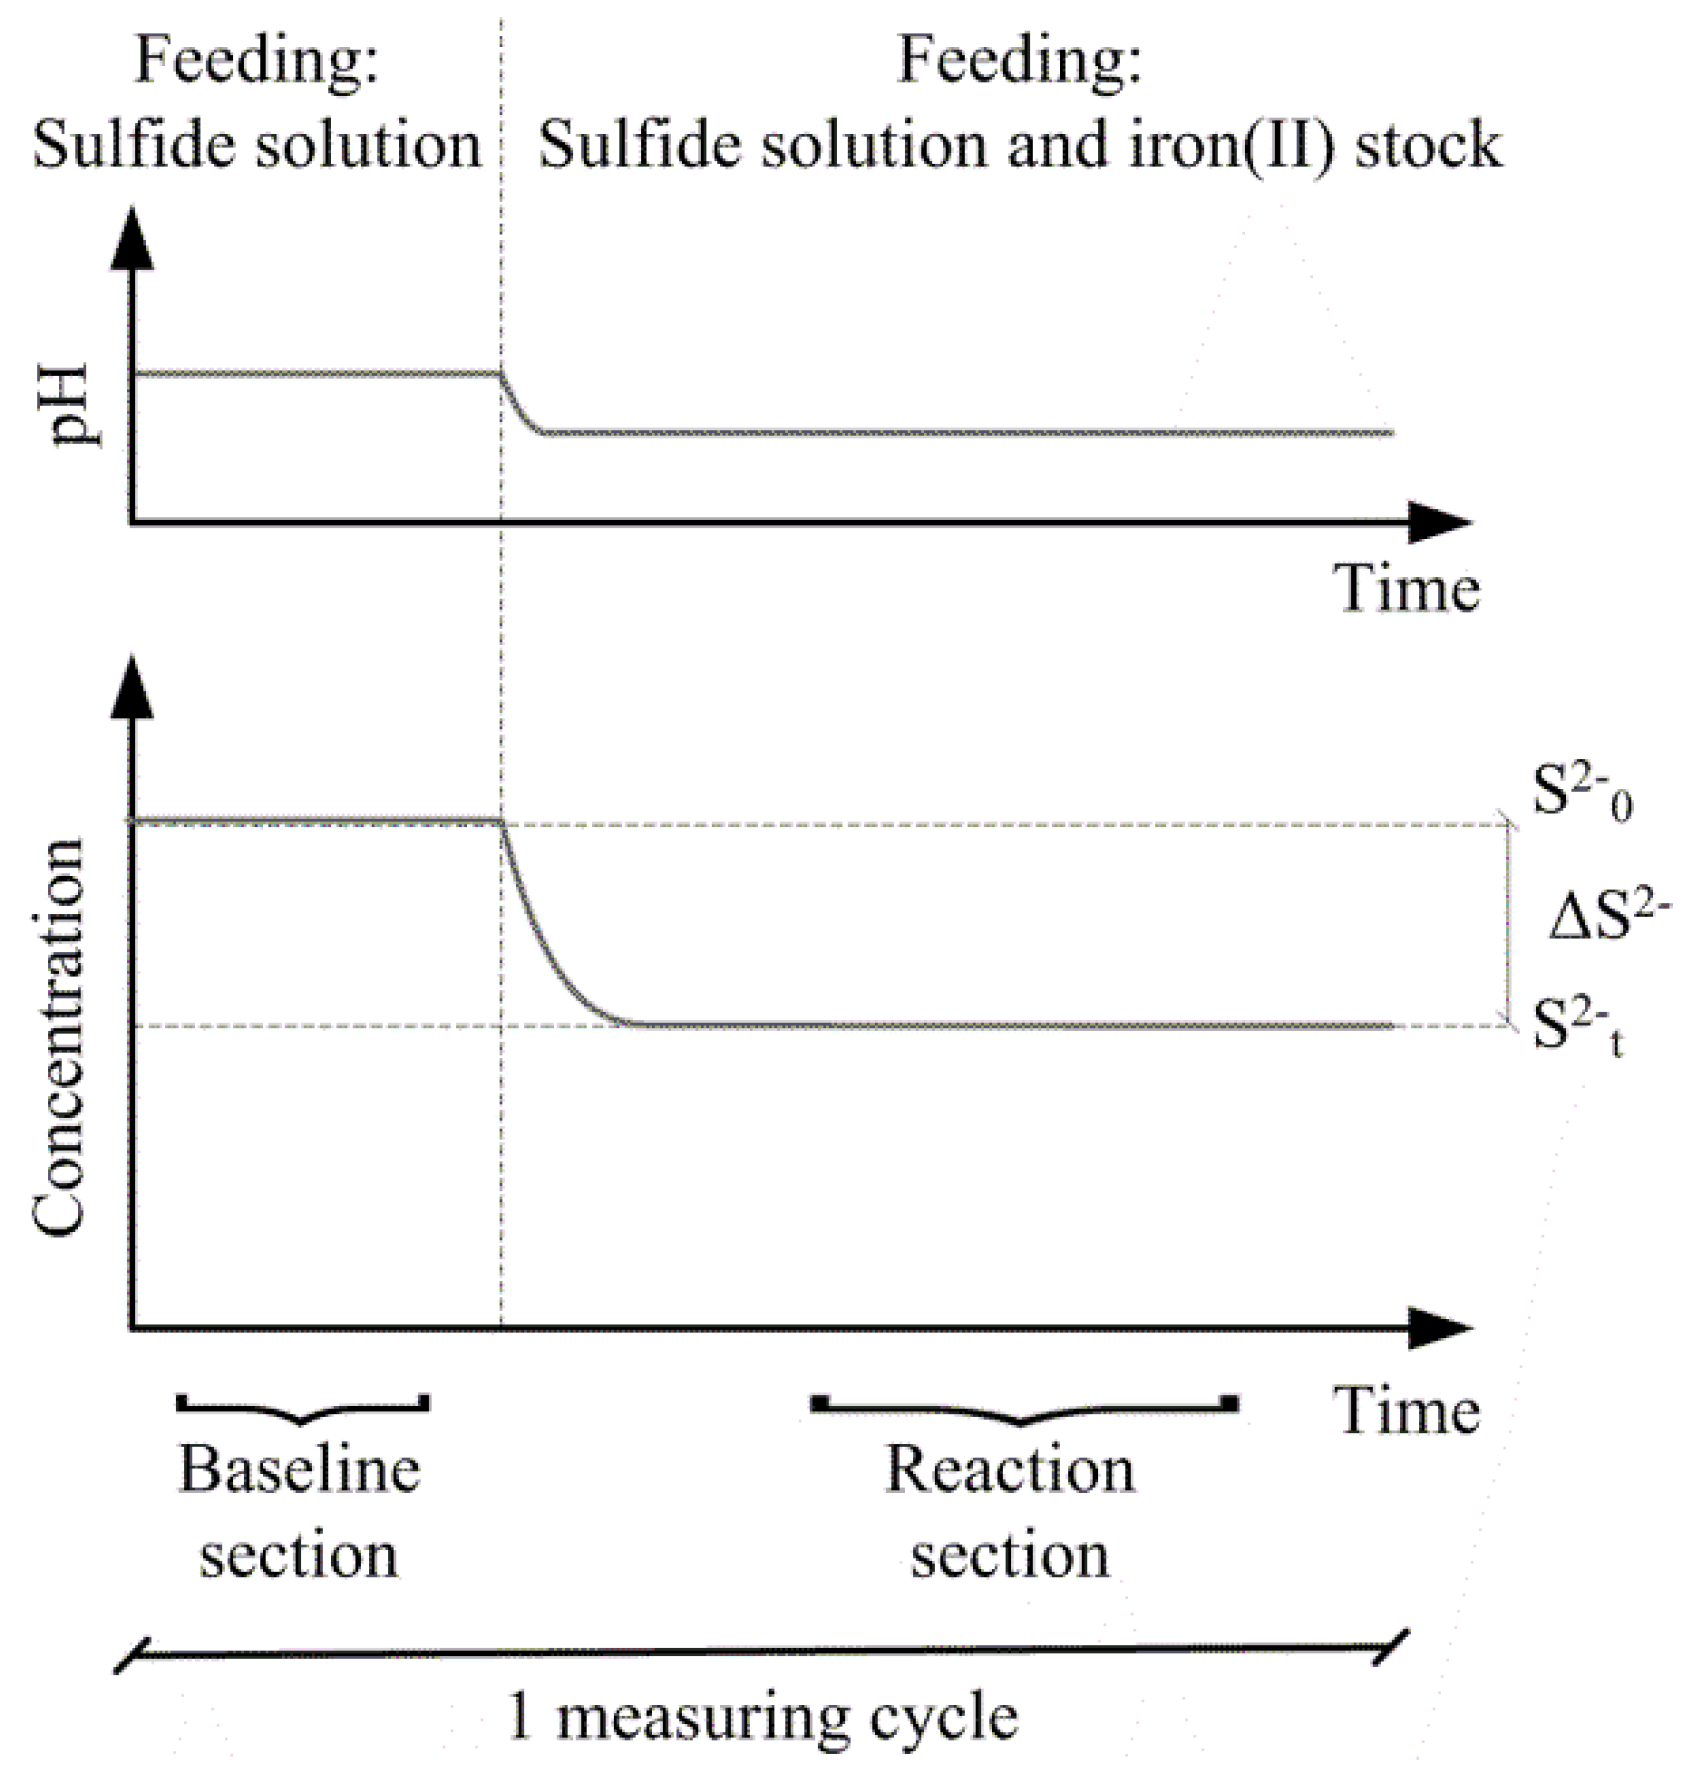
Stoichiometric ratios were determined as triplicates. At each measuring cycle, a baseline of the H2S concentration and pH was determined (Figure 2). The baseline was obtained by solely feeding the sulfide solution through the experimental setup. After a steady baseline was established, the ferrous iron stock was fed into the setup, leading to new steady levels for pH and H2S at the measuring point. Before the next measurement cycle was conducted, the system was flushed with 5 mM·HCl. The specific levels of H2S and pH before and after addition of ferrous iron for each measurement cycle were found by root mean square error fitting of data. Subsequently, the stoichiometric ratio on a mole-to-mole basis of ferrous iron to total sulfide could be determined. Ferrous iron could not be measured online, and losses to ferrous iron side reactions were hence included in the stoichiometric ratio and the sulfide conversion.
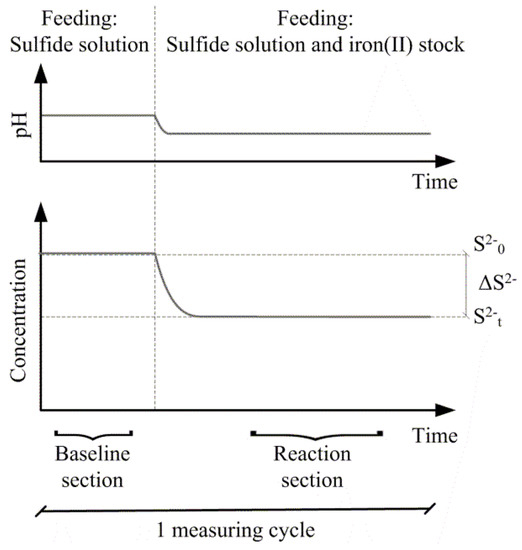
Figure 2.
Schematic drawing of one measurement cycle of sulfide precipitation using ferrous iron.
The initial molar ratio of an experiment is defined by Equation (2), where [Fe(II)0] and [S(−II)0] are the molar concentrations of dissolved ferrous iron and dissolved sulfide at time t = 0. The stoichiometric ratio of the precipitation reaction is defined by Equation (3), where [S(−II)t] is the molar concentration of dissolved sulfide at time t = 1.5 or 30 s; consequently [ΔS(−II)] is the amount of dissolved sulfide that has been removed by precipitation at the specified reaction time. In Equation (3), [Fe(II)0] is used as a substitution for [ΔFe(II)], as it is not possible to measure [Fe(II)t] online at t = 1.5 and 30 s. Sulfide conversion at a specific reaction time is defined by Equation (4).
Concentrations were used for these calculations instead of activities of the species, even though the ionic strength of the buffered water was 0.01 M and the wastewater from Frejlev was estimated to be in the range of 0.02 M, based on conductivity measurements, and following the conversion according to [17]. Using concentrations was justified, as the activity coefficient of divalent cations and anions was approximately equal at these ionic strengths [17], and the activity coefficients in the following calculations hence cancelled out.
2.2. Conducted Experiments
The study comprised two sets of experiments. The first set addressed the pH dependency of the reaction stoichiometry by applying buffered MilliQ water. The second set addressed differences in reaction stoichiometry for wastewaters of different characteristics and buffered water. The latter experiments were all run at pH 7.
For the experiments on pH dependency, buffered water was prepared freshly from MilliQ water (18 MΩ·cm−1) before every experimental run. To reflect a typical wastewater composition of approximately 4 meq·L−1 [18], Na2CO3 was added to a concentration of 2 mM and NaH2PO4·2H2O to a concentration of 0.105 mM. The pH of the water was adjusted between runs by adding hydrochloric acid and sodium hydroxide.
For the experiments at pH 7, raw municipal wastewater was collected in sewers of the towns Frejlev and Svenstrup, and in the inlet of Aalborg West wastewater treatment plant (WWTP), Denmark. The drainage area of Frejlev is small, steep, and fully aerobic with approx. half an hour conveyance time from the sources to the sampling point. The drainage area of Svenstrup is larger, shallower, and collects wastewater from several small towns. The wastewater at the sampling location is hence of mixed age and has been less oxygenated. Some of it has furthermore been transported in intercepting pump mains. The drainage area of Aalborg West WWTP is large, and in places rather flat. It receives wastewater from outlying towns as well as the city of Aalborg itself. This wastewater is hence the oldest of the sampled waters and has been the least oxygenated. In combination, the three wastewaters consequently represent fresh, medium-fresh, and old wastewater. Prior to use, the wastewaters were settled for approx. half an hour to eliminate gross particles. Total and dissolved chemical oxygen demand (COD) was measured using Hach Lange COD cuvette kits. Samples for dissolved COD were filtered through a Sartorius GF + CA 0.45 µm filter. Phosphate was measured using the protocol described in [19]. Carbonate alkalinity was measured according to [20]. Prior to the experiments, the pH of the three wastewaters was adjusted to be close to 7 by addition of hydrochloric acid and sodium hydroxide. For comparison, the wastewater experiments included the results from the previous runs of buffered water at pH 7.
2.3. Theoretical Equilibrium Calculations
Visual MINTEQ ver. 3.1. (Kungliga Tekniska Högskolan, Stockholm, Sweden) was used to predict the equilibrium conditions of sulfide precipitation in the buffered water. Equilibrium conditions for the wastewaters were not predicted as not all species affecting such equilibrium were determined. All scenarios were modelled at 20 °C, with fixed pH and amorphous ferrous sulfide, as well as crystalline mackinawite, set as possible solids of the reaction. Initial calculations showed that inclusion of siderite and vivianite as possible end products did not affect the stoichiometry in the pH range of interest and were hence omitted from the simulations. Chemical species added to the reaction were identical in concentration to those used for making the buffered water.
Addressing the stoichiometric ratio and conversion versus pH, the iron to sulfide ratio in Visual MINTEQ was set to 1.75 mol Fe (mol·S)−1, which corresponds to the average ratio of the samples at a reaction time of 1.5 s. When addressing the differences in reaction stoichiometry and conversion for wastewaters of different characteristics and buffered water at pH 7, the iron to sulfide ratio in Visual MINTEQ was set to 1.85 mol Fe (mol·S)−1. This value was chosen as it corresponded to the average value of the buffered waters used for comparison. In both cases, the ferrous iron concentration was fixed and sulfide concentrations were varied to yield the desired ratios.
3. Results and Discussion
Characteristics of buffered water and wastewater used for the experiments are shown in Table 1 The COD and phosphate contents of the wastewaters from Frejlev and Svenstrup can be characterized as low to medium strength wastewater [18]. The wastewater from Aalborg West WWTP was sampled the day after a storm event; thus it was somewhat diluted as can be seen from the concentrations of phosphate and dissolved COD. The concentration of COD in this sample was only around half of what can be characterized as low strength wastewater, and for phosphate, the concentration was around five times lower [18].

Table 1.
Average values (standard deviation) of key parameters characterizing the liquids used. Buffered water was prepared in the laboratory and thus not measured.
The buffered water was prepared to have a calcium carbonate alkalinity reflecting that of typical wastewater, as reported in the literature. Its pH was adjusted to approx. 6.5, 7.0 and 7.5 (Table 2), which is typical for wastewater that has been subject to anaerobic transformation and hence sulfide formation [2]. The three wastewaters had calcium carbonate alkalinities that were 3–4.5 times higher than the buffered water. This variation from typical values was due to the public water supply of the region being based on groundwater extracted from limestone aquifers of high carbonate content. pH of the wastewaters was adjusted to approx. 7 prior to experiments, in order to allow comparable precipitation conditions. The sulfide solution and the iron stock were mixed in the three-way valve (Figure 1), achieving initial molar ratios ranging from 1.75–2.84 mol Fe (mol·S)−1 (Table 2).

Table 2.
Initial molar ratios of ferrous iron to sulfide after mixing in the 3-way valve (Figure 1).
3.1. Precipitation Stoichiometry Versus pH in Buffered Water
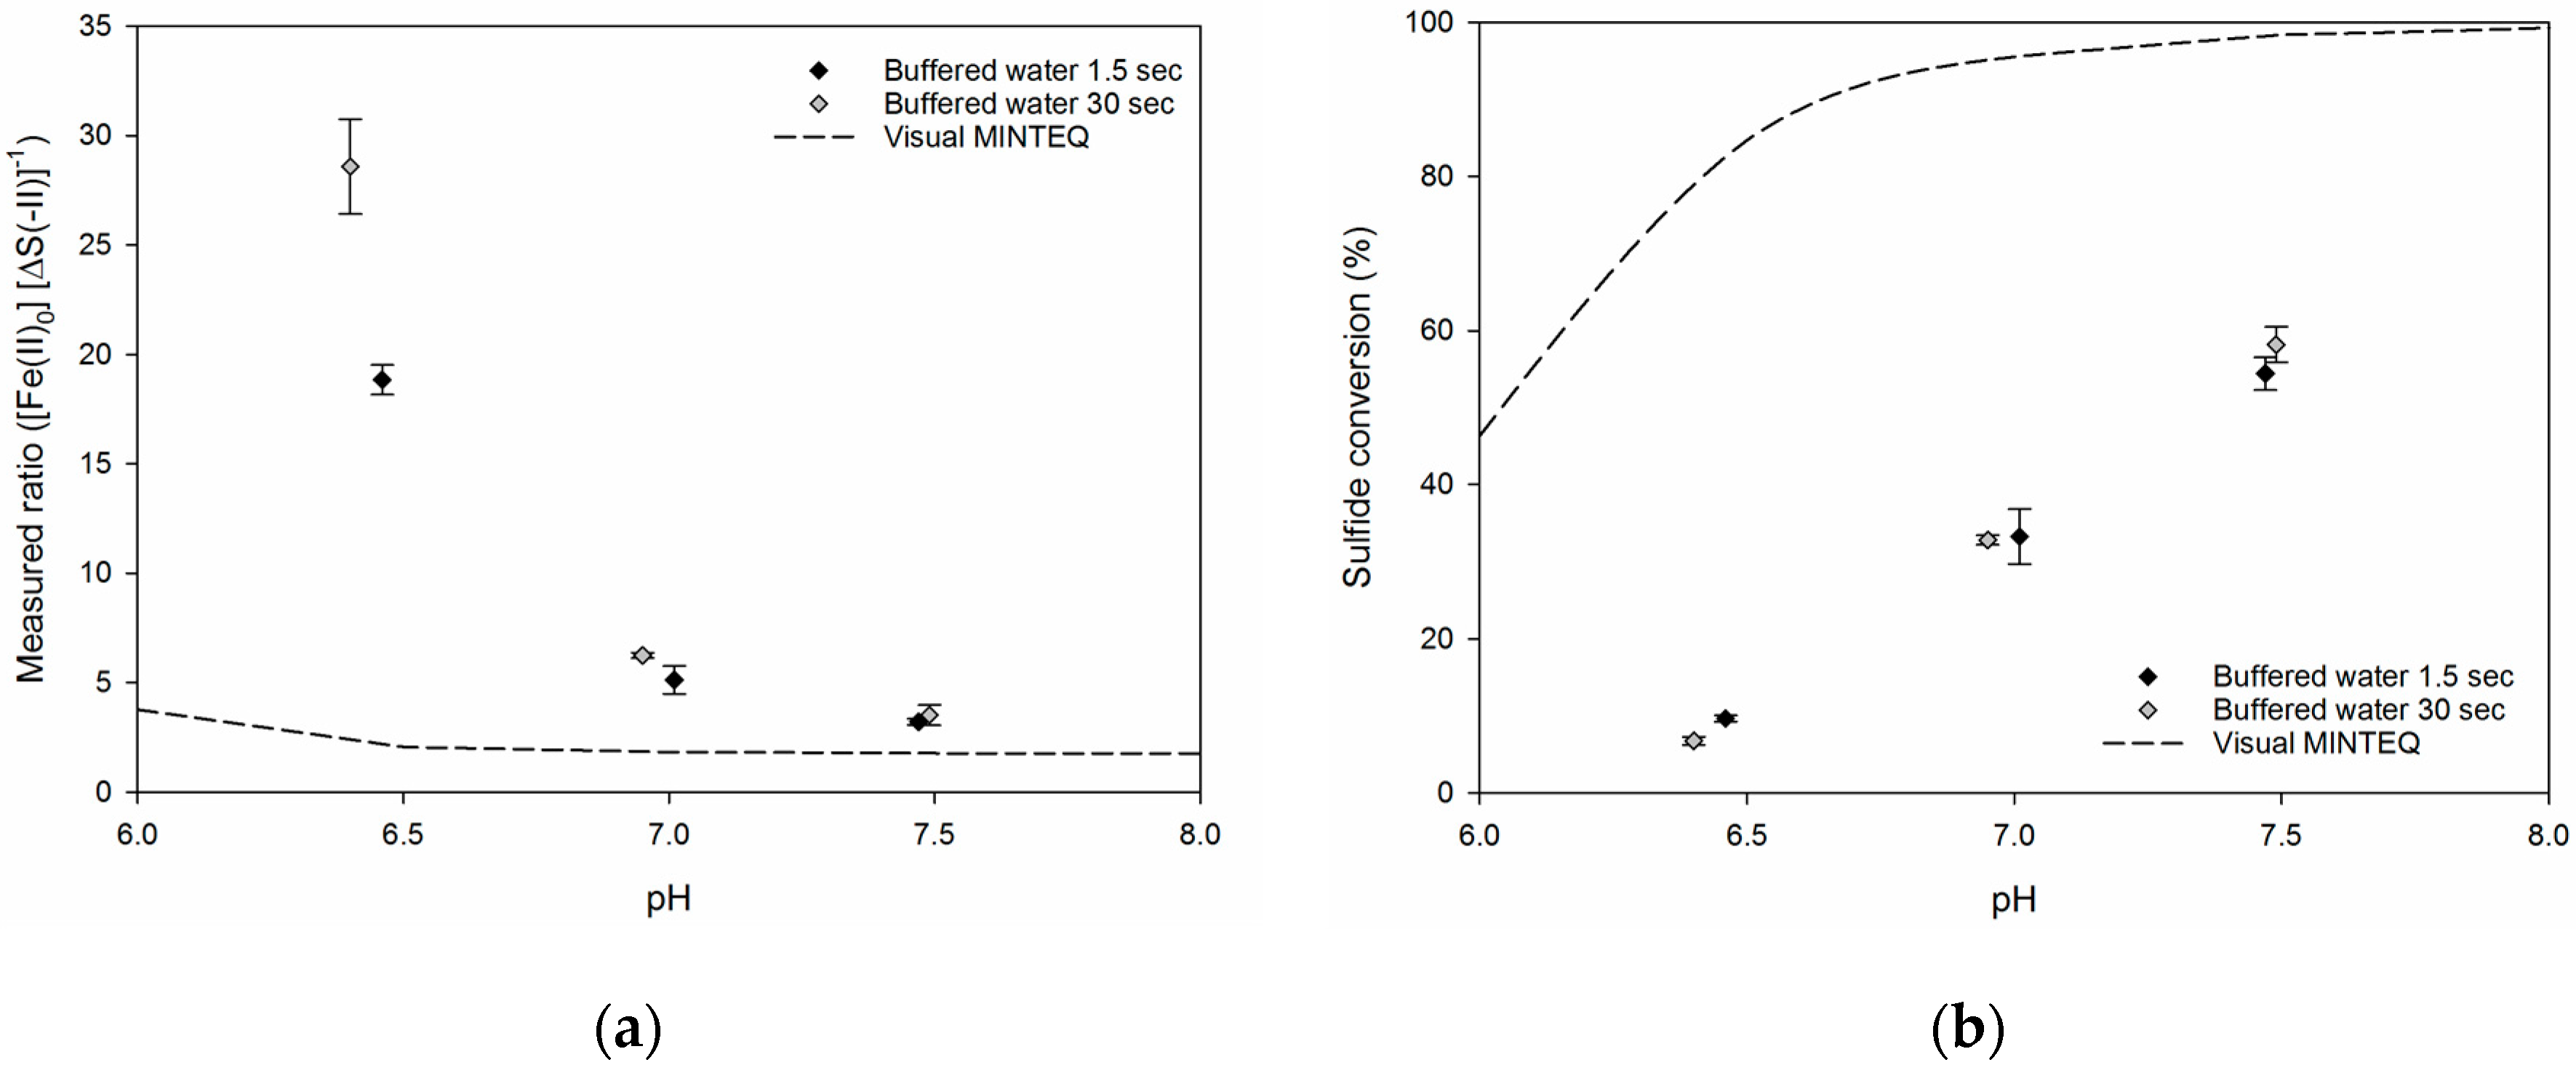
Figure 3 shows the precipitation ratios and the sulfide conversion in buffered water (Table 1) at 1.5 and 30 s of reaction time. A comparison with the ratio of a fully equilibrated reaction is included, which has been calculated from a simulation hereof using Visual MINTEQ. It is evident from the figure that the stoichiometric ratios and sulfide conversions depended on pH, where a lower pH resulted in higher stoichiometric ratio and lower conversion. For the buffered water, the stoichiometric ratios were not greatly affected by the reaction time. The difference in the ratio between 1.5 and 30 s reaction time at pH 6.5 was believed to be due to a difference in pH between the two runs. Although the pH only differed by 0.05 pH-units, the trend of the data indicates that this slight variation was likely to have caused the difference in stoichiometric ratio. Similarly, [1] stated that below pH 6.5, addition of iron will only have little effect, and a slight change in pH might consequently be expected to result in much higher demands for ferrous iron and thus a higher stoichiometric ratio. An increase in ratio when lowering the pH was also observed for the modelled equilibrium conditions, albeit less distinct.
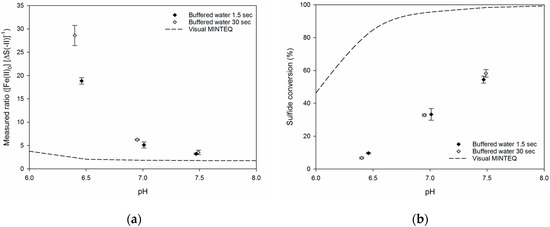
Figure 3.
(a) The stoichiometric ratio of sulfide precipitation using ferrous iron in buffered water as a function of pH. (b) Sulfide conversion in buffered water as a function of pH. Each point represents the average of the three individual measurements and error bars indicate their standard deviation. Visual MINTEQ was used to calculate equilibrium conditions.
The stoichiometric ratios at the lowest pH-values were up to 30 times higher than the stoichiometric requirement (1 mol Fe (mol·S)−1) and 15 times higher than the equilibrium condition modelled by Visual MINTEQ. At pH 7.5, the obtained stoichiometric ratios were around 3.5 times higher than the stoichiometric requirement and two-fold higher than the modeled ratio. Even though the stoichiometric ratio came closer to the modeled equilibrium ratio as pH increased, it was still higher than what has been reported in literature (e.g. [3,11,15,21]). In the analysis performed by Visual MINTEQ, the concentrations of the different chemical species were kept equal to the buffered water experiments. This implies that the inorganic ligands for ferrous iron in the buffered water were also considered during modelling of equilibrium conditions. The 2–15 fold differences between measured and modeled ratios were consequently expected to account for the fact that the ferrous sulfide reaction had not fully equilibrated. The validity of this statement was indirectly supported by a study by [22] where reaction times of 5–7 minutes agreed with the analysis performed in Visual MINTEQ.
The fact that the difference between modeled and measured ratios became less as pH increased, might be related to speciation of sulfide and iron. Such a phenomenon was observed by [14,23] which showed that the precipitation mechanism at ambient temperature depends on pH and sulfide concentration, and thus indirectly also on the speciation of sulfide. It was reported that at sulfide concentrations below 10−3 M, a H2S-pathway of FeS formation dominated in environments up to pH 8, with FeS forming directly, and that the rate of FeS formation was greater in neutral and acidic environments. At concentrations above 10−3 M, the rate was instead greater at neutral to alkaline conditions where a bisulfide pathway dominated. For this concentration range, Fe(HS)2 formed as an intermediate before further transformation to FeS. However, even in the concentration range above 10−3 M, the H2S-pathway took over in acidic environments to yield FeS directly.
The findings of the present study, where sulfide was added to concentrations of 10−6 M, are somewhat contradictory to those of [14,23]. In contrast here, a higher conversion was observed at increasing pH even though sulfide in the present study was added to concentrations < 10−3 M. Thereby it seems that the bisulfide pathway, with an intermediate forming as suggested by [14], could be dominant even at sulfide concentrations as low as 10−6 M.
Similarly, [24] suggested that an intermediate species in the reaction pathway is present. By stopped-flow spectrophotometry they found that within the first few seconds of the reaction, an intermediate formed and a subsequent conversion of this intermediate took place. They suggested that this initial product of the reaction between Fe2+ and HS− was Fe(HS)+. Also, [25] found that different types of FeS form at neutral pH compared to slightly acidic conditions, indicating that different reaction pathways are followed.
As reported in literature, it is not completely agreed upon whether the FeS that forms under the different pH conditions of these earlier studies is in the form of an intermediate reaction product, amorphous FeS, nanocrystallineor microcrystalline mackinawite, or greigite (e.g. [23,25,26]). This discrepancy might be because ferrous sulfide salts appear in nature in various different forms and crystal structures, and the mechanisms leading to the different forms are complicated [25]. The specific form of FeS generated, and hence also the resulting reaction kinetics, might thus vary with e.g. pH, redox conditions, ionic strength, and available ligands.
FeS readily precipitates, and hence plays a role in controlling the concentrations of aqueous ferrous and sulfide concentrations [27,28]. The equilibrium simulations in Visual MINTEQ indicate that there might have been free sulfide at low pH, as the removal of sulfide was not complete even though ferrous iron was in excess (Figure 3). The concentration of free sulfide decreased at higher pH, indicating that more FeS was formed (Figure 3). Depending on the resulting structure of the FeS complex the values of the solid/liquid-partitioning coefficient, pKs, are reported to be in the range of 2.95–5.25, with the crystalline forms having the highest values [27]. This agrees well with the values used in Visual MINTEQ for the simulations with pKs values of 2.95 for amorphous FeS and 3.60 for mackinawite.
The crystalline forms of ferrous sulfide, such as mackinawite and greigite [26], are probably not the first to be formed in the reaction. In shallow and deep natural water bodies, [29] found that aging of the FeS precipitate might play a role in the solubility and that a metastable phase of FeS is transformed on aging to crystalline and less soluble forms. Also, [30] found that amorphous FeS at room temperature transformed into mackinawite and greigite; however, this was found to occur on a timescale of days and months. Whether the process of aging is pH-dependent is not reported in these works, but the pH-values tested in the present study are within the same range as those of natural waters. The tested reaction times of 1.5 and 30 s were very different from those addressed by [29] and would not induce an aging effect, where amorphous FeS transforms into its crystalline forms. This further supports that the precipitation of sulfide did not reach equilibrium at the reaction times tested.
The overall trend of sulfide conversion in the buffered water at different pH showed that higher conversions could be obtained at higher pH (Figure 3). The highest conversions were around 60% at pH 7.5, and the sulfide conversion decreased almost linearly with decreasing pH and reached around 10% at pH 6.5. This trend in decreasing conversion level with decreasing pH is in line with findings of [11], who in the range of pH 5–10.5 obtained sulfide conversions of 10% and 90%, respectively. At reaction times of 1.5 and 30 s, no significant differences in the sulfide conversion were observed for the samples. Even though the absolute level of sulfide conversion was much lower in the experiments compared to the model results, this tendency was still in line with the overall trend for conversion as predicted by Visual MINTEQ, where a higher sulfide conversion was obtained at higher pH values.
Nevertheless, using buffered water for the reaction is a simplification of the real wastewater system, where the actual precipitation must take place during abatement of sulfide. In the wastewater matrix, organic or inorganic ligands could also be of importance to the reaction, complexing with sulfide or iron and impeding the reaction.
3.2. Precipitation Stoichiometry versus Water Type
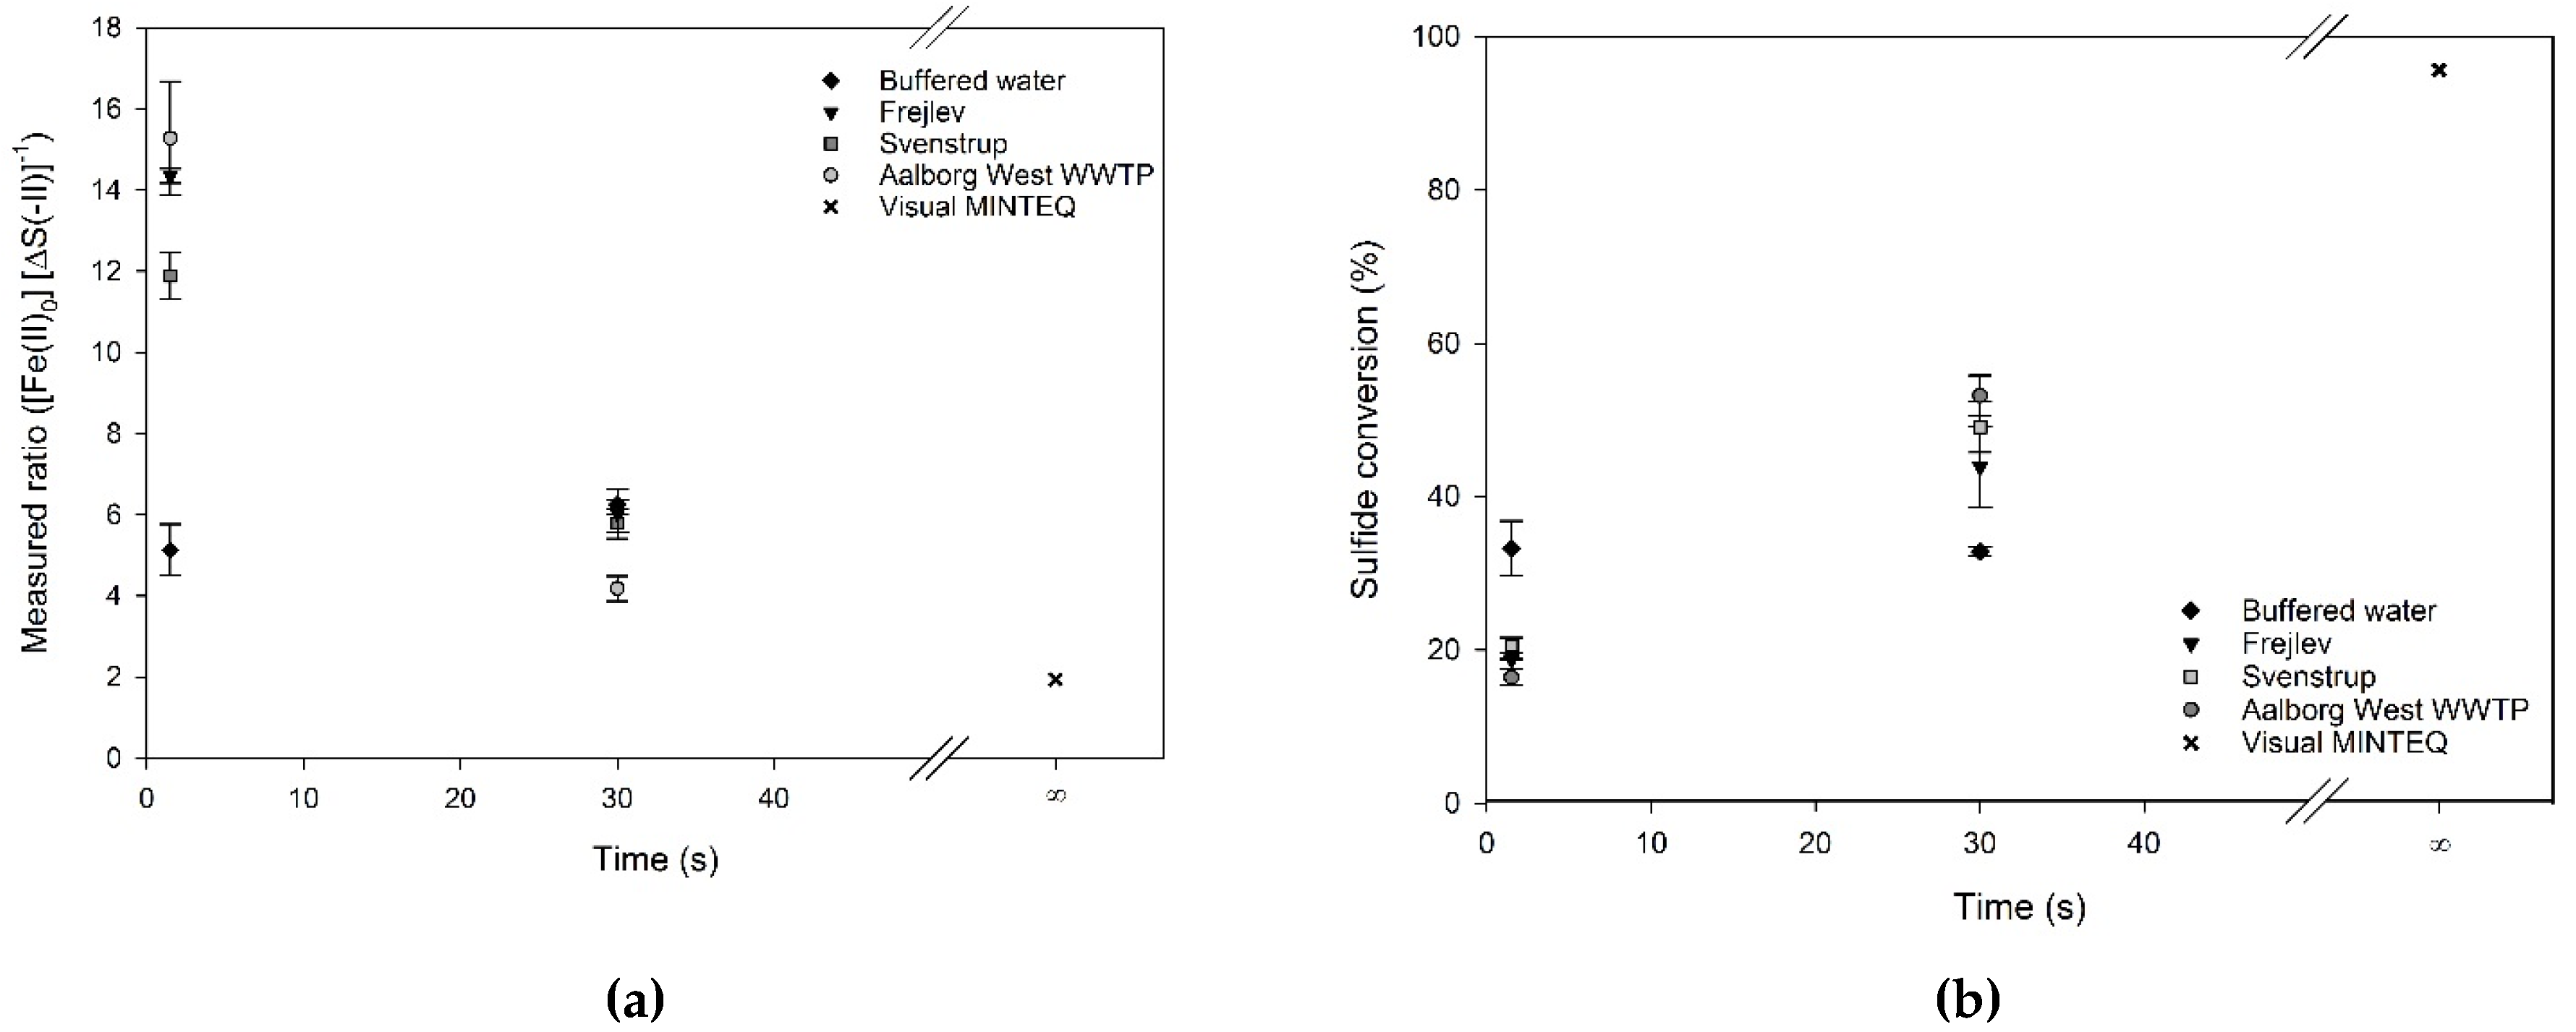
The impact of water type on the precipitation was studied for three wastewaters and the buffered water previously discussed (Table 1). The pH was kept close to 7 and the reaction times were 1.5 and 30 s. MINTEQ simulations were done to estimate equilibrium conditions corresponding to an infinite reaction time, also at pH 7 (Figure 4). The wastewaters had an average initial molar ratio of ferrous iron to sulfide of 2.54 ± 0.11 and 2.55 ± 0.26 mol Fe (mol·S)−1 for reaction times of 1.5 and 30 s, respectively. The buffered water samples had initial molar ratios of 1.68 and 2.05 mol Fe (mol·S)−1 for the two reaction times (Table 2).
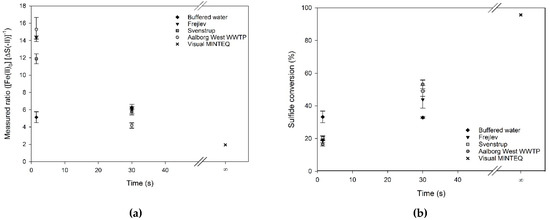
Figure 4.
(a) The stoichiometric ratio of sulfide precipitation by ferrous iron in different waters at pH 7 (average of three individual measurements and their standard deviation). (b) Sulfide conversion of the same samples. The value at t = ∞ is a simulation of equilibrium conditions applying Visual MINTEQ.
It is evident from Figure 4 that the stoichiometric ratios and sulfide conversions of the three wastewaters depended on reaction time, with a longer reaction time resulting in a lower stoichiometric ratio and thereby a higher conversion. This trend was not observed for the buffered water, where no time-dependency could be documented (two-sided t-test, α = 5%). However, this lack of time-dependency might be caused by the slight dissimilarities in pH and initial molar ratios between the experimental runs. Nevertheless, the ratio in buffered water did not reach the values predicted by equilibrium simulations, indicating that the reaction might continue at a slow rate for longer time.
The stoichiometric ratios for wastewater at a reaction time of 1.5 s were 2.5–3 times higher than those for the buffered water. However, at a reaction time of 30 s, this difference disappeared and the ratios showed values in the same range as for the buffered water. Compared to the 1 mol Fe (mol·S)−1 theoretically needed according to Equation (1), and the 1.94 mol Fe (mol·S)−1 predicted by the equilibrium modeling, the obtained ratios at 1.5 and 30 s reaction times were 5–15 and 2.5–7.5 times higher, respectively.
The results for the three wastewaters showed comparable stoichiometric ratios at the two reaction times, despite the fact that wastewater is a heterogeneous medium and the variation in COD between the wastewaters was large (Table 1). A one-way analysis of variance (ANOVA) test (α = 5%) revealed that the mean of the samples, including the buffered water, were not equal and a multiple comparison procedure using the Holm-Sidiak method showed that at 1.5 s the stoichiometric ratio of the buffered water and Svenstrup wastewater differed from the Aalborg and Frejlev wastewaters. However, at 30 s, the Aalborg wastewater differed as the only one from the three other samples.
Previous studies have reported the stoichiometric ratios for iron sulfide precipitation in wastewater to vary between a better than stoichiometric ratio and up to a ratio of 5.7 (e.g. [3,11,15,21]). This variation could be due to the fact that many studies are site- and wastewater-specific, as both pH, initial sulfide concentration, and other ligands for ferrous iron are known to influence the stoichiometric ratios [3,6,11]. Furthermore [3,6] reported that the stoichiometric ratio depends on the initial sulfide concentration. A near stoichiometric ratio was achieved by [3] at high initial sulfide concentrations, and it was observed that the ratio increased drastically at lower initial concentrations. The initial sulfide concentrations in the present study were in the high end of what is typical for septic wastewater [2]; however, the stoichiometric ratios obtained in the present study were higher than what those studies led to expect. Also, compared to the ratios found by [11], which used an almost equal initial sulfide concentration of around 0.3 mM, the obtained stoichiometric ratios were high. The above indicates that the reaction most likely had not run to completion within the 30 s of reaction time.
The amount of iron needed to precipitate sulfide in wastewater will exceed the stoichiometric amount of Equation (1) as stated by [1,11]. According to those studies, near stoichiometric ratios can be expected at pH around 8. For pH around 6.5, a ratio of around 4.6 mol Fe (mol·S)−1 can be expected, and below this pH, addition of iron will only have little effect, thus the stoichiometric ratio will increase substantially. According to the above, the present experiments conducted at pH 7 should have had a stoichiometric ratio somewhat better than 4.6 mol Fe (mol·S)−1. They were, however, on average 13.8 ± 1.43 for reaction times of 1.5 s and of 5.3 ± 0.82 for reaction times of 30 s, indicating that reaction times on this timescale are important for the achieved stoichiometric ratio.
The difference in stoichiometric ratios observed for wastewater samples (Figure 4) at the two reaction times might be ascribed to the fact that ferrous iron initially reacted with other inorganic or organic constituents in the wastewater before it subsequently precipitated dissolved sulfides as previously discussed by [11,12]. This implies that the reaction between ferrous iron and sulfide was inhibited, and thus the stoichiometric ratio observed at low reaction times became higher than that for longer reaction times. However, the stoichiometric ratios observed for buffered water showed time-independent behavior, and thus the carbonate and phosphate content by themselves did not seem to influence the precipitation reaction to any significant extent, and thus explained the difference observed for wastewater at the two reaction times. It hence seems reasonable to assume that the retardation in precipitation was caused by organic wastewater constituents.
3.3. Conversion of Sulfide in Different Water Types
The mean of conversions (Figure 4) was tested statistically using a one-way ANOVA (α = 5%) and a subsequent multiple comparison with the Holm-Sidiak method to find statistical differences. This showed that there was no difference in conversion between the three wastewaters, and that they all differed significantly from the conversion mean of the buffered water at both 1.5 and 30 s of reaction time. The conversion at 1.5 s was found to be greater in buffered water compared to the wastewater samples, and reversed at 30 s, where conversion was greater in the wastewaters. This might again be due to the interaction between iron and organic matter in the samples, and thus ultimately the differences in matrices between buffered water and wastewater.
The sulfide conversion observed in this study differed considerably from previously reported numbers where [31] in real wastewater installations in Florida at a stoichiometric ratio of 1.43–2.86 mol Fe (mol·S)−1 attained a conversion of more than 80%. For a trunk sewer in California, [32] showed that a 95% reduction of initial sulfide levels could be attained with a stoichiometric ratio of around 1.4 mol Fe (mol·S)−1 when adding a mix of ferrous and ferric iron. The pH range of the precipitation in these full-scale installations was not reported. However, under laboratory conditions in a setup using wastewater at pH around 8, [11] showed an 80% conversion of sulfide. But when increasing the ratio from 0.8 to 1.3 mol Fe (mol·S)−1, thus adding iron in excess, they only experienced a 90% conversion of sulfide using wastewater. They moreover observed that when lowering pH below 7, conversion in some cases decreased and even attained values below 40%. This trend of decreasing conversion level is in line with both what was observed in this study and predicted theoretically by Visual MINTEQ (Figure 3).
Overall, the differences in sulfide conversion in wastewater between the two reaction times, as well as the differences found comparing to literature values and theoretical equilibrium conversions, most likely was caused by the reaction not having reached completion within the maximum reaction time tested.
3.4. Influence of Organic Matter
The organic content of the wastewaters seemed to influence the precipitation reaction. This influence was most pronounced at a reaction time of 1.5 s where a clear difference in stoichiometric ratios as well as conversions was observed (Figure 4). Between the two different criteria evaluated for the precipitation reaction (stoichiometric ratio and conversion), a consistent picture of a certain type of wastewater differing statistically significant from the others, either due to wastewater age or a specific reaction time, could not be established. This indicates that gross wastewater characteristics such as COD or age were poor indicators for the precipitation reaction.
The observed differences in stoichiometry between the three wastewaters must hence have been caused by specific organic and inorganic substances of the waters. This hypothesis is supported by, for example, [33], who showed that ferrous and ferric iron in aqueous solution at neutral pH and under oxic conditions interacted with organic matter and that both iron species were held in solution in concentrations in excess of what would be theoretically expected. Furthermore, [34] discovered that under reduced conditions, ferrous iron in the form of ferrous hydroxide can interact with organic matter, resulting in co-precipitation of the species. They showed that it is primarily the proteinaceous fraction of the organic matter which participates in these interactions. Those findings substantiate the conclusion of the present study that a gross parameter like COD is a poor indicator for the precipitation reaction in itself, and that a more detailed analysis of both organic and inorganic substances, as well as their interrelations, is needed to allow the prediction of stoichiometric requirements and reactions rates. Which specific substances are of importance and how their importance and interrelations depend on conditions like pH and redox, is still an unsolved issue.
The finding of this study implies that practitioners should take reaction time into account when managing H2S issues in sewer networks and at wastewater treatment plants. Depending on the actual wastewater characteristics, several minutes of reaction time might be needed to achieve optimal precipitation. Such reaction times can though be difficult to achieve in practice. The issue of sufficient reaction time must hence be considered when choosing the best suited H2S management strategies.
4. Conclusions
In agreement with other studies on sulfide precipitation by ferrous iron, it was found that the stoichiometric ratio of the precipitation process and the conversion of sulfide became poorer with decreasing pH. However, the study also showed that the precipitation of dissolved sulfide by ferrous iron was not as instantaneous as commonly assumed. At a reaction time of 1.5 s and a pH of 7, the achieved stoichiometric ratio was as high as 5–15 mol (mol·S)−1, while it only dropped to 4–6 mol Fe (mol·S)−1 at a reaction time of 30 s. Sulfide conversions were consequently poor, and equilibrium calculations indicated that the precipitation had not run to completion during the first 30 s. Another finding was that the precipitation at 1.5 s reaction time was slower in wastewater than in buffered water, while this was not seen at a reaction time of 30 s. Even though there was no simple relationship with the wastewater COD, it was hypothesized that organic substances in the wastewater influenced this.
The findings show that under conditions where short reaction times are adamant, ignoring the rate of the precipitation process will lead to inefficient sulfide management. Locations where precipitation rates must be considered, are for example, the end of a pumping main or the inlet to a wastewater treatment plant, where sufficient distance between dosing point and depressurization must be ensured to allow the reaction to equilibrate. The study furthermore makes clear that the precipitation process is not yet understood at a level where exact predictions of required stoichiometric ratio or sulfide conversion can be made based on knowledge of the chemical composition of the wastewater.
Acknowledgments
This work is partly funded by the Innovation Fund Denmark (IFD) under File No. 4135-00076B
Author Contributions
B.K., A.H. and J.V. conceived and designed the experiments; B.K. performed the experiments; B.K. analyzed the data; B.K. wrote the paper, W.V., A.H. and J.V. revised the paper.
Conflicts of Interest
The authors declare no conflict of interest. The founding sponsors had no role in the design of the study; in the collection, analyses, or interpretation of data; in the writing of the manuscript, and in the decision to publish the results.
References
- Boon, A.G. Septicity in sewers: Causes, consequences and containment. Water Sci. Technol. 1995, 31, 237–253. [Google Scholar] [CrossRef]
- Hvitved-Jacobsen, T.; Vollertsen, J.; Nielsen, A.H. Sewer Processes-Microbial and Chemical Process Engineering of Sewer Networks; CRC press: Boca Raton, FL, USA, 2013. [Google Scholar]
- Pomeroy, R.; Bowlus, F.D. Progress Report on Sulfide Control Research. Sewage Work. J. 1946, 18, 597–640. [Google Scholar] [PubMed]
- Jameel, P. The Use of Ferrous Chloride To Control Dissolved Sulfides in Interceptor Sewers. J. Water Pollut. Control Fed. 1989, 61, 230–236. [Google Scholar]
- ASCE. Sulfide in Wastewater Collection and Treatment Systems; American Society of Civil Engineers: New York, NY, USA, 1989. [Google Scholar]
- Firer, D.; Friedler, E.; Lahav, O. Control of sulfide in sewer systems by dosage of iron salts: Comparison between theoretical and experimental results, and practical implications. Sci. Total Environ. 2008, 392, 145–156. [Google Scholar] [CrossRef] [PubMed]
- Ganigue, R.; Gutierrez, O.; Rootsey, R.; Yuan, Z. Chemical dosing for sulfide control in Australia: An industry survey. Water Res. 2011, 45, 6564–6574. [Google Scholar] [CrossRef] [PubMed]
- Gudjonsson, G.; Vollertsen, J.; Hvitved-Jacobsen, T. Dissolved oxygen in gravity sewers—Measurement and simulation. Water Sci. Technol. 2002, 45, 35–44. [Google Scholar] [PubMed]
- Gutierrez, O.; Sutherland-Stacey, L.; Yuan, Z. Simultaneous online measurement of sulfide and nitrate in sewers for nitrate dosage optimisation. Water Sci. Technol. 2010, 61, 651–658. [Google Scholar] [CrossRef] [PubMed]
- Auguet, O.; Pijuan, M.; Guasch-Balcells, H.; Borrego, C.M.; Gutierrez, O. Implications of Downstream Nitrate Dosage in anaerobic sewers to control sulfide and methane emissions. Water Res. 2015, 68, 522–532. [Google Scholar] [CrossRef] [PubMed]
- Nielsen, A.H.; Hvitved-Jacobsen, T.; Vollertsen, J. Effects of pH and iron concentrations on sulfide precipitation in wastewater collection systems. Water Environ. Res. 2008, 80, 380–384. [Google Scholar] [CrossRef] [PubMed]
- Nielsen, A.H.; Lens, P.; Vollertsen, J.; Hvitved-Jacobsen, T. Sulfide-iron interactions in domestic wastewater from a gravity sewer. Water Res. 2005, 39, 2747–2755. [Google Scholar] [CrossRef]
- Rickard, D. Experimental concentration-time curves for the iron(II) sulphide precipitation process in aqueous solutions and their interpretation. Chem. Geol. 1989, 78, 315–324. [Google Scholar] [CrossRef]
- Rickard, D. Kinetics of FeS precipitation: Part 1. Competing reaction mechanisms. Geochim. Cosmochim. Acta 1995, 59, 4367–4379. [Google Scholar] [CrossRef]
- Tomar, M.; Abdullah, T.H.A. Evaluation of chemicals to control the generation of malodorous hydrogen sulfide in waste water. Water Res. 1994, 28, 2545–2552. [Google Scholar] [CrossRef]
- Zhang, L.; De Schryver, P.; De Gusseme, B.; De Muynck, W.; Boon, N.; Verstraete, W. Chemical and biological technologies for hydrogen sulfide emission control in sewer systems: A review. Water Res. 2008, 42, 1–12. [Google Scholar] [CrossRef] [PubMed]
- Snoeyink, V.L.; Jenkins, D. Water Chemistry; John Wiley & Sons: Chichester, England, 1980. [Google Scholar]
- Henze, M.; Comeau, Y. Chapter 3—Wastewater Characterization; Henze, M., Loosdrecht, M.C.M., van Ekama, G.A., Brdjanovic, D., Eds.; IWA Publishing: London, UK, 2008. [Google Scholar]
- APHA. Standard Methods for the Examination of Water and Wastewater, 19th ed.; American Public Health Association (APHA): Washington, DC, USA, 1995. [Google Scholar]
- Water quality—Determination of alkalinity—Part 2: Determination of carbonate alkalinity, Dansk Standard DS/EN ISO 9963-2-1996; Fonden Dansk Standard: Copenhagen, Denmark, 1996.
- Zhang, L.; Keller, J.; Yuan, Z. Ferrous Salt Demand for Sulfide Control in Rising Main Sewers: Tests on a Laboratory-Scale Sewer System. J. Environ. Eng. 2010, 136, 1180–1187. [Google Scholar] [CrossRef]
- Oviedo, E.R.; Johnson, D.; Shipley, H. Evaluation of hydrogen sulphide concentration and control in a sewer system. Environ. Technol. 2012, 33, 1207–1215. [Google Scholar] [CrossRef] [PubMed]
- Rickard, D. The solubility of FeS. Geochim. Cosmochim. Acta 2006, 70, 5779–5789. [Google Scholar] [CrossRef]
- Wei, D.; Osseo-Asare, K. Formation of Iron Monosulfide: A Spectrophotometric Study of the Reaction between Ferrous and Sulfide Ions in Aqueous Solutions. J. Colloid Interface Sci. 1995, 174, 273–282. [Google Scholar] [CrossRef]
- Harmandas, N.G.; Koutsoukos, P.G. The formation of iron(II) sulfides in aqueous solutions. J. Cryst. Growth 1996, 167, 719–724. [Google Scholar] [CrossRef]
- Morse, J.W.; Millero, F.J.; Cornwell, J.C.; Rickard, D. The chemistry of the hydrogen sulfide and iron sulfide systems in natural waters. Earth-Science Rev. 1987, 24, 1–42. [Google Scholar] [CrossRef]
- Davison, W. The Solubility of Iron Sulphides in Synthetic and Natural-Waters at Ambient-Temperature. Aquat. Sci. 1991, 53, 309–329. [Google Scholar] [CrossRef]
- Bågander, L.E.; Carman, R. In situ determination of the apparent solubility product of amorphous iron sulphide. Appl. Geochemistry 1994, 9, 379–386. [Google Scholar] [CrossRef]
- Davison, W. A critical comparison of the measured solubilities of ferrous sulphide in natural waters. Geochim. Cosmochim. Acta 1980, 44, 803–808. [Google Scholar] [CrossRef]
- Csakberenyi-Malasics, D.; Rodriguez-Blanco, J.D.; Kis, V.K.; Recnik, A.; Benning, L.G.; Posfai, M. Structural properties and transformations of precipitated FeS. Chem. Geol. 2012, 294–295, 249–258. [Google Scholar] [CrossRef]
- Bowker, R.P.G.; Smith, J.M.; Webster, N.A. Design Manual Odor and Corrosion Control in Sanitary Sewerage Systems and Treatment Plants; United States Environmental Protection Agency: Cincinnati, OH, USA, 1985.
- Padival, N.A.; Kimbell, W.A.; Redner, J.A. Use of Iron Salts to Control Dissolved Sulfide in Trunk Sewers. J. Environ. Eng. 1995, 121, 824–829. [Google Scholar] [CrossRef]
- Akiyama, T. Interactions of ferric and ferrous irons and organic matter in water environment. Geochem. J. 1973, 7, 167–177. [Google Scholar] [CrossRef]
- Theis, T.L.; Singer, P.C. Complexation of lron(II) by Organic Matter and Its Effect on Iron(II) Oxygenation. Environ. Sci. Technol. 1974, 8, 569–573. [Google Scholar] [CrossRef]
© 2017 by the authors. Licensee MDPI, Basel, Switzerland. This article is an open access article distributed under the terms and conditions of the Creative Commons Attribution (CC BY) license (http://creativecommons.org/licenses/by/4.0/).

