1. Introduction
According to [
1], the population of the world is 7.7 billion and it is projected to rise to 8.5 billion in 2030. It is also estimated that, of the extra 2 billion projected population increase from 2019 to 2050, around 1.05 billion (52 per cent) might be added from sub-Saharan African countries [
2]. It has been forecasted that the urban settlers of Sub-Saharan Africa will double between 2000 and 2030 [
3]. In West Africa, urban/built-up areas with more than 10,000 dwellers were only 152 in 1950 but rose to 1947 in 2010 [
4].
Urbanization plays a major role in affecting human society [
5]. It refers to the rise in urban/built-up areas [
6]. Rapid urban expansion is regarded as one of the most evident anthropogenic drivers of environmental alterations. It has been earmarked as the key factor responsible for Land Use Land Cover Changes (LULCC) [
7]. The non-urban areas are converted to urban/built-up areas to cope with the demands of the growing populations. Several decades of research in LULCC have revealed that Africa will suffer the most consequences of the impacts of LULCC, especially the expansion of urban/built-up areas to the detriment of other LULC types, for example, agricultural and forestlands [
8,
9].
The urban population is the main problem connected to Africa’s rapid urbanization into the natural environment [
10]. This growth is partially due to an increase in urban population, migration to the urbanized zones and the reclassification of rural zones as urban [
11]. Over recent decades, there have been extreme degrees of urban transitional change in megacities in the tropics and subtropics [
12].
Ghana’s urbanization process can be grouped under three phases, namely: Pre-Colonial (before 1500), Colonial (1500–1956) and Post-Colonial phases (1957 to date) [
13]. Despite generations of urban settlements in Ghana, urban life was not characteristic until the middle ages. In the pre-colonial phase, most towns were established in Ghana for economic reasons. A major highlight in the colonial stage was the skewedness of urban expansion. The colonial city Kumasi, for example, became a trade hub and also served administrative purposes [
14]. In the post-colonial phase, interventions and policies played a vital part in the clustering of urban/built-up areas of Ghana [
15]. The urban population of Ghana was 50.9% in 2010 and it is projected to reach 70% in 2050 [
16].
Kumasi had a population of 1,730,249 in 2010 which represented 36.2 per cent of its regional population [
17]. Urban expansion has been observed due to accelerated economic development. There was a positive interrelationship between population increase and economic activities [
16]. There are large zones engaged in automobile repairs, small scale machine manufacturing and trading activities in Kumasi [
18]. It has an enormous population growth with an annual growth rate of 5.2% from 1984 to 2000 and 5.4% from 2000 to 2010 [
19]. Thus, it is one of the most densely populated cities in Ghana and has experienced immense hectares of agricultural and forestlands disappearing [
20]. Kumasi has witnessed enormous growth in infrastructure. This intense growth has led to high demand for lands for housing, manufacturing and trading purposes at the detriment of agricultural and forestlands. This phenomenon has led to unplanned and uncontrolled urbanization [
21].
Remote Sensing imaging (ground, aerial and satellite) has been utilized to obtain land classification maps for monitoring and analyzing LULC changes [
22,
23]. Satellite imagery has contributed to studies on the spatial analysis of urban/built-up areas. These satellites include Landsat Thematic Mapper (TM) and Operational Land Imager (OLI) [
24,
25,
26,
27]. Multi-temporal and multi-spectral spatial datasets have proven to be economical and efficient tools for quantifying, monitoring and predicting future land cover change [
28,
29]. Seminal literature has assessed LULC changes in Kumasi focusing on lost agricultural lands, the extent of LULC and deforestation [
20,
30,
31] and other works have concentrated on the modeling of land use prediction in different cities in Ghana [
30,
31].
The emergence of potential LULC modeling tools has become a useful technique for forecasting future scenarios of urban/built-up areas [
30,
31]. The prediction of urban expansion is vital for sustainable land utilization [
32]. The Markov Chain was used to predict LULCC in New Juaben in Ghana in the work of [
30]. The Multi-Layer Perception (MLP) neural network and the Markov Chain were utilized to forecast LULC for the Greater Accra Metropolitan Area in [
31].
Initial work on Kumasi and other cities in Ghana including [
20,
31,
33,
34,
35,
36,
37,
38] utilized traditional classifiers for the classification of satellite imageries used in their researches. Hence, it is imperative to improve on the extant literature from the methodological point of view by utilizing the state of the art machine learning Random Forest (RF) classifier to classify satellite images of Kumasi. Therefore, we hypothesize that the RF algorithm produces better classification results compared to previously used traditional classifiers for the study area and other cities in Ghana.
Previous works in Kumasi focused on LULC changes [
39], the depletion of urban greenery [
40,
41]; deforestation and agricultural lands [
20,
42]; peri-urban trends in Kumasi [
43,
44]; urbanization and climate [
36,
45]; and urbanization, land utilization and spatio-environmental impacts [
46]. In our research, we focus on the urban/built-up areas of Kumasi. Deeper insights into the urbanization process utilizing different urban analysis techniques were executed at the sub-metropolitan level. We attempt to model and predict a future LULC map for 2025 to serve management purposes for future decision making. Hence, we hypothesize that urban/built-up areas are increasing at the expense of the other LULC classes in Kumasi within the study period.
This research fills a knowledge gap by employing the RF classifier to extract urban/built-up areas for onward urban expansion analyses in the Kumasi Metropolis. Thus, the objective of this research was to classify LULC utilizing the RF classifier indicating the rates and patterns, predicting urban/built-up areas for 2025 and providing a deeper comprehension of urban expansion in Kumasi.
We hope that our study will act as a reference point and may contribute to the methodological techniques utilized for satellite image classification. It will also be useful for spatial planning to policymakers and other relevant stakeholders in supporting planning and management practices for the future utilization of land in Kumasi.
2. Materials and Methods
2.1. Study Area
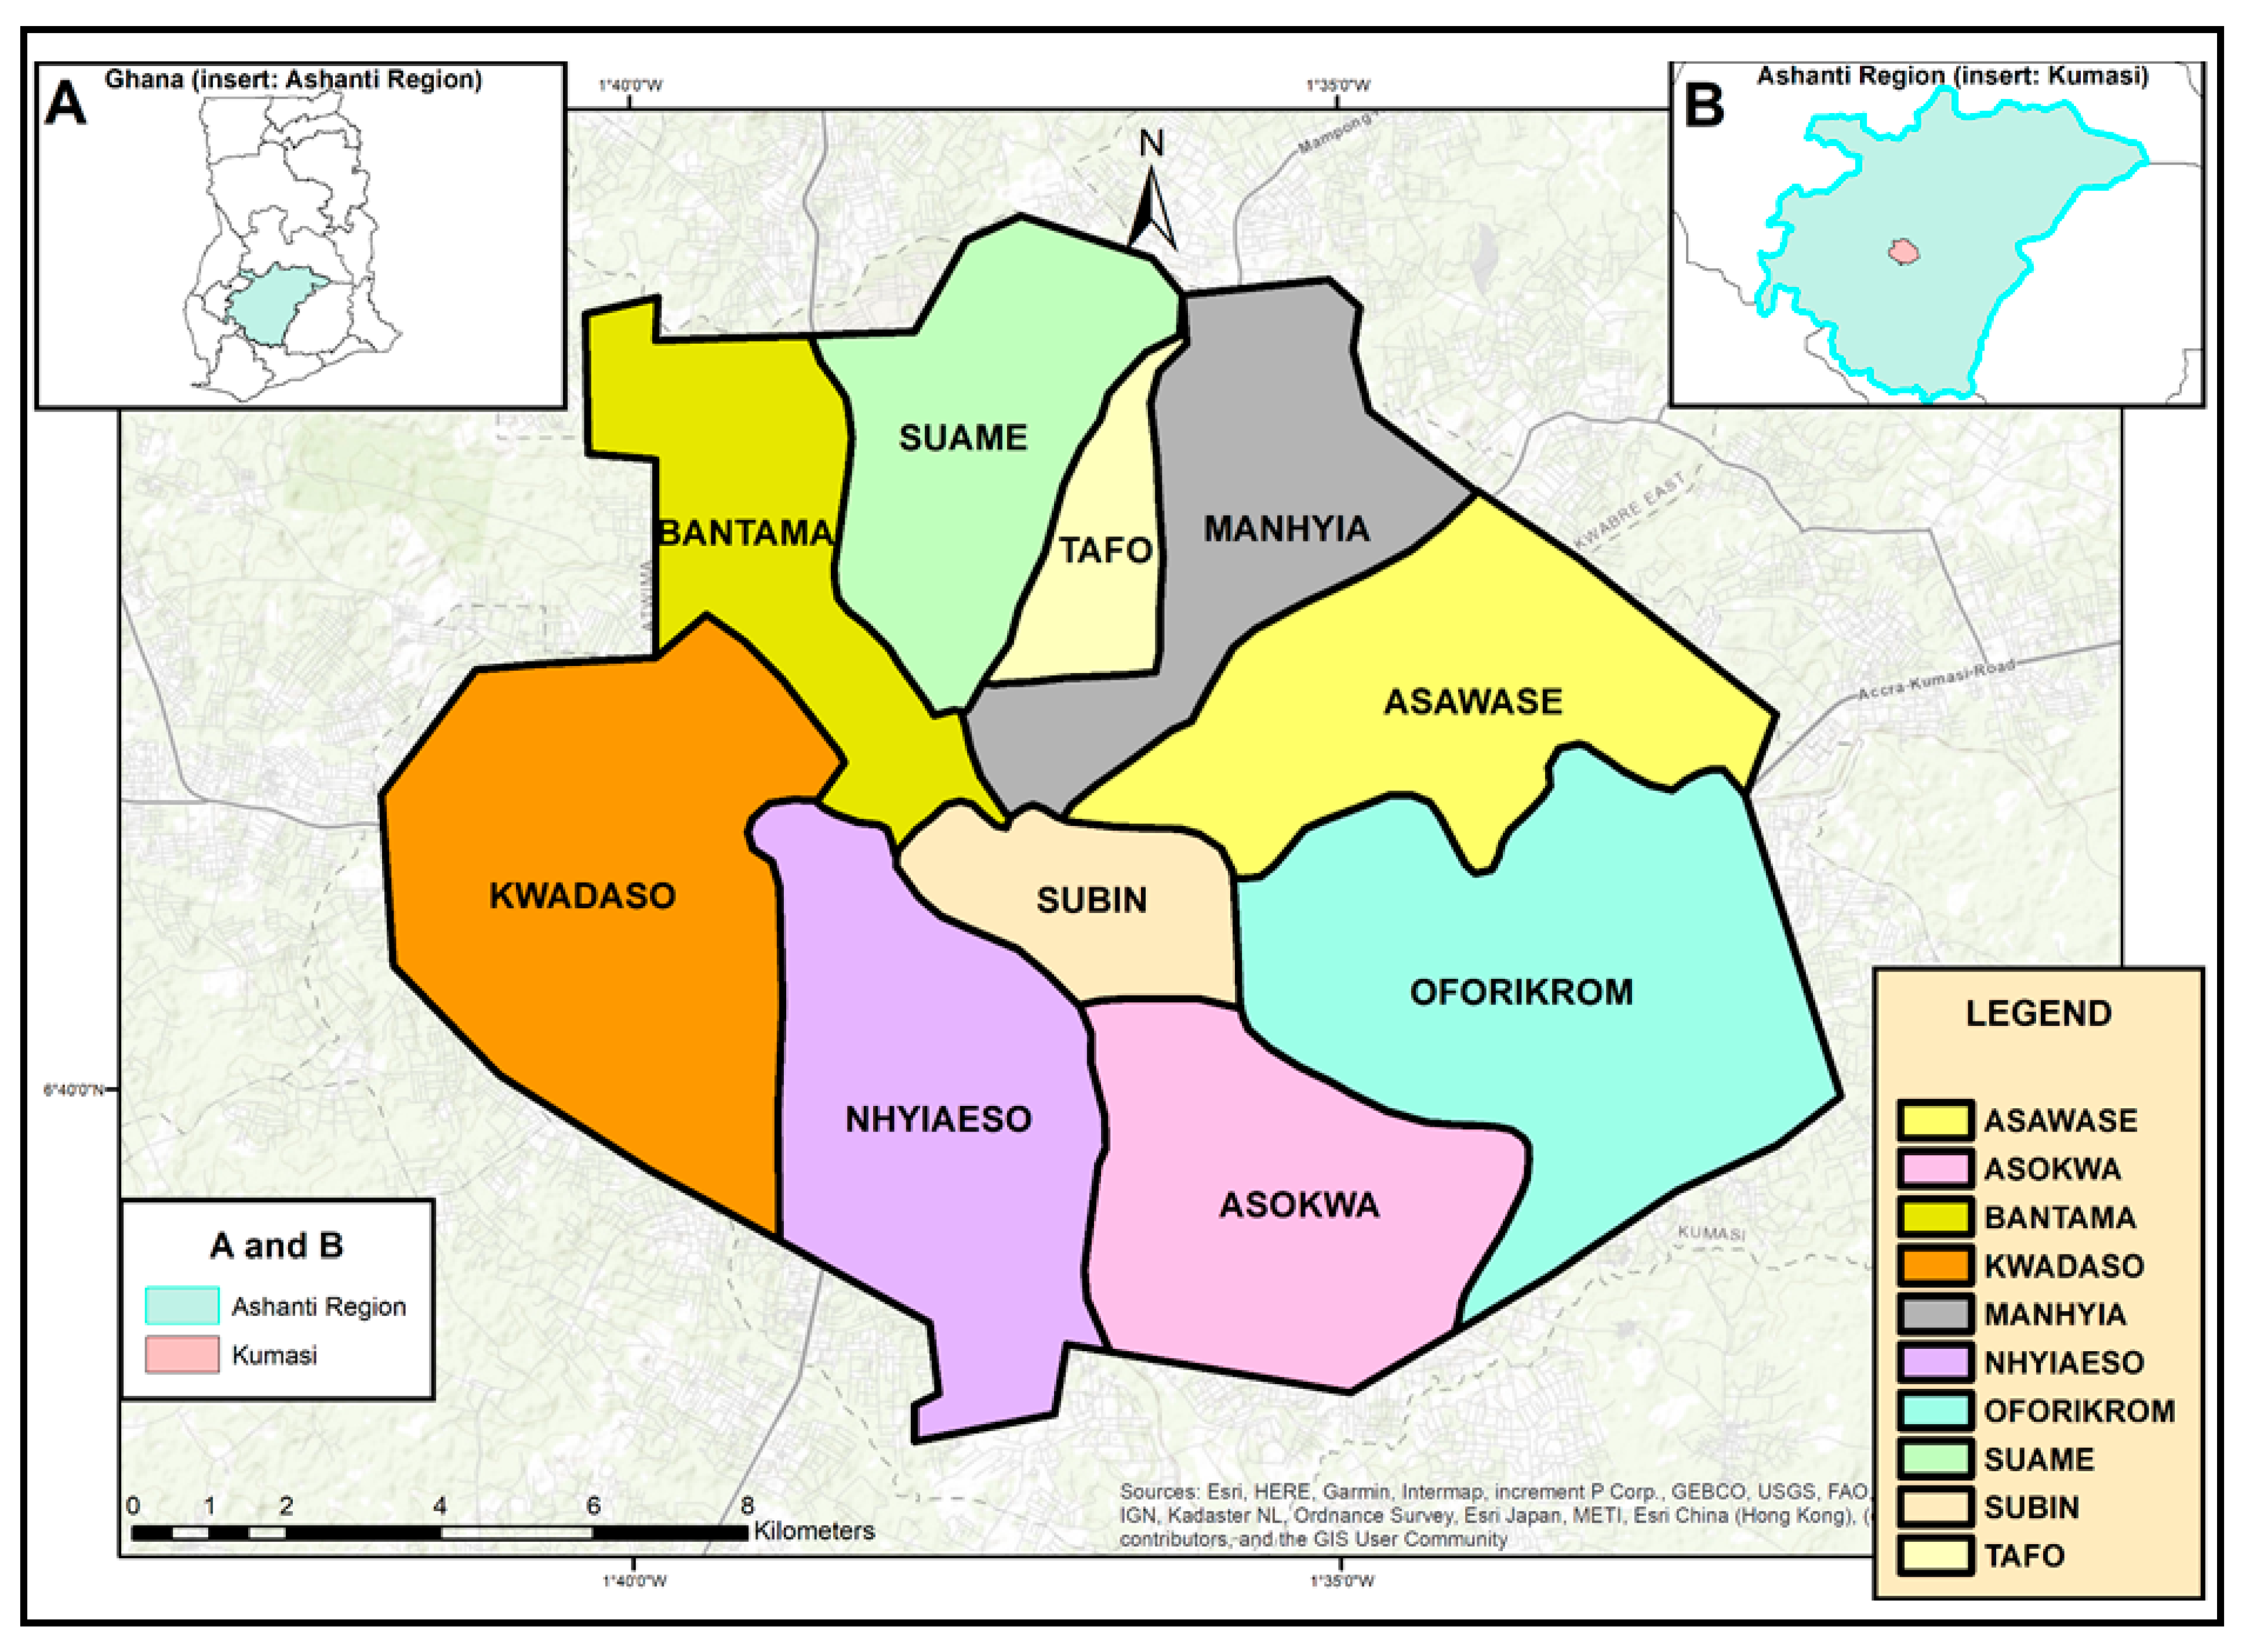
Kumasi has its centre coordinated as latitude 6°42′00.0″ N, longitude 1°37′12.0″ W and it is about 270 km north of the capital of Ghana [
17]. The city started with a concentric form and spread outwards from areas like Adum, Bompata and Krobo. Kumasi receives an annual mean rainfall of 1484 mm and has a bimodal rainfall distribution. The Kumasi Metropolitan Assembly (KMA) lies in the transitional forest zone and its major form of cultivation is urban agriculture [
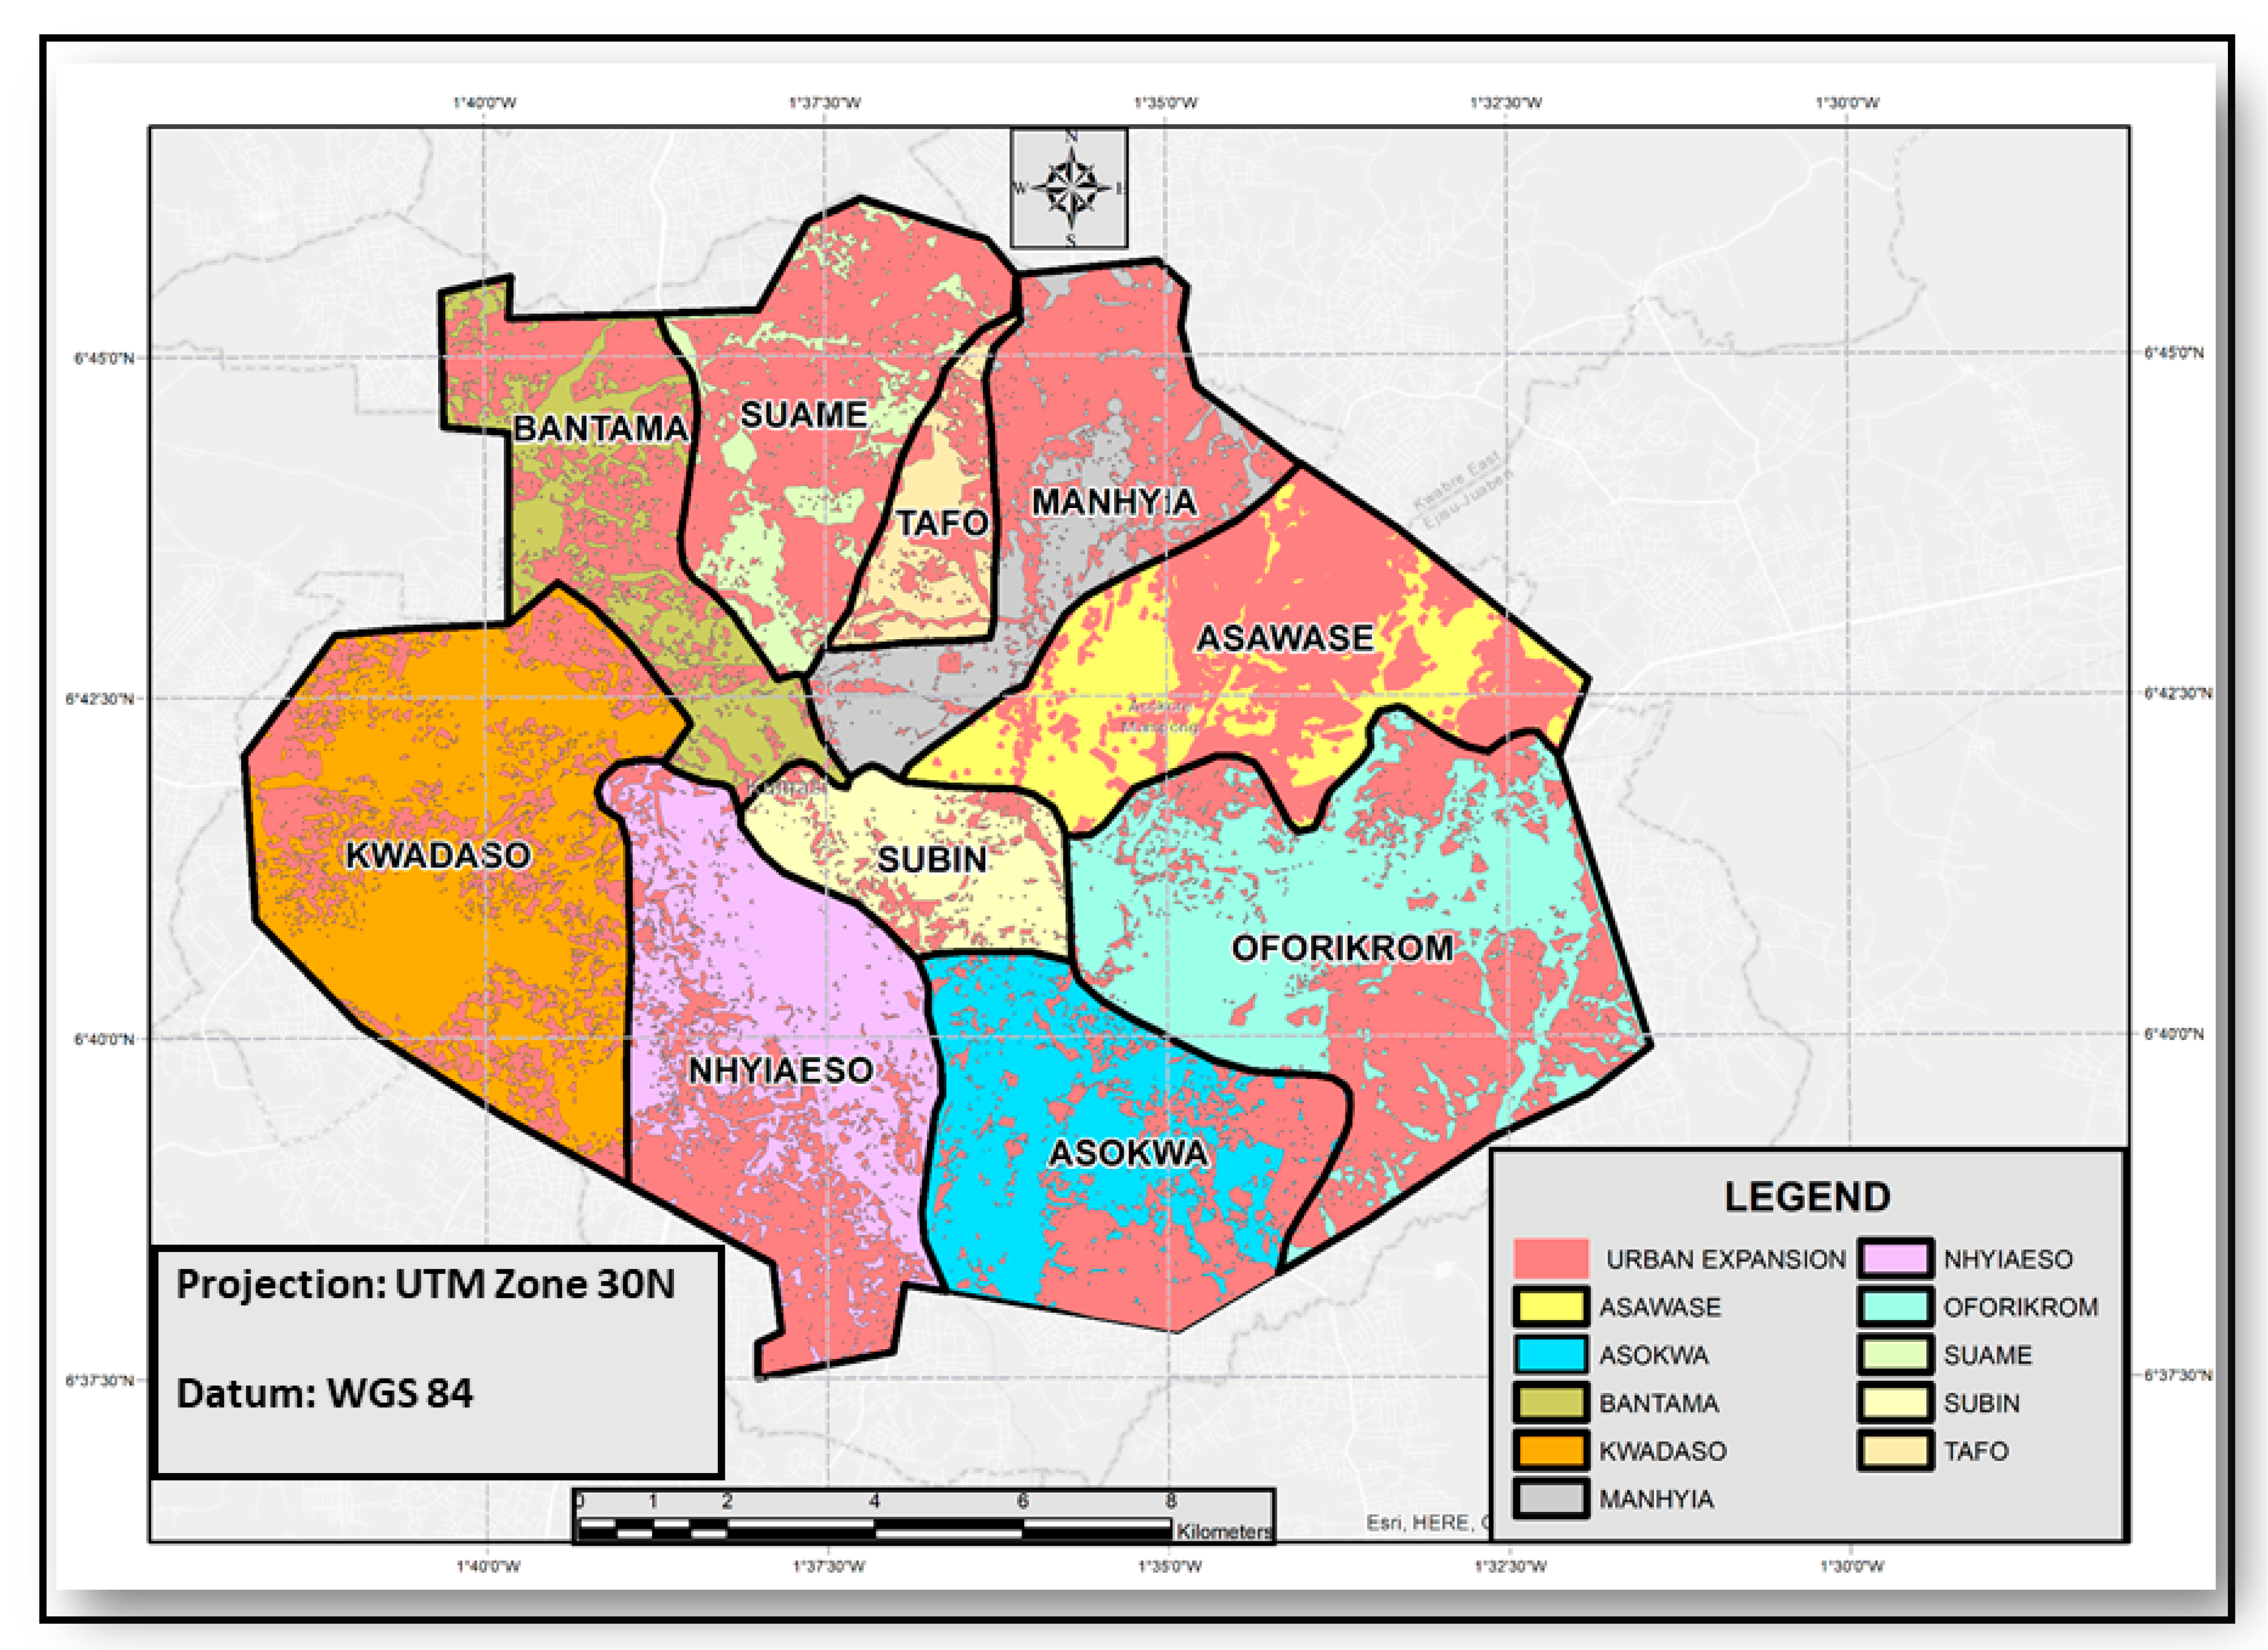
17]. The study area covered 10 sub-metropolitan areas with an approximate area of 194.38 square kilometers defined as the Kumasi Metropolis (
Figure 1).
Landsat TM/OLI satellite images were obtained based on availability, suitability, spatial and temporal resolutions as shown in
Table 1. The selected images were cloud-free and of the dry season. This explained the differences in the time step of the satellite images utilized in our study. The timespan ranged from 1986 to 2015.
The Landsat and 30 m Digital Elevation Model (DEM) images were obtained from the Earth Explorer platform of the United States Geological Survey (USGS). The year 2013 was selected because there was massive infrastructural development afterwards within the city that included the construction of the Kumasi Kejetia market in 2014. The Kejetia market comprised of 10,000 stores and stalls. This triggered the conversion of forestlands into other land uses. It was relocated to new sites within the city; thus, the idea of using ‘before’ and ‘after’ 2014 satellite imagery in our study.
The ancillary dataset used in the research included the Open Street Map (OSM), World Topographic Map (WTM) and the World Street Maps (WSM). These ancillary maps were cartographically projected to the World Geodetic System (WGS) 84. The OSM road network dataset was downloaded and extracted for Kumasi from the official website of Geofabrik. The WTM and the WSM were embedded as Base maps in the ArcGIS 10.7 (Environmental Systems Research Institute (ESRI)). The updated maps for September 2019 were used which was followed by ground-truthing in January 2020.
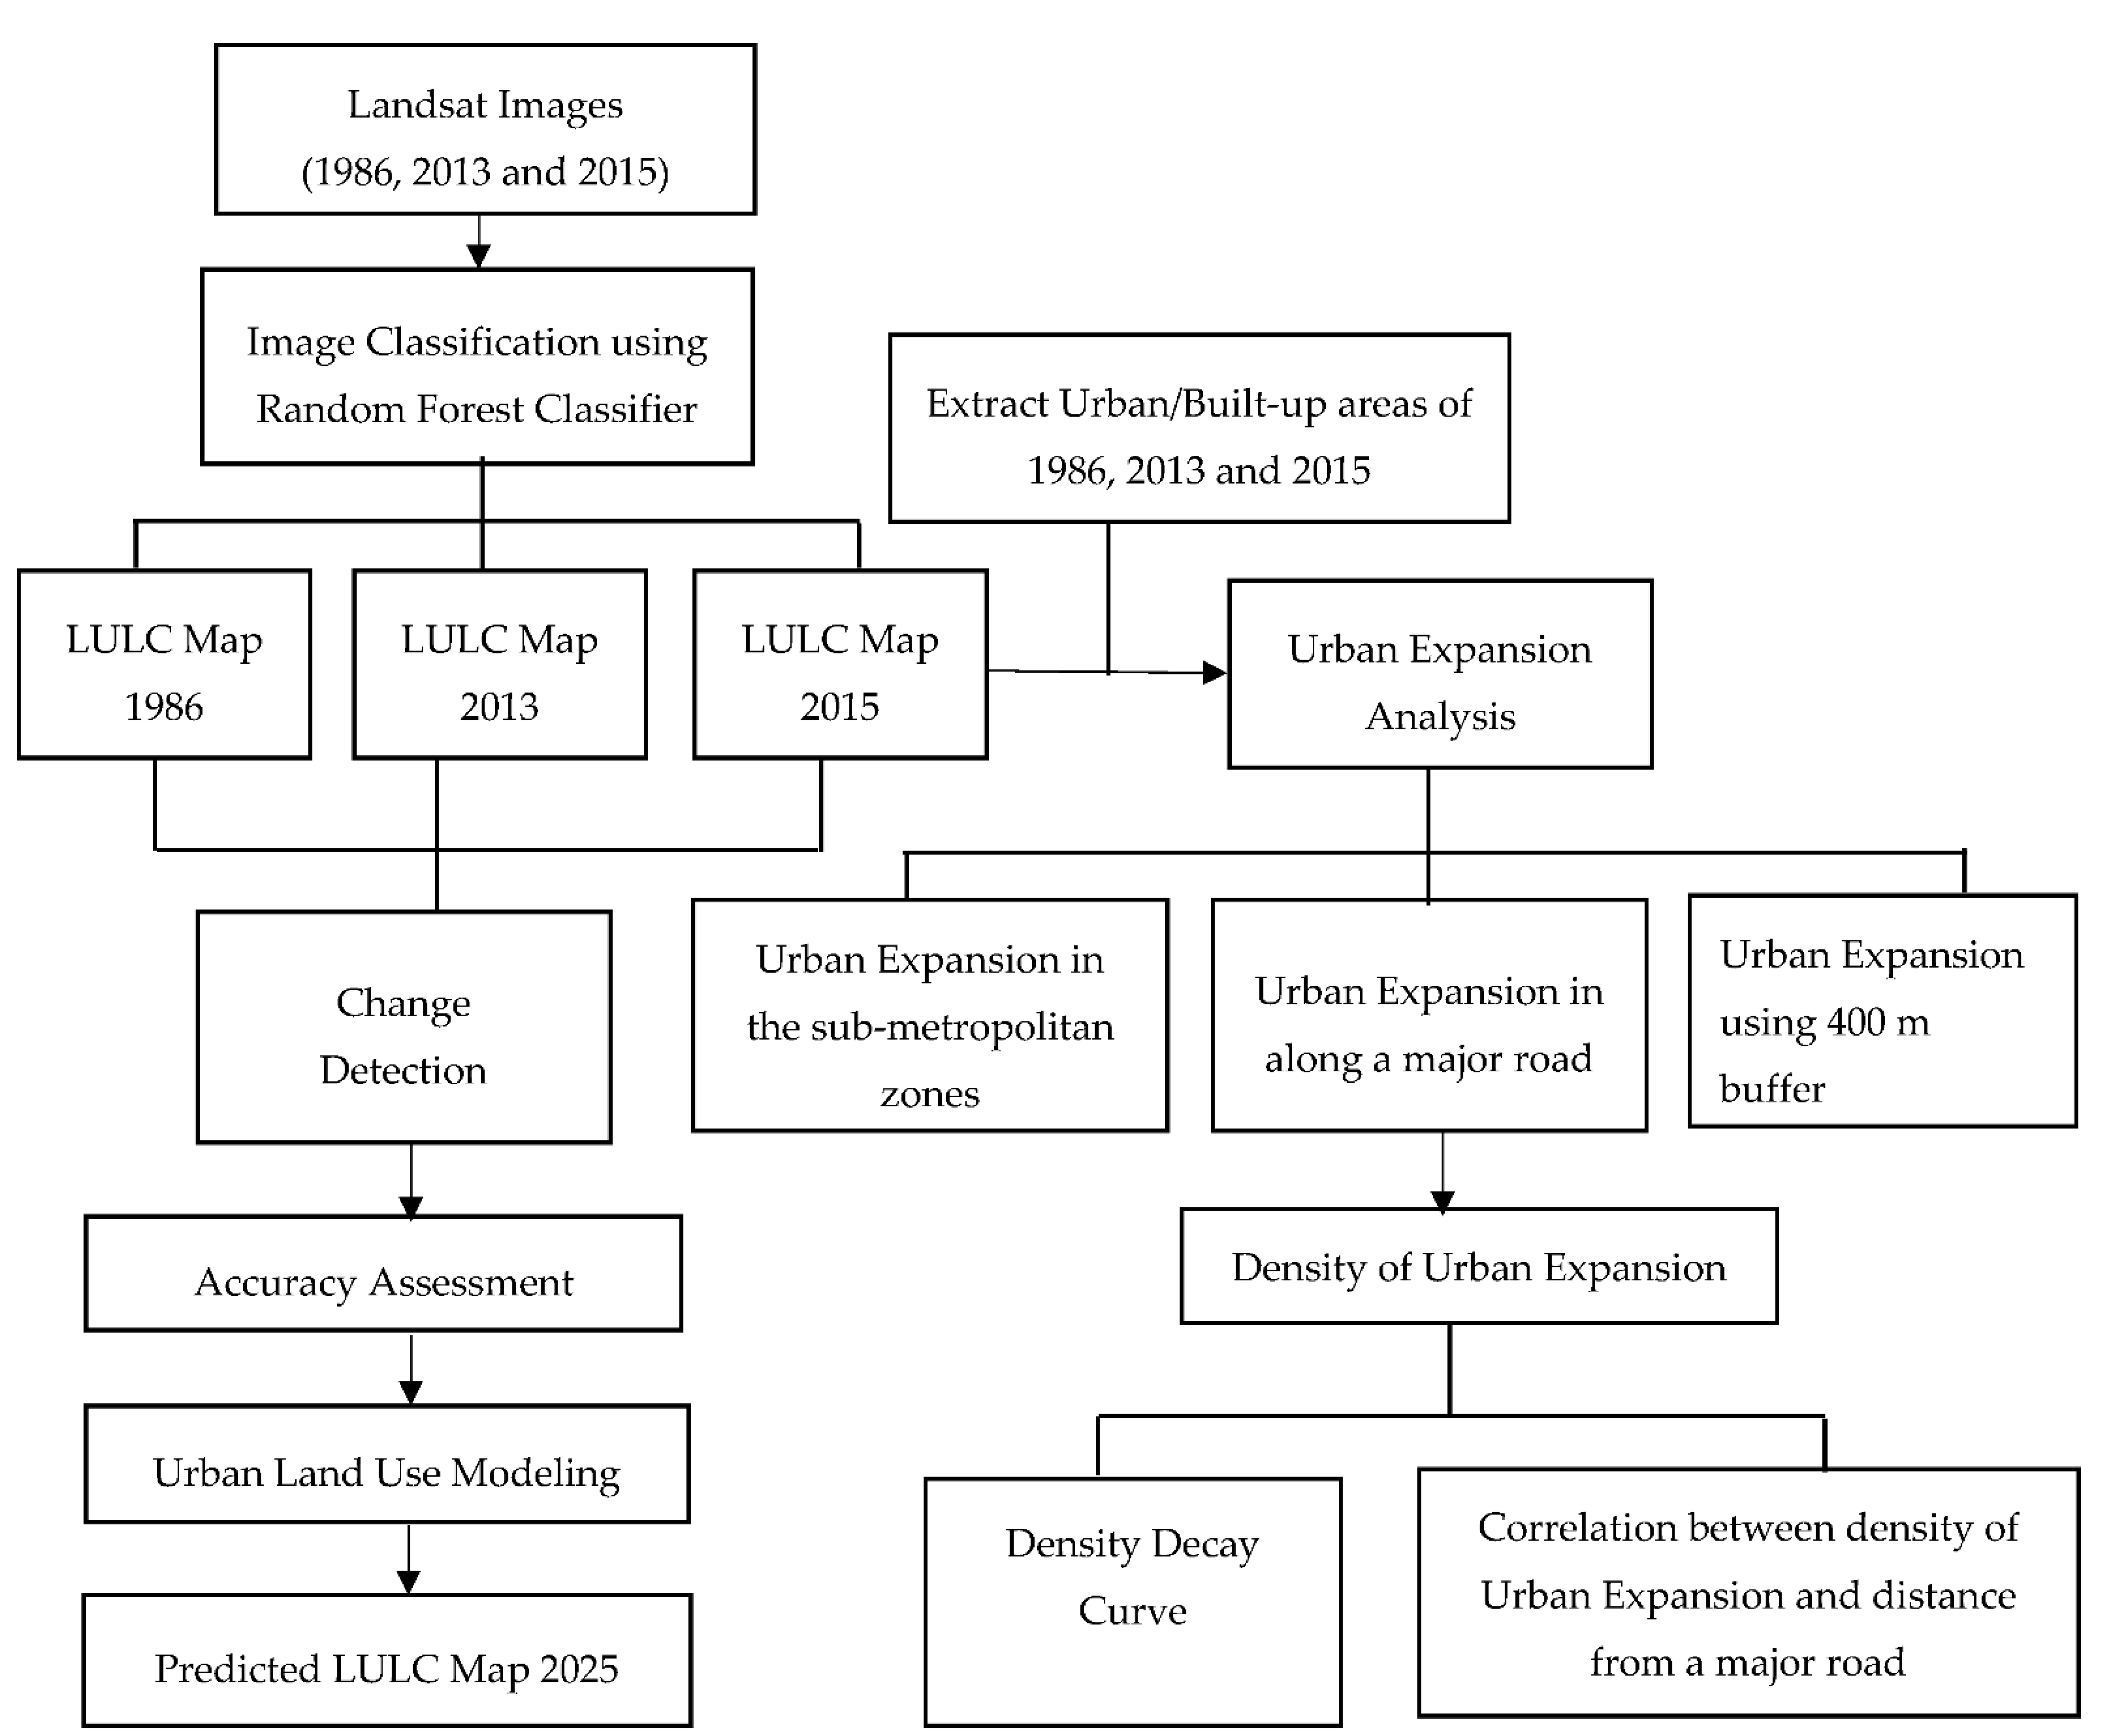
The general methodology used for the attainment of the aim of this study is shown in
Figure 2.
2.2. Satellite Image Processing and Classification
Landsat images were resampled using the Nearest Neighbor Algorithm. The Nearest Neighbor (NN) resampling method preserved the original values of the original image when compared to other methods [
47]. The images were projected using the WGS 84, Universal Transverse Mercator (UTM) Zone 30 N and Ghana Datum War Office. The area of interest was extracted from the World Topographical Map and the satellite images. The multiple bands (without the thermal and panchromatic bands) were stacked together to obtain a composite band. These operations were carried out in the ArcGIS 10.7.1 environment.
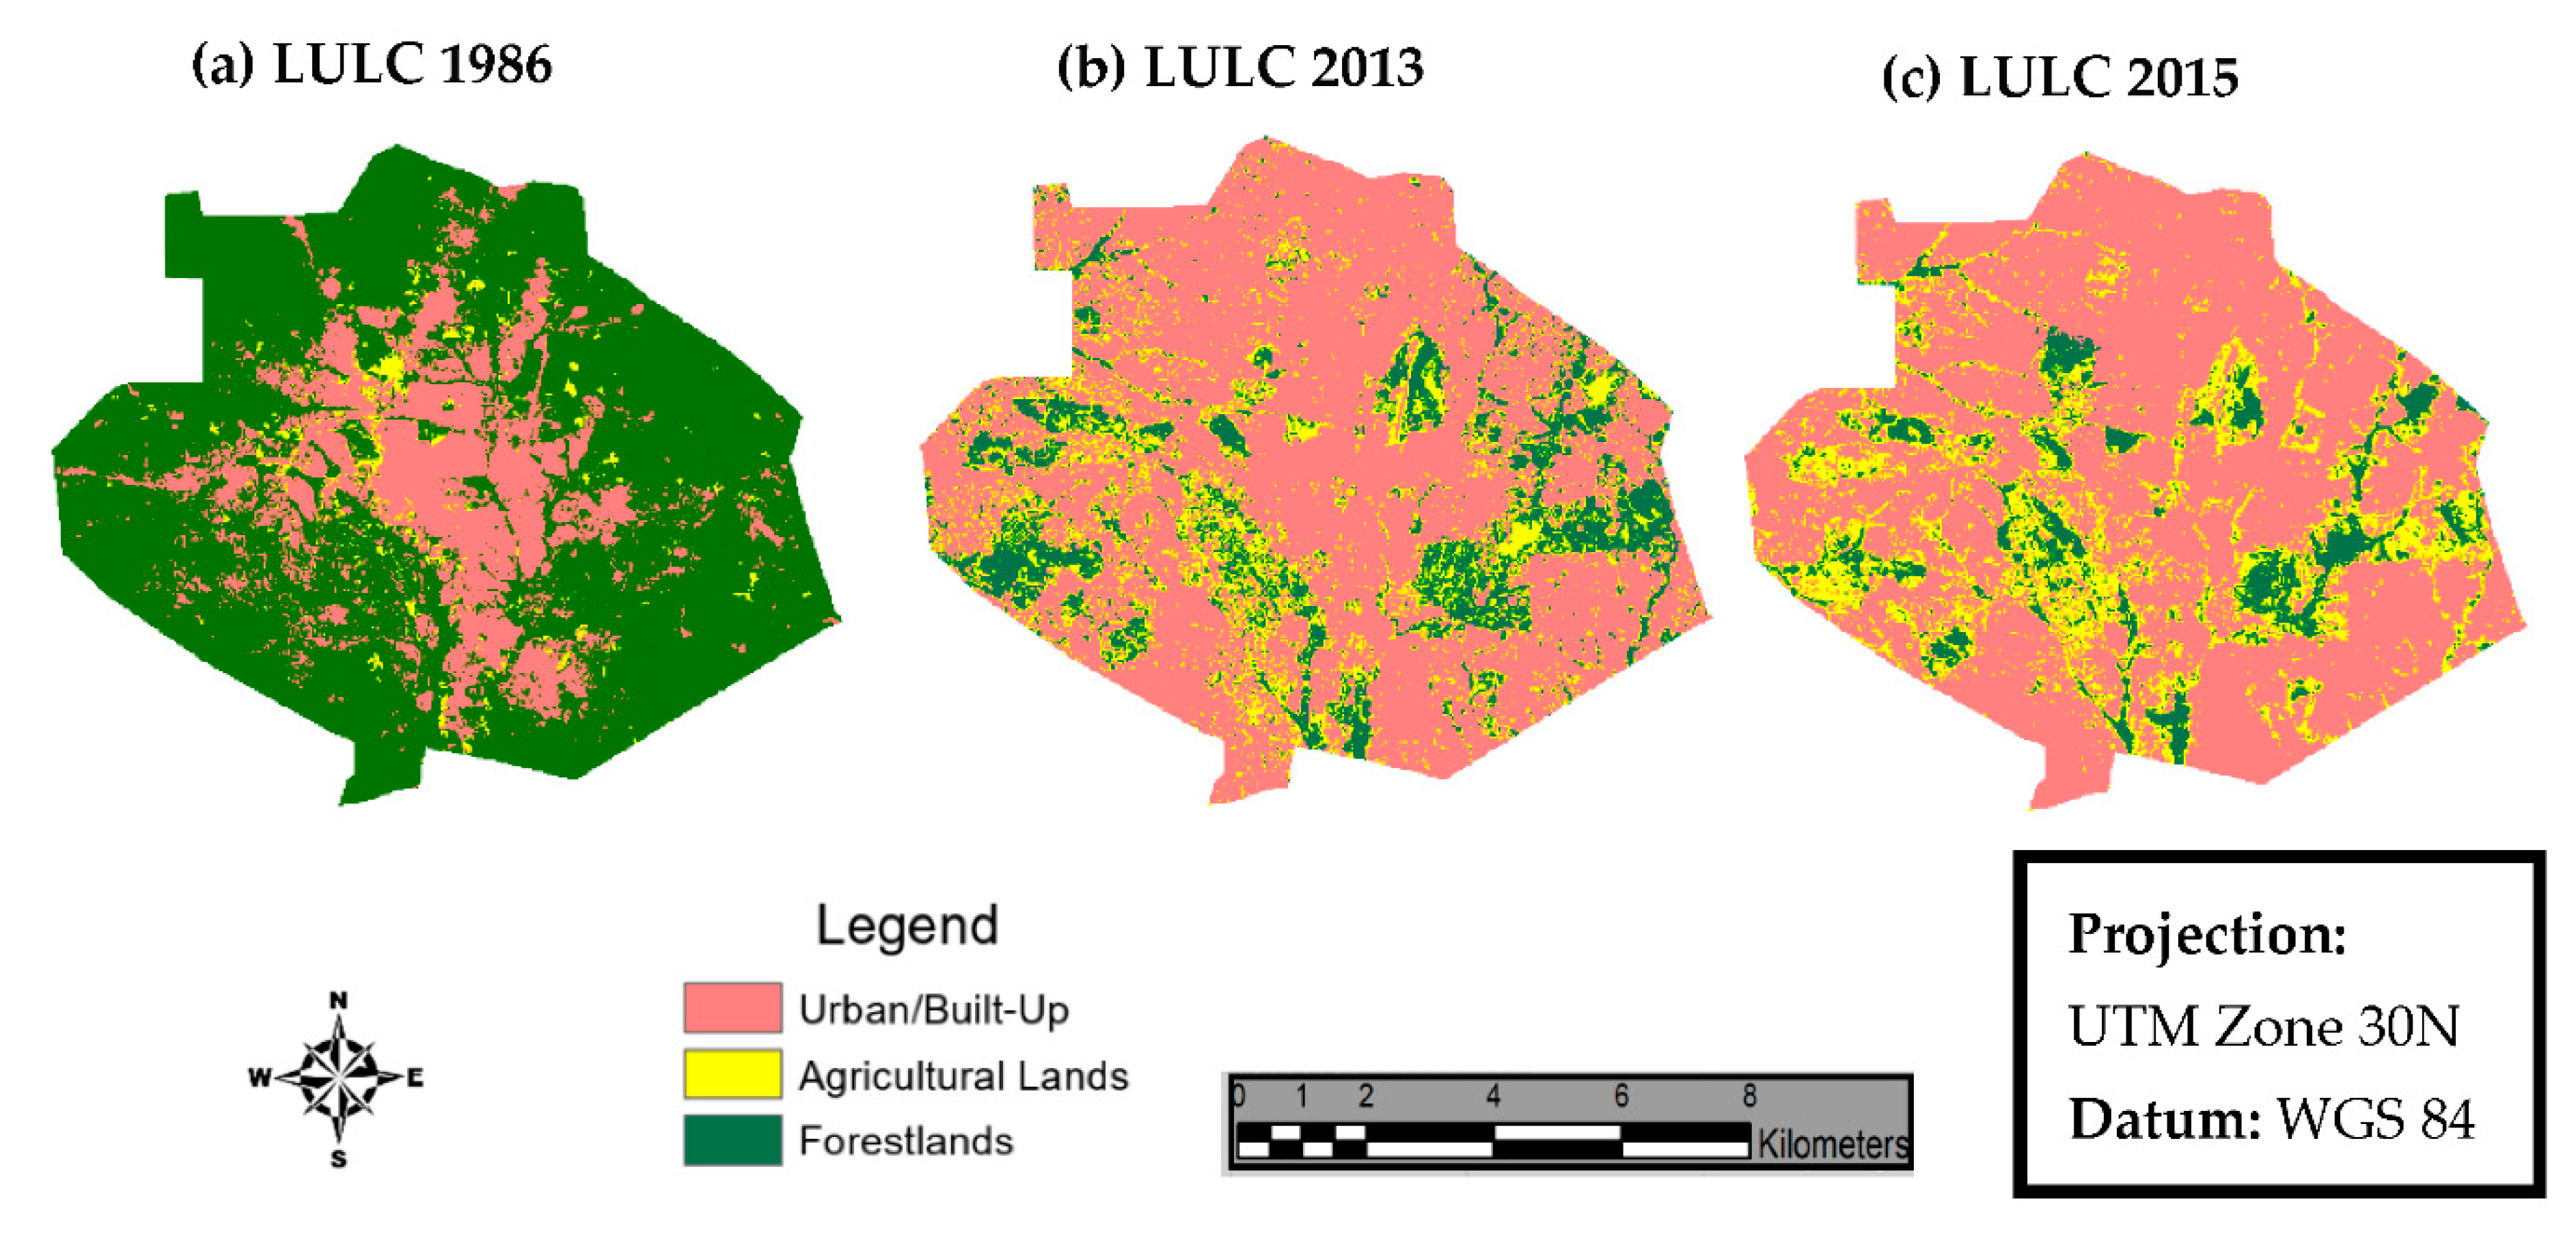
According to [
48], three broad LULC types were classified for the selected satellite images based on previous literature on LULC classification in Kumasi [
20,
42]. The classes were urban/built-up areas, agricultural, and forestlands. A concise description of the classes is illustrated in
Table 2.
Supervised classification was used for the identification, classification and evaluation of the LULC types. The Random Forest Algorithm was utilized to assign pixels to their respective classes since RF is not limited by statistical assumption [
49]. The satellite image classification was executed in the ArcGIS 10.7.1 environment.
2.3. Accuracy Assessment
The training samples representing the LULC types were evaluated especially for the 2015 Landsat satellite imagery. The ground control points totaled 150, comprising of 50 ground control points for each class (urban/built-up areas, agricultural and forestlands). This was evaluated and validated using GPS etrex 64s. The Open Street Map dataset, World Topographic Map, World Street Map and Google Earth Historical Imagery were referenced to aid in the identification of the LULC classes.
2.4. Urban Land Modeling and Validation
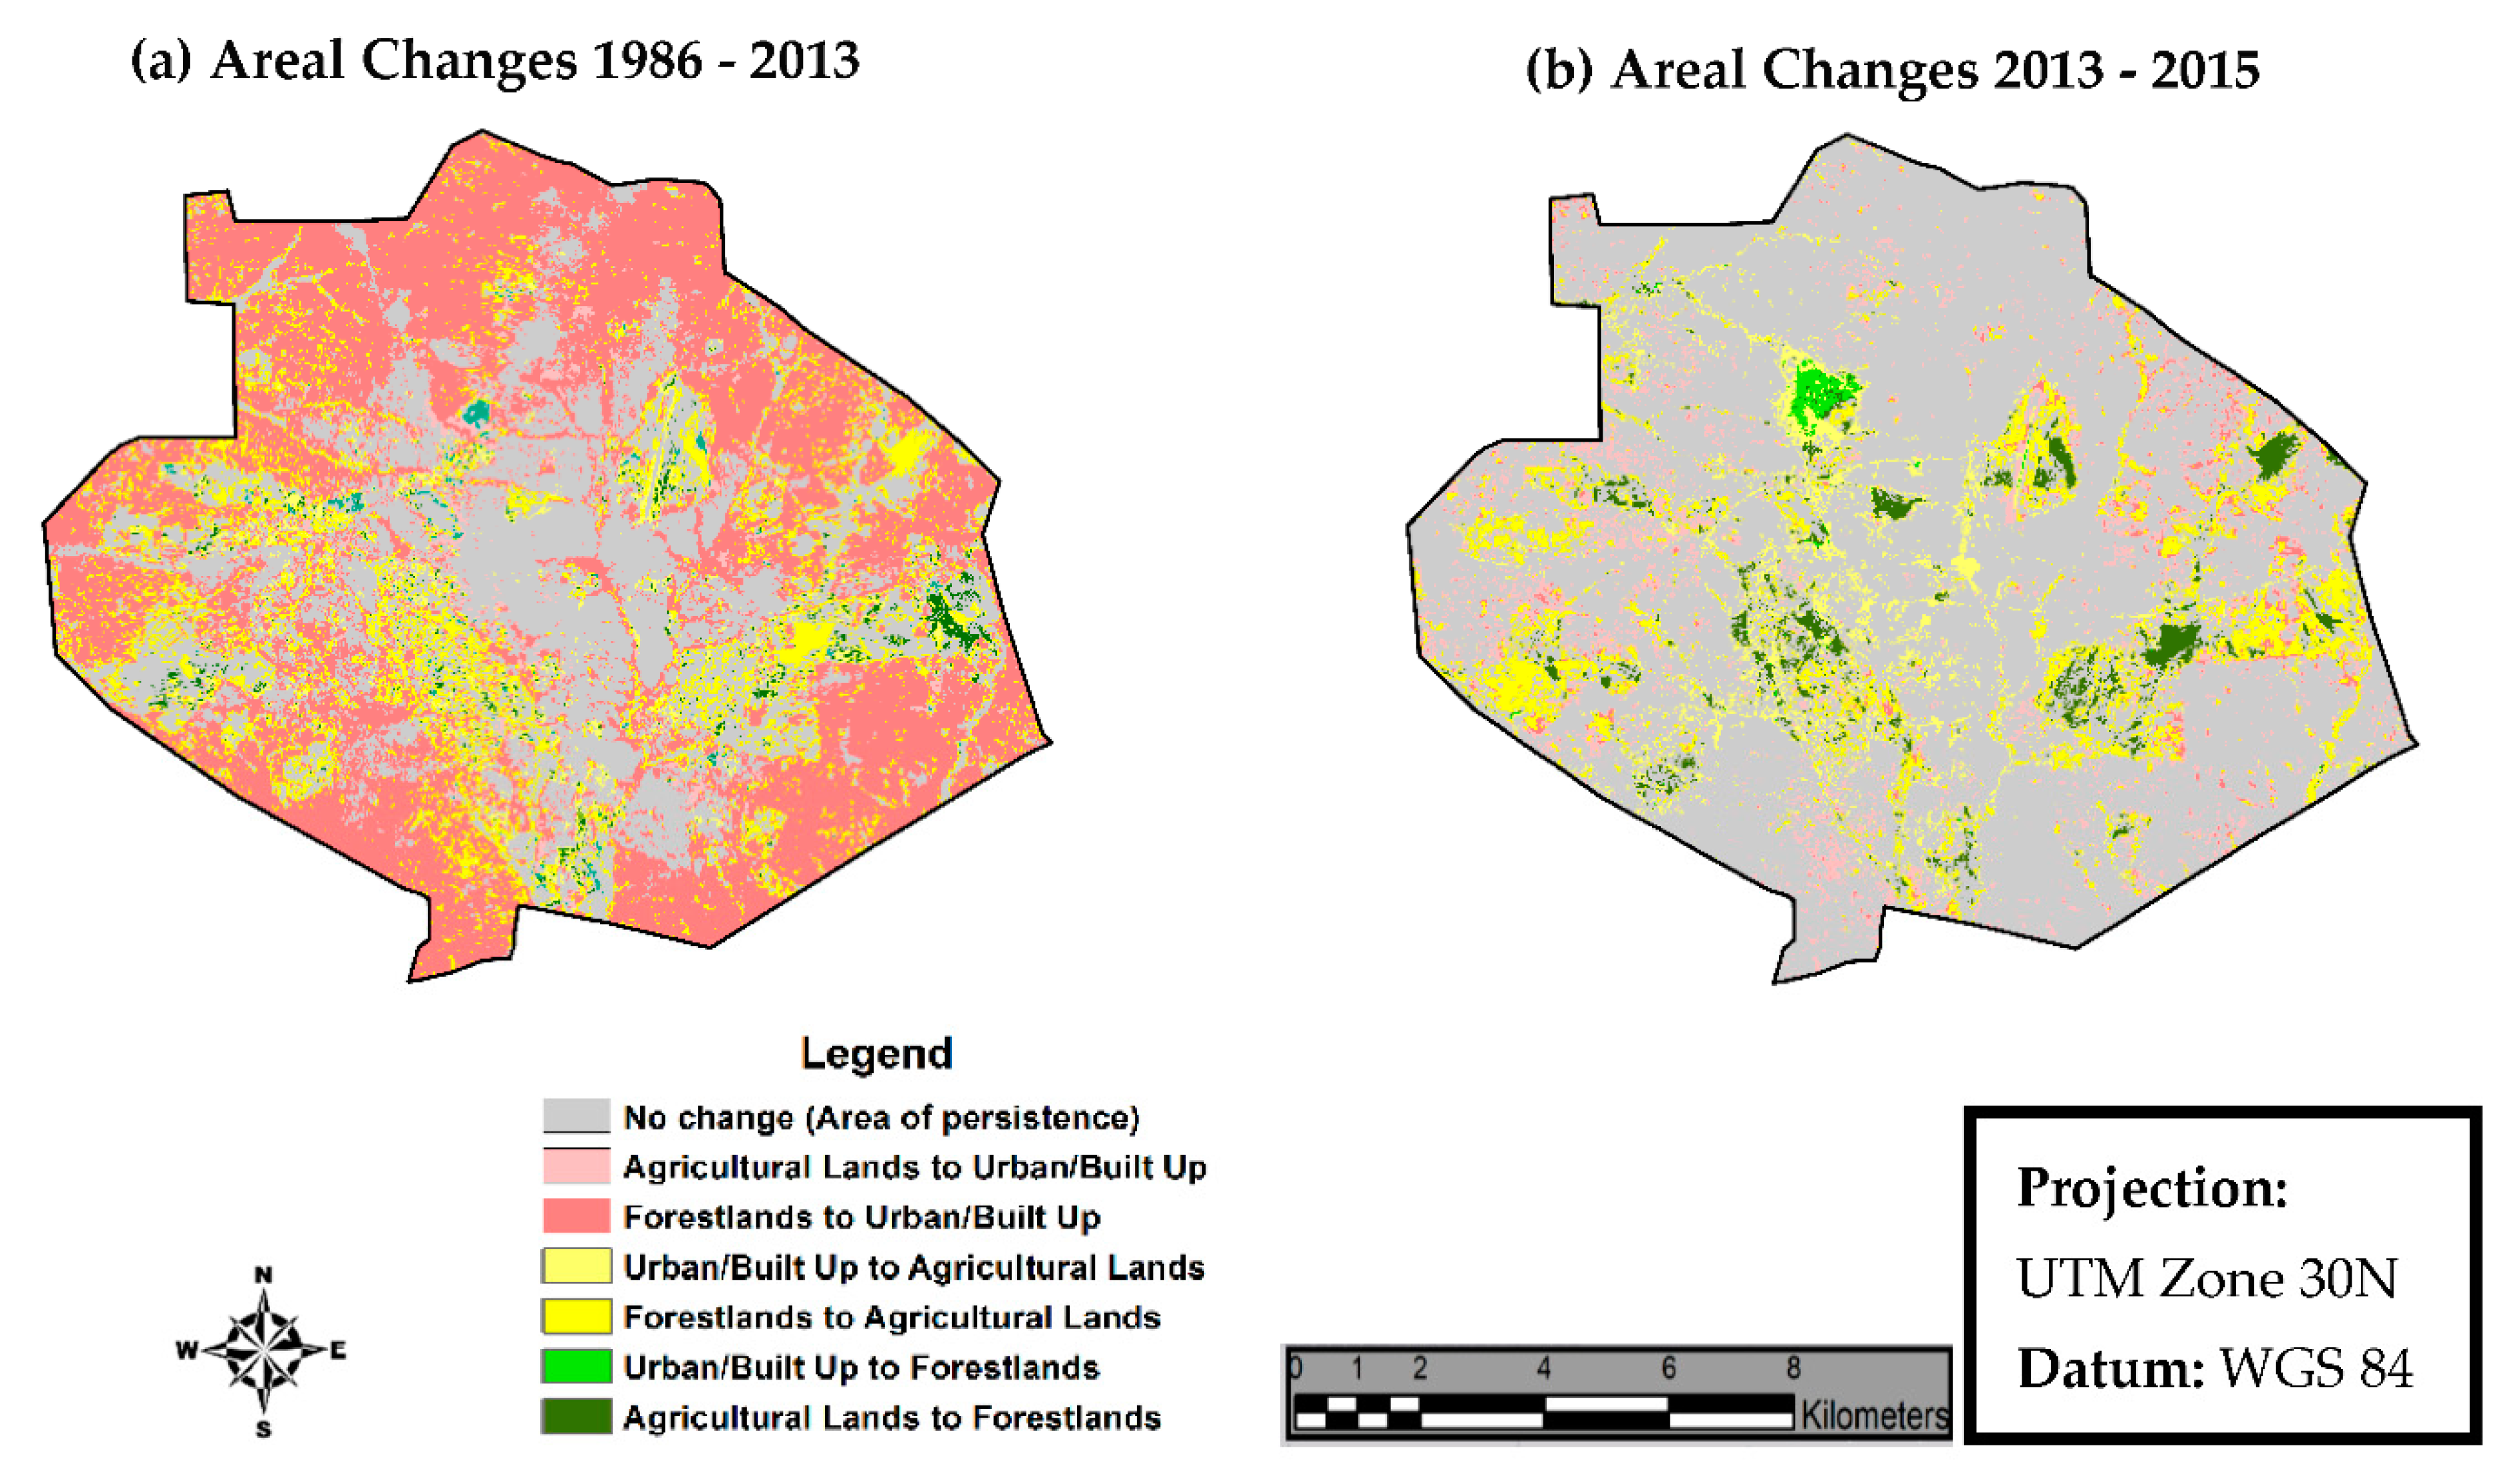
The Landsat images were initially checked to ensure the images were harmonized, and had the same spatial characteristics, legend and consistent categories. The temporal images of 1986 and 2013 were used as the base maps. The initial step was the change analysis. This was assessed between
t1 and
t2 of the two LULC maps. The ‘from–to’ identified the transitions from a particular LULC type to another. The drivers of urban expansion considered were slope, elevation, distance to urban/built-up areas and distance to a main road. These were selected based on a review of previous studies [
30,
50].
The slope and elevation were extracted from the Digital Elevation Model and were incorporated to account for the geophysical factors. In 1986, the distance to urban/built-up areas was set as a dynamic variable. The distance to urban variable indicated the closeness of pixels to existing urban/built-up areas in 2013. The modeling of the distance to urban/built-up areas was set up as a dynamic variable which indicated that the distance to urban pixels change with time.
The Multi-Layer Perceptron (MLP) was utilized in the modeling process. The neural network was trained to build a model utilizing the information obtained from the data. This was to enable the network to hypothesize and forecast the outputs. The weights were defined in the training phase before the prediction. The error in the network was reduced by adjusting the weights between the nodes (using a proportion of the input data), using the backpropagation algorithm. After iterations, the calculation of the error that spread across the neural network was done. The model was trained using sample pixels that experienced transitions from one land-use type to another, and the pixels that remained unchanged in the two LULC maps. The sample size was equivalent to the least number of pixels that changed from one land-use type to another. The chosen pixels were assigned to two groups; one group to train the model and the other group to test or validate the accuracy of the model.
Markov Chain Analysis was used to model the quantitative alterations in each transition for the projected year (2025). The Markov chain was multi-directional and a specific LULC was theoretically changed into or from other LULC [
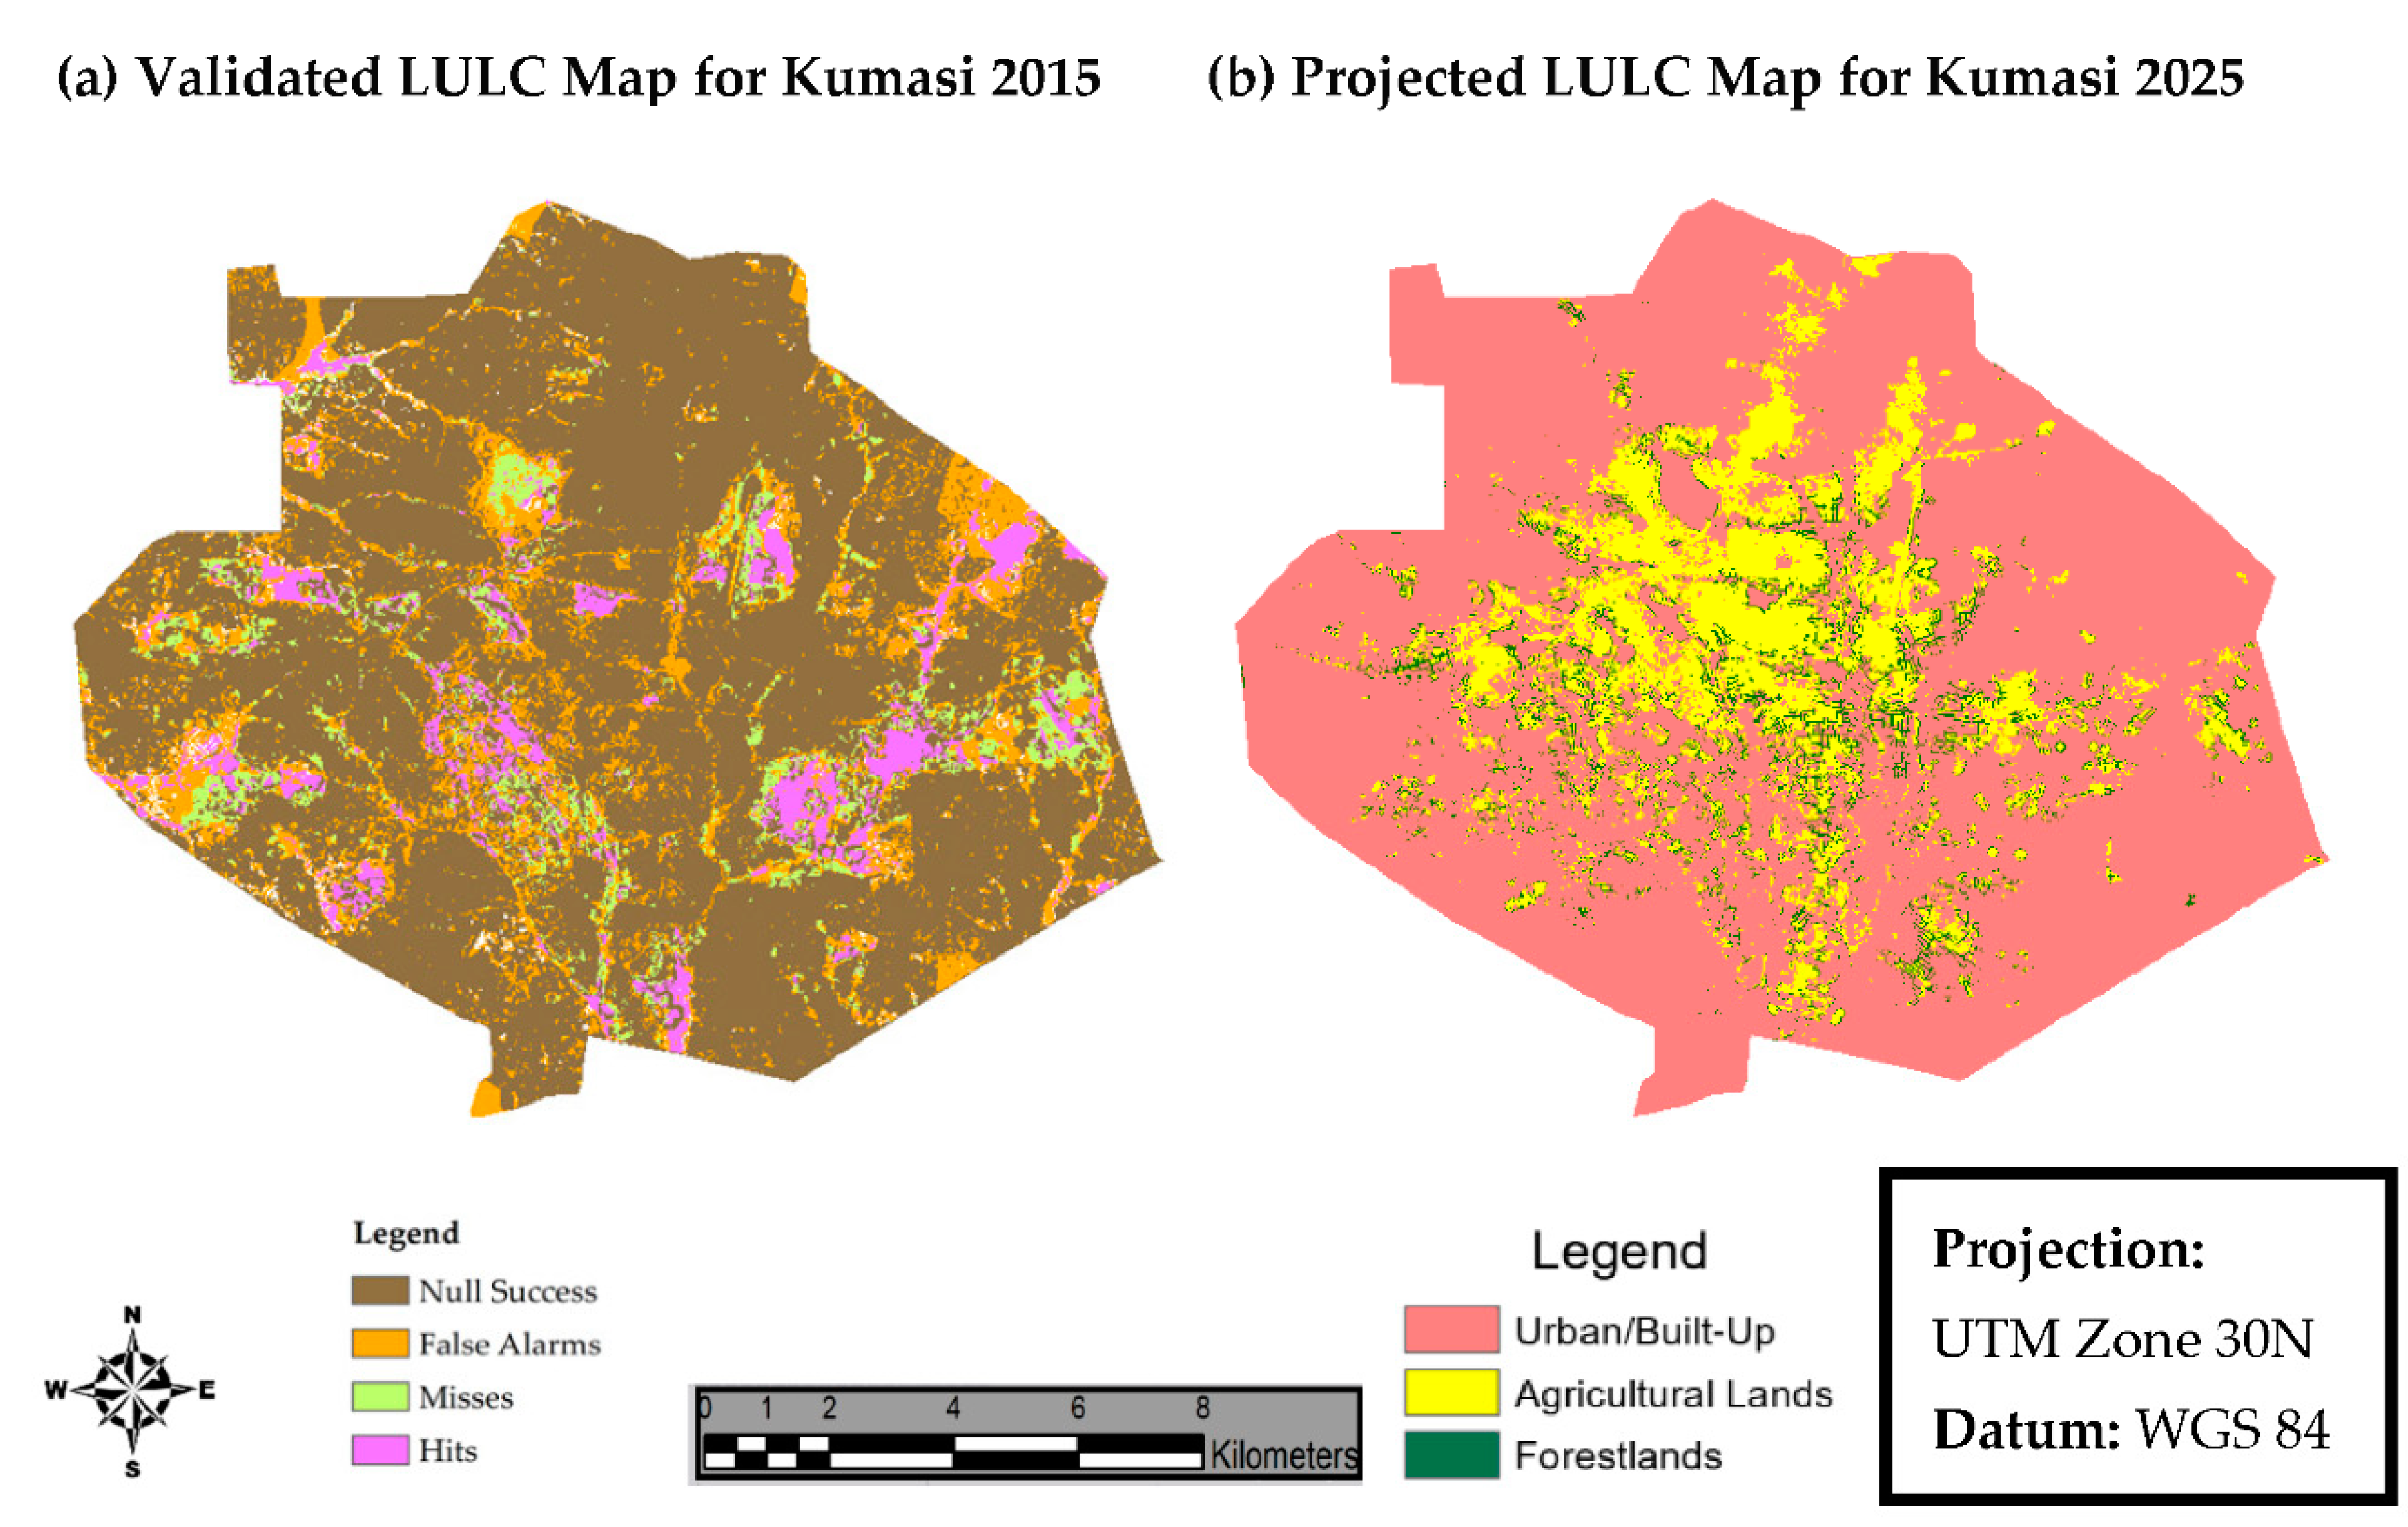
51]. The change analyses and the transition potential maps produced were used to forecast the future scenario for 2015. The predicted map with the same LULC categories as the input maps was generated.
Validation enabled the determination of the quality of the forecasted map for 2015 compared to the real 2015 LULC map. Visual and statistical approaches were used in the validation of the models [
52]. This resulted in a map consisting of four major groups:
- i
‘Hits’ meant the changes in the predicted model were correct.
- ii
‘False alarms’ signified the model predicted changes but remained unchanged.
- iii
‘Misses’ indicated the model predicted no changes, but changes occurred.
- iv
‘Null success’ meant the model predicted no changes and remained stable.
Finally, after verification, the predictive ability of the model was assessed. Simulation was done to forecast the LULC map for 2025 utilizing the 2013 and 2015 LULC maps as the base maps. The entire procedure was repeated to obtain the projected map of 2025. Urban land modeling and validation were executed using the Terrset software.
2.5. Urban Expansion Analysis
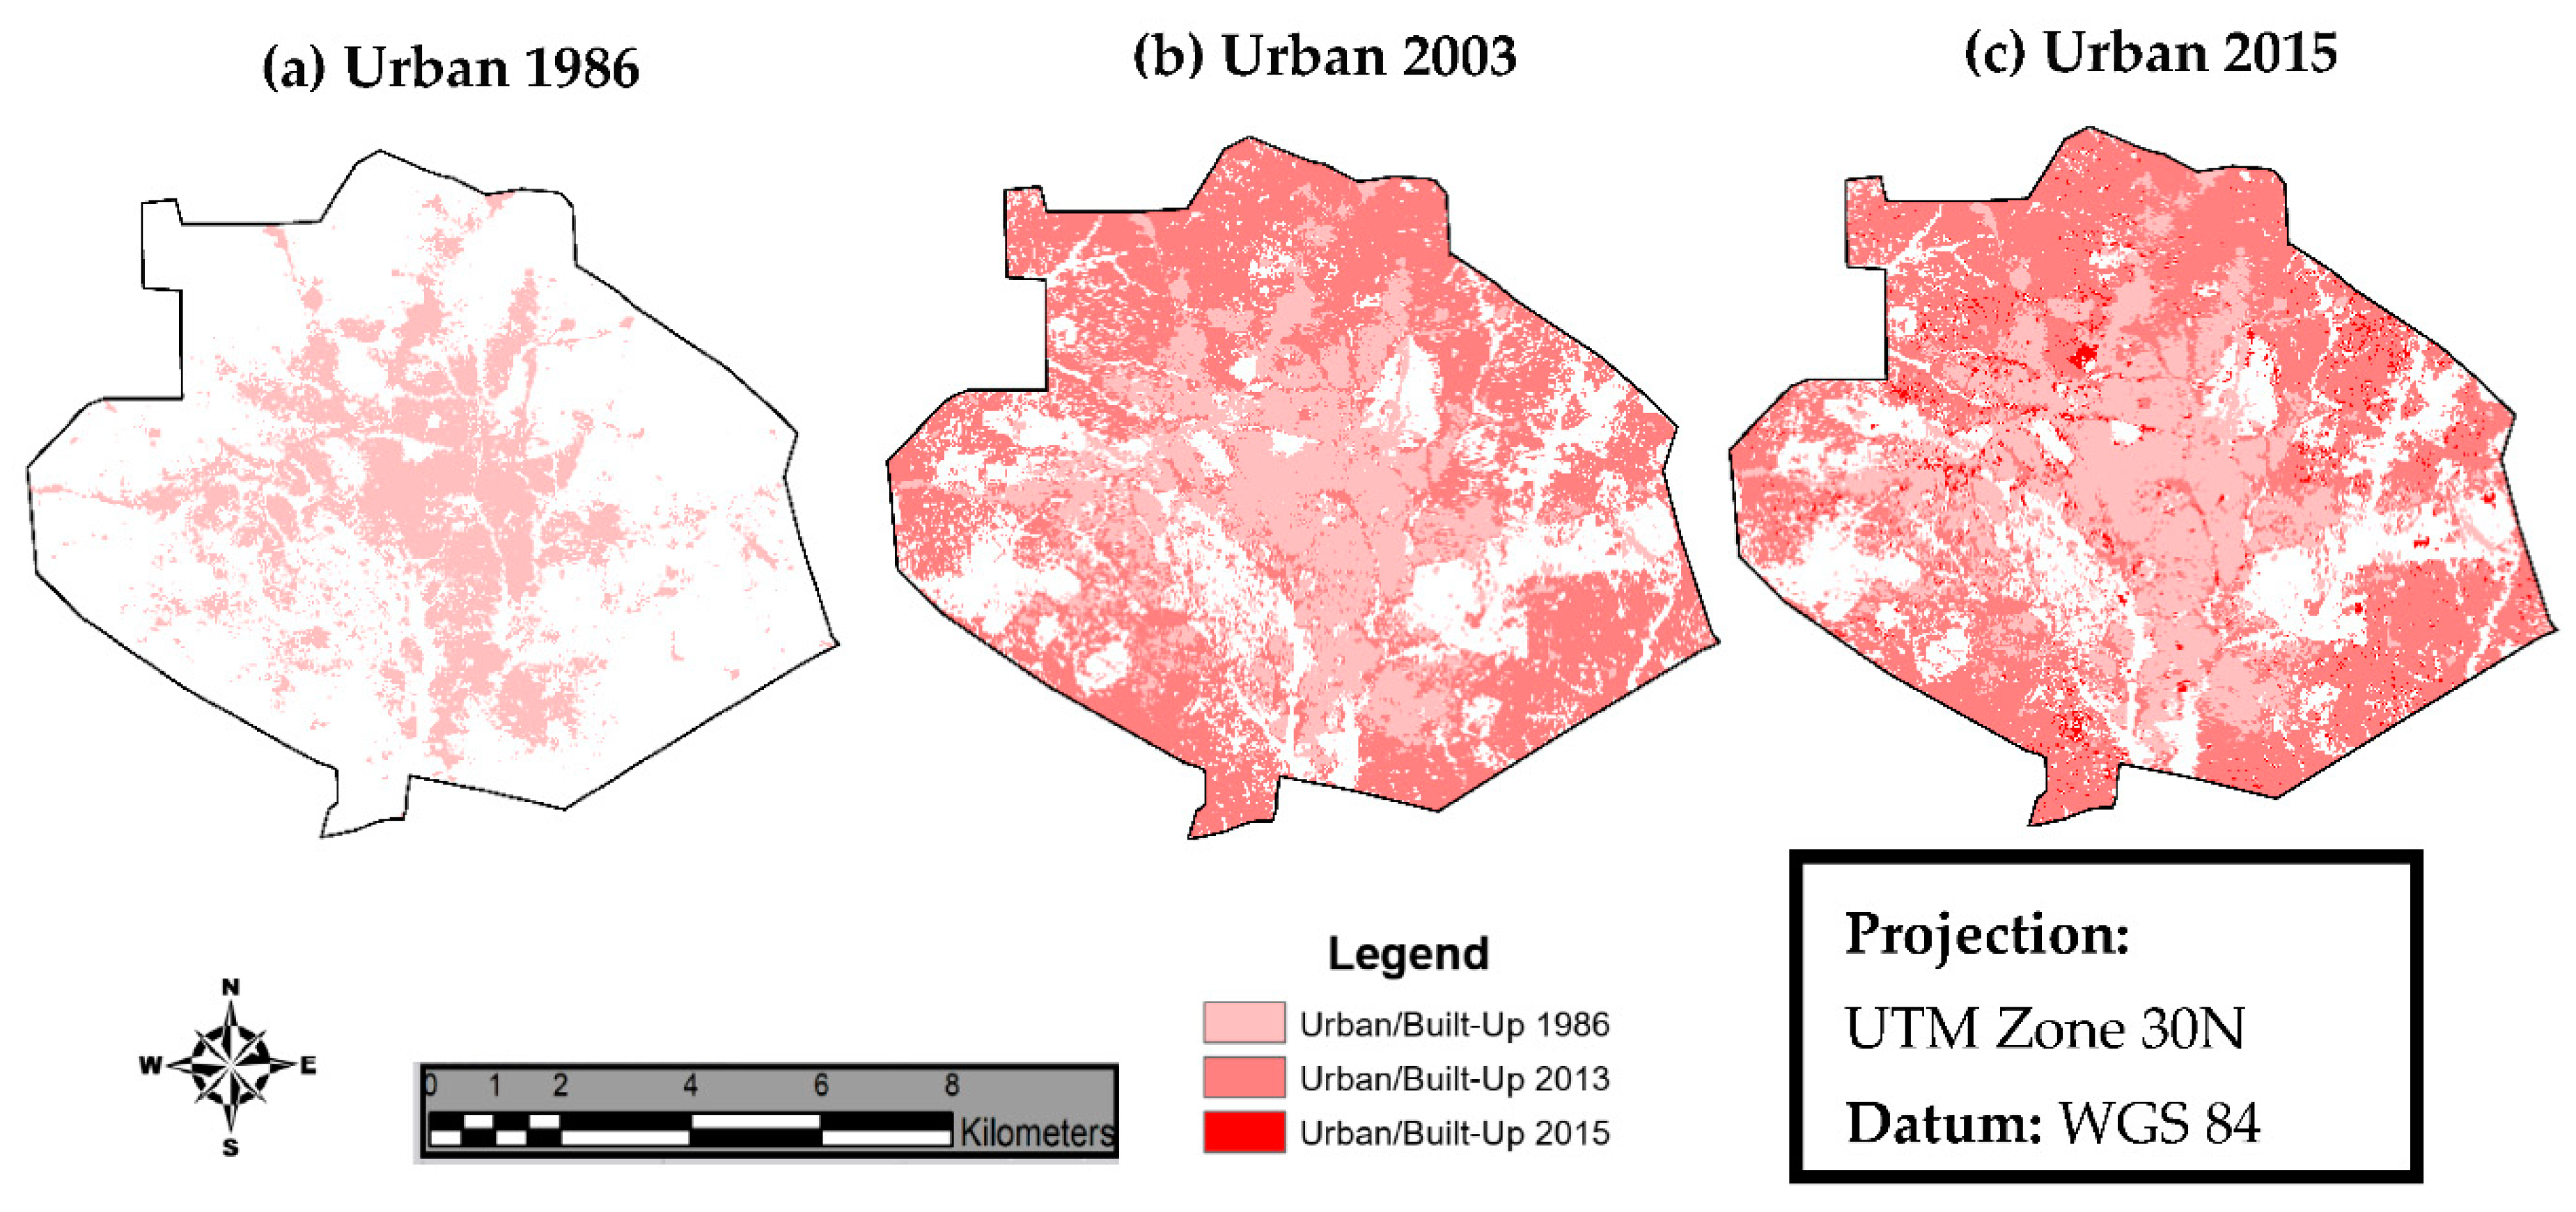
The urban/built-up areas were extracted from the satellite imagery to analyze the rate and pattern of urban expansion. Overlays were done to generate the general overview of urban/built-up areas and in the various sub-metropolitan zones.
The process of urban expansion showed a relation to geographic features such as roads. It was evident that trade and commerce were rudimentary reasons for the establishment of cities in Ghana. For instance, markets, banks and other service providers set up their firms in proximity to major roads in Ghana [
14] as high capacity urban roads face larger amounts of land use and urban expansion [
53]. Again, it is asserted that proximity to major roads is a vital factor for urban expansion in the works of [
54,
55,
56] on Hangzhou in China, North-Eastern Ohio Region in the United States of America, and Sekondi-Takoradi in Ghana. This situation was synonymous with that in Kumasi. The research, therefore, adopted this strategy to investigate urban expansion along the Kumasi–Accra road. The stretch of this road was 19 km in the study area. This road was chosen as it has high prominence in Ghana and lies in the urban/built-up areas in Kumasi.
The urban expansion maps were converted from raster format into a vector form and were overlaid with the Kumasi–Accra road. Within a 4 km buffer, a 400 m buffer interval was used. This research utilized the 400 m interval buffer based on previous literature [
56] and was also adopted as a pragmatic approach. The buffers were commutatively created around the Kumasi–Accra road. Each of the buffers invented was overlaid with the urban expansion feature to compute total urban expansion present in each buffer. These map conversions and buffer creation operations were executed using the ArcGIS 10.7.1 software.
2.6. Density of Urban Expansion
This was computed to ascertain how dense the urban/built-up areas are in each of the created buffers and was used in the overall computation of the density decay function.
The Density of Urban Expansion in each buffer zone was computed using the formula as adopted from [
56];
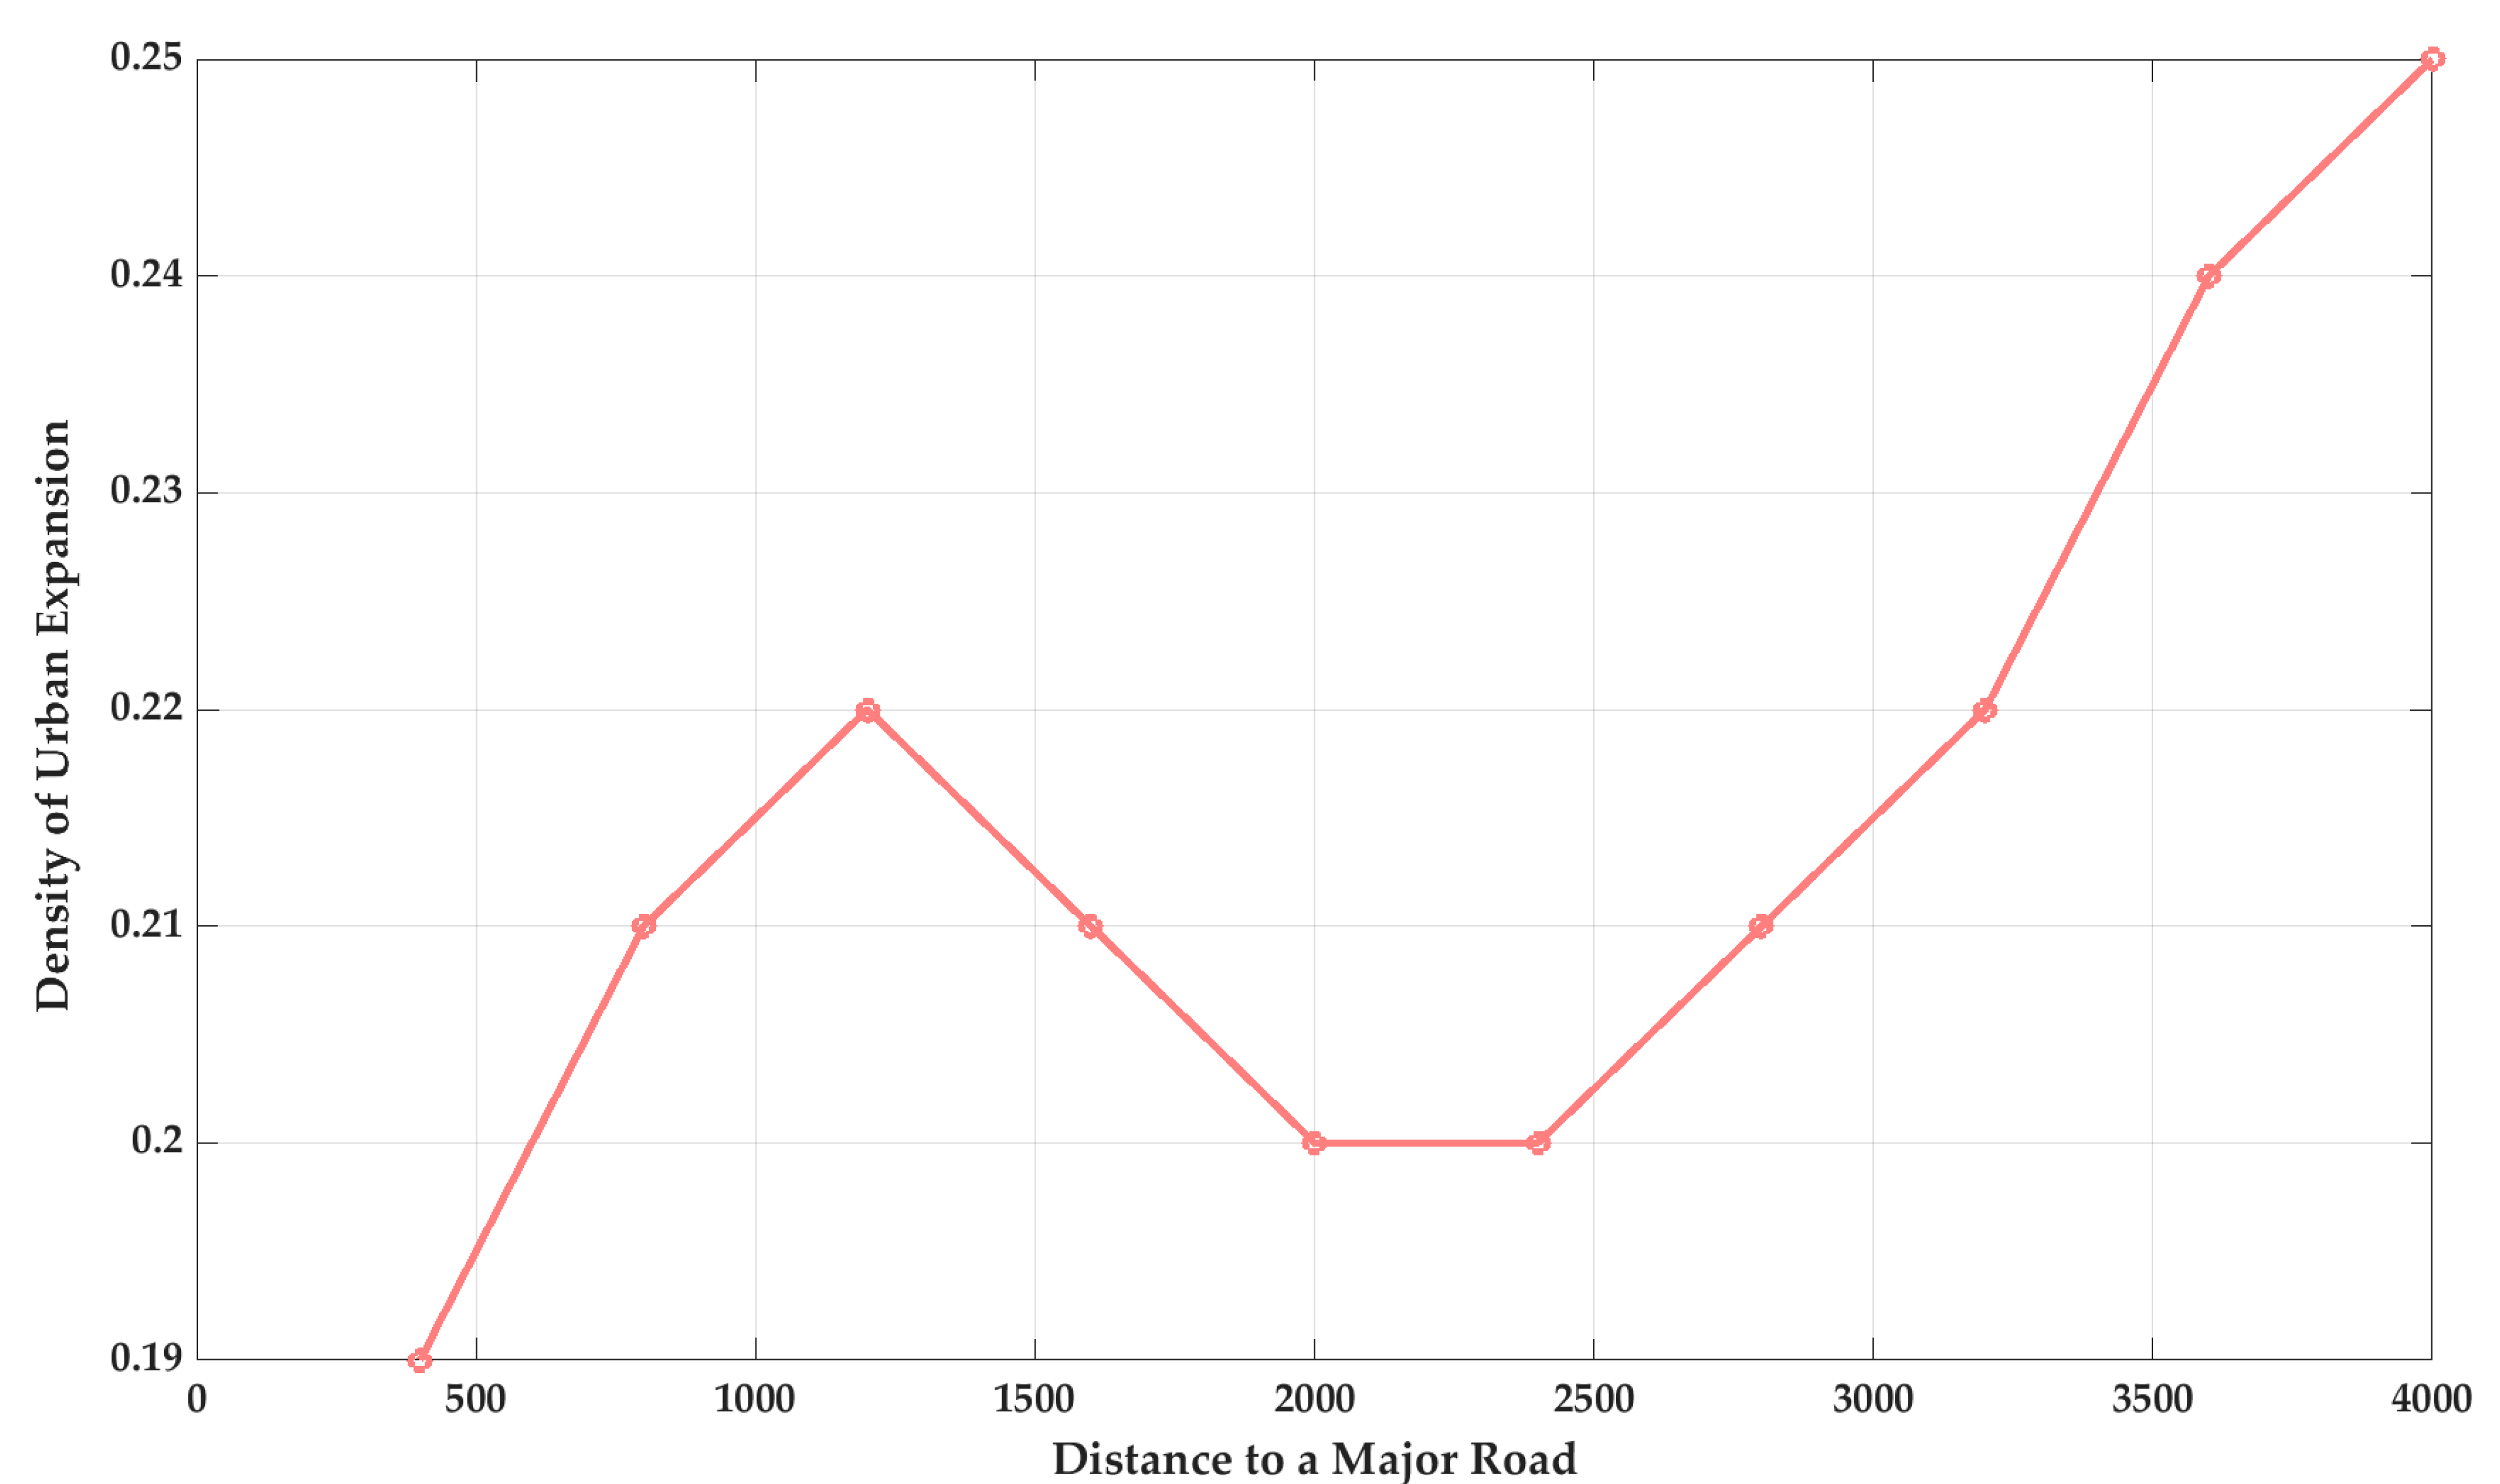
To establish the correlation between the density of urban expansion and the distance to the main Kumasi–Accra road, the density decay function was composed, which aided in analyzing the expansion of the urban/built-up areas in Kumasi.
Correlation between Density of Urban Expansion and Distance to the Main Road
The relationship between the density of urban expansion and the distance to a major road was investigated using Pearson’s Correlation Analysis [
56]. The Pearson coefficient of correlation was computed for the ten buffer zones using the formula;
where:
r = Correlation coefficient
X = Distance to the main road (Kumasi–Accra road)
Y = Density of Urban Expansion
N = total buffers
The significance of the correlation ‘r’ was tested at a statistical significance of 5%.
2.7. Software Used
ArcGIS 10.7.1 was employed to assess image accuracy and analyze urban expansion. The change detection was executed using the Terrset software. The correlation and the general visualization of graphs were done using Matlab R2020a.
5. Conclusions
We utilized multi-temporal Landsat satellite imagery and other relevant datasets to track urban expansion in Kumasi from 1986 to 2015 and predicted future urban/built-up areas for 2025. This research not only examined the spatio-temporal changes using the RF classifier but also attempted to provide a deeper comprehension of the urban expansion of Kumasi.
This research concludes that the RF algorithm is a better classifier compared to the traditional parametric classifiers, based on its accuracy outputs. The evaluation of change detection, urban expansion in the sub-metropolitan zones, density decay curve, buffer creation, correlation analysis and the student T-test to test significance revealed that urban/built-up areas are continually increasing at the expense of the other LULC types. The study revealed that the increase in population and economic activities have affected LULC alterations.
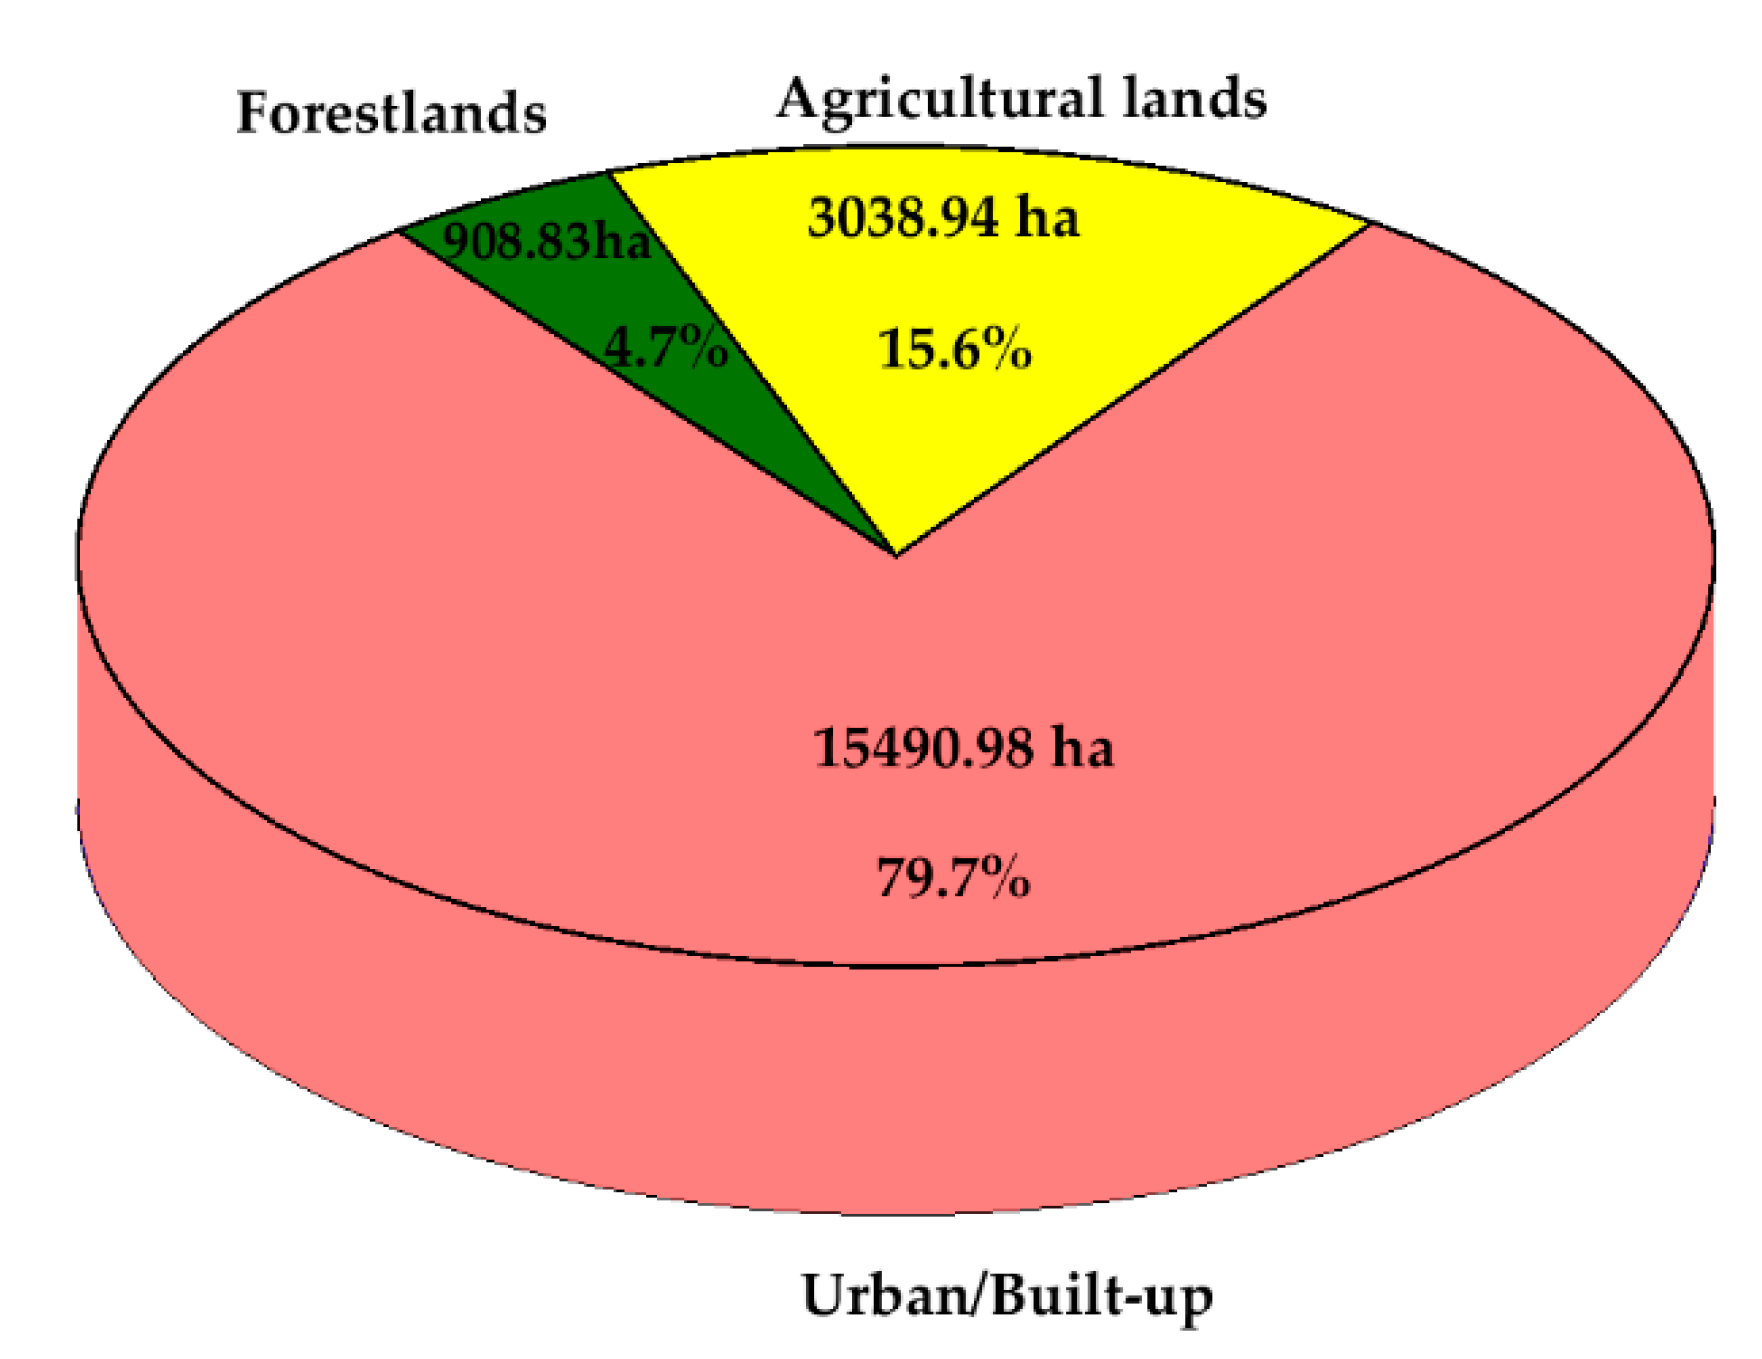
Urban land modeling using the Multi-Layer Perceptron and the Markov Chain which generated the future LULC map also predicted increased urban/built-up areas for 2025. It is expected that urban expansion may move beyond the boundaries of the Kumasi Metropolis into the adjacent satellite towns in the Ashanti Region. It is also concluded that, the infrastructural developments after 2013 and before 2015 had a significant impact on the green areas (agricultural and forestlands) in Kumasi.
The major limitation of our research was our inability to obtain suitable and appropriate Landsat satellite data for at least a 10-year interval for the required years, especially between 1986 and 2013 for the study area. The techniques adopted in this study for satellite image classification and urban expansion are considered straightforward. However, in our study, the 10-year interval was considered for the prediction for LULC 2025, with an emphasis on urban/built-up areas. Future works could also utilize RS data from the rainy season. Other machine learning classifiers such as Support Vector Machine and Artificial Neural Networks may also be incorporated for the classification of satellite images. Again, remote sensing indices could also be incorporated to provide further insights into the urban environment.
However, we propose that the city planners will inculcate vertical construction of buildings to avoid the wastage of agricultural and forestlands. This can be done in partnership with the Ministries of Housing, Agriculture and Forestry in Ghana. Again, the existing land-use policies ought to be enforced by the Kumasi Metropolitan Assembly. The consequences of uncontrolled urban expansion may include urban heat islands, continued loss of arable and natural areas and increased air pollution in the study area.
Our research provided gainful insights into spatio-temporal patterns and trends in urban/built-up areas using the state of the art machine learning classifier, Random Forests, an efficient technique used in tracking and predicting urban/built-up areas. This research can contribute to the existing framework for the development of land planning measures that promote the integration of other LULC types as urban-built up areas expand in cities.


