Article

Moving the 2030 Agenda Ahead: Exploring the Role of Multiple Mediators toward Perceived Environment and Social Sustainability in Residential Neighbourhoods

by
Massoomeh Hedayati Marzbali
1,*,
Aldrin Abdullah
1,
Mohammad Javad Maghsoodi Tilaki
2 and
Mina Safizadeh
1
1
School of Housing, Building & Planning, Universiti Sains Malaysia, Gelugor 11800, Penang, Malaysia
2
School of Humanities, Universiti Sains Malaysia, Gelugor 11800, Penang, Malaysia
*
Author to whom correspondence should be addressed.
Land 2021, 10(10), 1079; https://doi.org/10.3390/land10101079
Submission received: 6 September 2021 / Revised: 30 September 2021 / Accepted: 5 October 2021 / Published: 13 October 2021

Abstract

:
Neighbourhood safety represents an important topic of study to illustrate the reasons behind the increases in crime and mitigate its effects in neighbourhoods. This study examines how the social and environmental features of neighbourhoods may influence the social sustainability of residents based on the assumption that the perception of safety and social cohesion mediates the effects of neighbourhood environment on social sustainability. A quantitative method was employed to collect data from residents in a low-rise residential area in Penang, Malaysia. The results of structural equation modelling (SEM) indicated the positive and significant effect of neighbourhood accessibility on perceived disorder, whilst the effect of accessibility on social cohesion was negative. Disorders may comprise social and physical disorders, and may have a negative effect on perception of safety, but not on social cohesion. The relationship between disorders and social sustainability is serially mediated by the perception of safety and social cohesion. This implies that those who perceived high disorderliness in a neighbourhood environment reported a lower level of perception of safety, social cohesion and lower levels of social sustainability. Attempts need to be made to reduce neighbourhood disorderliness to pave the way for 2030 Agenda goals implementation.

1. Introduction

The necessity of sustainable development emerges from an implied conflict between the rapid human changes and the low speed of the renewal process of environmental resources [1]. This conflict can especially be seen within cities, where most transformations have occurred, changing them to the places where the sustainability procedure is difficult and required [2]. With the adoption of the 2030 Agenda by the United Nations, the Sustainable Development Goals (SDGs), as a set of goals and indicators, guide global development attempts in the years from 2016 to 2030. These 17 goals encompass a wide range of sustainable development issues, with the hope that governments will consider these goals to confront excessive poverty and the challenges of ensuring environmentally, socially and economically sustainable development in their respective societies [3]. The SDG framework of the 2030 Agenda defines a reference of worldwide guidelines, which are not mandatory, but beneficial in assisting policy development even at the local level of urban areas [4]. To make the 232 indicators of all 17 SDGs mentioned in the 2030 Agenda operational, countries must adjust and concretise them for their respective context [5].
Therefore, sustainable development has the essential objective of local and political decision-makers [6]. Principally, the 2030 Agenda is a comprehensive action plan that attempts to eradicate poverty and hunger; to reduce social and economic inequalities; to make communities safe from any form of crime; to build inclusive communities; to improve people’s well-being, health and education and learning; to keep human rights and promote gender equality; and to protect resources for the life of the planet underwater and on land [7]. In general, these 17 SDGs are unified and in line with the three aspects of sustainable development: (i) the environment based on the conservation of natural resources, (ii) the economy based on the good quality of life for all people and (iii) the society based on people’s basic needs. While more complex dimensions of sustainability are developed and debated, sustainability is generally considered concerning the three mentioned aspects [8]. During the last few decades, the majority of the sustainability discourse has been influenced by ecological perspectives. The last decade, in particular, has experienced an increasing interest in the social features of sustainability [9]. Given that Sustainable Development Goals (SDGs) have emerged as a new urban agenda, a growing interest in social aspects of communities can be observed. Urban sustainability discussion idealises a theoretical model comprising three integrated aspects: environmental, economic and social [10]. Evidence suggested that both social and physical characteristics of the neighbourhood environment can influence the residents’ daily life and their social interactions [11]. Sustainability debates are no longer limited to the environmental dimension, but may also incorporate economic [12] and social dimensions [13]. Although numerous studies have investigated the neighbourhood environment and individuals’ health among residents, research focusing on the effect of neighbourhood characteristics on social participation through formal and informal social roles is limited [14].
Whilst scholars tried to develop theoretical definitions and actions regarding the social aspect of sustainability [15], communities continued to negotiate the subjective nature of theoretical concepts that define socially sustainable communities. Social inclusion and cultivating a sense of belonging are known to be important components of social sustainability [16]. Notably, social sustainability is a multiscale phenomenon that started integrating into the urban decisions and designs from small- to large-scale from a neighbourhood to the region, for instance [17]. Evidence also states that the majority of the available sustainability assessment tools provided to measure the results of sustainable development goals merely cover the social aspect of sustainable development to a limited extent and are mainly characterised by the environmental dimensions of sustainability [18].
Increased exposure to neighbourhood disorders can have far-reaching implications for neighbourhood social aspects. Neighbourhood disorders, such as physical disorder (e.g., unkempt lawns and gardens, graffiti, littering and dumping of rubbish in public areas, poor street lighting, numerous vacant houses [19]) and communities with low levels of trust and connections [14] have been shown to prevent adults from participating in social activities. Perceived physical and social neighbourhood disorders have been linked with increased perception of safety and decreased social cohesion due to avoidance behaviours [20].
The relationship between perceived neighbourhood environment, such as perceived resources or problems (e.g., neighbourhood safety), neighbourhood social environment (e.g., social cohesion) and social sustainability is less clear [21]. As such, perceptions can affect the social and physical aspects of the residents’ life, more so than objective characteristics in and of themselves [22]. Thus, examining the perceived neighbourhood environment can provide complementary information which can be useful in disentangling the effects of the neighbourhoods’ social sustainability. Moreover, among numerous physical factors including land use mix [23], meeting places [24] and a mix of housing types [13] is neighbourhood accessibility, which is an important approach in evaluating the physical quality of neighbourhood environments [25]. However, studies on establishing the association of social cohesion and perception of safety as mediating factors are rarely available.
Although a large body of knowledge has recently been produced on this topic, as the urban social sustainability discourse has consequently moved from an ‘under-theorised’ status to an ‘insufficiently theorised’ status, further theoretical research should be conducted to consolidate the discourse and advance its theory. There is a need to build on these efforts and develop frameworks which may offer a comprehensive structure for analysis to link the qualitative and quantitative aspects of social sustainability [26]. Although there are agreements about the general definition of sustainability and its relationship with neighbourhood characteristics, no worldwide solution for a sustainable neighbourhood has emerged. Previous studies are generally about case studies from developed countries. Few studies have been conducted from the developing countries’ context. Consequently, based on precedent studies and seeking to reconcile the existing gaps, firstly, this study examines an integrated model of the neighbourhood environment, social cohesion, perception of safety, and social sustainability with micro-scale neighbourhood environment variables, which are rarely taken into account, in order to thoroughly investigate the relationship between the neighbourhood environment and social sustainability. An investigation of the causal relationships by using structural equation modelling (SEM), which has rarely been employed in the existing studies, comes second. Notably, the study empirically investigates the relationship between the physical and social characteristics of neighbourhood and social sustainability, considering the mediating role of social cohesion and perception of safety in an Asian context, especially in a rapidly urbanising and multi-ethnic society, such as Malaysia.

2. Theoretical Background

2.1. The 2030 Agenda and Sustainability

SDG#11 follows sustainable development regarding cities with 10 targets and 14 indicators at a worldwide level, which are neglected variously at the national level [27]. These indicators incline to be statistical and sometimes refer to the architectural dimension: especially pertaining to the social aspect, these indicators refer highly to social equity, equal accessibility of resources, social interaction and health and quality of life, which are more subjective indicators and yet main targets of sustainable development [28].
Therefore, the construction sector plays a significant role in the issue of SDG#11, with regard to the complicated relationship between the human need for space and the limitation of this resource [29]. This study mainly focuses on SDG#11, which deals with urbanisation and seeks to ‘make cities inclusive, safe, resilient and sustainable’ [30]. In this sense, SDG#11 is the result of a process that starts at the global level in the search for sustainable development in a broad sense and increasingly evolves to recognise the key role of cities [31], providing a comprehensive reference model for the pursuit of sustainable development addressing several interlinked issues, with a focus on urban sustainability [32]. It can be considered as a global normative framework for urban transformations and urban policies. Its Target 11.7 requires cities by 2030 to provide access to safe and secure public spaces for all and to improve urban management through better urban policies and regulations [33].
Although social sustainability is the least developed component of sustainable development, it has been discussed as a fundamental part of sustainability since the 21st century [34]. The assessment of sustainability is based on the employment of various investigation and assessment approaches to generate information considering the choice, as they provide data necessary to investigate the outcomes of human actions for sustainable development [35]. Only, in recent years, there has been more attention drawn to the issues related to social sustainability as a fundamental component of sustainable development [36]. Moreover, evidence shows that identifying the level of sense of safety from the standpoint of sustainable development and determining the boundaries of safe existence allow for setting strategic medium or long-term goals [37]. In this sense, the usage of multi-criteria methodological frameworks is found for evaluating social sustainability; for instance, Munda [38] suggested the social multi-criteria evaluation method as a beneficial method for the application of social choices to the complicated contemporary problems. Meanwhile, Sierra et al. [39] reported several examples of multi-criteria methods, including social aspects. Given that the urban environment is a multidimensional system, projects must pay attention to different points of social and environmental views to make sustainable cities and architectures; consequently, multi-criteria evaluation is a useful framework to address them [40]. Due to increasing social inequalities, the formation of class distinctions and crime issues in the society, a growing interest in social aspects of communities can be observed.
Sustainability is no longer known as a mere environmental concern, but as a broad concept, which covers environmental and social aspects [41]. In a general perspective, social sustainability strategies attempt to improve the residents’ quality of life and most relevant human needs including cultural and psychological ones, adaptability and consequently, sustainable development [42]. However, as previously mentioned, the social dimension of sustainable development goals regarding environmental and social suitability is limitedly studied and needs to be further investigated. The following research hypothesis has been developed:
Hypothesis 1 (H1).
Accessibility is positively associated with disorder.

2.2. Social Disorganisation Theory

Social disorganisation theory was developed out of the University of Chicago during the 1920s. Shaw and McKay [43] work on urban communities revealed that high levels of residential instability, high levels of ethnic heterogeneity, poverty and family disruption, which are generally recognised components of disorganisation, diminishes the ability of communities to realise common values and maintain effective social control resulting in communities that are socially disorganised. Social disorganisation theory draws attention to the relationship between community organisation, formal and informal community social control [44]. This theory also refers to the inability of a community structure to comprehend the common values of its inhabitants and preserve effective social controls [45] and suggests that moral social orders created by social interactions can determine deviant behaviours and establish the needed bonds to control these behaviours [46]. As such, societal growths and urbanisation processes can disrupt the residents’ social bonds, weakening social norms and their power to regulate and control deviant behaviours and disorders [47].
Flawed social structures in communities may lead to more disorders because the community is incapable of effective control and cannot prevent them [48,49]. Neighbourhood environmental characteristics are the pillars of social disorganisation theory, which states that residents of cohesive communities can control crime and disorder [50]. When neighbourhood community social cohesion is disrupted by negative neighbourhood structural characteristics, residents do not effectively self-regulate behaviours leading to social disorganisation [51,52]. This study focuses on this particular pillar of social disorganisation theory. Therefore, the following hypotheses have been driven from the results of previous studies.
Hypothesis 2 (H2).
Social cohesion is positively associated with social sustainability.

2.3. Social Sustainability

The concept of sustainability gained prominence after publishing the Brundtland [53] report and social sustainability was considered as a component of sustainable development. Social sustainability can be defined as an ability to sustain the public community, since ‘sustain’ refers to maintaining a given state that is specified by both physical and nonphysical characteristics. Therefore, physical characteristics such as accessibility, attractive public spaces, and social characteristics such as social capital, community and safety can affect social sustainability. Despite these fragmented approaches, a few studies attempted to investigate the relationship between social capital and possible determining factors of social sustainability, including the sense of community, residential mobility, attending the community affairs, etc. [54]. Developing sustainable communities requires urban planners and community organisers to make decisions which may affect environmental, economic and social systems. The most underdeveloped of these dimensions remains social sustainability [10].
One of the prime challenges regarding the term “social sustainability” is the difficulty to conceptualise it. No agreement exists on the criteria to be considered whilst assessing the concept of social sustainability so far [55]. The social sustainability components have not been fully recognised. This is due to the difficulty in quantitatively measuring social sustainability compared to economic or environmental sustainability [56,57]. However, the main attention is paid to the effect of the neighbourhood environment as potential venues for social interactions on social sustainability [34,58].
Whilst the focus of social sustainability studies has traditionally been on the macro scales (city and region), the focus has been shifted recently towards micro scales (neighbourhood and community) [18,59]. Furthermore, social sustainability ‘hard’ themes, such as employment and poverty alleviation, are increasingly being complemented or replaced by ‘soft’ concepts, such as social interactions and sense of place [35]. Dempsey, Bramley, Power and Brown [16] mentioned physical factors which are associated with sustainability including aesthetic public areas, satisfactory housing, adequate and proper local environmental facilities, accessibility and a walkable neighbourhood. According to McKenzie [60], social sustainability is a life-enhancing condition within communities which arrived through a process. Moreover, successful social capital is recently shown to be helpful in addressing the challenges of the COVID-19 pandemic [61].
Overall, the basic criteria of social sustainability which will not change over time are the three aspects of social capital, cohesion and exclusion [62]. According to Lotfata and Ataöv [34], definitions of social sustainability in an urban context are presented under four categories of theoretical frameworks; (1) theories that mainly consider the existing positive conditions of urban life, stating that decisions regarding environmental or economic issues must not be higher than the community’s ability for change; (2) the second framework generally focuses on the measurement of concepts, such as social interactions and sense of belonging; (3) definitions which are characterised by a focus on the future and the continued improvement of individual wellbeing to the future generations; and (4) the theories that offer a functionalist comprehension of social sustainability as a way of providing cohesion. The second framework, which relies on the assessment of social interaction (cohesion and inclusion), is the one most needed in urban neighbourhoods. For this study, a socially sustainable neighbourhood refers to a neighbourhood characterising communal involvement and social control over the neighbourhood. On the basis of the above discussion, the following hypothesis can be put forward:
Hypothesis 3 (H3).
Accessibility is negatively associated with social sustainability.

2.4. Perceived Physical Environment

Social sustainability can be directly influenced by neighbourhood environmental factors. These influencing factors can be mainly categorised into two groups: social and physical factors [16]. The reasons why people tend to avoid neighbourhoods with high levels of disorder is wide in range. According to contributing literature, physical neighbourhood characteristics such as street connectivity and accessibility [63,64], neighbourhood walkability [65], street noise [66], residential satisfaction, exterior environment condition and safety from traffic were associated with social interactions and quality of life [63,67].
Wilson and Kelling [68] discussed in their Broken Windows theory, as well as Skogan [69] in the Disorder and Decline model, that disorder feeds back into the development or maintenance of social ties and the extent to which residents exercise social control on deviants. An increase in physical disorder may ruin the residents’ cohesion and processes of social control over time [70] and may cause residents to leave the neighbourhood [71]. Physical signs of decay and social disorder, such as littering, vandalism or graffiti, may erode people’s feelings of regular control and surveillance over the neighbourhood environment [72].
A relatively limited study exists which focuses explicitly on social sustainability, whilst a broader literature exists on the effects from disorder on overlapping concepts of social capital, social cohesion, social inclusion and social exclusion. For instance, Dempsey [64] found that suggesting that the quality of neighbourhood environment has a strong influence on social sustainability is inaccurate. Those features, which were consistently associated with social sustainability, tend to be dependent on the residents’ perception. Dave’s [23] research also revealed that higher household density and population density have no negative effects on social sustainability. Moreover, Yoo and Lee [54] found that a significant relationship exists among the neighbourhood physical environment, social capital and social sustainability. Larimian and Sadeghi [55] also provided the significance of improving neighbourhood environment characteristics and their positive and significant relationship with different dimensions of social sustainability and overall social sustainability. Therefore, these discussions lead to the following hypothesis:
Hypothesis 4 (H4).
Disorder is negatively associated with social sustainability.

2.5. Perceived Social Environment

Social factors, such as social cohesion, social capital and safety can influence social sustainability [54]. Safety is the ontological influencing factor on social sustainability. Safety, and the perception of safety for humans and even non-humans, is the main principle which affects sustainability and social sustainability [73].
A properly designed and well-maintained neighbourhood environment provides a friendly and healthy atmosphere in the neighbourhood, which encourages physical activity and social interaction [24] and contributes to the residents’ perceived safety and security and the social and visual appeal of the neighbourhood [72,74]. Therefore, the following hypothesis is drawn based on the above discussions.
Hypothesis 5 (H5).
Accessibility is negatively associated with perception of safety.
Quality of neighbourhood perceived social environment exhibited a relationship with social capital [75] and social sustainability [76,77]. That is why researchers collaborate on a global scale to develop strategies help maintain social contact and thus reduce the psychological impacts of isolation during the COVID-19 pandemic [78]. Even if online, social relationships should be established online to share valuable information and obtain more knowledge from others [79]. Therefore, the following hypothesis has been driven based on the above discussion:
Hypothesis 6 (H6).
Perception of safety is positively associated with social sustainability.
Furthermore, both actual crime rate and perceived feeling of safety may hinder the attainment of social sustainability in urban neighbourhoods. Social cohesion and inclusion are claimed in theory and policy to contribute to sustainable, fair and strong communities for the present and future [73]. This relates to a prevailing social order in neighbourhoods and the support of social interaction and networks between all residents. The sustainability of a community is about the ability of society itself, or its manifestation as a local community, to sustain and reproduce itself at an acceptable level of function. This is associated with social capital and social cohesion as concepts, which would encompass social networks, norms of reciprocity and features of social organisation [80], along with the integration of resulting social behaviour [81]. The sustainability of a community involves social interaction between community members; the relative stability of the community, the existence of and participation in local collective institutions, formal and informal and levels of trust across the community, including issues of safety from threats in the community [16]. On the basis of social disorganisation theory and the aforementioned discussions, the following research hypotheses are drawn:
Hypothesis 7 (H7).
Accessibility is negatively associated with social cohesion.
Hypothesis 8 (H8).
Disorder mediates the relationship between accessibility and social sustainability.
Hypothesis 9 (H9).
Perception of safety mediates the relationship between disorder and social sustainability.
Hypothesis 10 (H10).
Social cohesion mediates the relationship between disorder and social sustainability.
Hypothesis 11 (H11).
The relationship between disorder and social sustainability is serially mediated by perception of safety and social cohesion.

3. Materials and Methods

3.1. Study Area

The study area is a typical low-rise housing neighbourhood in Penang, Malaysia. In terms of ethnic composition, the area consists of a homogenous neighbourhood, which includes single-storey and double-storey houses. It is located in the central part of Penang Island. A probability sampling method was employed to select samples from the population. Overall, the area consists of approximately 1700 properties. A systematic sampling with a random start was employed to select the samples.
A team of interview staff were trained to administer the field survey and walk from house to house to conduct a person-administered survey with residents who were 18 years old or older. The main wage earner or the spouse in each household were identified as the survey respondent. Letters were sent to all selected samples a week before the first questionnaire interview was scheduled, informing the respondents of the purpose of the study. The survey was conducted before the COVID-19 pandemic which covered a sample of 247 residents (after data cleaning) with a response rate of 73%. The purpose of dispatching the letters was to ensure that the participants were aware of the study and that they would have made up their mind to participate to the survey. Prior to conduct the survey, the respondents were asked a screening question. The question involved asking respondents whether they have lived at the address for at least a year. Respondents who have lived there less than a year were excluded from the survey. Ethics approval was sought by the Ethics Committee of Universiti Sains Malaysia, involving human participants.

3.2. Survey Instrument

The current study is based on a quantitative approach, which employed a questionnaire survey and an observation checklist to collect data. The survey in this study was part of a larger study conducted in Penang, Malaysia, which covered a wide range of social and physical characteristics of the residents and neighbourhood environment. It comprises several sections to capture the respondents’ demographic characteristics, their perceived social and physical disorder, perception of safety, social cohesion and social sustainability. An exploratory factor analysis (EFA) was performed to extract the first-order factor structures of the second-order disorder construct, comprising social and physical disorder as first-order constructs [19]. Before executing the main survey, a pilot survey was conducted to check the content validity and ensure that all items and respective constructs in the survey are valid for the target samples. A team of enumerators, which comprises two postgraduate students, was trained to conduct the survey and the observation checklist.
Accessibility was measured using two items: provision of sidewalks and traffic volumes [82]. These items were measured using an observation checklist for each street segment. To measure disorder, 13 items were developed based on previous studies [19,83,84]. These items include physical and social disorder. Participants responded to a series of statements related to different problems in the neighbourhood environment on a seven-point Likert scale (1 = highly not problematic, 7 = highly problematic) and the EFA was used to understand the underlying structure of the data. Physical disorder includes: (1) unkempt lawns and gardens; (2) houses and unattended fences; (3) upkeep of children’s playgrounds; (4) littering and dumping of rubbish in public areas; (5) poor street lighting; (6) vandalism or graffiti on public properties; and (7) the condition of streets, sidewalks or road signs. Social disorder includes: (1) inconsiderate or disruptive neighbours; (2) noisy neighbours and loud parties; (3) problems regarding selling and dealing of drugs; (4) uncontrolled pets; (5) teenagers hanging around streets; and (6) motorbike racing.
Perception of safety refers to the degree to which individuals feel safe within their neighbourhood area [85,86]. Respondents were asked how safe they feel when (1) walking alone in the street during the day; (2) walking alone in the street after dark; (3) walking alone in neighbourhood during the day; (4) walking alone in neighbourhood after dark; (5) alone at home at night; and (6) in a park/playground in neighbourhood during the day. The response categories were based on a five-point Likert scale (1 = very unsafe, 5 = very safe). Social cohesion is the belief that other residents will act for the common good in the neighbourhood, adopted from previous studies [83,84,87]. This variable was measured based on the agreement of respondents with the social cohesion statements. The six items were (1) willingness to help neighbours; (2) closely knit neighbourhood; (3) trust in neighbours; (4) neighbours talk together; (5) neighbours get along with each other; and (6) neighbours share the same values.
Social sustainability was adopted based on previous studies [18,54,76]. Although Larimian and Sadeghi [55] employed the EFA-CFA approach to develop a measurement scale for social sustainability using a multi-dimensional model, no agreement exists on the criteria to assess this concept [21]. For the purpose of this study, we expanded on former studies by proposing a comprehensive measure of social sustainability in the neighbourhood environment which considers its multidimensional and complex nature. We focused on the dimensions of social sustainability related to the environment, using the neighbourhood as the scale of analysis. The model was developed by considering the effects of the social and physical aspects of the neighbourhood. The items were: (1) feeling sense of belonging to neighbourhood; (2) feeling a member of neighbourhood; (3) intention to keep living in neighbourhood; (4) participation in neighbourhood affairs; and (5) keeping an eye on what occurs in front of the house. The response categories were based on a seven-point Likert scale from 1 (strongly disagree) to 7 (strongly agree).

3.3. Statistical Analyses

The proposed model and hypotheses were tested by performing a partial least squares (PLS) analysis using the SmartPLS3 software [88]. PLS was used because of its aptness to the exploratory nature of the study, in which some of the hypothesised relationships amongst the variables had not been previously tested. As the model comprises a higher-order construct, PLS is an appropriate software. A nonparametric bootstrapping method with 5000 replications was performed to examine the significance of the path coefficients amongst the latent variables.

4. Results

4.1. Respondent Profiles

The respondents have an average age of 45.2 years (SD = 14.37), and 50.2% of them are female. The majority of the respondents are Chinese (92%), followed by Malay (4%) and Indian (4%). Therefore, the profile shows a homogenous of survey respondents in terms of ethnicity. In terms of religion, the majority of respondents are Buddhist (80%), followed by Christian (13%), Muslim (4%) and Hindu (3%). Most of the respondents (77%) are married and living with spouses. Slightly over 50% of the respondents are educated at the university/college level, followed by secondary level (41%), primary level (6%) and informally educated (2%). The majority of respondents are homeowners (87%) and living in the neighbourhood more than 15 years (M = 18.73, SD = 12.02). According to the respondents’ profile, residents in the study area are considered as stable families.

4.2. Assessment of Measurement Model

PLS-SEM was performed to assess the proposed model and test the research hypotheses. Several criteria were considered to determine the validity and reliability of the measurements, including outer loadings, convergent validity, composite reliability and discriminant validity (Table 1 and Table 2). As shown in Table 1, the smallest outer loading value is 0.726 (PercSafety5), which exceeded the threshold of 0.6 [89]. The threshold value of 0.7 was considered for Cronbach’s alphas, rho-A, and composite reliability (CR). As indicated in Table 1, all constructs have reliabilities of more than 0.70, which were acceptable. Convergent validity was measured by the average variance extracted (AVE), in which the threshold value is 0.5 [90].
Three criteria were considered to examine the discriminant validity of the study constructs. Firstly, following Fornell and Larcker [90], the square root of AVEs of each construct should be greater than the correlation estimate amongst the constructs (Table 2). Secondly, the heterotrait–monotrait (HTMT) ratio and confidence interval should be less than 0.85 and 1, respectively [91]. Table 2 shows that the square root of AVE exceeds the inter-correlation of the constructs in the proposed model, thus suggesting that the model has acceptable discriminant validity. Meanwhile, Table 3 shows that the HTMT ratios and corresponding confidence intervals for each pair are less than 0.85 and 1, respectively, thus indicating that the model possesses convergent and discriminant validity.
The potential for common method variance (CMV) was assessed by conducting Harman’s one-factor test [92]. CMV will be observed when more than 50% of the variance was explained by the first factor. Therefore, all items for the latent constructs were introduced into the factor analysis, and the unrotated matrix indicates that the first factor explains 33% of the variance. Thus, CMV is not an issue in this study.

4.3. Assessment of the Hierarchical Disorder Construct

This study treats disorder as a second-order construct comprising two first-order reflective constructs (physical and social disorder) which represent 13 items. The degree of explained variance of this hierarchical construct is reflected in its components; namely, physical disorder (R2 = 89.8%) and social disorder (R2 = 84.7%). The entire path coefficient from disorder to its dimensions is significant at p < 0.01.

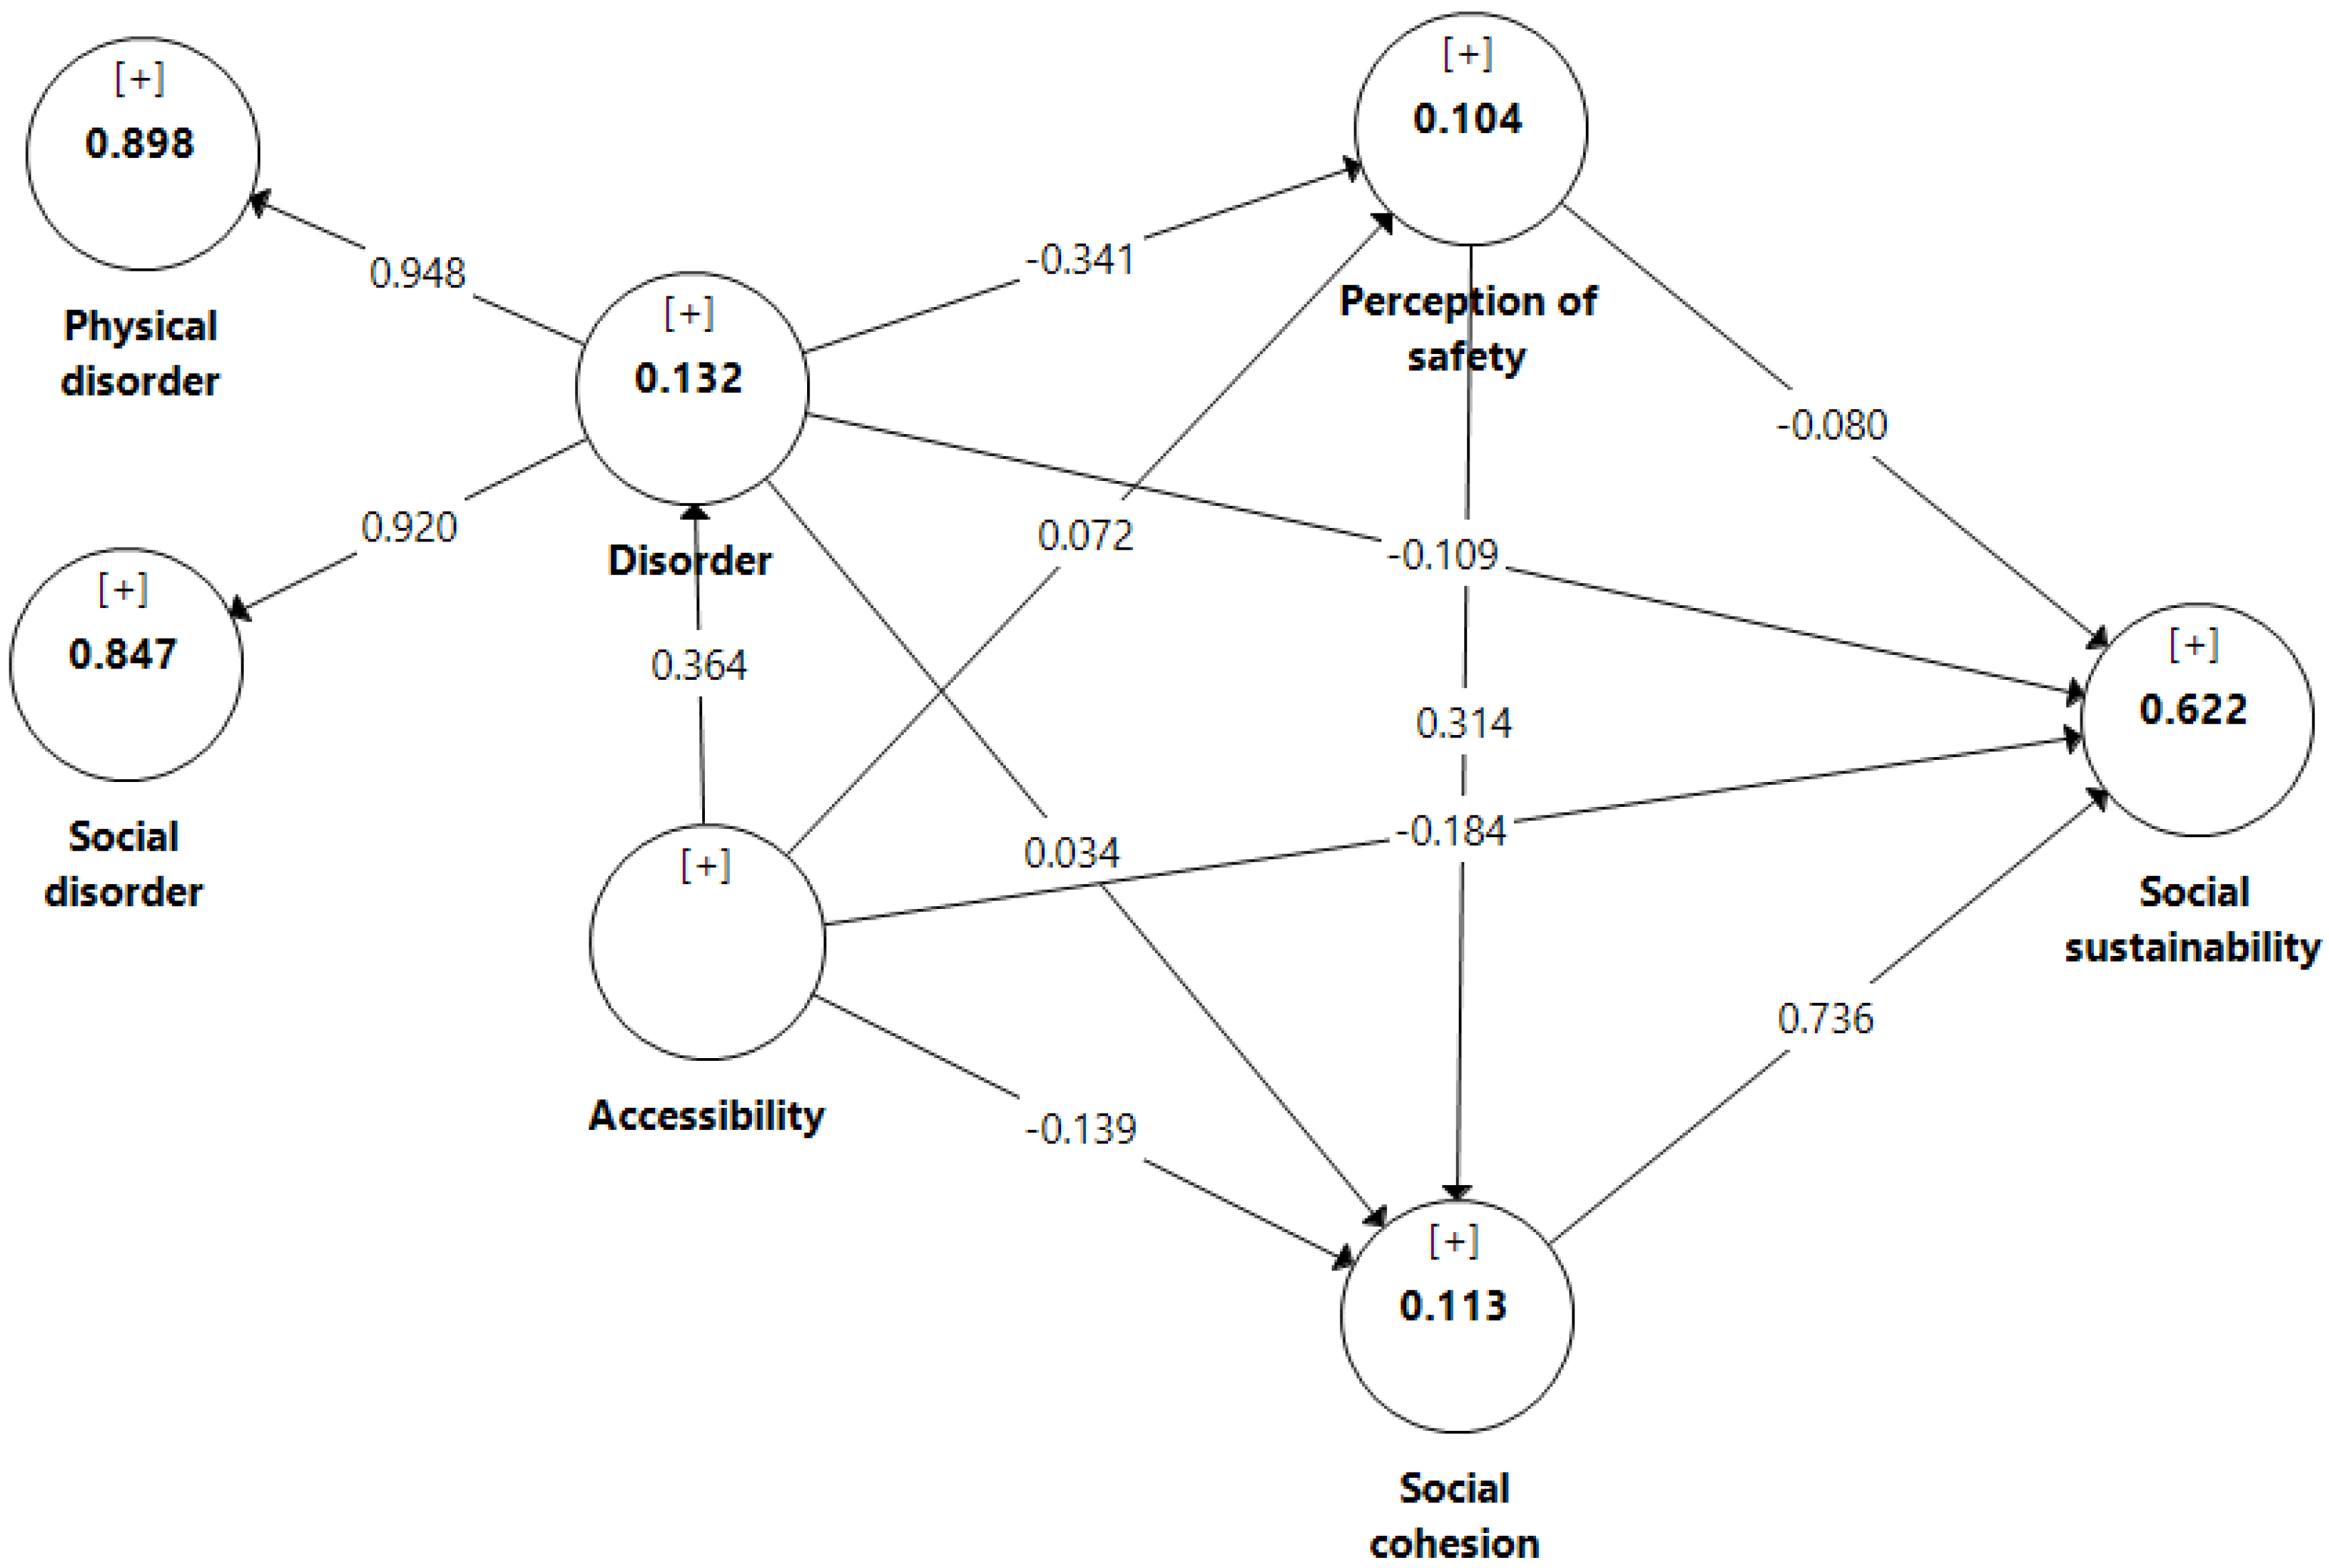
4.4. Assessment of the Structural Model

4.4.1. Direct Effects

Table 4 indicates the results of the path analysis, which is conducted to test the hypothesised direct effects amongst the latent variables. As depicted in Figure 1, the effects of accessibility on social cohesion (β = −0.139, p < 0.05) and social sustainability (β = −0.184, p < 0.01) were significant and negative, whilst accessibility has a positive effect on disorder (β = 0.364, p < 0.01). However, no significant association exists between accessibility and perception of safety (β = 0.072, p > 0.05). These findings implied that those who resided in street segments with a high level of accessibility reported lower levels of social cohesion and social sustainability and higher levels of perceived disorder.
As hypothesised, disorder has a negative effect on social sustainability (β = −0.109, p < 0.05), whilst social cohesion has a positive effect on social sustainability (β = 0.736, p < 0.01). Meanwhile, no significant relationship exists between perception of safety and social sustainability in the study area (β = −0.080, p > 0.05). Therefore, the results support H1, H2, H3, H4 and H7, but H5 and H6 are rejected. The R2 value for social sustainability is 0.622.

4.4.2. Indirect Effects

This study estimates four mediating relationships, as indicated in Table 5. The t values were calculated using the bootstrapping procedure suggested by Hayes [93] with 5000 samples by reading the specific indirect effects from the PLS output. Results show that t values of two indirect effects (H8 and H11) are significant at the 0.05 and 0.01 levels, respectively. Therefore, H8 and H11 are supported, while H9 and H10 are rejected.
To examine the strength of the mediation effects, the study calculated variance accounted for (VAF), where VAF > 80% implies full mediation, 20% ≤ VAF ≤ 80% indicates partial mediation and VAF < 20% does not indicate any mediation, as suggested by Hair et al. [89]. VAF was calculated to estimate the magnitude of the indirect effect by dividing the indirect effect by the total effect [94]. The VAF value indicates that approximately 29% of the total indirect effect of accessibility on social sustainability is explained by the partial mediating effect of disorder. Meanwhile, the relationship between disorder and social sustainability is serially and partially mediated by perception of safety and social cohesion.
The R2 values suggested that approximately 13% of the variance in disorder is explained by accessibility, whereas accessibility and disorder explained approximately 10.5% of the variance in satisfaction. Accessibility, disorder and perception of safety explained approximately 11% of the variance in social cohesion. The effect size (f2) was also calculated to estimate the extent of the influence of an independent latent variable on the dependent variable. Effect size was calculated based on the change in the coefficient of determination (R2). According to Chin [95], the values of 0.02, 0.15 and 0.35 indicated that the effect size is small, moderate and substantial, respectively. Results show that accessibility and disorder have small effects on social sustainability, whilst social cohesion has a substantial effect on social sustainability. This shows the importance of social cohesion on social sustainability. Moreover, accessibility has moderate and small effects on disorder and social cohesion, respectively.
The multicollinearity amongst the variables in the model is also tested, and the results did not highlight any cause for concern in using variance inflation factor (VIF), in which values are all below the suggested threshold of 5.00, as shown in Table 5 [96]. Hair et al. [89] suggested that the predictive relevance of the model should be examined through a blindfolding procedure. The Q2 values for disorder (Q2 = 0.080), perception of safety (Q2 = 0.062), social cohesion (Q2 = 0.070) and social sustainability (Q2 = 0.486) are > 0, suggesting that the model has sufficient predictive relevance.

5. Discussion

As hypothesised, results indicated the negative and significant effect of accessibility on social cohesion and social sustainability. This argument is consistent with the findings of a recent study in compact neighbourhoods [21]. However, this result is inconsistent with the precedent studies [97,98], which revealed that accessibility and distance dynamics improve social interactions. The possible explanation could be that when the neighbourhood accessibility increases, the level of physical activity and the number of vehicles increase [54]; therefore, it may lead to the presence of strangers, who may disrupt the process of social cohesion and social sustainability. Another possible explanation is that a comparatively low neighbourhood accessibility may be beneficial to the social cohesion because a lack of strangers can pave the way for closely knit neighbourhoods, which are likely to exchange information, work together to achieve common goals and reinforce those relationships. This is consistent with a recent study [21,99]. Consequently, when social cohesion and social sustainability diminishes, more social and physical disorders appear.
The findings offer the following theoretical implications. The findings of this study indicate that neighbourhood environment characteristics in both social and physical aspects are pivotal indicators for the feeling of safety and a socially sustainable neighbourhood. A nicely designed and well-maintained neighbourhood should be among the utmost priority of urban planners and decision-makers. Similarly, this study provides new insight into the role of multiple mediators which may affect the relationship of the neighbourhood environment and social sustainability. Based on the findings, a powerful socially sustainable community with a high rate of social cohesion and perception of safety is attributed to residents who experience less disorder in their neighbourhood. Another theoretical implication refers to the multi-dimensional measure of disorder at the neighbourhood level operationalised as a second-order concept comprising social and physical disorder.
This study shed more light on the multi-scalar research area of urban neighbourhoods’ social sustainability, which was unclear in the literature [17]. Previous research has indicated that the perceived quality of neighbourhood environment has a positive effect on social cohesion and social sustainability [54,81,100]. Our findings expanded on such research by revealing that the more people perceive their social and physical area of residency as being degenerated, the less they reported social cohesion and social sustainability.
In terms of the practical implications, this study suggests that urban local authorities should enhance the living conditions of residents by taking social and physical aspects, such as attempts to design and make beneficial use of public areas, plan occasional neighbourhood gatherings and regular maintenance of existing neighbourhoods. Furthermore, they can limit the accessibility of residential areas by available urban planning strategies to lessen the rush and chaos within the neighbourhood.
Using a quantitative approach, this study aimed to develop and validate a social sustainability framework based on an integrated model in the Malaysian context to improve the capability of urban neighbourhoods in facilitating social interactions and perceptions of safety, which is consistent with sustainable development goal #11. This further implies that both social and physical characteristics of the neighbourhood environment play a vital role in enhancing social sustainability at the neighbourhood scale. Social sustainability, in other ways, may contribute to improve the lives of residents. The social sustainability framework in this study includes several key elements of safe neighbourhoods in Malaysian context to enhance safety and social sustainability in neighbourhood environments. The current study also focuses on sustainable cities and societies to provide a better living environment, which is consistent with the Key Economic Growth Activities (KEGA) 12 under the Malaysia Shared Vision 2030 (SPV2030) initiative. The Malaysian government has established SPV2030 to mitigate the income inequality, strengthen social capital and improve wellbeing. Therefore, Malaysia needs to revise the development framework to preserve the environment and other resources in a sustainable manner; thus, the process of national development must be conducted by changing and adapting the social ecosystem to fulfil social sustainability and ensure social equality and social capita growth.

6. Conclusions

The present study aims to test a conceptual model which proposed the relationship between the social and environmental features of neighbourhoods and the social sustainability of residents based on the pivotal mediating role of the perception of safety and social cohesion, which mediated the effects of the neighbourhood environment on social sustainability. The conceptual framework was based on social disorganisation theory, and data was collected from a homogenous neighbourhood, including typical low-rise housing in Penang, Malaysia. By contrast, no significant relationship was found between accessibility and perception of safety. However, it is unsurprising, as few relevant studies also reported a weak effect of accessibility on the perception of safety [101]. These limitations are also acknowledged by a recent study [21]. By contrast, they found a positive relationship between accessibility and safety in compact neighbourhoods [21], which may refer to different types of neighbourhoods in terms of density.
Overall, results indicated that low-rise neighbourhoods have their promises in terms of social environment. The most explicit promise is that neighbourhood disorder is negatively associated with perception of safety, which is consistent with previous studies [102,103,104]. Results further suggested that disorder mediates the relationship between accessibility and social sustainability and the relationship between disorder and social sustainability is serially mediated by the perception of safety and social cohesion. This implies that those who perceived high disorderliness in a neighbourhood environment reported a lower level of perception of safety, social cohesion and lower levels of social sustainability.

7. Limitations and Directions for Future Research

This study has a few limitations to be acknowledged. Firstly, while this study encompasses a wider range of dimensions than previous studies, it limited the concept of social sustainability and used it widely in its aspect of neighbourhood social sustainability. More dimensions could be considered, such as social satisfaction, social equity and population density in future studies. Secondly, the social and physical environment disorders were measured by subjective means, but the neighbourhood accessibility was measured with an observation checklist by the authors. Therefore, the findings could be different if the subjective measures were applied. An issue to consider in future studies is how best to measure subjective and objective disorderliness in the neighbourhood environment. Finally, the present study area represents a typical homogenous neighbourhood, which includes typical low-rise housing in Penang, Malaysia. The findings may not necessarily be applicable to other heterogeneous and/or high-rise neighbourhoods. Thus, further studies should be conducted to examine the other environmental dimensions which may influence the urban neighbourhoods’ social suitability.

Author Contributions

Conceptualization, M.H.M.; methodology, M.H.M., A.A., M.J.M.T., M.S.; validation, M.H.M., A.A., M.J.M.T., M.S.; formal analysis, M.H.M.; resources, M.S.; data curation, A.A., M.J.M.T.; writing—original draft preparation, M.H.M., A.A., M.J.M.T., M.S.; writing—review and editing, M.H.M., A.A.; visualization, M.H.M.; funding acquisition, M.H.M., A.A. All authors have read and agreed to the published version of the manuscript.

Funding

This research was funded by the Universiti Sains Malaysia, grant number RUI 1001/PPBGN/8016079.

Institutional Review Board Statement

The study was conducted according to the guidelines of the Universiti Sains Malaysia, and approved by the Human Research Ethics Committee Universiti Sains Malaysia (protocol code USM/JEPeM/19050313).

Informed Consent Statement

Informed consent was obtained from all subjects involved in the study.

Acknowledgments

The authors would like to thank the Universiti Sains Malaysia for providing financial supports under RUI grant (RUI 1001/PPBGN/8016079).

Conflicts of Interest

The authors declare no conflict of interest.

References

  1. Tiezzi, E. Tempi Storici, Tempi Biologici. Vent’anni Dopo; Donzelli Editore: Rome, Italy, 2001; Volume 43. [Google Scholar]
  2. Rotondo, F.; Abastante, F.; Cotella, G.; Lami, I. Questioning low-carbon transition governance: A comparative analysis of European case studies. Sustainability 2020, 12, 10460. [Google Scholar] [CrossRef]
  3. United Nations Sustainable Development Solutions Network (UN SDSN). Data for Development: A Needs Assessment for SDG Monitoring and Statistical Capacity Development; Sustainable Development Solutions Network (SDSN): New York, NY, USA, 2015. [Google Scholar]
  4. Allen, C.; Metternicht, G.; Wiedmann, T. Initial progress in implementing the Sustainable Development Goals (SDGs): A review of evidence from countries. Sustain. Sci. 2018, 13, 1453–1467. [Google Scholar] [CrossRef]
  5. Abastante, F.; Lami, I.; Gaballo, M. Pursuing the SDG11 targets: The role of the sustainability protocols. Sustainability 2021, 13, 3858. [Google Scholar] [CrossRef]
  6. Méndez-Picazo, M.-T.; Galindo-Martín, M.-A.; Castaño-Martínez, M.-S. Effects of sociocultural and economic factors on social entrepreneurship and sustainable development. J. Innov. Knowl. 2021, 6, 69–77. [Google Scholar] [CrossRef]
  7. Tsalis, T.A.; Malamateniou, K.E.; Koulouriotis, D.; Nikolaou, I.E. New challenges for corporate sustainability reporting: United Nations’ 2030 agenda for sustainable development and the sustainable development goals. Corp. Soc. Responsib. Environ. Manag. 2020, 27, 1617–1629. [Google Scholar] [CrossRef]
  8. Rogge, N.; Theesfeld, I.; Strassner, C. Social sustainability through social interaction—A national survey on community gardens in Germany. Sustainability 2018, 10, 1085. [Google Scholar] [CrossRef] [Green Version]
  9. Ahman, H. Social sustainability—Society at the intersection of development and maintenance. Local Environ. 2013, 18, 1153–1166. [Google Scholar] [CrossRef]
  10. Kohon, J. Social inclusion in the sustainable neighborhood? Idealism of urban social sustainability theory complicated by realities of community planning practice. City Cult. Soc. 2018, 15, 14–22. [Google Scholar] [CrossRef]
  11. Zhang, F.; Li, D.; Chan, A.P. Diverse contributions of multiple mediators to the impact of perceived neighborhood environment on the overall quality of life of community-dwelling seniors: A cross-sectional study in Nanjing, China. Habitat Int. 2020, 104, 102253. [Google Scholar] [CrossRef]
  12. Dabbous, A.; Tarhini, A. Does sharing economy promote sustainable economic development and energy efficiency? Evidence from OECD countries. J. Innov. Knowl. 2021, 6, 58–68. [Google Scholar] [CrossRef]
  13. Bramley, G.; Power, S. Urban form and social sustainability: The role of density and housing type. Environ. Plan. B Plan. Des. 2009, 36, 30–48. [Google Scholar] [CrossRef]
  14. Latham, K.; Clarke, P.J. Neighborhood disorder, perceived social cohesion, and social participation among older Americans: Findings from the national health & aging trends study. J. Aging Health 2016, 30, 3–26. [Google Scholar] [CrossRef]
  15. Vallance, S.; Perkins, H.C.; Dixon, J.E. What is social sustainability? A clarification of concepts. Geoforum 2011, 42, 342–348. [Google Scholar] [CrossRef]
  16. Dempsey, N.; Bramley, G.; Power, S.; Brown, C. The social dimension of sustainable development: Defining urban social sustainability. Sustain. Dev. 2011, 19, 289–300. [Google Scholar] [CrossRef]
  17. Shirazi, M.R.; Keivani, R. Critical reflections on the theory and practice of social sustainability in the built environment—A meta-analysis. Local Environ. 2017, 22, 1526–1545. [Google Scholar] [CrossRef] [Green Version]
  18. Shirazi, M.R.; Keivani, R. The triad of social sustainability: Defining and measuring social sustainability of urban neighbourhoods. Urban Res. Pr. 2018, 12, 448–471. [Google Scholar] [CrossRef]
  19. Marzbali, M.H.; Safizadeh, M.; Tilaki, M.; Abdullah, A. Does facilitating human–place bonds alleviate the negative effects of incivilities on health? Sustainability 2021, 13, 1894. [Google Scholar] [CrossRef]
  20. Lorenc, T.; Clayton, S.; Neary, D.; Whitehead, M.; Petticrew, M.P.; Thomson, H.; Cummins, S.; Sowden, A.; Renton, A. Crime, fear of crime, environment, and mental health and wellbeing: Mapping review of theories and causal pathways. Health Place 2012, 18, 757–765. [Google Scholar] [CrossRef]
  21. Shirazi, M.; Keivani, R. Social sustainability of compact neighbourhoods evidence from London and Berlin. Sustainability 2021, 13, 2340. [Google Scholar] [CrossRef]
  22. Choi, Y.J.; Matz-Costa, C. Perceived neighborhood safety, social cohesion, and psychological health of older adults. Gerontologist 2017, 58, 196–206. [Google Scholar] [CrossRef] [Green Version]
  23. Dave, S. Neighbourhood density and social sustainability in cities of developing countries. Sustain. Dev. 2011, 19, 189–205. [Google Scholar] [CrossRef]
  24. Chan, E.H.W.; Lee, G.K.L. Critical factors for improving social sustainability of urban renewal projects. Soc. Indic. Res. 2007, 85, 243–256. [Google Scholar] [CrossRef]
  25. Bielik, M.; König, R.; Schneider, S.; Varoudis, T. Measuring the impact of street network configuration on the accessibility to people and walking attractors. Netw. Spat. Econ. 2018, 18, 657–676. [Google Scholar] [CrossRef]
  26. Shirazi, M.R.; Keivani, R.; Brownill, S.; Watson, G.B. Promoting social sustainability of urban neighbourhoods: The case of Bethnal Green, London. Int. J. Urban Reg. Res. 2020, 44, 1–25. [Google Scholar] [CrossRef]
  27. Abastante, F.; Lami, I.; Mecca, B. How COVID-19 influences the 2030 agenda: Do the practices of achieving the sustainable development goal 11 need rethinking and adjustment? Valori Valutazioni 2020, 26, 11–23. [Google Scholar] [CrossRef]
  28. Lami, I.M.; Mecca, B. Assessing social sustainability for achieving sustainable architecture. Sustainability 2021, 13, 142. [Google Scholar] [CrossRef]
  29. Asprone, D.; Pascale, C.; Prota, A.; Rubino, E.; Manfredi, G. La sostenibilità in edilizia ed i metodi di valutazione: L’esperienza della ricostruzione post-sisma a L’Aquila. Progett. Sismica 2011, 2, 45–55. [Google Scholar]
  30. United Nations. The Millennium Development Goals Report 2015; United Nations: New York, NY, USA, 2015. [Google Scholar]
  31. Akuraju, V.; Pradhan, P.; Haase, D.; Kropp, J.P.; Rybski, D. Relating SDG11 indicators and urban scaling—An exploratory study. Sustain. Cities Soc. 2020, 52, 101853. [Google Scholar] [CrossRef]
  32. Franco, I.B.; Chatterji, T.; Derbyshire, E.; Tracey, J. Actioning the Global Goals for Local Impact; Springer: Berlin/Heidelberg, Germany, 2019. [Google Scholar]
  33. Vaidya, H.; Chatterji, T. SDG 11 sustainable cities and communities. In Actioning the Global Goals for Local Impact; Science for Sustainable Societies; Springer: Berlin/Heidelberg, Germany, 2020; pp. 173–185. [Google Scholar]
  34. Lotfata, A.; Ataöv, A. Urban streets and urban social sustainability: A case study on Bagdat street in Kadikoy, Istanbul. Eur. Plan. Stud. 2019, 28, 1735–1755. [Google Scholar] [CrossRef]
  35. Colantonio, A. Urban social sustainability themes and assessment methods. Proc. Inst. Civ. Eng. Urban Des. Plan. 2010, 163, 79–88. [Google Scholar] [CrossRef]
  36. Mehan, A.; Soflaei, F. Social sustainability in urban context: Concepts, definitions, and principles. In Architectural Research Addressing Societal Challenges; CRC Press: Boca Raton, FL, USA, 2017; pp. 293–300. [Google Scholar]
  37. Kharazishvili, Y.; Kwilinski, A.; Grishnova, O.; Dzwigol, H. Social safety of society for developing countries to meet sustainable development standards: Indicators, level, strategic benchmarks (with calculations based on the case study of Ukraine). Sustainability 2020, 12, 8953. [Google Scholar] [CrossRef]
  38. Munda, G. Social multi-criteria evaluation: Methodological foundations and operational consequences. Eur. J. Oper. Res. 2004, 158, 662–677. [Google Scholar] [CrossRef]
  39. Sierra, L.A.; Yepes, V.; Pellicer, E. A review of multi-criteria assessment of the social sustainability of infrastructures. J. Clean. Prod. 2018, 187, 496–513. [Google Scholar] [CrossRef]
  40. Costa, A.S.; Lami, I.M.; Greco, S.; Figueira, J.R.; Borbinha, J. Assigning a house for refugees: An application of a multiple criteria nominal classification method. Oper. Res. 2019, 1–37. [Google Scholar] [CrossRef]
  41. Lami, I.; Moroni, S. How can I help you? Questioning the role of evaluation techniques in democratic decision-making processes. Sustainability 2020, 12, 8568. [Google Scholar] [CrossRef]
  42. Kefayati, Z.; Moztarzadeh, H. Developing effective social sustainability indicators in architecture. Bull. Environ. Pharmacol. Life Sci. 2015, 4, 40–56. [Google Scholar]
  43. Shaw, C.R.; McKay, H.D. Juvenile Delinquency and Urban Areas; University of Chicago Press: Chicago, IL, USA, 1942. [Google Scholar]
  44. Lynch, M.J.; Boggess, L.N. Ecocities, crime, and justice: Ecocity theory, social disorganization, and green criminology. Sociol. Spectr. 2015, 35, 309–328. [Google Scholar] [CrossRef]
  45. Schnell, C. Opportunity theories and the bachelor. In Theories of Crime Through Popular Culture; Springer: Berlin/Heidelberg, Germany, 2021; pp. 87–105. [Google Scholar]
  46. Sampson, R.J.; Groves, W.B. Community structure and crime: Testing social-disorganization theory. Am. J. Sociol. 1989, 94, 774–802. [Google Scholar] [CrossRef] [Green Version]
  47. Sampson, R.J.; Wilson, W.J.; Hagan, J.; Peterson, R.D. Toward a theory of race, crime, and urban inequality. In Crime and Inequality; Hagan, J., Peterson, R.D., Eds.; Stanford University Press: Palo Alto, CA, USA, 1995; pp. 37–54. [Google Scholar]
  48. Bellair, P.E.; Browning, C.R. Contemporary disorganization research: An assessment and further test of the systemic model of neighborhood crime. J. Res. Crime Delinq. 2010, 47, 496–521. [Google Scholar] [CrossRef]
  49. Cohen, L.E.; Felson, M. Social change and crime rate trends: A routine activity approach. Am. Sociol. Rev. 1979, 44, 588. [Google Scholar] [CrossRef]
  50. Daoud, N.; Sergienko, R.; O’Campo, P.; Shoham-Vardi, I. Disorganization theory, neighborhood social capital, and ethnic inequalities in intimate partner violence between Arab and Jewish women citizens of Israel. J. Hered. 2017, 94, 648–665. [Google Scholar] [CrossRef] [PubMed]
  51. Bursik, R., Jr.; Grasmick, H. Neighborhoods and Crime: The Dimensions of Effective Community Control; Lexington Books: New York, NY, USA, 1993. [Google Scholar]
  52. Bursik, R.J., Jr.; Grasmick, H.G. Neighborhood-based networks and the control of crime and delinquency. In Crime and Public Policy: Putting Theory to Work; Barlow, H.D., Ed.; Routledge: Abingdon, UK, 1995; pp. 107–130. [Google Scholar]
  53. Brundtland, G.H. World Commission on environment and development. Environ. Policy Law 1985, 14, 26–30. [Google Scholar] [CrossRef]
  54. Yoo, C.; Lee, S. Neighborhood built environments affecting social capital and social sustainability in Seoul, Korea. Sustainability 2016, 8, 1346. [Google Scholar] [CrossRef] [Green Version]
  55. Larimian, T.; Sadeghi, A. Measuring urban social sustainability: Scale development and validation. Environ. Plan. B Urban Anal. City Sci. 2021, 48, 621–637. [Google Scholar] [CrossRef] [Green Version]
  56. Littig, B.; Griessler, E. Social sustainability: A catchword between political pragmatism and social theory. Int. J. Sustain. Dev. 2005, 8, 65. [Google Scholar] [CrossRef] [Green Version]
  57. Karji, A.; Woldesenbet, A.; Khanzadi, M.; Tafazzoli, M. Assessment of social sustainability indicators in mass housing construction: A case study of Mehr housing project. Sustain. Cities Soc. 2019, 50, 101697. [Google Scholar] [CrossRef]
  58. Mehta, V. Lively streets: Determining environmental characteristics to support social behavior. J. Plan. Educ. Res. 2007, 27, 165–187. [Google Scholar] [CrossRef]
  59. Hemani, S.; Das, A.K.; Chowdhury, A. Influence of urban forms on social sustainability: A case of Guwahati, Assam. Urban Des. Int. 2016, 22, 168–194. [Google Scholar] [CrossRef]
  60. McKenzie, S. Social Sustainability: Towards Some Definitions; University of South Australia: Adelaide, SA, Australia, 2004. [Google Scholar]
  61. Al-Omoush, K.S.; Simón-Moya, V.; Sendra-García, J. The impact of social capital and collaborative knowledge creation on e-business proactiveness and organizational agility in responding to the COVID-19 crisis. J. Innov. Knowl. 2020, 5, 279–288. [Google Scholar] [CrossRef]
  62. Du, M.; Zhang, X. Urban greening: A new paradox of economic or social sustainability? Land Use Policy 2020, 92, 104487. [Google Scholar] [CrossRef]
  63. Engel, L.; Chudyk, A.M.; Ashe, M.C.; McKay, H.A.; Whitehurst, D.G.T.; Bryan, S. Older adults’ quality of life—Exploring the role of the built environment and social cohesion in community-dwelling seniors on low income. Soc. Sci. Med. 2016, 164, 1–11. [Google Scholar] [CrossRef] [PubMed]
  64. Dempsey, N. Are good-quality environments socially cohesive? Measuring quality and cohesion in urban neighbourhoods. Town Plan. Rev. 2009, 80, 315–345. [Google Scholar] [CrossRef]
  65. Alidoust, S.; Bosman, C.; Holden, G. Talking while walking: An investigation of perceived neighbourhood walkability and its implications for the social life of older people. Neth. J. Hous. Environ. Res. 2018, 33, 133–150. [Google Scholar] [CrossRef]
  66. Parra, D.C.; Gomez, L.F.; Sarmiento, O.L.; Buchner, D.; Brownson, R.; Schimd, T.; Gómez, V.; Lobelo, F. Perceived and objective neighborhood environment attributes and health related quality of life among the elderly in Bogotá, Colombia. Soc. Sci. Med. 2010, 70, 1070–1076. [Google Scholar] [CrossRef] [PubMed]
  67. Gebel, K.; Bauman, A.E.; Sugiyama, T.; Owen, N. Mismatch between perceived and objectively assessed neighborhood walkability attributes: Prospective relationships with walking and weight gain. Health Place 2011, 17, 519–524. [Google Scholar] [CrossRef] [PubMed]
  68. Wilson, J.Q.; Kelling, G.L. “Broken windows”: Atlantic monthly. In The City Reader; Routledge: Abington, UK, 1982; pp. 309–319. [Google Scholar]
  69. Skogan, W.G. Disorder and Decline: Crime and the Spiral of Decay in American Neighborhoods; The Free Press: New York, NY, USA, 1990. [Google Scholar]
  70. Robinson, J.B.; Lawton, B.A.; Taylor, R.B.; Perkins, D.D. Multilevel longitudinal impacts of incivilities: Fear of crime, expected safety, and block satisfaction. J. Quant. Criminol. 2003, 19, 237–274. [Google Scholar] [CrossRef]
  71. Liska, A.E.; Bellair, P.E. Violent-crime rates and racial composition: Covergence over time. Am. J. Sociol. 1995, 101, 578–610. [Google Scholar] [CrossRef]
  72. Armitage, R. Reducing Crime Through Secured by Design: A Systematic Review. In Proceedings of the National Training Event, Northampton, UK, 4–15 March 2017. [Google Scholar]
  73. Eizenberg, E.; Jabareen, Y. Social sustainability: A new conceptual framework. Sustainability 2017, 9, 68. [Google Scholar] [CrossRef] [Green Version]
  74. Lewicka, M. What makes neighborhood different from home and city? Effects of place scale on place attachment. J. Environ. Psychol. 2010, 30, 35–51. [Google Scholar] [CrossRef]
  75. Mason, M.J. Attributing activity space as risky and safe: The social dimension to the meaning of place for urban adolescents. Health Place 2010, 16, 926–933. [Google Scholar] [CrossRef] [Green Version]
  76. Larimian, T.; Freeman, C.; Palaiologou, F.; Sadeghi, N. Urban social sustainability at the neighbourhood scale: Measurement and the impact of physical and personal factors. Local Environ. 2020, 25, 747–764. [Google Scholar] [CrossRef]
  77. French, S.; Wood, L.; Foster, S.; Giles-Corti, B.; Frank, L.; Learnihan, V. Sense of community and its association with the neighborhood built environment. Environ. Behav. 2014, 46, 677–697. [Google Scholar] [CrossRef]
  78. López-Cabarcos, M.Á.; Ribeiro-Soriano, D.; Piñeiro-Chousa, J. All that glitters is not gold. The rise of gaming in the COVID-19 pandemic. J. Innov. Knowl. 2020, 5, 289–296. [Google Scholar] [CrossRef]
  79. Xie, X.; Zang, Z.; Ponzoa, J.M. The information impact of network media, the psychological reaction to the COVID-19 pandemic, and online knowledge acquisition: Evidence from Chinese college students. J. Innov. Knowl. 2020, 5, 297–305. [Google Scholar] [CrossRef]
  80. Coleman, J.S. Social Capital in the Creation of Human Capital; Oxford University Press: Oxford, UK, 2003. [Google Scholar] [CrossRef]
  81. Dempsey, N. Does quality of the built environment affect social cohesion? Proc. Inst. Civ. Eng. Urban Des. Plan. 2008, 161, 105–114. [Google Scholar] [CrossRef]
  82. Krizek, K.J. Operationalizing neighborhood accessibility for land use-travel behavior research and regional modeling. J. Plan. Educ. Res. 2003, 22, 270–287. [Google Scholar] [CrossRef]
  83. Foster, S.; Giles-Corti, B.; Knuiman, M. Neighbourhood design and fear of crime: A socio-ecological examination of the correlates of residents’ fear in new suburban housing developments. Health Place 2010, 16, 1156–1165. [Google Scholar] [CrossRef]
  84. Marzbali, M.H.; Abdullah, A.; Ignatius, J.; Tilaki, M.J.M. Ethnic relations, crime and disorder in urban neighbourhoods: Moderating role of neighbourhood type in Penang, Malaysia. Secur. J. 2019, 32, 476–500. [Google Scholar] [CrossRef]
  85. Abdullah, A.; Safizadeh, M.; Marzbali, M.H.; Tilaki, M.J.M. The mediating role of sense of belonging in the relationship between the built environment and victimisation: A case of Penang, Malaysia. Open House Int. 2021, 46, 173–188. [Google Scholar] [CrossRef]
  86. Hedayati-Marzbali, M.; Tilaki, M.J.M.; Abdullah, A. Assessing the effect of neighbourhood structure on residents’ perceptions of safety in gated communities: A case study of Iran. Safer Communities 2017, 16, 3–19. [Google Scholar] [CrossRef]
  87. Sampson, R.J.; Raudenbush, S.W.; Earls, F. Neighborhoods and violent crime: A multilevel study of collective efficacy. Science 1997, 277, 918–924. [Google Scholar] [CrossRef] [PubMed]
  88. Ringle, C.M.; Wende, S.; Becker, J.-M. SmartPLS 3; SmartPLS: Bönningstedt, Germany, 2015. [Google Scholar]
  89. Hair, J.F.; Hult, G.T.M.; Ringle, C.M.; Sarstedt, M. A Primer on Partial Least Squares Structural Equation Modeling (PLS-SEM); Sage: Thousand Oaks, CA, USA, 2017. [Google Scholar]
  90. Fornell, C.; Larcker, D.F. Evaluating structural equation models with unobservable variables and measurement error. J. Mark. Res. 1981, 18, 39–50. [Google Scholar] [CrossRef]
  91. Henseler, J.; Ringle, C.M.; Sarstedt, M. A new criterion for assessing discriminant validity in variance-based structural equation modeling. J. Acad. Mark. Sci. 2015, 43, 115–135. [Google Scholar] [CrossRef] [Green Version]
  92. Podsakoff, P.M.; MacKenzie, S.B.; Lee, J.Y.; Podsakoff, N.P. Common method biases in behavioral research: A critical review of the literature and recommended remedies. J. Appl. Psychol. 2003, 88, 879–903. [Google Scholar] [CrossRef] [PubMed]
  93. Hayes, A.F. Beyond Baron and Kenny: Statistical mediation analysis in the new millennium. Commun. Monogr. 2009, 76, 408–420. [Google Scholar] [CrossRef]
  94. Shrout, P.E.; Bolger, N. Mediation in experimental and nonexperimental studies: New procedures and recommendations. Psychol. Methods 2002, 7, 422–445. [Google Scholar] [CrossRef]
  95. Chin, W.W. The partial least squares approach for structural equation modeling. In Modern Methods for Business Research; Marcoulides, G.A., Ed.; Lawrence Erlbaum: Mahwah, NJ, USA, 1998; pp. 295–336. [Google Scholar]
  96. Hair, J.F.; Ringle, C.M.; Sarstedt, M. Partial least squares structural equation modeling: Rigorous applications, better results and higher acceptance. Long Range Plan. 2013, 46, 1–12. [Google Scholar] [CrossRef]
  97. Berg, P.V.D.; Sharmeen, F.; Weijs-Perrée, M. On the subjective quality of social Interactions: Influence of neighborhood walkability, social cohesion and mobility choices. Transp. Res. Part A Policy Pr. 2017, 106, 309–319. [Google Scholar] [CrossRef]
  98. Sharmeen, F.; Arentze, T.; Timmermans, H. Dynamics of face-to-face social interaction frequency: Role of accessibility, urbanization, changes in geographical distance and path dependence. J. Transp. Geogr. 2014, 34, 211–220. [Google Scholar] [CrossRef]
  99. Cairnduff, S. Sport and Recreation for Indigenous Youth in the Northern Territory: Scoping Research Priorities for Health and Social Outcomes; Cooperative Research Centre for Aboriginal and Tropical Health and Australian Sports Commission: Darwin, NT, Australia, 2001. [Google Scholar]
  100. Park, S.-H.; Park, B.-H. Influence of neighborhood’s characters on social capital. Soc. Welf. Policy 2012, 39, 85–123. [Google Scholar]
  101. Mancus, G.C.; Campbell, J. Integrative review of the intersection of green space and neighborhood violence. J. Nurs. Sch. 2018, 50, 117–125. [Google Scholar] [CrossRef] [PubMed]
  102. Rossen, L.M.; Pollack, K.M.; Curriero, F.C.; Shields, T.M.; Smart, M.J.; Furr-Holden, C.D.M.; Cooley-Strickland, M. Neighborhood incivilities, perceived neighborhood safety, and walking to school among urban-dwelling children. J. Phys. Act. Health 2011, 8, 262–271. [Google Scholar] [CrossRef] [PubMed] [Green Version]
  103. Miles, R. Neighborhood disorder, perceived safety, and readiness to encourage use of local playgrounds. Am. J. Prev. Med. 2008, 34, 275–281. [Google Scholar] [CrossRef] [PubMed]
  104. Ross, C.E.; Jang, S.J. Neighborhood disorder, fear, and mistrust: The buffering role of social ties with neighbors. Am. J. Community Psychol. 2000, 28, 401–420. [Google Scholar] [CrossRef]
Figure 1. Parameter estimates of the PLS analysis.
Land 10 01079 g001
Table 1. Measurement model results for the latent constructs.
ConstructsItems Loadings Alpha (α)CRrho_At ValueAVE
Social sustainability SocSus10.9180.9510.9630.95276.6480.838
SocSus20.950 143.652
SocSus30.951 138.030
SocSus40.900 59.772
SocSus50.856 36.980
Social cohesionSocCoh10.8210.9130.9320.91925.5130.696
SocCoh20.822 34.013
SocCoh30.822 23.973
SocCoh40.887 44.780
SocCoh50.875 47.224
SocCoh60.773 21.775
AccessibilityPathway0.9530.6710.8420.97346.3090.730
Traffic0.743 11.257
Perception of safetyPercSafety10.8710.9010.9230.91733.8890.668
PercSafety20.795 14.149
PercSafety30.871 29.339
PercSafety40.810 15.072
PercSafety50.726 19.269
PercSafety60.822 26.043
Physical disorderPhysicDis10.8670.9440.9550.94642.4560.752
PhysicDis20.901 70.358
PhysicDis30.917 80.051
PhysicDis40.791 22.913
PhysicDis50.864 39.566
PhysicDis60.822 28.663
PhysicDis70.899 60.708
Social disorderSocDis10.8380.9300.9450.93136.7680.741
SocDis20.853 25.816
SocDis30.885 47.782
SocDis40.832 33.993
SocDis50.898 64.733
SocDis60.857 42.625
Table 2. Assessment of reliability and validity of constructs.
AccessibilityPerception of SafetyPhysical DisorderSocial CohesionSocial DisorderSocial Sustainability
Accessibility0.854
Perception of safety−0.0520.817
Physical disorder0.305−0.3890.867
Social cohesion−0.1420.311−0.1150.834
Social disorder0.380−0.1760.747−0.0970.861
Social sustainability−0.3240.193−0.2240.750−0.2150.916
Note: The diagonals (in bold) represent the square root of the AVE.
Table 3. Heterotrait–monotrait (HTMT) results.
AccessibilityPerception of SafetyPhysical DisorderSocial CohesionSocial Disorder
Perception of safety0.182
CI.90 (0.131, 0.287)
Physical disorder0.329
CI.90 (0.232, 0.469)
0.413
CI.90 (0.286, 0.527)
Social cohesion0.163
CI.90 (0.093, 0.320)
0.324
CI.90 (0.199, 0.442)
0.153
CI.90 (0.128, 0.250)
Social disorder0.405
CI.90 (0.282, 0.554)
0.185
CI.90 (0.118, 0.311)
0.796
CI.90 (0.724, 0.861)
0.134
CI.90 (0.113, 0.249)
Social sustainability0.379
CI.90 (0.234, 0.523)
0.186
CI.90 (0.124, 0.311)
0.235
CI.90 (0.114, 0.365)
0.795
CI.90 (0.715, 0.861)
0.227
CI.90 (0.106, 0.380)
Table 4. Path coefficient and hypothesis testing (direct effects).
Hs Relationship βt Value Decision f2VIF
H1Accessibility → Disorder0.3646.751 ***Supported0.152 (Moderate)1.000
H2Social Cohesion → Social sustainability0.73618.661 ***Supported1.268 (Substantial)1.128
H3Accessibility → Social sustainability−0.1844.276 ***Supported0.076 (Small)1.180
H4Disorder → Social sustainability−0.1092.277 **Supported0.025 (Small)1.283
H5Accessibility → Perception of safety0.0720.820Not supported0.0051.152
H6Perception of safety → Social sustainability−0.0801.817Not supported0.014 1.227
H7Accessibility → Social Cohesion−0.1392.107 **Supported0.020 (Small)1.158
Beta = regression weight, t values are computed through bootstrapping procedure with 247 cases and 5000 samples; ** p < 0.05, *** p < 0.01.
Table 5. Hypothesis testing (indirect effects).
HsSpecific indirect EffectPath Coefficients (O)Standard Deviation
(STDEV)
T Statistics (|O/STDEV|)p ValuesDecisionVAF (%)
H8Accessibility → Disorder → SS−0.0402.1122.112 **0.035Supported28.57
H9Disorder → PoS → SS0.0271.6021.6020.109Not supported
H10Disorder → SC → SS0.0250.0610.4110.681Not supported
H11Disorder → PoS → SC → SS−0.0790.0213.705 ***0.000Supported58.09
Note. *** p < 0.01; ** p < 0.05, VAF (variance accounted for) = indirect effect/total effect. SC = Social cohesion; PoS = Perception of safety; SS = Social sustainability.
Publisher’s Note: MDPI stays neutral with regard to jurisdictional claims in published maps and institutional affiliations.

