
Is Expansion or Regulation more Critical for Existing Protected Areas? A Case Study on China’s Eco-Redline Policy in Chongqing Capital


Abstract
1. Introduction
2. Materials and Methods
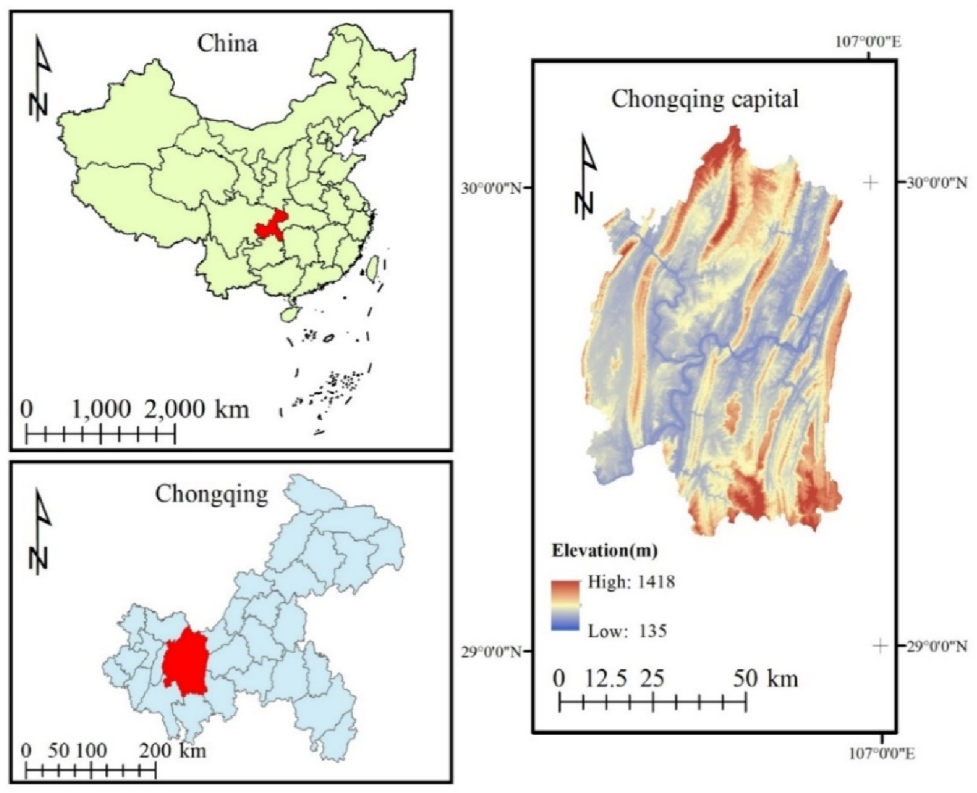
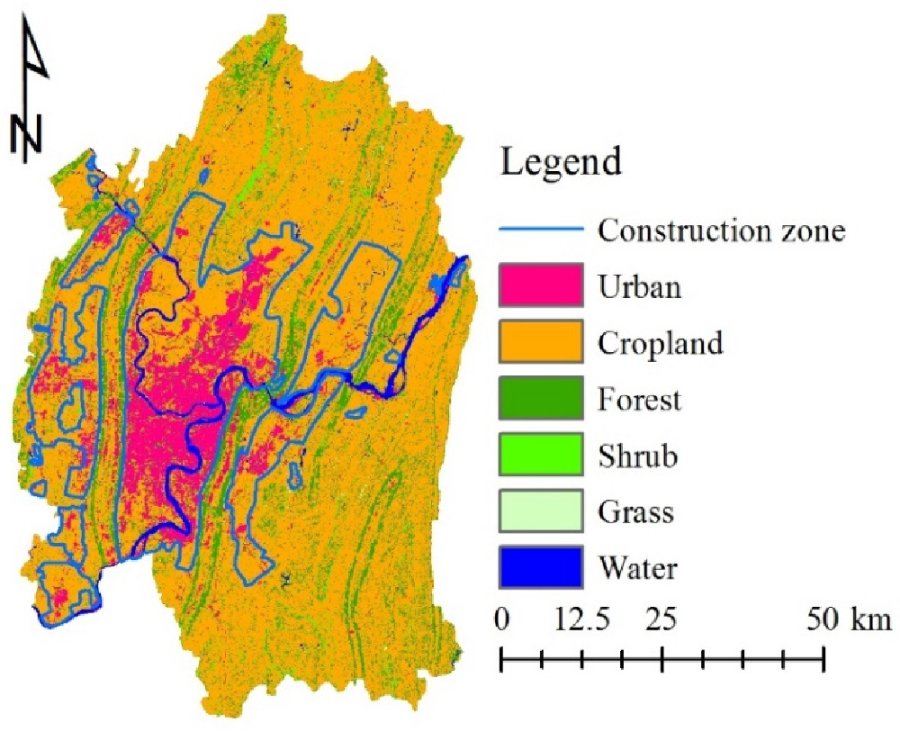
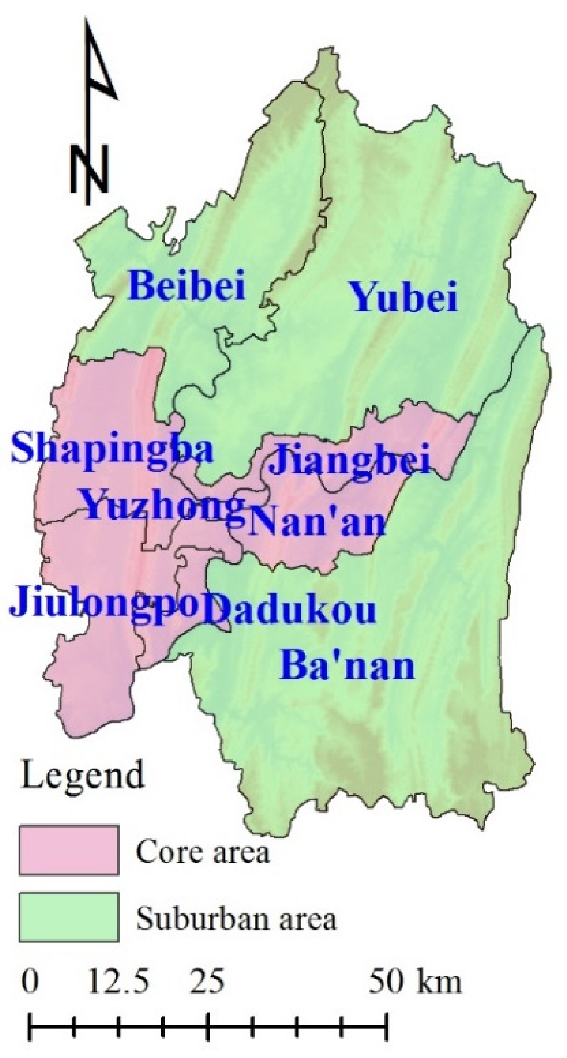
2.1. Study Area
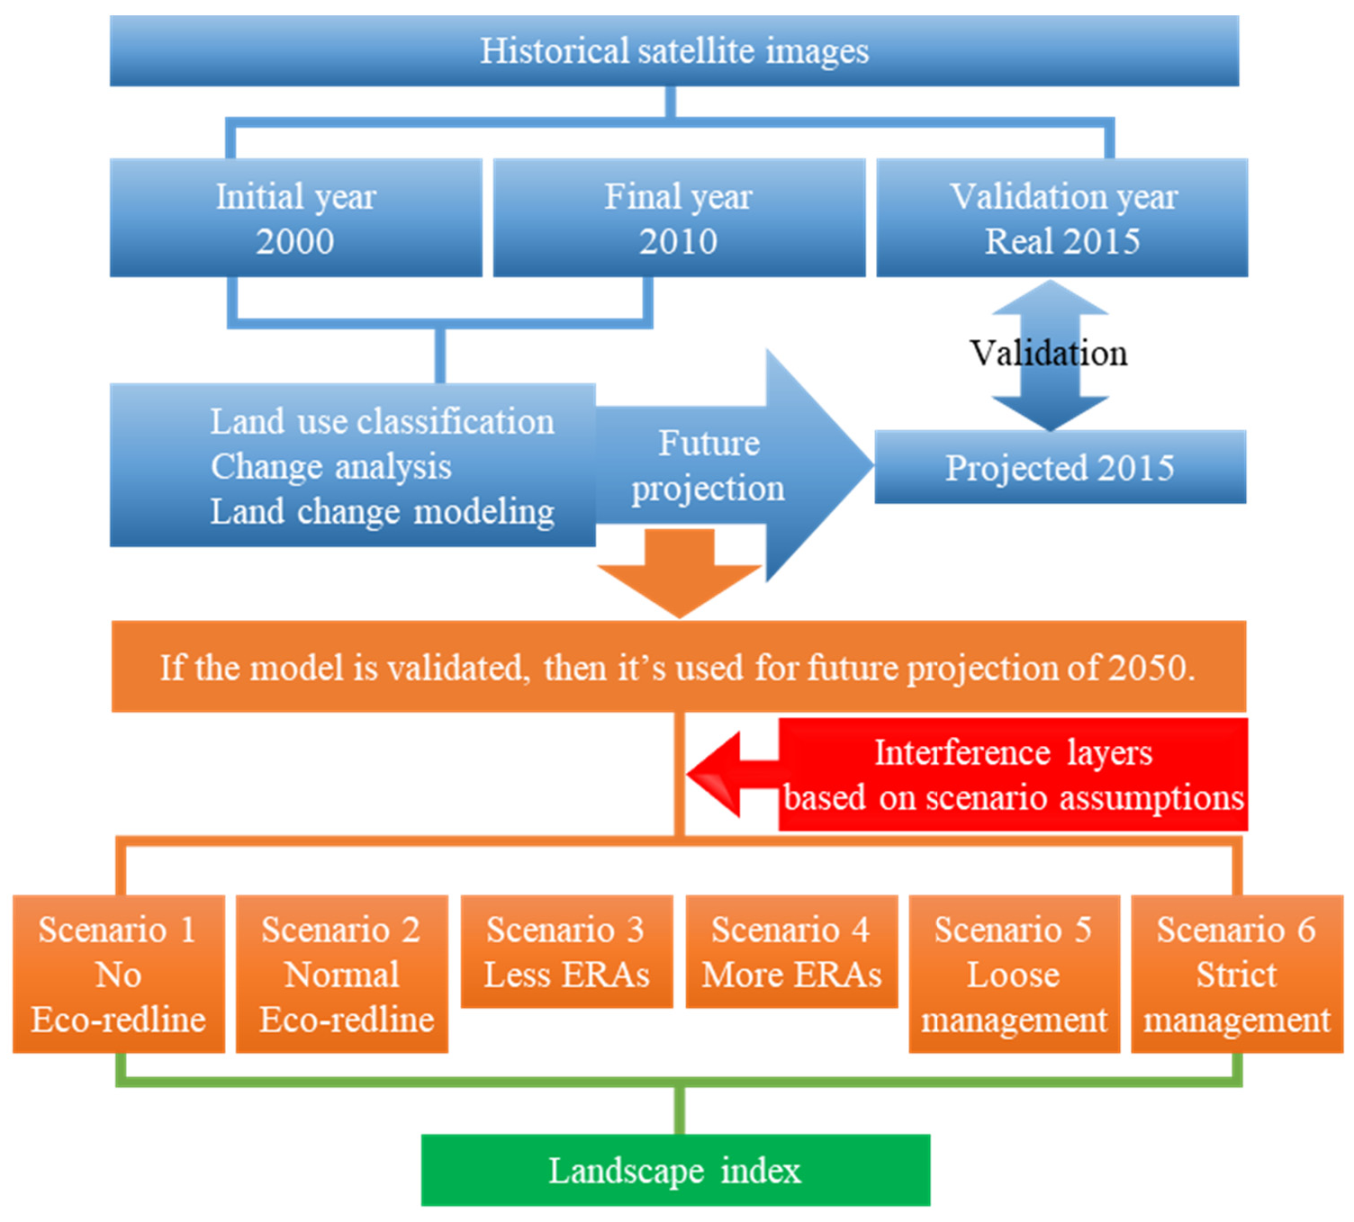
2.2. Framework of Analysis
2.3. Data Acquisition of Historical Satellite Images
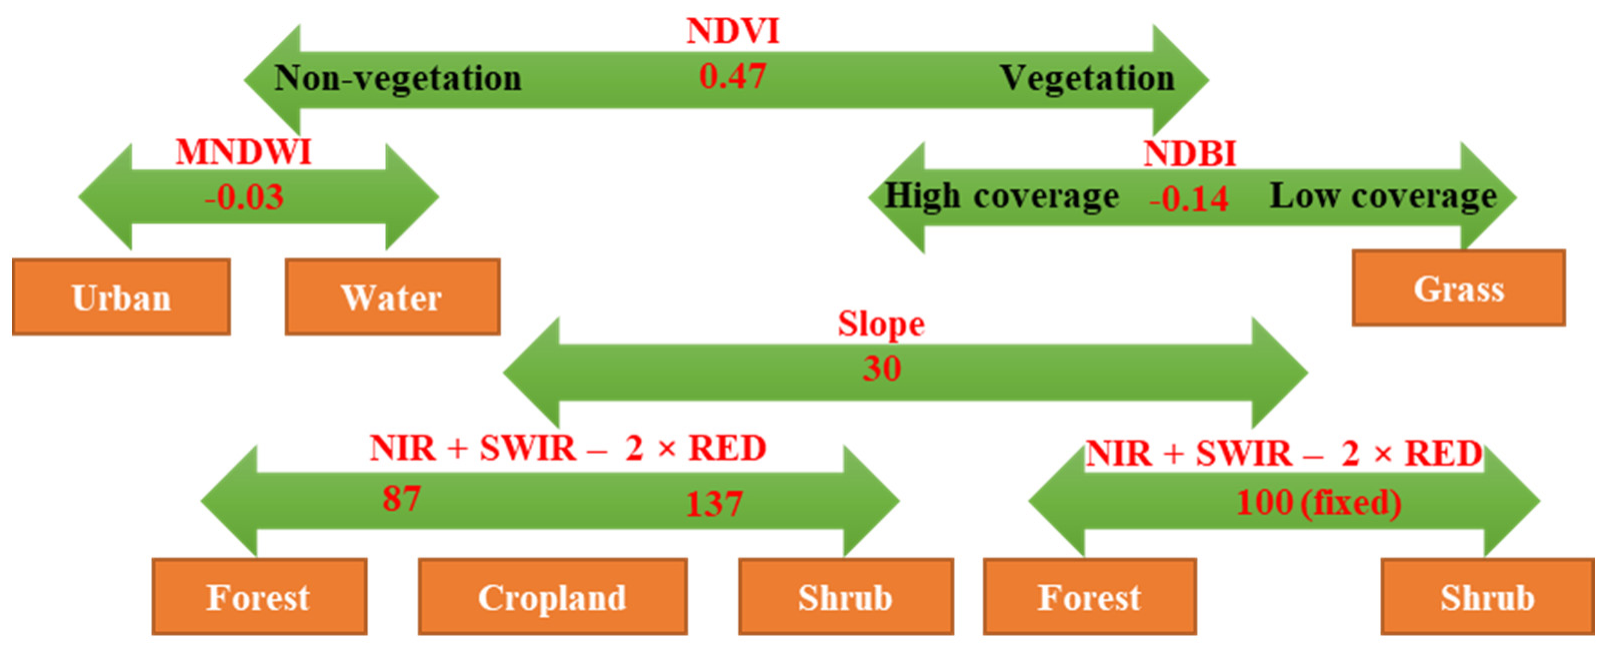
2.4. LULC Classification
2.5. Land Change Modeling
2.5.1. Identification of Major LULC Transitions
2.5.2. Determination of Explanatory Variables
2.5.3. Incorporation of Government-Led Land Development
2.5.4. Validation of the Model
2.5.5. Road Growth Settings
2.5.6. LULC Projection
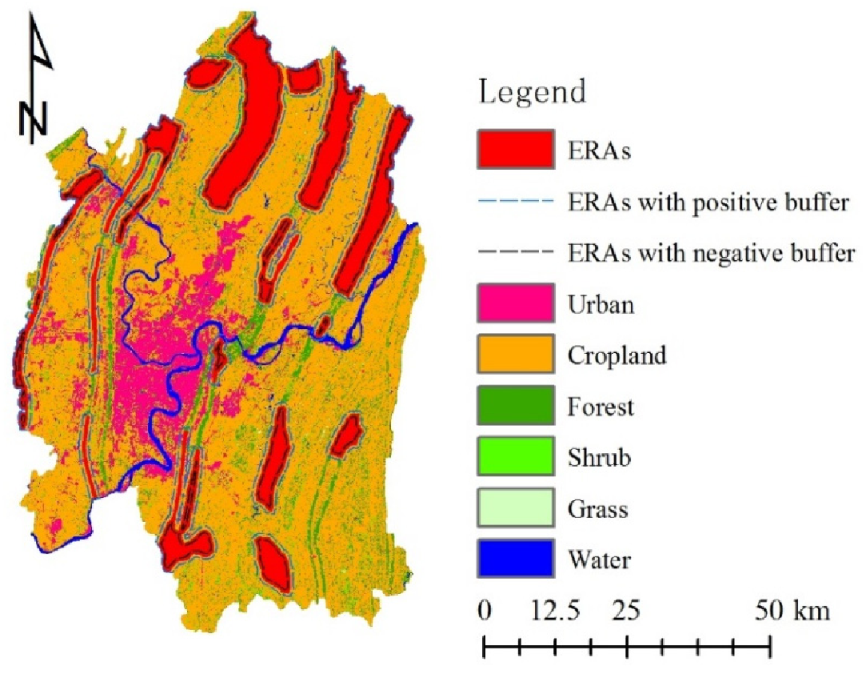
2.6. Scenario Settings and Conversions
2.7. Future Projection for 2050
2.8. Landscape Index
2.9. Statistical Analysis
3. Results
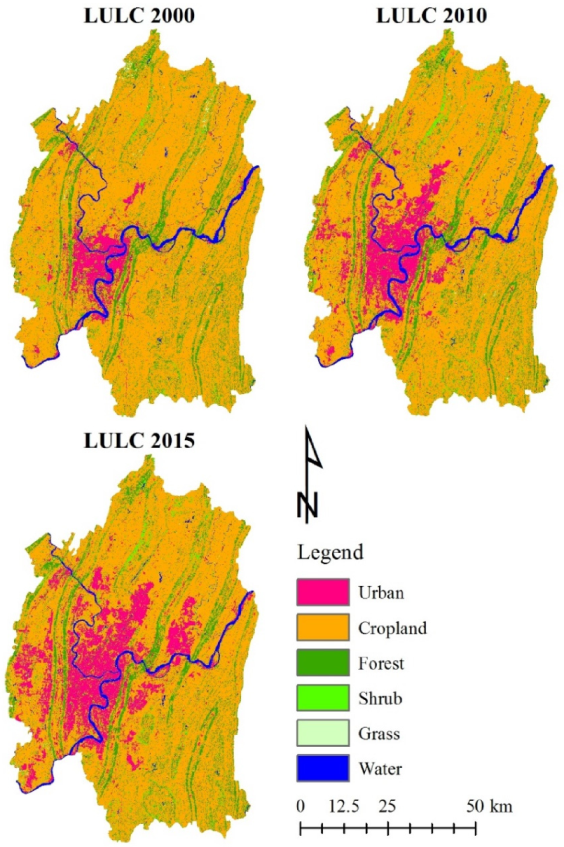
3.1. Historical LULC Changes
3.2. Land Change Modeling
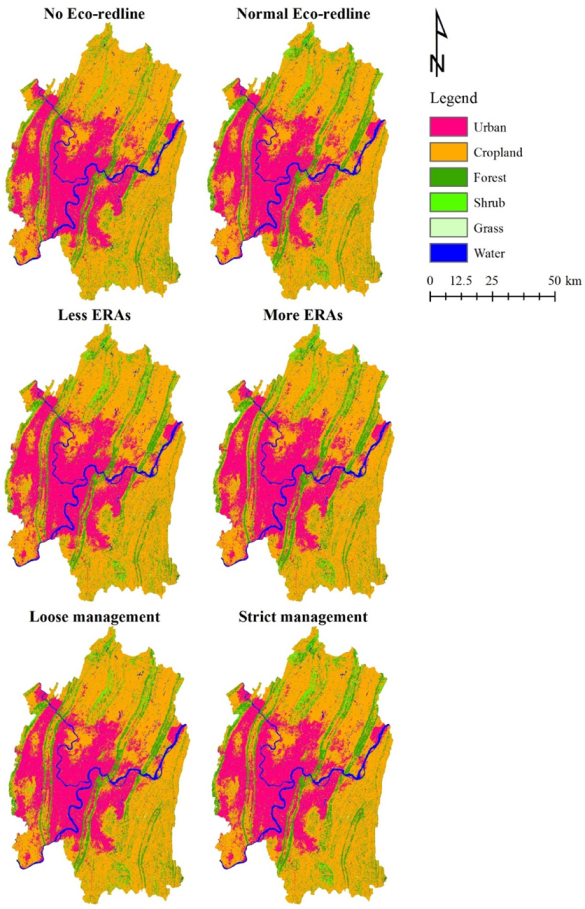
3.3. LULC in 2050 under Six Scenarios
3.4. Landscape Indices of 2050 LULC Images
4. Discussion
4.1. The Eco-Redline Policy Helps to Promote Land-Use Compaction
4.2. Continue to Increase ERAs to Achieve Significant Effects
4.3. Provide Sufficient Support to Ensure Current Management Intensity
4.4. Limitations and Perspectives
5. Conclusions
Author Contributions
Funding
Institutional Review Board Statement
Informed Consent Statement
Data Availability Statement
Conflicts of Interest
References
- Pimm, S.L.; Jenkins, C.N.; Li, B.V. How to protect half of Earth to ensure it protects sufficient biodiversity. Sci. Adv. 2018, 4, eaat2616. [Google Scholar] [CrossRef] [PubMed]
- Palomo, I.; Martín-López, B.; Potschin, M.; Haines-Young, R.; Montes, C. National Parks, buffer zones and surrounding lands: Mapping ecosystem service flows. Ecosyst. Serv. 2013, 4, 104–116. [Google Scholar] [CrossRef]
- Stolton, S.; Dudley, N.; Avcıoğlu Çokçalışkan, B.; Hunter, D.; Ivanić, K.; Kanga, E.; Senior, J. Values and Benefits of Protected Areas. In Protected Area Governance and Management; ANU Press: Canberra, Australia, 2015; pp. 145–168. [Google Scholar]
- Secretariat of the Convention on Biological Diversity. Global Biodiversity Outlook 5. Available online: https://www.cbd.int/gbo5 (accessed on 20 September 2021).
- Convention on Biological Diversity. Zero Draft of the Post-2020 Global Biodiversity Framework (CBD/WG2020/2/3, CBD, 2020). Available online: https://www.cbd.int/doc/c/9a1b/c778/8e3ea4d851b7770b59d5a524/wg2020-02-l-02-en.pdf (accessed on 20 September 2021).
- Woodley, S.; Locke, H.; Laffoley, D.; Mackinnon, K.; Sandwith, T.; Smart, J. A Review of Evidence for Area-Based Conservation Targets for the Post-2020 Global Biodiversity Framework. Parks 2019, 25, 31–46. [Google Scholar] [CrossRef]
- Heinen, J. International trends in protected areas policy and management. In Protected Area Management; Intech: Rijeka, Croatia, 2012; pp. 1–18. [Google Scholar]
- Pereira da Silva, A. Brazilian large-scale marine protected areas: Other “paper parks”? Ocean Coast. Manag. 2019, 169, 104–112. [Google Scholar] [CrossRef]
- Bonham, C.A.; Sacayon, E.; Tzi, E. Protecting imperiled “paper parks”: Potential lessons from the Sierra Chinajá, Guatemala. Biodivers. Conserv. 2008, 17, 1581–1593. [Google Scholar] [CrossRef]
- Di Minin, E.; Toivonen, T. Global Protected Area Expansion: Creating More than Paper Parks. Bioscience 2015, 65, 637–638. [Google Scholar] [CrossRef]
- Ministry of Ecological Environment. Guidelines for Delimitation of Ecological Conservation Redline (in Chinese); Ministry of Ecological Environment, National Development and Reform Commission: Beijing, China, 2017.
- Briassoulis, H. Analysis of Land Use Change: Theoretical and Modeling Approaches. 2019. Available online: https://researchrepository.wvu.edu/rri-web-book/3 (accessed on 12 May 2021).
- IPBES. Summary for Policymakers of the Global Assessment Report on Biodiversity and Ecosystem Services; Intergovernmental Science-Policy Platform on Biodiversity and Ecosystem Services: Bonn, Germany, 2019. [Google Scholar] [CrossRef]
- McDonald, R.I.; Boucher, T.M. Global development and the future of the protected area strategy. Biol. Conserv. 2011, 144, 383–392. [Google Scholar] [CrossRef]
- Martinuzzi, S.; Radeloff, V.C.; Joppa, L.N.; Hamilton, C.M.; Helmers, D.P.; Plantinga, A.J.; Lewis, D.J. Scenarios of future land use change around United States’ protected areas. Biol. Conserv. 2015, 184, 446–455. [Google Scholar] [CrossRef]
- Velazco, S.J.E.; Villalobos, F.; Galvão, F.; De Marco Júnior, P. A dark scenario for Cerrado plant species: Effects of future climate, land use and protected areas ineffectiveness. Divers. Distrib. 2019, 25, 660–673. [Google Scholar] [CrossRef]
- Bai, Y.; Wong, C.P.; Jiang, B.; Hughes, A.C.; Wang, M.; Wang, Q. Developing China’s Ecological Redline Policy using ecosystem services assessments for land use planning. Nat. Commun. 2018, 9, 1–13. [Google Scholar] [CrossRef]
- Jia, Z.; Ma, B.; Zhang, J.; Zeng, W. Simulating spatial-temporal changes of land-use based on ecological redline restrictions and landscape driving factors: A case study in Beijing. Sustainability 2018, 10, 1299. [Google Scholar] [CrossRef]
- Ju, X.; Li, W.; He, L.; Li, J.; Han, L.; Mao, J. Ecological redline policy may significantly alter urban expansion and affect surface runoff in the Beijing-Tianjin-Hebei megaregion of China. Environ. Res. Lett. 2020, 15, 1040b1041. [Google Scholar] [CrossRef]
- Chongqing Municipal People’s Government. Overview of Chongqing (in Chinese). 2020. Available online: http://www.cq.gov.cn/zjzq/ (accessed on 12 May 2021).
- National Bureau of Statistics of the People’s Republic of China. China Statistical Yearbook 2019; China Statistics Press: Beijing, China, 2019. [Google Scholar]
- Chongqing Municipal People’s Government. Notice of Chongqing Municipal People’s Government on Issuing Chongqing’s Ecological Conversation Redline; Chongqing Municipal People’s Government: Chongqing, China, 2018.
- IPBES. Summary for policymakers Chongqing Municipal People’s Government. Overview of Chongqing (in Chinese). 2016. Available online: http://www.cq.gov.cn/zqfz/zhsq/sqjj/201908/t20190825_690412.html (accessed on 12 May 2021).
- Poortinga, A.; Tenneson, K.; Shapiro, A.; Nquyen, Q.; San Aung, K.; Chishtie, F.; Saah, D. Mapping plantations in Myanmar by fusing landsat-8, sentinel-2 and sentinel-1 data along with systematic error quantification. Remote Sens. 2019, 11, 831. [Google Scholar] [CrossRef]
- Zhang, J.; Feng, Z.; Jiang, L. Progress on studies of land use/land cover classification systems (in Chinese). Resour. Sci. 2011, 33, 1195–1203. [Google Scholar]
- Han-qiu, X. A Study on Information Extraction of Water Body with the Modified Normalized Difference Water Index (MNDWI). J. Remote Sens. 2005, 5, 589–595. [Google Scholar]
- Zha, Y.; Ni, S.-X.; Yang, S. An effective approach to automatically extract urban land-use from TM imagery (in Chinese). J. Remote Sens. 2003, 7, 37–40. [Google Scholar]
- Xu, H. A new index for delineating built-up land features in satellite imagery. Int. J. Remote Sens. 2008, 29, 4269–4276. [Google Scholar] [CrossRef]
- Zhang, Z.; Sheng, L.; Yang, J.; Chen, X.-A.; Kong, L.; Wagan, B. Effects of land use and slope gradient on soil erosion in a red soil hilly watershed of southern China. Sustainability 2015, 7, 14309–14325. [Google Scholar] [CrossRef]
- Hua, L.; Zhang, X.; Chen, X.; Yin, K.; Tang, L. A feature-based approach of decision tree classification to map time series urban land use and land cover with Landsat 5 TM and Landsat 8 OLI in a Coastal City, China. ISPRS Int. J. Geo-Inf. 2017, 6, 331. [Google Scholar] [CrossRef]
- Delang, C.O.; Yuan, Z. China’s Grain for Green Program: A Review of the Largest Ecological Restoration and Rural Development Program in the World; Springer International Publishing: Berlin, Germany, 2014. [Google Scholar]
- Haines-Young, R.; Agency, E.E. Land Accounts for Europe 1990–2000: Towards Integrated Land and Ecosystem Accounting: European Environment Agency; 2006. Available online: https://www.eea.europa.eu/publications/eea_report_2006_11 (accessed on 6 October 2021).
- Eastman, J.R.; Toledano, J. A Short Presentation of the Land Change Modeler (LCM) Geomatic Approaches for Modeling Land Change Scenarios; Springer: Berlin/Heidelberg, Germany, 2018; pp. 499–505. [Google Scholar]
- Eastman, J.R.; Solorzano, L.; Fossen, M.V. Transition potential modeling for land cover change. In GIS, Spatial Analysis and Modeling; Maguire, D.J., Batty, M., Goodchild, M.F., Eds.; ESRI Press: Redlands, CA, USA, 2005; pp. 357–385. [Google Scholar]
- Farr, T.G.; Rosen, P.A.; Caro, E.; Crippen, R.; Duren, R.; Hensley, S.; Alsdorf, D. The Shuttle Radar Topography Mission. Rev. Geophys. 2007, 45. [Google Scholar] [CrossRef]
- Chongqing Municipal People’s Government. Urban and Rural General Planning of Chongqing Municipality (2007–2020); Planning and Natural Resources Burea: Chongqing, China, 2011. [Google Scholar]
- Pontius, R.G.; Schneider, L.C. Land-cover change model validation by an ROC method for the Ipswich watershed, Massachusetts, USA. Agric. Ecosyst. Environ. 2001, 85, 239–248. [Google Scholar] [CrossRef]
- Eastman, J.R.; Jiang, H.; Toledano, J. Multi-Criteria and Multi-Objective Decision Making for Land Allocation Using GIS Multicriteria Analysis for Land-Use Management; Springer: Berlin/Heidelberg, Germany, 1998; pp. 227–251. [Google Scholar]
- Shooshtari, S.J.; Gholamalifard, M. Scenario-based land cover change modeling and its implications for landscape pattern analysis in the Neka Watershed, Iran. Remote Sens. Appl. Soc. Environ. 2015, 1, 1–19. [Google Scholar] [CrossRef]
- Sharon, K.; Collinge, R.T.T.F.; Collinge, S.K.; Collinge, S.K.; Forman, R.T.T. Ecology of Fragmented Landscapes; Johns Hopkins University Press: Baltimore, Maryland, 2009. [Google Scholar]
- Borgström, S.; Cousins, S.A.O.; Lindborg, R. Outside the boundary—Land use changes in the surroundings of urban nature reserves. Appl. Geogr. 2012, 32, 350–359. [Google Scholar] [CrossRef]
- Huang, J.; He, J.; Liu, D.; Li, C.; Qian, J. An ex-post evaluation approach to assess the impacts of accomplished urban structure shift on landscape connectivity. Sci. Total Environ. 2018, 622–623, 1143–1152. [Google Scholar] [CrossRef]
- Arroyo-Rodríguez, V.; Fahrig, L.; Tabarelli, M.; Watling, J.I.; Tischendorf, L.; Benchimol, M.; Tscharntke, T. Designing optimal human-modified landscapes for forest biodiversity conservation. Ecol. Lett. 2020, 23, 1404–1420. [Google Scholar] [CrossRef]
- McGarigal, K.; Cushman, S.A.; Ene, E.; FRAGSTATS v4: Spatial pattern analysis program for categorical and continuous maps. Computer Software Program Produced by the Authors at the University of Massachusetts, Amherst. 2012. Available online: http://www.umass.edu/landeco/research/fragstats/fragstats.html (accessed on 12 May 2021).
- Wang, X.R.; Hui, E.C.M.; Choguill, C.; Jia, S.H. The new urbanization policy in China: Which way forward? Habitat Int. 2015, 47, 279–284. [Google Scholar] [CrossRef]
- Wei, X.; Wei, C.; Cao, X.; Li, B. The general land-use planning in China: An uncertainty perspective. Environ. Plan. B Plan. Des. 2016, 43, 361–380. [Google Scholar] [CrossRef]
- Guan, X.; Wei, H.; Lu, S.; Dai, Q.; Su, H. Assessment on the urbanization strategy in China: Achievements, challenges and reflections. Habitat Int. 2018, 71, 97–109. [Google Scholar] [CrossRef]
- Liu, Y.; Fang, F.; Li, Y. Key issues of land use in China and implications for policy making. Land Use Policy 2014, 40, 6–12. [Google Scholar] [CrossRef]
- Qu, Y.; Long, H. The economic and environmental effects of land use transitions under rapid urbanization and the implications for land use management. Habitat Int. 2018, 82, 113–121. [Google Scholar] [CrossRef]
- He, B.J.; Ding, L.; Prasad, D. Wind-sensitive urban planning and design: Precinct ventilation performance and its potential for local warming mitigation in an open midrise gridiron precinct. J. Build. Eng. 2020, 29, 101145. [Google Scholar] [CrossRef]
- Yang, J.; Ren, J.; Sun, D.; Xiao, X.; Xia, J.; Jin, C.; Li, X. Understanding land surface temperature impact factors based on local climate zones. Sustain. Cities Soc. 2021, 69, 102818. [Google Scholar] [CrossRef]
- Li, C.; Gao, X.; He, B.-J.; Wu, J.; Wu, K. Coupling Coordination Relationships between Urban-industrial Land Use Efficiency and Accessibility of Highway Networks: Evidence from Beijing-Tianjin-Hebei Urban Agglomeration, China. Sustainability 2019, 11, 1446. [Google Scholar] [CrossRef]
- Lu, L.; Zhang, Y.; Luo, T. Difficulties and strategies in the process of population urbanization: A case study in Chongqing of China. Open J. Soc. Sci. 2014, 2, 90. [Google Scholar] [CrossRef][Green Version]
- Zhang, Y. Grabbing Land for Equitable Development? Reengineering Land Dispossession through Securitising Land Development Rights in Chongqing. Antipode 2018, 50, 1120–1140. [Google Scholar] [CrossRef]
- Lin, Y.; Li, Y.; Ma, Z. Exploring the Interactive Development between Population Urbanization and Land Urbanization: Evidence from Chongqing, China (1998–2016). Sustainability 2018, 10, 1741. [Google Scholar] [CrossRef]
- Du, W.; Ge, J.; Sun, S. Economic Forecast of the Southern China on BP Neural Network—Taking Chongqing as an Example. In Proceedings of the 6th International Conference on Financial Innovation and Economic Development (ICFIED 2021), Sanya, China, 29–31 January 2021. [Google Scholar]
- Li, L.; Yang, Q.; Xie, X. Coupling Coordinated Evolution and Forecast of Tourism-Urbanization-Ecological Environment: The Case Study of Chongqing, China. Math. Probl. Eng. 2021, 2021, 727163. [Google Scholar]
- Yang, R.; Cao, Y.; Hou, S.; Peng, Q.; Wang, X.; Wang, F.; Ma, K. Cost-effective priorities for the expansion of global terrestrial protected areas: Setting post-2020 global and national targets. Sci. Adv. 2020, 6, eabc3436. [Google Scholar] [CrossRef]
- Watson, J.E.M.; Dudley, N.; Segan, D.B.; Hockings, M. The performance and potential of protected areas. Nature 2014, 515, 67–73. [Google Scholar] [CrossRef]
- Noss, R.F.; Dobson, A.P.; Baldwin, R.; Beier, P.; Davis, C.R.; Dellasala, D.A.; Lopez, R. Bolder Thinking for Conservation; Wiley Online Library: New York, NY, USA, 2012. [Google Scholar]
- Gannon, P.; Dubois, G.; Dudley, N.; Ervin, J.; Ferrier, S.; Gidda, S.; Seyoum-Edjigu, E. Editorial Essay: An update on progress towards Aichi biodiversity target 11. Parks 2019, 25, 7–18. [Google Scholar] [CrossRef]
- Ministry of Environmental Protection. China’s First National Report on the Implementation of the Convention on Biological Diversity. 2001. Available online: https://www.cbd.int/kb/record/nr/4089?Country=cn&FreeText=national%20report (accessed on 12 May 2021).
- Ministry of Ecological Environment. China’s Sixth National Report on the Implementation of the Convention on Biological Diversity. 2018. Available online: https://chm.cbd.int/zh/database/record/C7B6BC32-C06D-B09C-BFF8-7D265F24DBE6 (accessed on 12 May 2021).
- Leverington, F.; Costa, K.L.; Pavese, H.; Lisle, A.; Hockings, M. A global analysis of protected area management effectiveness. Environ. Manag. 2010, 46, 685–698. [Google Scholar] [CrossRef]
- Barnes, M.D.; Glew, L.; Wyborn, C.; Craigie, I.D. Prevent perverse outcomes from global protected area policy. Nat. Ecol. Evol. 2018, 2, 759–762. [Google Scholar] [CrossRef]
- Deguignet, M.; Juffe-Bignoli, D.; Harrison, J.; MacSharry, B.; Burgess, N.; Kingston, N. 2014 United Nations List of Protected Areas; UNEP-WCMC: Cambridge, UK, 2014. [Google Scholar]
- Bruner, A.G.; Gullison, R.E.; Rice, R.E.; Da Fonseca, G. A Effectiveness of parks in protecting tropical biodiversity. Science 2001, 291, 125–128. [Google Scholar] [CrossRef]
- Buchanan, G.M.; Butchart, S.H.M.; Chandler, G.; Gregory, R.D. Assessment of national-level progress towards elements of the Aichi Biodiversity Targets. Ecol. Indic. 2020, 116, 106497. [Google Scholar] [CrossRef]
- Wang, C.; Sun, G.; Dang, L. Identifying ecological red lines: A case study of the coast in Liaoning province. Sustainability 2015, 7, 9461–9477. [Google Scholar] [CrossRef]
- Chu, X.; Deng, X.; Jin, G.; Wang, Z.; Li, Z. Ecological security assessment based on ecological footprint approach in Beijing-Tianjin-Hebei region, China. Phys. Chem. Earth Parts A/B/C 2017, 101, 43–51. [Google Scholar] [CrossRef]
- Guo, X.; Chang, Q.; Liu, X.; Bao, H.; Zhang, Y.; Tu, X.; Zhang, Y. Multi-dimensional eco-land classification and management for implementing the ecological redline policy in China. Land Use Policy 2018, 74, 15–31. [Google Scholar] [CrossRef]
- Dong, J.; Dai, W.; Shao, G.; Xu, J. Ecological Network Construction Based on Minimum Cumulative Resistance for the City of Nanjing, China. ISPRS Int. J. Geo-Inf. 2015, 4, 2045–2060. [Google Scholar] [CrossRef]


| Index | Full Name or Explanation | Calculation Method |
|---|---|---|
| NDVI | Normalized Difference Vegetation Index | (NIR − RED)/(NIR + RED) |
| MNDWI | Modified Normalized Difference Water Index | (GREEN − SWIR)/(GREEN − SWIR) |
| NDBI | Normalized Difference Building Index | (SWIR − NIR)/(SWIR + NIR) |
| Slope | Topographic slope | Calculated based on DEM. |
| NIR + SWIR − 2 × RED | Band calculation value | Calculated as its expression. |
| Index | July 2000 | July 2001 | June 2008 | August 2010 | August 2015 | July 2016 |
|---|---|---|---|---|---|---|
| NDVI | 0.47 | 0.47 | 0.47 | 0.47 | 0.55 | 0.55 |
| MNDWI | 0 | −0.05 | −0.03 | −0.03 | 0 | −0.05 |
| NDBI | −0.12 | −0.12 | −0.14 | −0.14 | −0.12 | −0.18 |
| Slope | 30 | 30 | 30 | 30 | 30 | 30 |
| NIR + SWIR − 2 × RED | 85 and 130 | 72 and 113 | 73 and 113 | 87 and 137 | 97 and 128 | 85 and 128 |
| Category | Urban | Cropland | Forest | Shrub | Grass | Water | Total |
|---|---|---|---|---|---|---|---|
| Land use in 2000 | 289 | 4133 | 814 | 73 | 27 | 139 | 5475 |
| Gain | 315 | 109 | 72 | 80 | 19 | 14 | 610 |
| Loss | 29 | 373 | 130 | 44 | 22 | 11 | 610 |
| Persistence | 260 | 3760 | 683 | 30 | 4 | 128 | 4865 |
| Net change (gain – loss) | 286 | –264 | –58 | 37 | –3 | 3 | 0 |
| Total turnover (gain + loss) | 344 | 482 | 202 | 124 | 41 | 25 | 1219 |
| Percentage of gain | 109.1 % | 2.6 % | 8.8 % | 109.7 % | 71.7 % | 9.9 % | 11.1 % |
| Percentage of loss | 10.1 % | 9 % | 16 % | 59.4 % | 83.3 % | 8.1 % | 11.1 % |
| Percentage of persistence | 89.9 % | 91 % | 84 % | 40.6 % | 16.7 % | 91.9 % | 88.9 % |
| Percentage of net change | 99 % | –6.4 % | –7.2 % | 50.3 % | –11.6 % | 1.9 % | 0 |
| Percentage of total turnover | 119.3 % | 11.7 % | 24.9 % | 169.2 % | 155.1 % | 18 % | 22.3 % |
| Land use in 2010 | 575 | 3869 | 755 | 110 | 24 | 142 | 5475 |
| Year | 2010 | |||||||
|---|---|---|---|---|---|---|---|---|
| Category | Urban | Cropland | Forest | Shrub | Grass | Water | ||
| Category | Total | 575 | 3869 | 755 | 110 | 24 | 142 | |
| 2000 | Urban | 289 | 260 | 15 | 8 | 1 | 1 | 4 |
| Cropland | 4133 | 264 | 3760 | 49 | 43 | 12 | 5 | |
| Forest | 814 | 40 | 50 | 683 | 34 | 4 | 2 | |
| Shrub | 73 | 5 | 28 | 8 | 30 | 1 | 1 | |
| Grass | 27 | 2 | 13 | 4 | 1 | 4 | 1 | |
| Water | 139 | 4 | 2 | 3 | 1 | 2 | 128 | |
| Before | After | Transition Area (km2) | Model Name |
|---|---|---|---|
| Cropland | Urban | 264 | Urbanization |
| Forest | Urban | 40 | Urbanization |
| Forest | Cropland | 50 | Reclamation |
| Shrub | Cropland | 28 | Reclamation |
| Forest | Shrub | 34 | Reclamation |
| Cropland | Forest | 49 | Conservation 1 |
| Cropland | Shrub | 43 | Conservation 2 |
| Variable | Type | Normalization | Cramer’s V | |
|---|---|---|---|---|
| 1 | Past changes | Qualitative | Evidence likelihood | 0.5225 |
| 2 | Density of Water | Qualitative | - | 0.4189 |
| 3 | Distance to Water | Quantitative | Natural log | 0.4065 |
| 4 | Distance to Forest | Quantitative | Natural log | 0.3845 |
| 5 | Elevation | Quantitative | - | 0.3776 |
| 6 | Density of Cropland | Qualitative | - | 0.3688 |
| 7 | Distance to Cropland | Quantitative | Natural log | 0.3669 |
| 8 | Density of Forest | Qualitative | - | 0.3307 |
| 9 | Density of Urban | Qualitative | - | 0.2879 |
| 10 | Distance to Urban | Quantitative | Natural log | 0.2734 |
| 11 | Slope | Quantitative | - | 0.2558 |
| 12 | Density of Shrub | Qualitative | - | 0.1624 |
| 13 | Distance to Shrub | Quantitative | Natural log | 0.1436 |
| 14 | Distance to secondary roads (national and provincial roads) | Quantitative | - | 0.1341 |
| 15 | Distance to primary roads (railway and expressway) | Quantitative | - | 0.1312 |
| 16 | Density of Grass | Qualitative | - | 0.0860 |
| 17 | Distance to Grass | Quantitative | Natural log | 0.0783 |
| 18 | Distance to tertiary roads (County roads) | Quantitative | - | 0.0580 |
| Variable | Urbanization | Reclamation | Conservation 1 | Conservation 2 | |||||||||
|---|---|---|---|---|---|---|---|---|---|---|---|---|---|
| Accuracy (%) | Influence Order | Selected | Accuracy (%) | Influence Order | Selected | Accuracy (%) | Influence Order | Selected | Accuracy (%) | Influence Order | Selected | ||
| With all variables | 81.56 | N/A | 73.27 | N/A | 77.7 | N/A | 72.95 | N/A | |||||
| 1 | Past changes | 55.65 | 2 | Yes | 51.68 | 1 | Yes | 77.7 | 12 | 72.95 | 13 | ||
| 2 | Density of Water | 81.13 | 10 | Yes | 73.05 | 10 | 77.67 | 10 | 72.88 | 8 | |||
| 3 | Distance to Water | 81.38 | 12 | 73.29 | 14 | 77.75 | 15 | 72.87 | 7 | ||||
| 4 | Distance to Forest | 81.57 | 15 | 73.27 | 13 | 77.69 | 11 | 72.94 | 12 | ||||
| 5 | Elevation | 80.36 | 8 | Yes | 72.98 | 9 | 77.6 | 6 | 71.86 | 3 | Yes | ||
| 6 | Density of Cropland | 78.76 | 4 | Yes | 70.48 | 5 | Yes | 77.29 | 3 | Yes | 73.02 | 15 | |
| 7 | Distance to Cropland | 81.56 | 14 | 73.26 | 12 | 77.7 | 13 | 72.95 | 14 | ||||
| 8 | Density of Forest | 49.16 | 1 | Yes | 52.92 | 2 | Yes | 46.5 | 1 | Yes | 60.95 | 1 | Yes |
| 9 | Density of Urban | 77.73 | 3 | Yes | 73.11 | 11 | 77.66 | 9 | 72.91 | 10 | |||
| 10 | Distance to Urban | 81.11 | 9 | Yes | 72.31 | 6 | Yes | 77.52 | 4 | 72.25 | 5 | Yes | |
| 11 | Slope | 80.02 | 6 | Yes | 59.41 | 3 | Yes | 77.54 | 5 | Yes | 72.21 | 4 | |
| 12 | Density of Shrub | 81.27 | 11 | 65.03 | 4 | Yes | 77.63 | 8 | Yes | 72.92 | 11 | Yes | |
| 13 | Distance to Shrub | 81.43 | 13 | 72.9 | 7 | Yes | 77.61 | 7 | 72.59 | 6 | |||
| 14 | Distance to secondary roads | 80.15 | 7 | Yes | 73.41 | 15 | 77.74 | 14 | 72.89 | 9 | |||
| 15 | Distance to primary roads | 79.43 | 5 | Yes | 72.9 | 8 | Yes | 77.13 | 2 | Yes | 71.39 | 2 | Yes |
| Scenario | Assumption | Area Treatment | Management Intensity |
|---|---|---|---|
| No Eco-redline | Not implemented | / | / |
| Normal Eco-redline | Normal implementation | No | Normal |
| Less ERAs | Eco-redline areas expand | Expand outward 500 m | Normal |
| More ERAs | Eco-redline areas shrink | Shrink inward 500 m | Normal |
| Loose management | Management intensity is lower | No | Loose |
| Strict management | Management intensity is higher | No | Strict |
| Sub Model | Transition | Management Intensity | ||
|---|---|---|---|---|
| Normal | Loose | Strict | ||
| Urbanization | Crop to Urban | 0 | 0.2 | 0 |
| Forest to Urban | 0 | 0.2 | 0 | |
| Reclamation | Forest to Cropland | 0.5 | 0.8 | 0 |
| Shrub to Cropland | 0.5 | 0.8 | 0 | |
| Forest to Shrub | 0.5 | 0.8 | 0 | |
| Conservation 1 | Cropland to Forest | 1.5 | 1.2 | 2 |
| Conservation 2 | Cropland to Shrub | 1.5 | 1.2 | 2 |
| No. | Feature | Index | Description |
|---|---|---|---|
| 1 | Shape complexity | Perimeter-Area fractal dimension (PAFRAC) | Calculated by regressing the logarithm of patch area against the logarithm of patch perimeter. Ranging from 1 to 2. |
| 2 | Contrast | Total edge contrast index (TECI) | It equals the sum of lengths of edges multiplied by contrast weight then divided by the sum of lengths of edges. Ranging from 0 to 100. |
| 3 | Aggregation | Aggregation index (AI) | The number of like adjacencies divided by the maximum possible number of like adjacencies. Ranging from 0 to 100. |
| Category | Urban | Cropland | Forest and Shrub | Grass | Water |
|---|---|---|---|---|---|
| Urban | 0 | ||||
| Cropland | 0.7 | 0 | |||
| Forest and Shrub | 0.9 | 0.6 | 0 | ||
| Grass | 0.9 | 0.5 | 0.3 | 0 | |
| Water | 0.9 | 0.7 | 0.7 | 0.7 | 0 |
| Scenario | Dimension of Area | Dimension of Management Intensity | ||||||
|---|---|---|---|---|---|---|---|---|
| No Eco-Redline | Less ERAs | Normal Eco-Redline | More ERAs | No Eco-Redline | Loose Management | Normal Eco-Redline | Strict Management | |
| Urban | Urban | |||||||
| Core area | 51.3% | 51.8% | 51.9% | 52.2% | 51.3% | 51.9% | 51.9% | 52.0% |
| Suburban area | 16.8% | 16.8% | 16.8% | 16.7% | 16.8% | 16.7% | 16.8% | 16.8% |
| Forest and Shrub | Forest and Shrub | |||||||
| Core area | 13.1% | 11.6% | 11.4% | 11.7% | 13.1% | 12.3% | 11.4% | 11.0% |
| Suburban area | 16.9% | 18.5% | 19.2% | 19.3% | 16.9% | 18.2% | 19.2% | 19.5% |
Publisher’s Note: MDPI stays neutral with regard to jurisdictional claims in published maps and institutional affiliations. |
© 2021 by the authors. Licensee MDPI, Basel, Switzerland. This article is an open access article distributed under the terms and conditions of the Creative Commons Attribution (CC BY) license (https://creativecommons.org/licenses/by/4.0/).
Share and Cite
Zhu, B.; Hashimoto, S. Is Expansion or Regulation more Critical for Existing Protected Areas? A Case Study on China’s Eco-Redline Policy in Chongqing Capital. Land 2021, 10, 1084. https://doi.org/10.3390/land10101084
Zhu B, Hashimoto S. Is Expansion or Regulation more Critical for Existing Protected Areas? A Case Study on China’s Eco-Redline Policy in Chongqing Capital. Land. 2021; 10(10):1084. https://doi.org/10.3390/land10101084
Chicago/Turabian StyleZhu, Benhui, and Shizuka Hashimoto. 2021. "Is Expansion or Regulation more Critical for Existing Protected Areas? A Case Study on China’s Eco-Redline Policy in Chongqing Capital" Land 10, no. 10: 1084. https://doi.org/10.3390/land10101084
APA StyleZhu, B., & Hashimoto, S. (2021). Is Expansion or Regulation more Critical for Existing Protected Areas? A Case Study on China’s Eco-Redline Policy in Chongqing Capital. Land, 10(10), 1084. https://doi.org/10.3390/land10101084