1. Introduction
‘Drought means the naturally occurring phenomenon that exists when precipitation has been significantly below normal recorded levels, causing serious hydrological imbalances that adversely affect land resource production systems’ [
1]. Under the influence of global warming and human activities, the frequent occurrence of drought has become one of the most severe environmental problems globally, which has attracted great attention of the international community and motivated many studies by scholars from various countries [
2,
3,
4,
5,
6,
7,
8,
9,
10,
11,
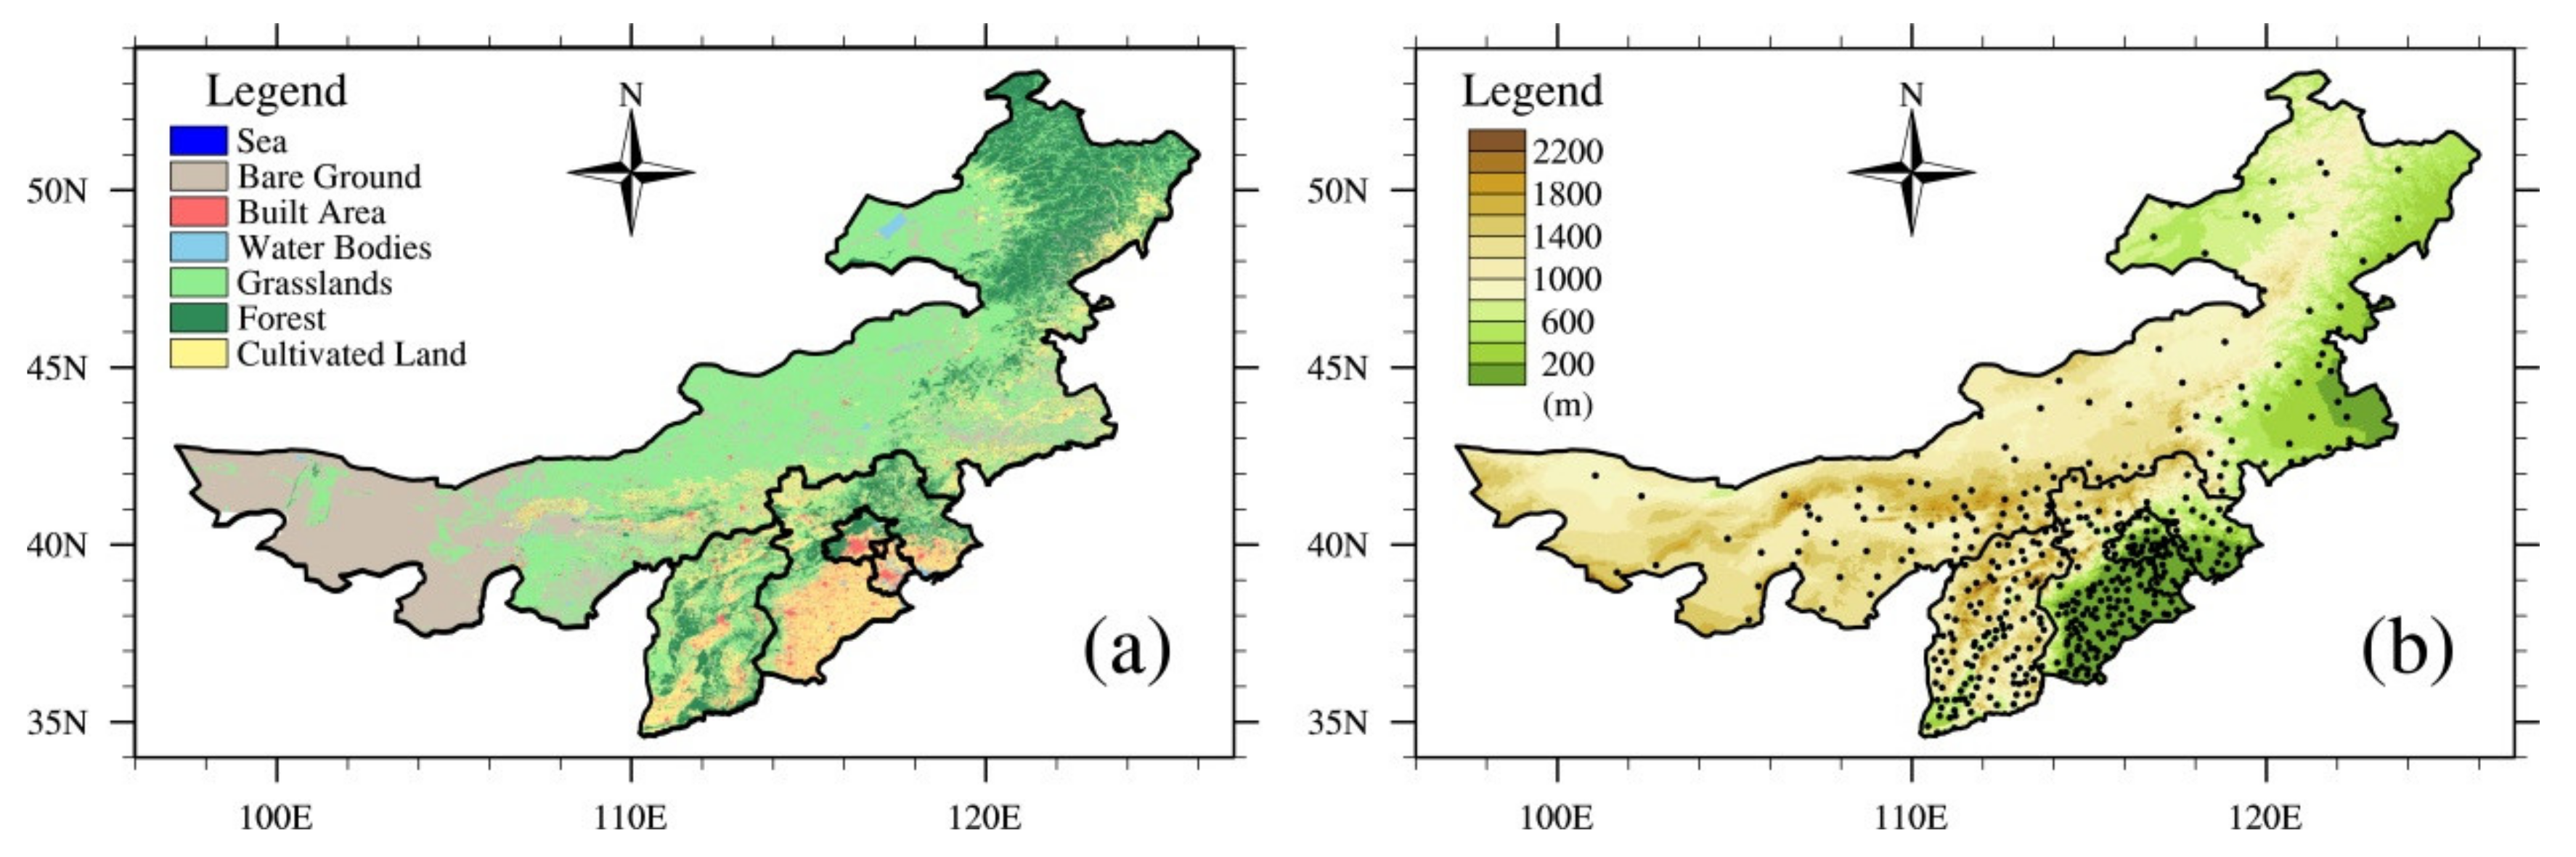
12]. The North China Plain is an important grain, cotton and oil production base in China. It mainly focuses on dry farming (
Figure 1a). It is one of the areas where drought disasters occur most frequently. Accurate monitoring and evaluation of drought intensity in North China can provide decision support for preventing and mitigating drought disasters.
In recent years, attention has been paid to the impact of warming on the occurrence and development of drought and drought trends. It has been revealed that the intensity of drought caused by warming has increased on the global and regional scales. A large number of facts show that with the background of warming, a single analysis of precipitation change is not enough to explain the scope and intensity of drought. Especially with the climatic background of decreasing precipitation and increasing temperature, warming has become one of the important factors aggravating the drought process. Therefore, the objective characterization of drought needs to integrate the joint influence of meteorological factors such as precipitation and temperature changes. As an important indicator and means to quantitatively assess drought, the drought index plays an important role in drought monitoring and forecasting. Scholars worldwide have developed a series of drought indexes by using meteorological and hydrological factors and have carried out a considerable amount of research and experimental work. Meteorological drought indexes widely used and studied in China mainly include the percentage of precipitation anomaly (Pa) [
13,
14], Palmer Drought Severity Index (PDSI) [
15,
16], Standardized Precipitation Index (SPI) [
17,
18], Precipitation Z index [
19], Relative Moisture Index (MI) [
20,
21], Composite Index of meteorological drought (CI) and Standardized Precipitation Evapotranspiration Index (SPEI) [
22]. These studies have laid a foundation for theoretical and practical reference.
However, the above methods have their limitations. For example, the PDSI is mainly applicable for arid and semi-arid areas, and there are subjective factors in the definition of drought level, which may lag several months when judging extreme drought [
23]. The Z-index and SPI-index are drought indexes completely dependent on precipitation, which are calculated by probability density function and then standardized. However, the index only reflects the impact of precipitation on drought at a certain scale (such as short-scale 1 month, meso-scale 3 months and long-scale 6 months) and does not comprehensively consider the impact of different scales of early drought on later droughts. Tsakiris and Vangelis (2005) [
24] put forward the drought monitoring index (RDI). Although the RDI is a stable drought intensity evaluation index and not a drought evaluation method relying solely on potential evapotranspiration (PET), it is necessary to avoid using inappropriate PET estimation method in individual areas [
25]. The CI reflects well the frequency distribution of drought in different regions of China and the seasonal characteristics of different grades of drought. However, the CI is too sensitive to the precipitation process in real-time daily drought monitoring. The degree of drought often increases discontinuously, and severe droughts with long-duration tend to be underestimated [
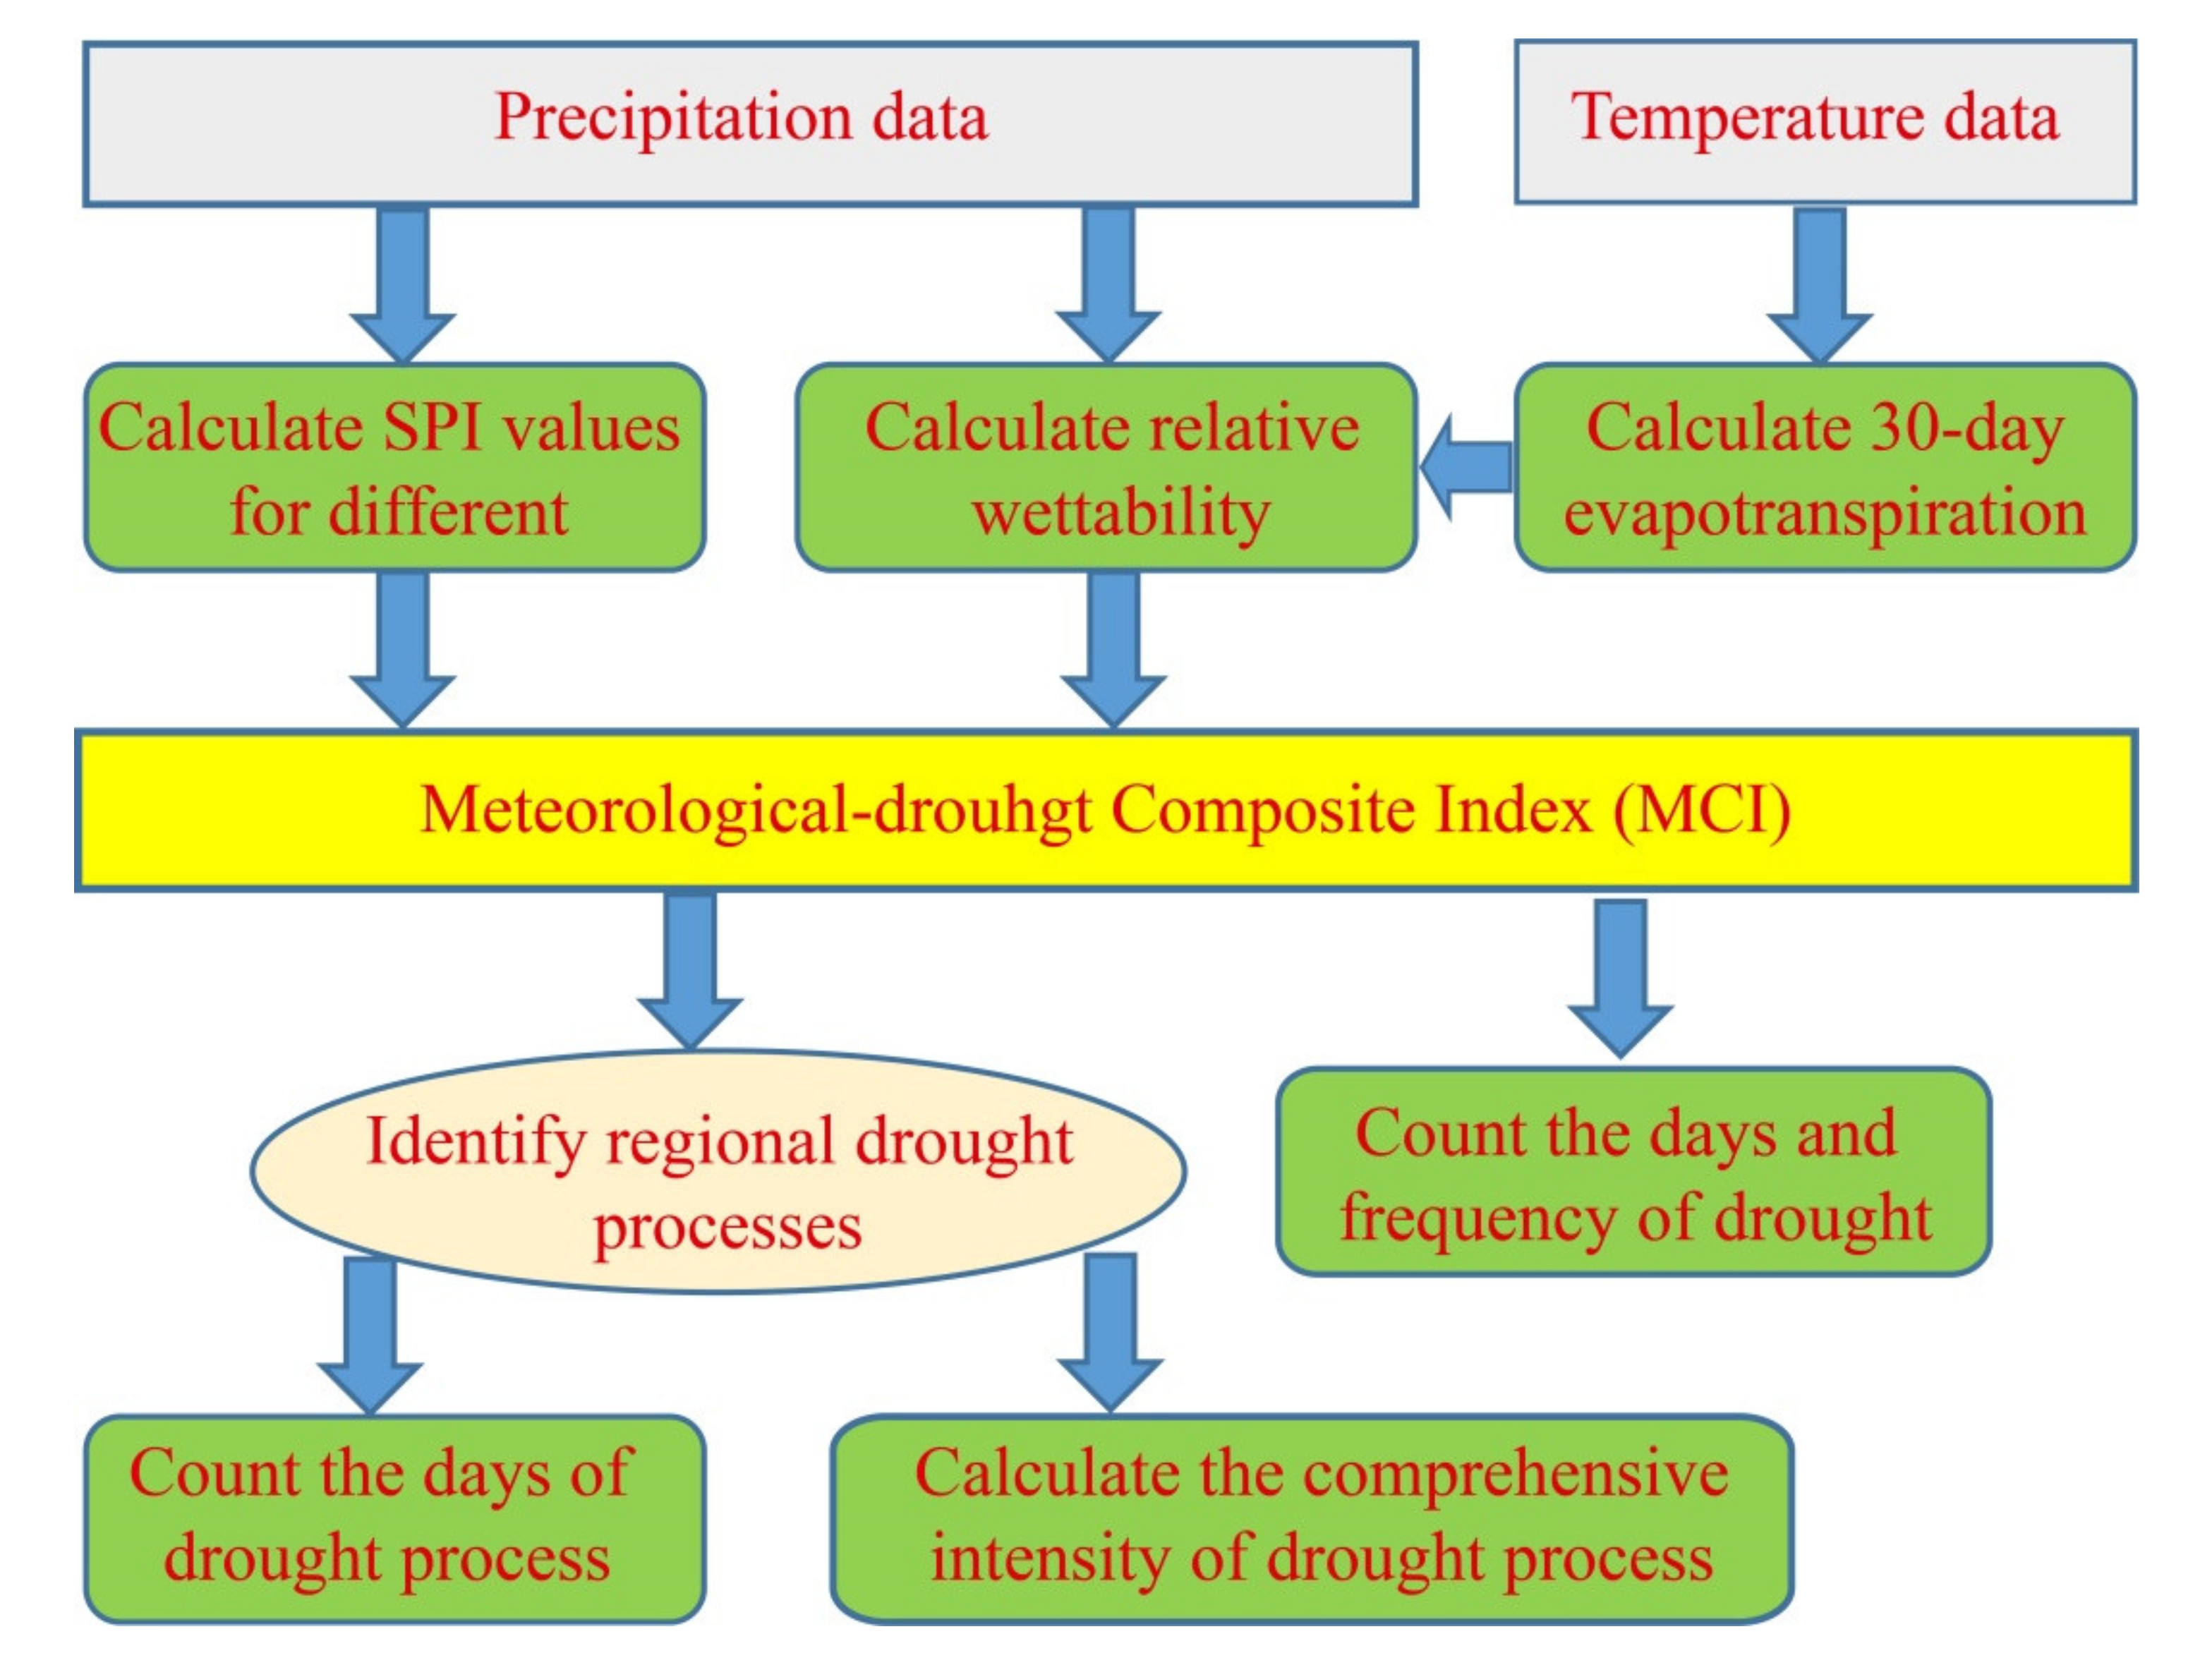
26]. In view of the problems of the CI, the National Climate Center of China Meteorological Administration has developed a new meteorological drought composite index (MCI). Compared with the CI, the MCI comprehensively considers factors. For example, a longer time scale and precipitation weights in different periods. The MCI performs better in drought monitoring than the CI [
27]. Liao Yaoming et al., (2017) [
28] studied the temporal and spatial distribution and disaster development characteristics of drought in China based on the MCI, which improved the operational ability of drought disaster identification. Drought events not only have a certain intensity but also characteristics of duration and scope of influence. Comprehensively identifying or characterizing regional drought events from intensity, time and scope based on the drought index above is of great significance to the monitoring and evaluation of the regional drought process [
29]. Ren et al., (2012) [
30] developed an objective identification technique for regional extreme events (OITREE), which can better identify regional meteorological drought events [
10]. Many studies based on this method have promoted the development of technology of regional meteorological drought event identification and assessment in China [
12,
31,
32]. However, when it is applied to small areas, such as North China and Hebei Province, it is difficult to objectively determine the parameters such as the distance between adjacent monitoring stations, the drought coincidence rate and the component weight of comprehensive intensity.
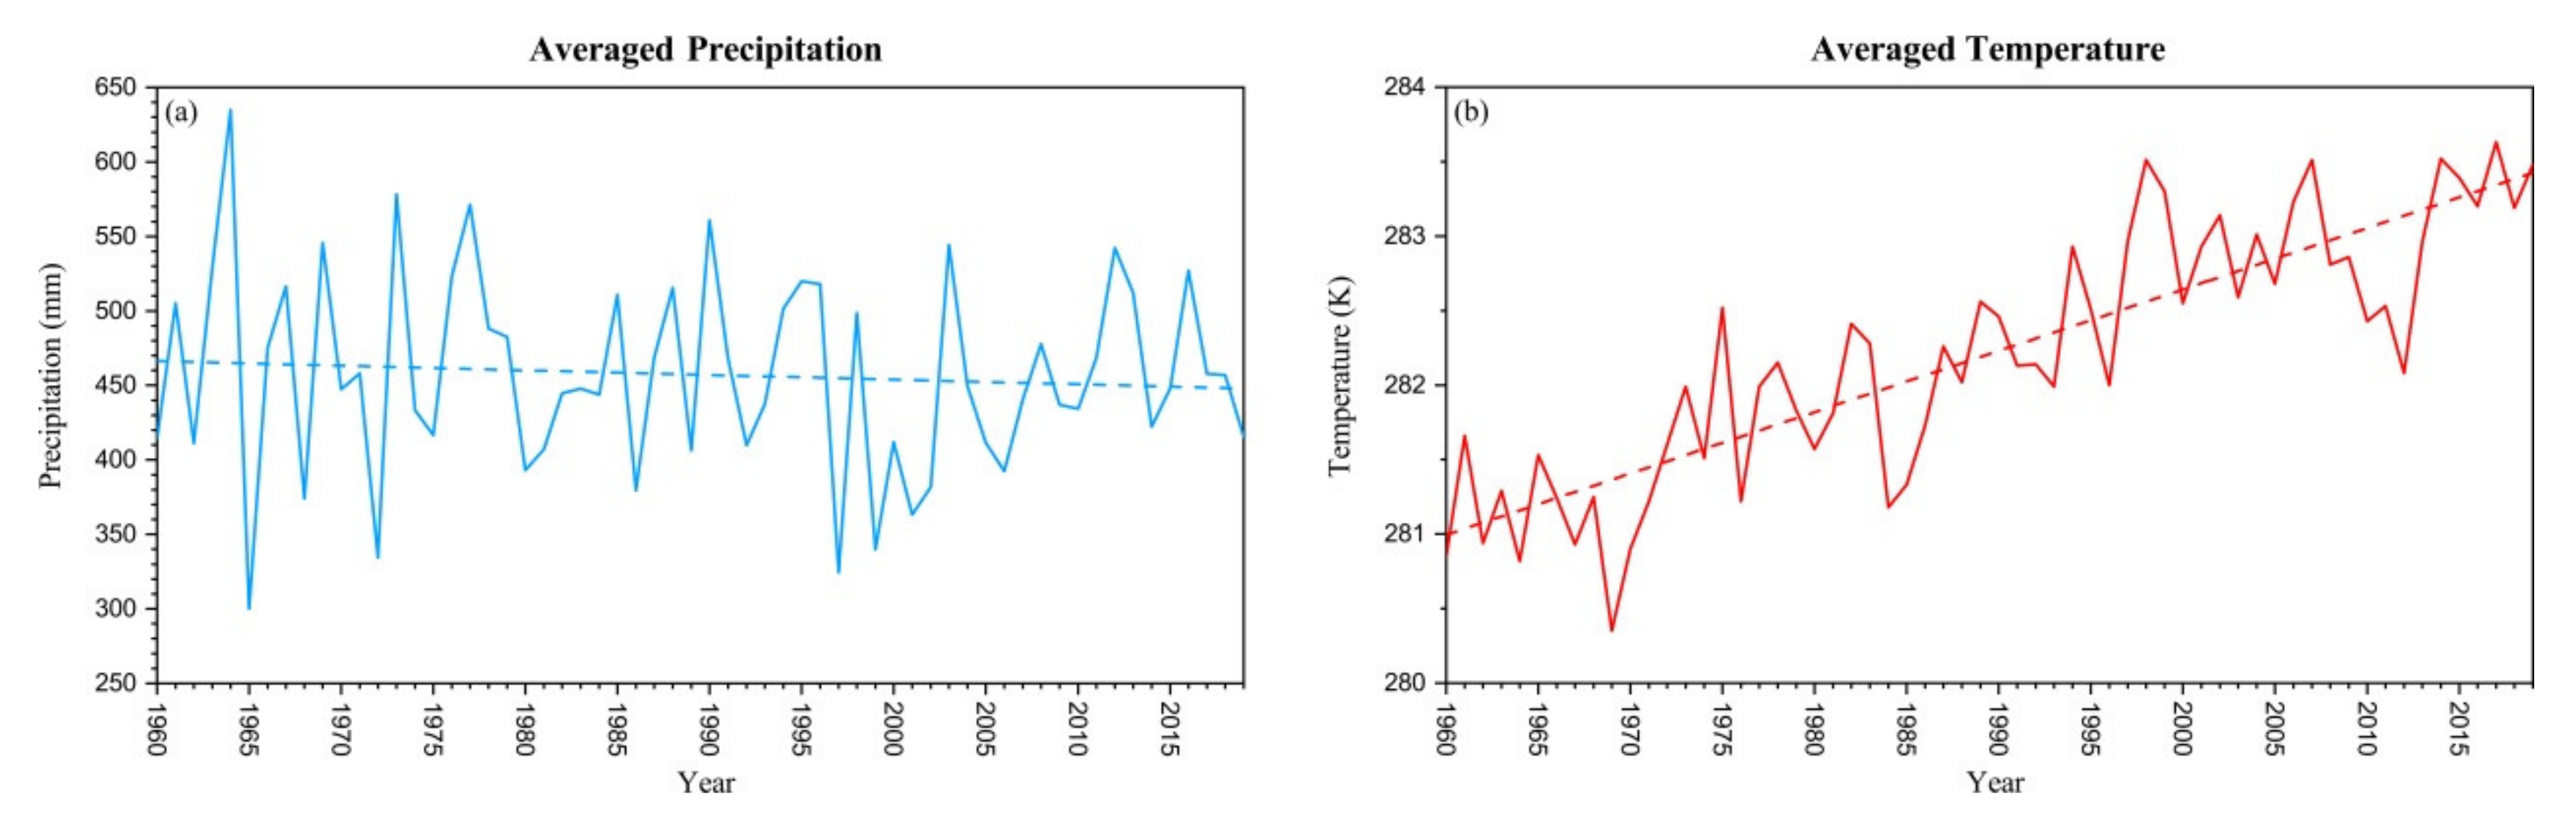
The North China Plain is located in the temperate monsoon climate area, which is significantly affected by the monsoon. With the background of global climate change, from 1960 to 2019, the annual precipitation in North China generally showed a decreasing trend (
Figure 2a), the average temperature showed an obvious upward trend (
Figure 2b) and drought disasters occurred frequently. In recent years, studies on drought in North China have attracted much attention [
33,
34]. Since the late 1970s, other regions have been suffering from continuous drought [
8,
35], and the frequency of droughts classified as severe or above has reached 21.7% [
26,
36]. The frequent occurrence of cut-off events of some major rivers not only aggravates the contradiction between supply and demand of water resources in the basin but also has a serious impact on the ecology and environment [
37,
38]. Although the drought events in North China have received some attention, research from the perspective of the comprehensive intensity of the regional drought process is rarely involved. Objectively identifying the process of regional drought and assessing its intensity is the basis for accurately monitoring and assessing the impact of drought [
12], which will also further promote the prediction and research of regional drought events with the background of climate change. Based on the theory of the extreme intensity with both the duration and the region (EIDR) proposed by Lu et al., (2017) [
39], the National Climate Center of China Meteorological Administration improved the method to calculate the comprehensive intensity index of the objective identification technology of regional extreme events (OITREE). Fixed and moving regional drought process identification technologies have been constructed [
40]. Based on the MCI operationally used in China’s meteorological drought monitoring, the identification technology of the fixed regional drought process and the comprehensive intensity method of the regional drought process based on EIDR theory are used to identify the regional drought process in North China. The drought process was analyzed from the perspectives of the duration and intensity of mild, moderate, severe and extreme droughts. New patterns of temporal and spatial variation in drought events in North China with the background of global warming were obtained, in order to provide more scientific references for government departments to prevent drought.
4. Discussion
The North China Plain is one of the important grain- and cotton-producing areas in China. However, due to the shortage of water resources and evapotranspiration caused by rising temperature, drought frequently occurs, which seriously restricts the social and economic development in this area [
43]. A deep understanding of these problems and a clear understanding of the distribution and changing trend of drought in North China will facilitate rational use of water resources in this area. At the same time, it is of great practical significance to scientifically prevent and control drought.
At present, the National Climate Center of China Meteorological Administration mainly provides services for the government, such as precipitation and temperature measurements. The method of regional drought process identification and comprehensive drought intensity calculation studied in this work can be combined with future precipitation and temperature prediction to carry out regional drought intensity prediction. In the future, the method adopted in this study can be used to provide regional drought intensity prediction for government decision-making departments, so that government departments can be more targeted in the management of drought disaster prevention and mitigation.
In this study, based on the MCI, the EIDR theory was applied to calculate the drought intensity in the process of drought by sliding continuously, and the strongest (maximum) drought intensity was selected by comparison, so as to characterize the comprehensive intensity of regional drought process. This method identifies the regional drought process in North China from multiple perspectives such as single station intensity, duration and regional influence. Compared with the precipitation method and CI method alone, this method considers more factors, has a more complete time scale and is simpler than OITREE method.
According to the research results of Yao. N. et al., (2020) [
44], the recent meteorological drought (SPI) in the south and north of China has a good correlation with agricultural drought (SSI) and hydrological drought (SRI). Compared with this, the meteorological drought comprehensive index (MCI) used in this study comprehensively considered this relationship, which is reflected in the coefficients a, b, c and d, including the distinction between the south and the north.
Affected by global warming, in recent decades, there has been a trend of rising temperature, increasing precipitation, generally decreasing ground wind speed and increasing relative moisture in Northern China, resulting in a decrease in potential evapotranspiration. According to the research results of Zhang Cunjie and others [
45], the dryness index in most parts of China has been in a decreasing trend in the last 60 years, and there is a wetting trend in Northern China. This is consistent with the decreasing trend of the major drought process in Northern China.
It is worth noting that although drought is mainly caused by meteorological factors, it is also related to many factors such as season, soil type, underlying surface and manmade measures. Therefore, not every meteorological drought will eventually lead to disaster, and there is no strict one-to-one correspondence between the monitoring results of meteorological drought index and drought loss. The long-term change trend of meteorological drought in North China obtained in this study is basically similar to the results obtained by predecessors based on the change analysis of precipitation and other drought indexes [
7,
8,
27,
46,
47,
48], indicating that the above conclusions have high credibility and this method can be used for meteorological drought monitoring and drought change research and can also provide a more scientific theoretical basis for relevant departments to prevent and reduce drought.
Due to the different time scales and climatic factors used, there is great uncertainty in the evaluation results of different drought indexes for the temporal and spatial distribution characteristics of drought. There are great differences between Northern and Southern China. The north is dominated by temperate monsoon climate, and the south is dominated by subtropical monsoon climate; thus, the uncertainty of the evaluation results is more obvious when applied in different areas.
The evapotranspiration in the MCI used in this study was calculated by using the Thornthwaite method without considering the influence of factors such as sunshine and wind speed, which makes the evapotranspiration more affected by temperature. With the background of climate warming, the genetic mechanism of meteorological drought in North China needs to be further studied in the later stage.
The weight coefficient when calculating the intensity of the regional drought process was taken as 0.5 in this study. The most appropriate value still needs further examination and in-depth study.
At present, the method used in this study is directly applicable to the specific situation of China. How to make this method applicable to other parts of the world in the future is a very interesting topic.
5. Conclusions
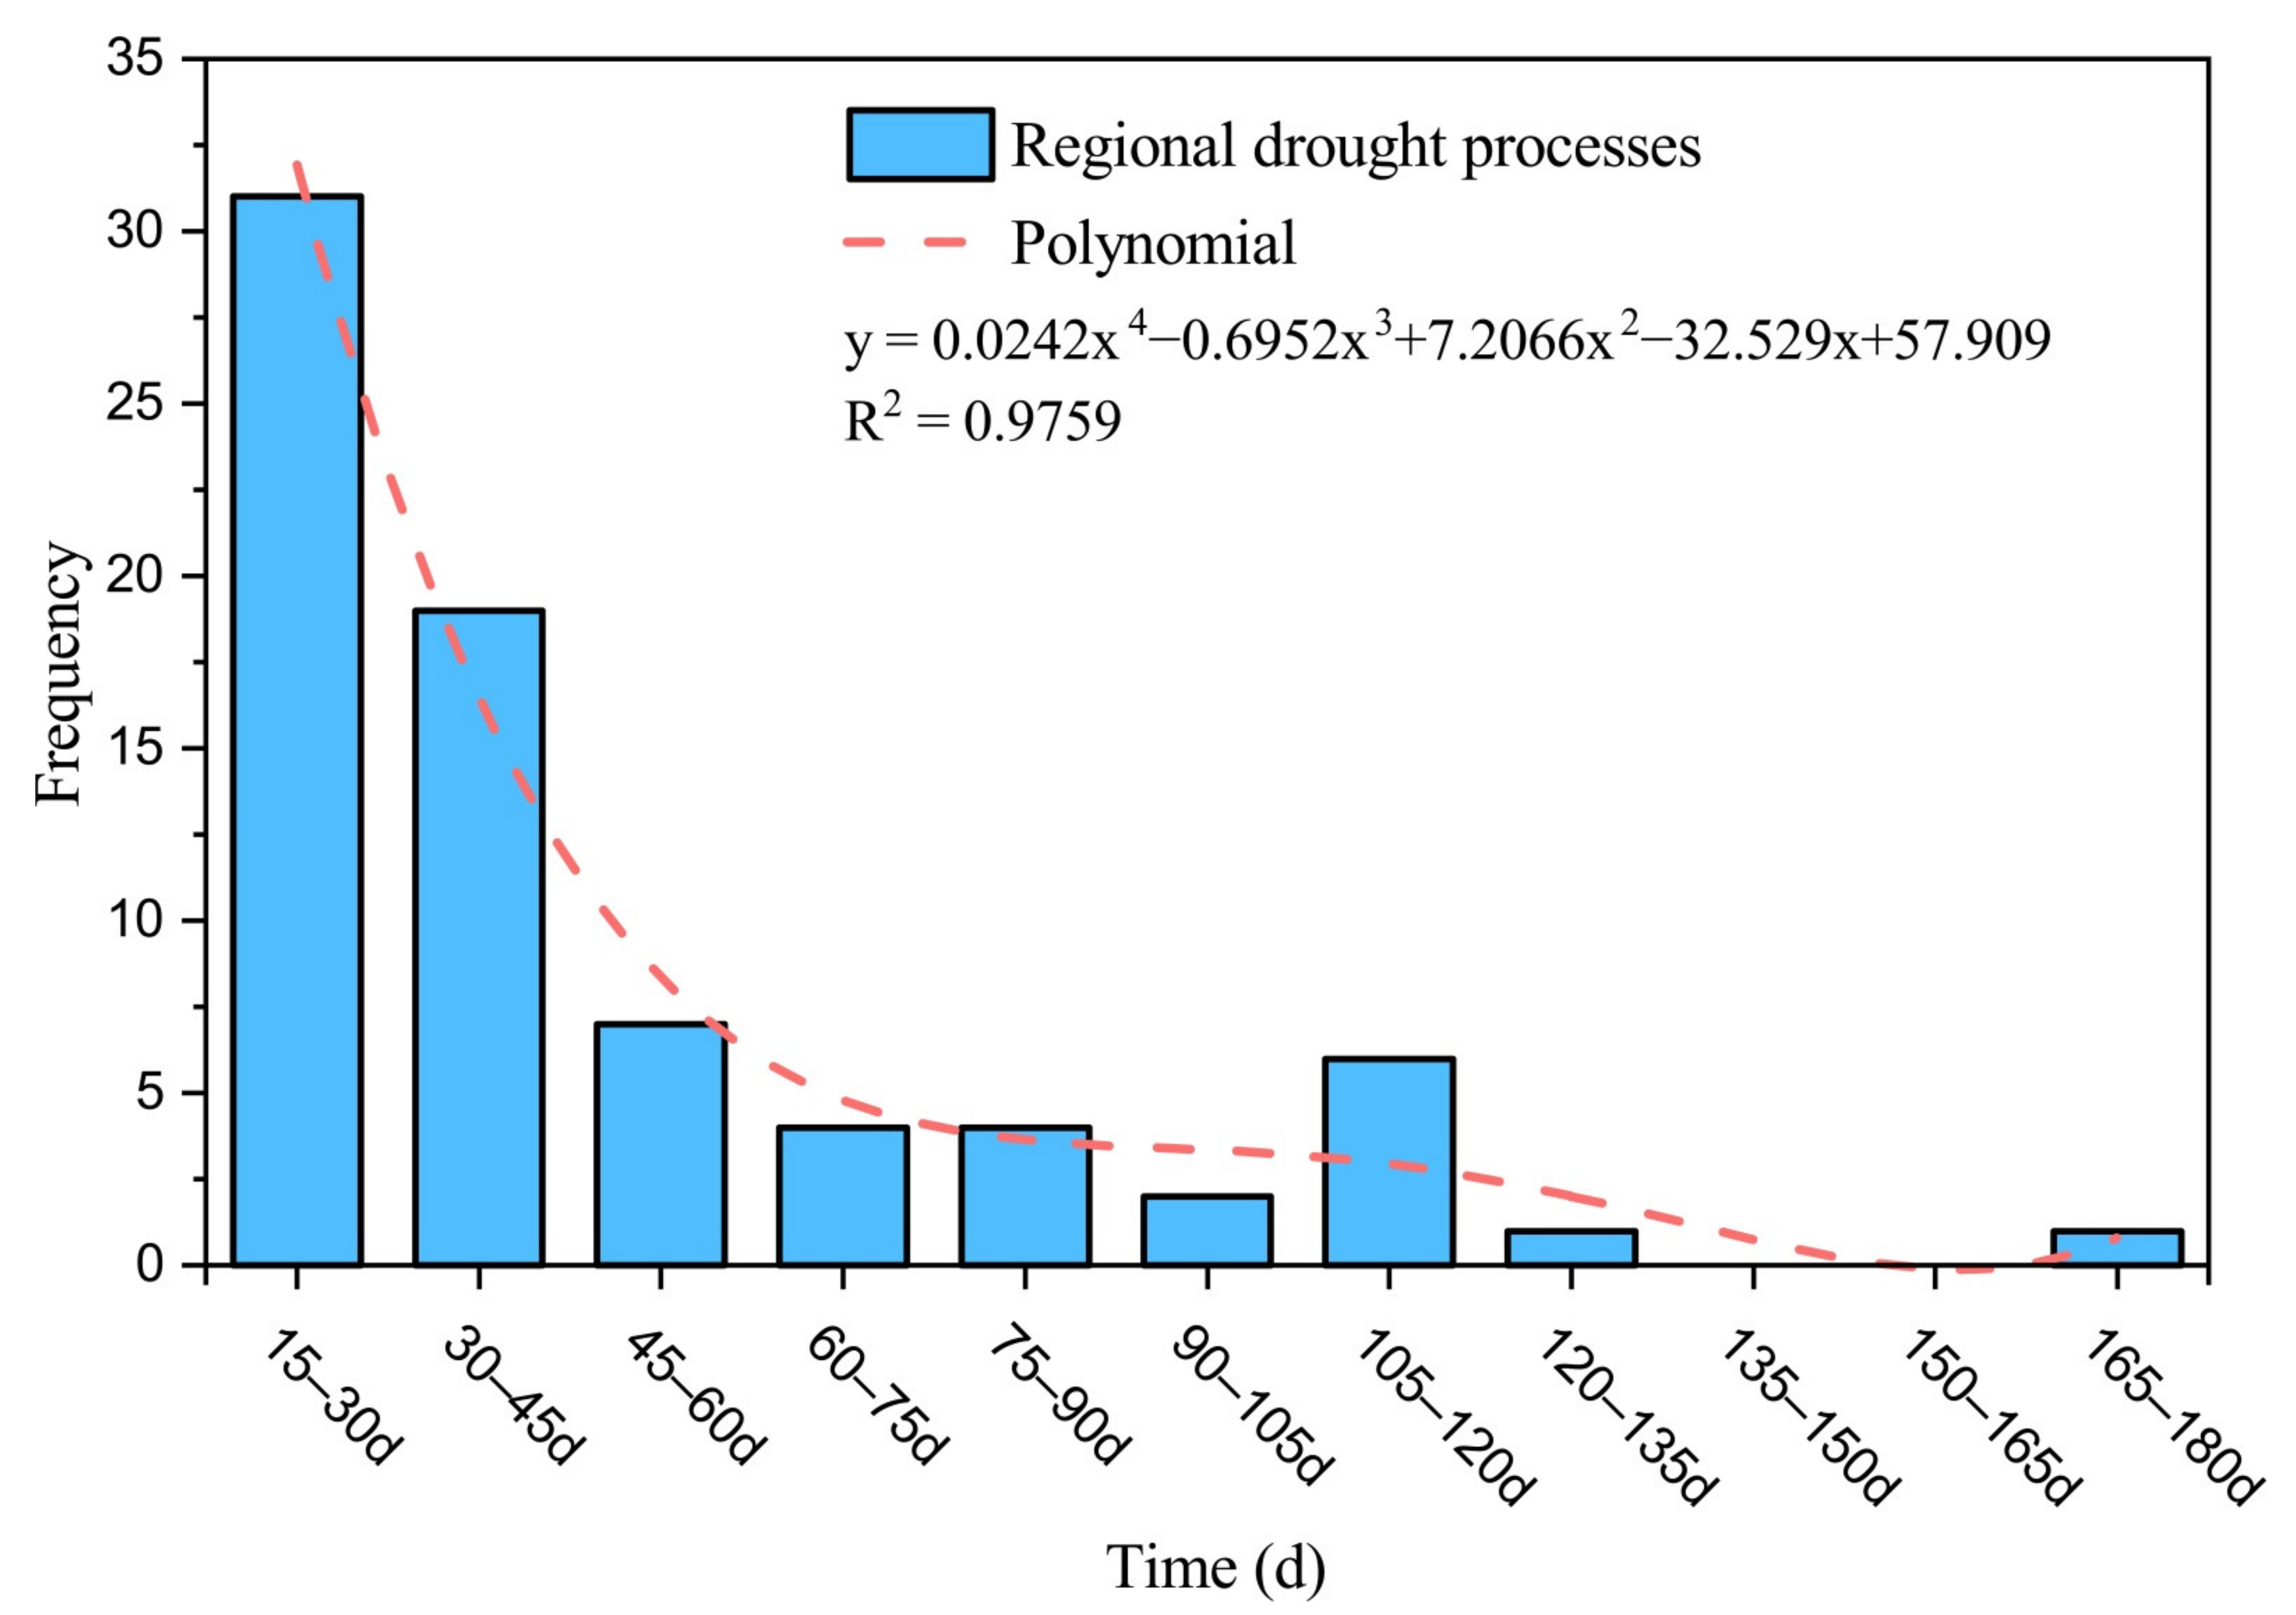
According to the regional drought process identification method, it was identified that 75 regional drought processes occurred in North China from 1960 to 2019. The regional drought processes lasting less than 1 month account for 41.3% of the total drought processes, 34.7% for 1–2 months, 10.7% for 2–3 months, 10.7% for 3–4 months, 1.3% for 4–5 months and 1.3% for more than 5 months. The regional drought process with the longest duration was 167 days. With the increase in the duration of the drought process, the number of drought processes shows an obvious decreasing trend, and the determination coefficient (R2) is 0.98.
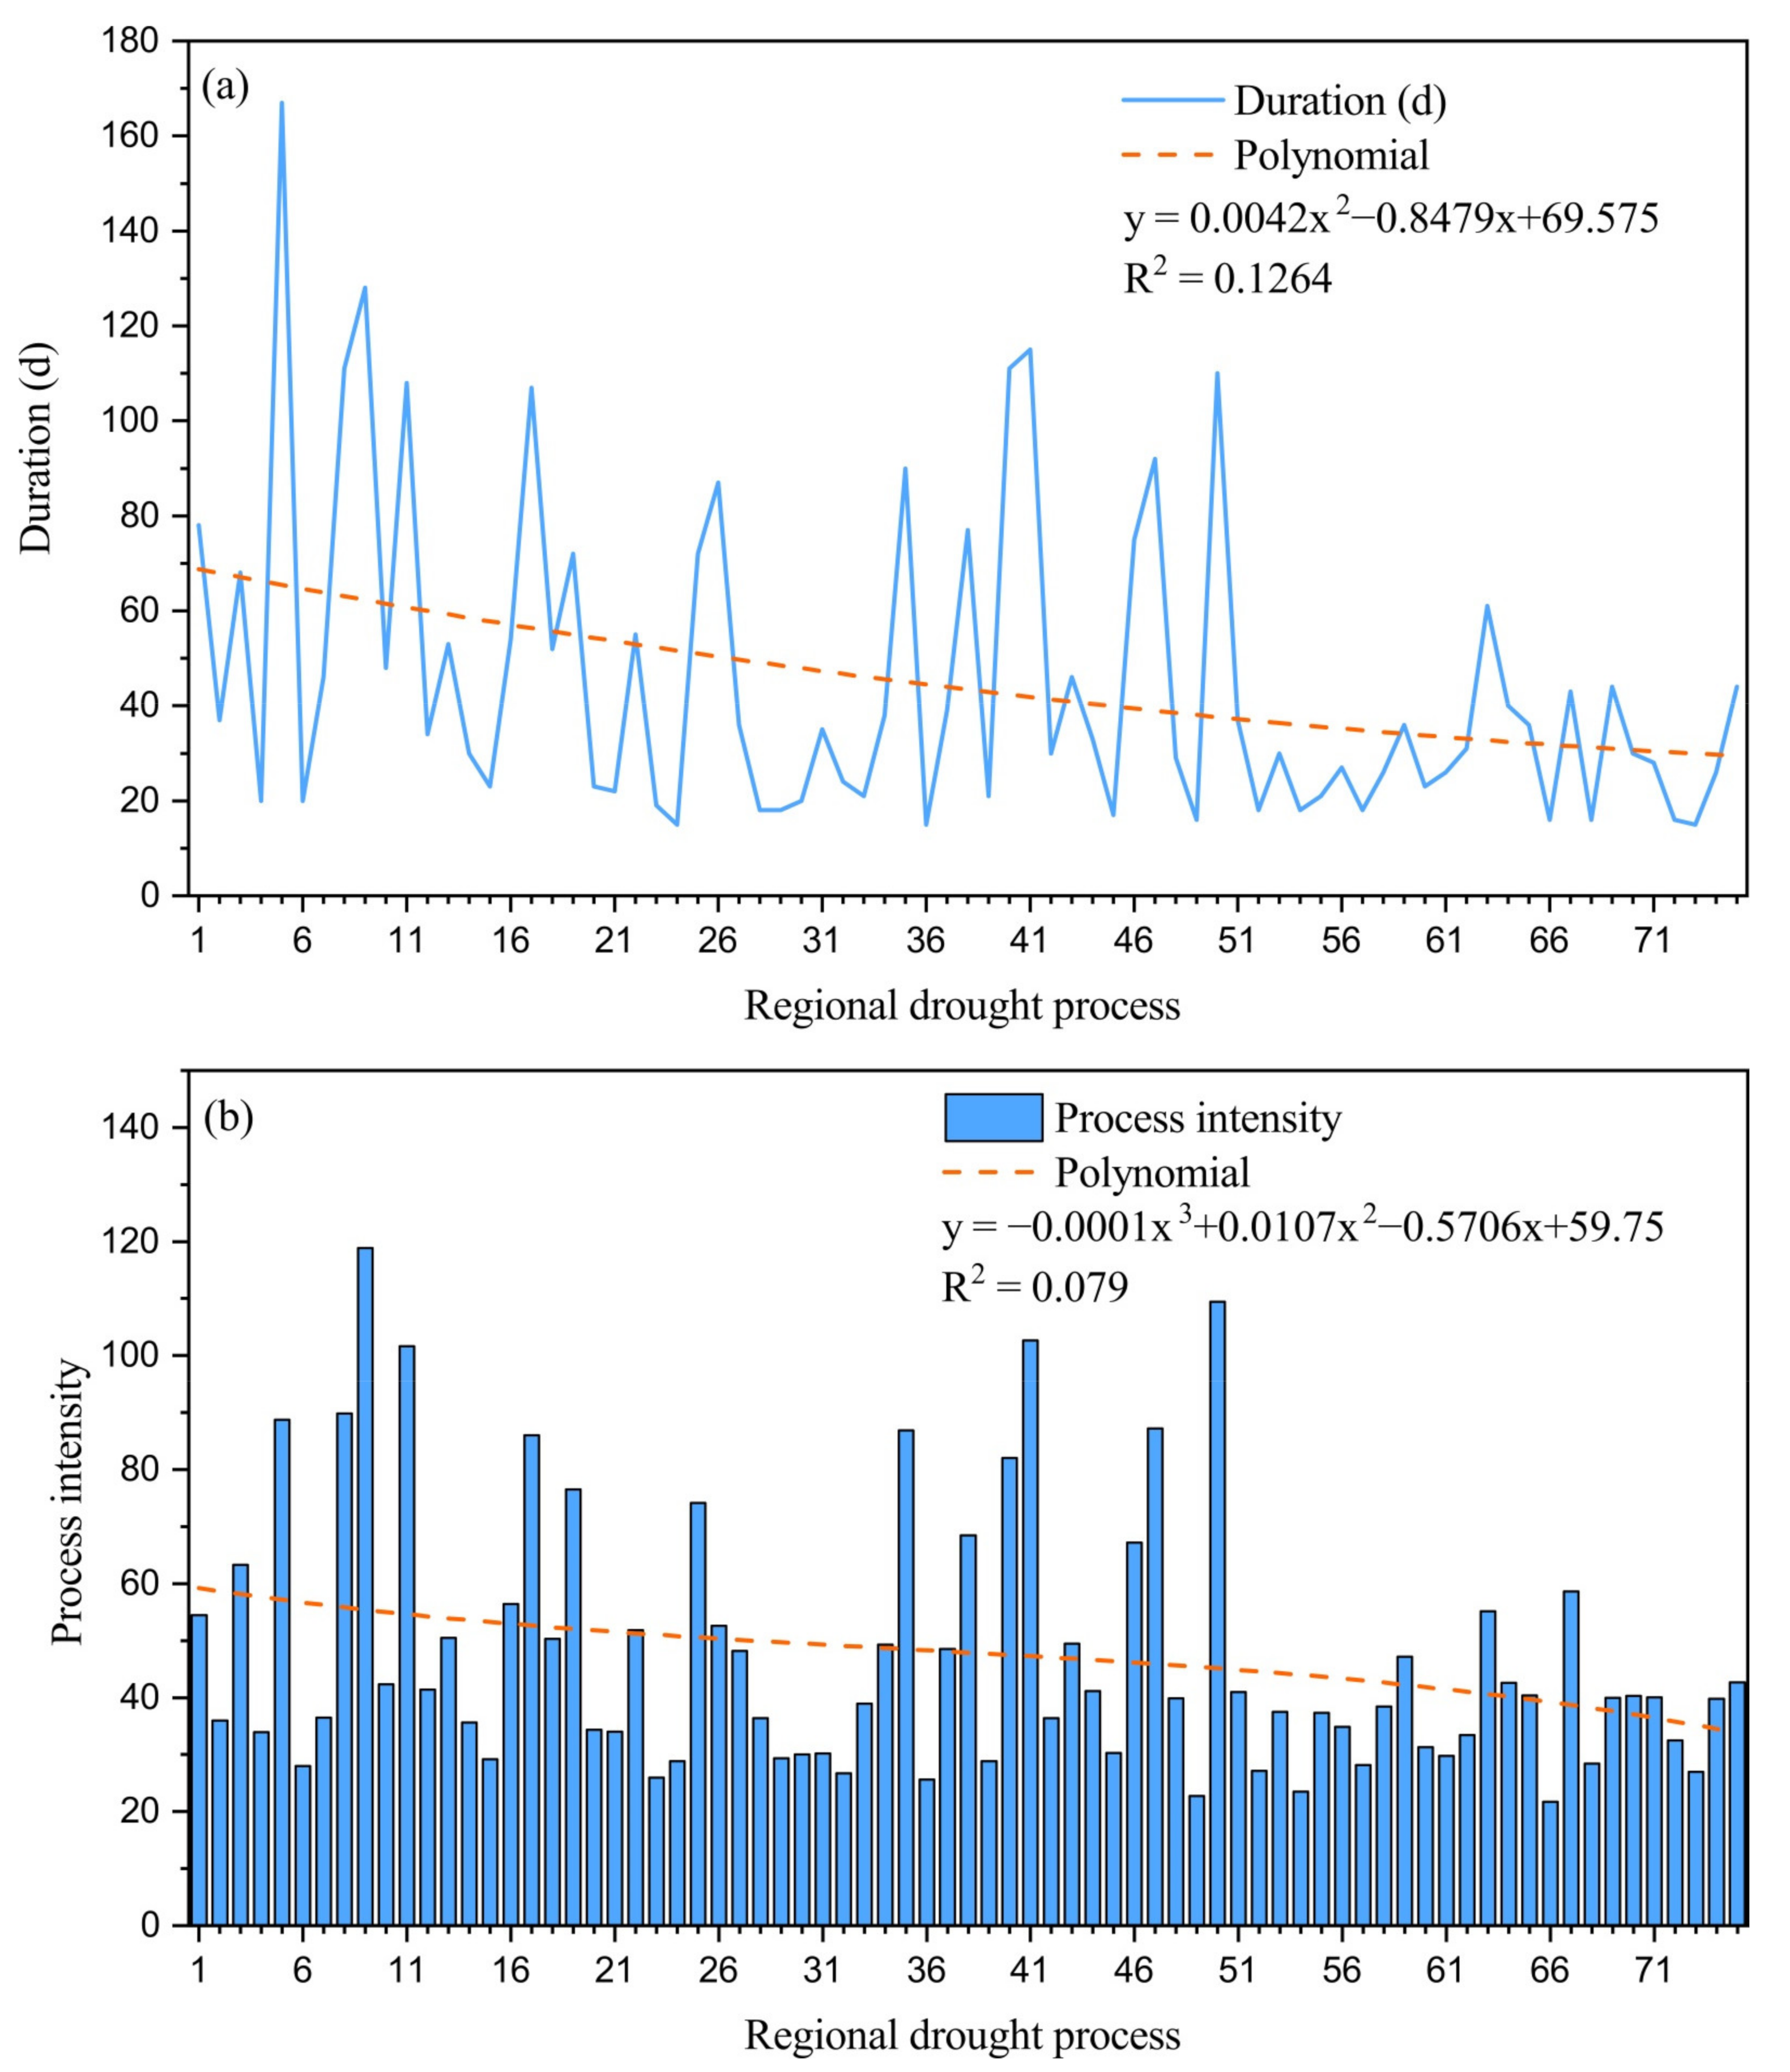
The duration, average affected area and comprehensive intensity of regional drought process in North China fluctuated greatly, with the longest duration of 167 days, showing a downward spiral trend. The average affected area has a small changing trend at both ends and a large changing trend in the middle, and the comprehensive intensity has a wave-like downward trend, all of which passed the 95% significance test.
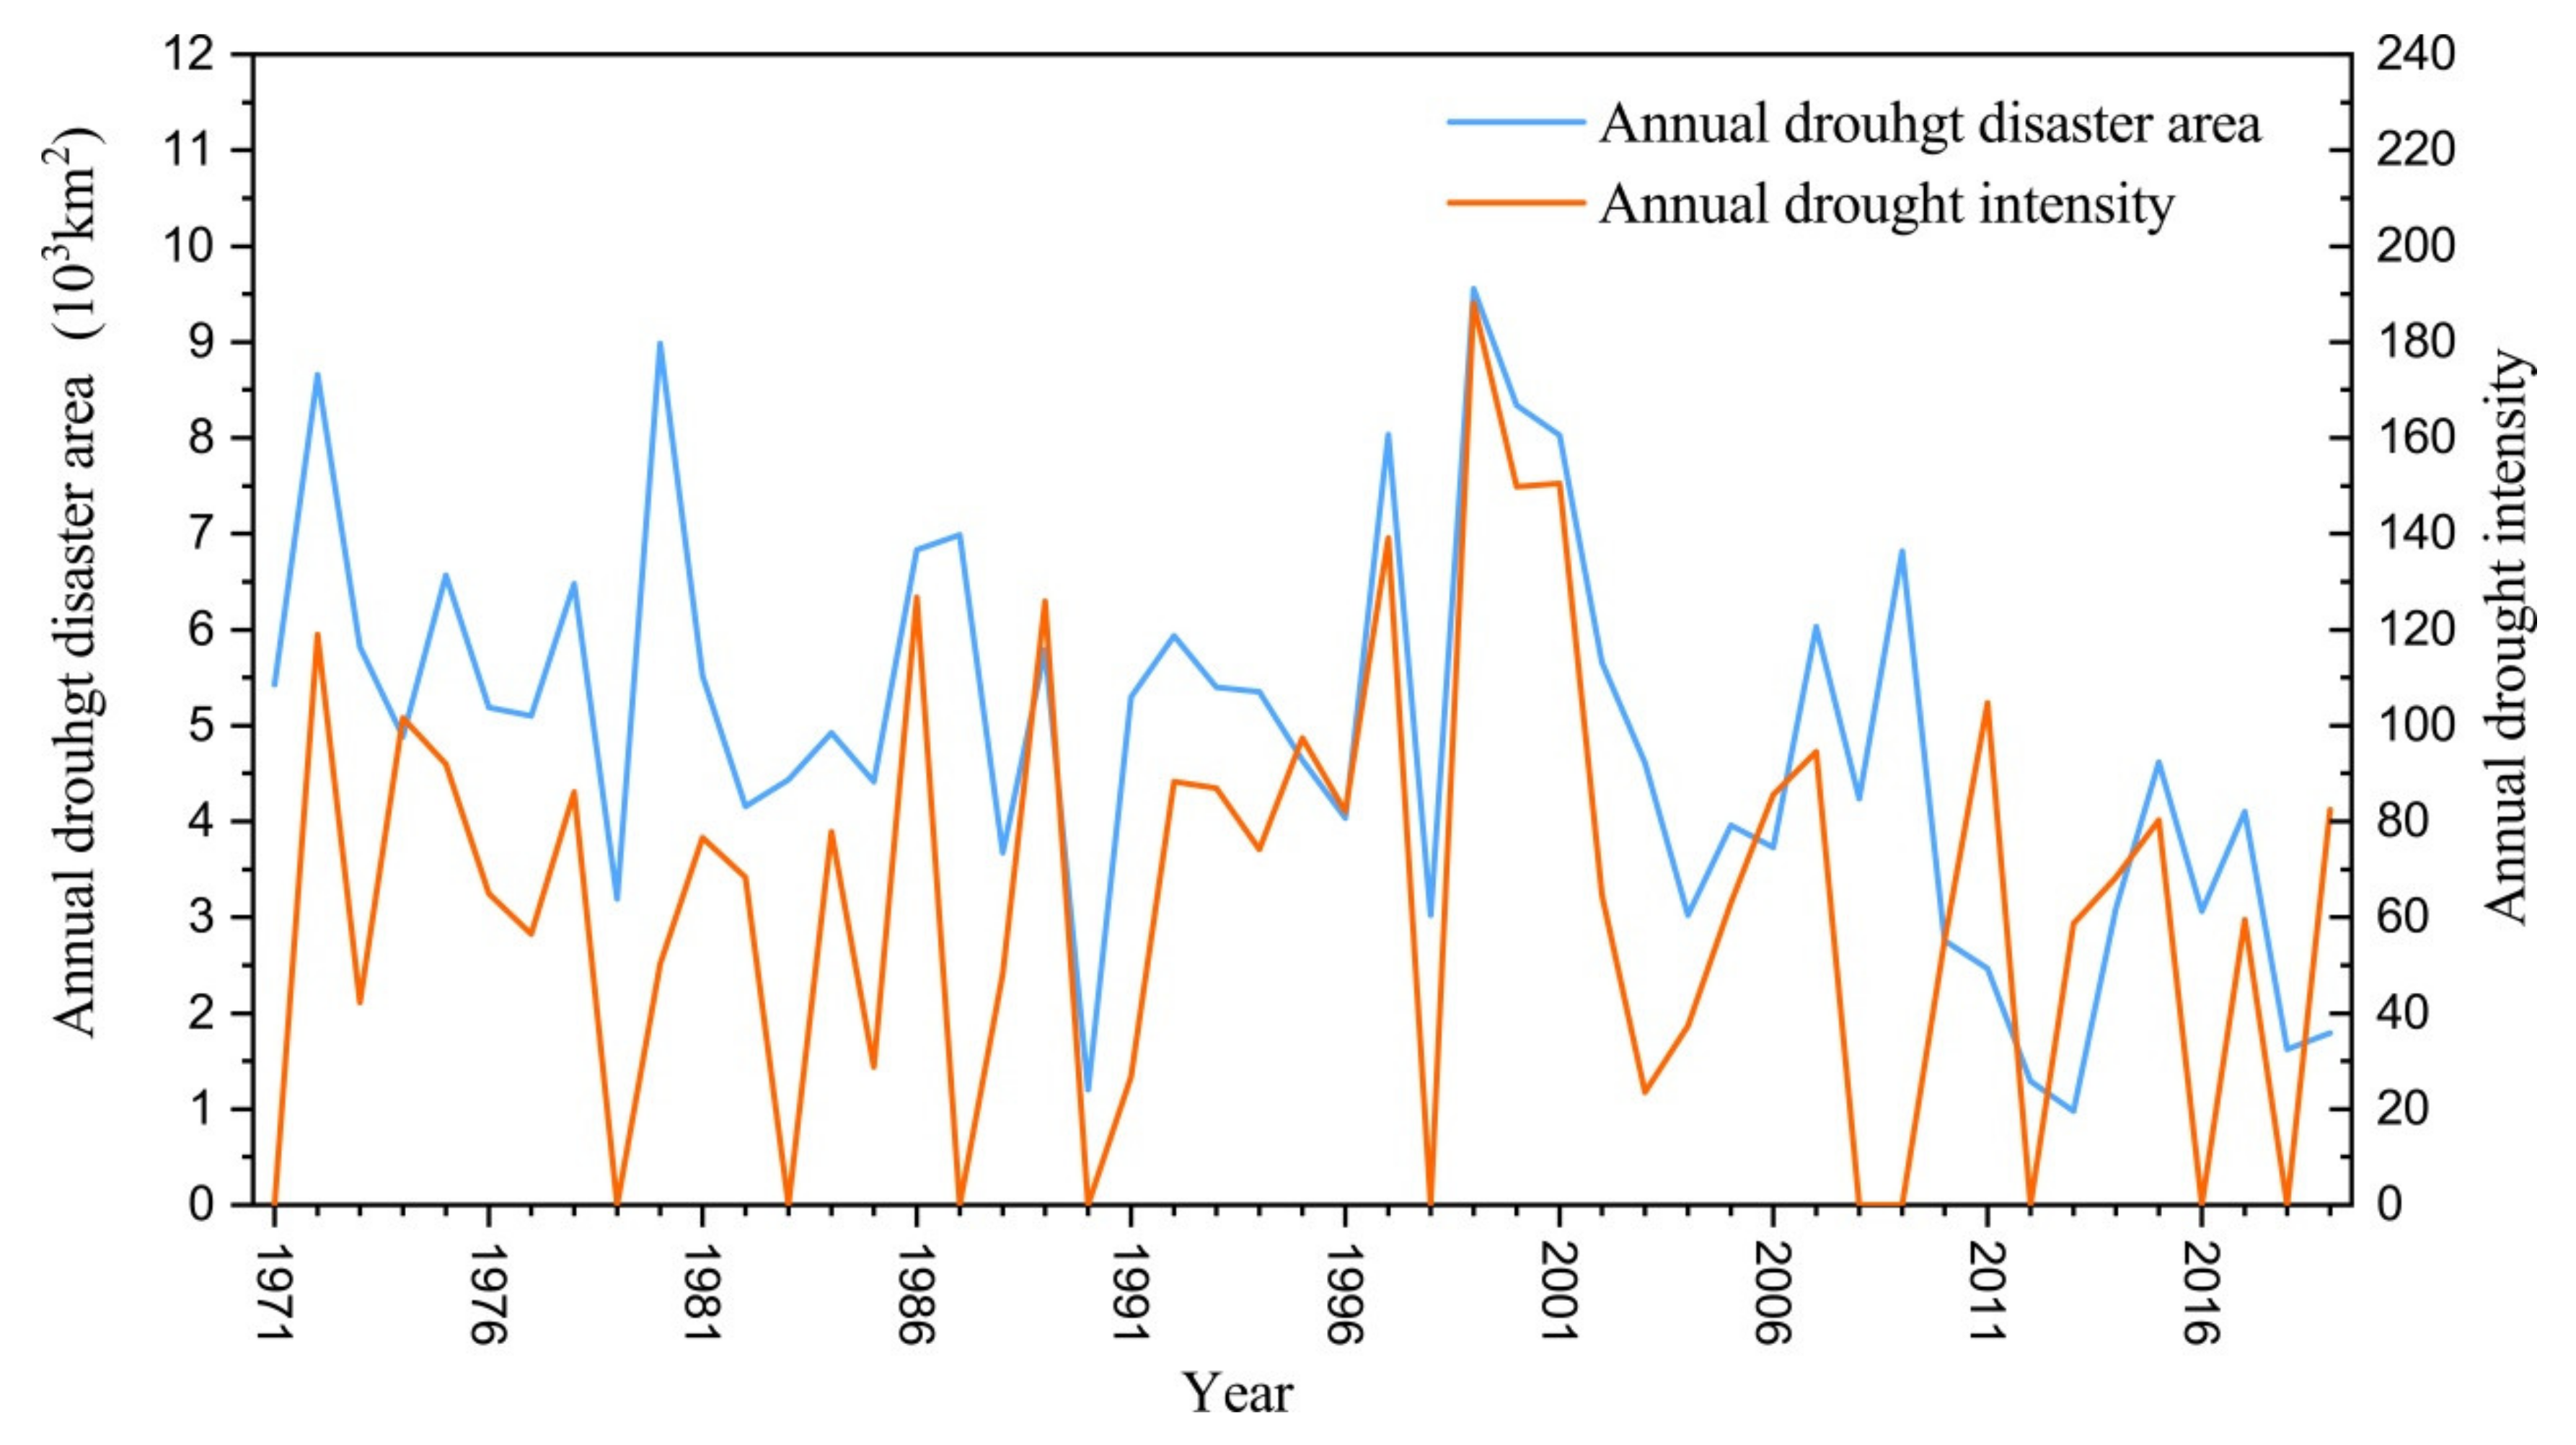
The variation trend of average annual drought process intensity was consistent with that of annual drought-affected areas. The stronger the drought intensity, the larger the drought-affected area. The correlation coefficient was 0.55, which passed the 99% reliability test, indicating that the regional drought process intensity identified had a strong correlation with the drought-affected area.
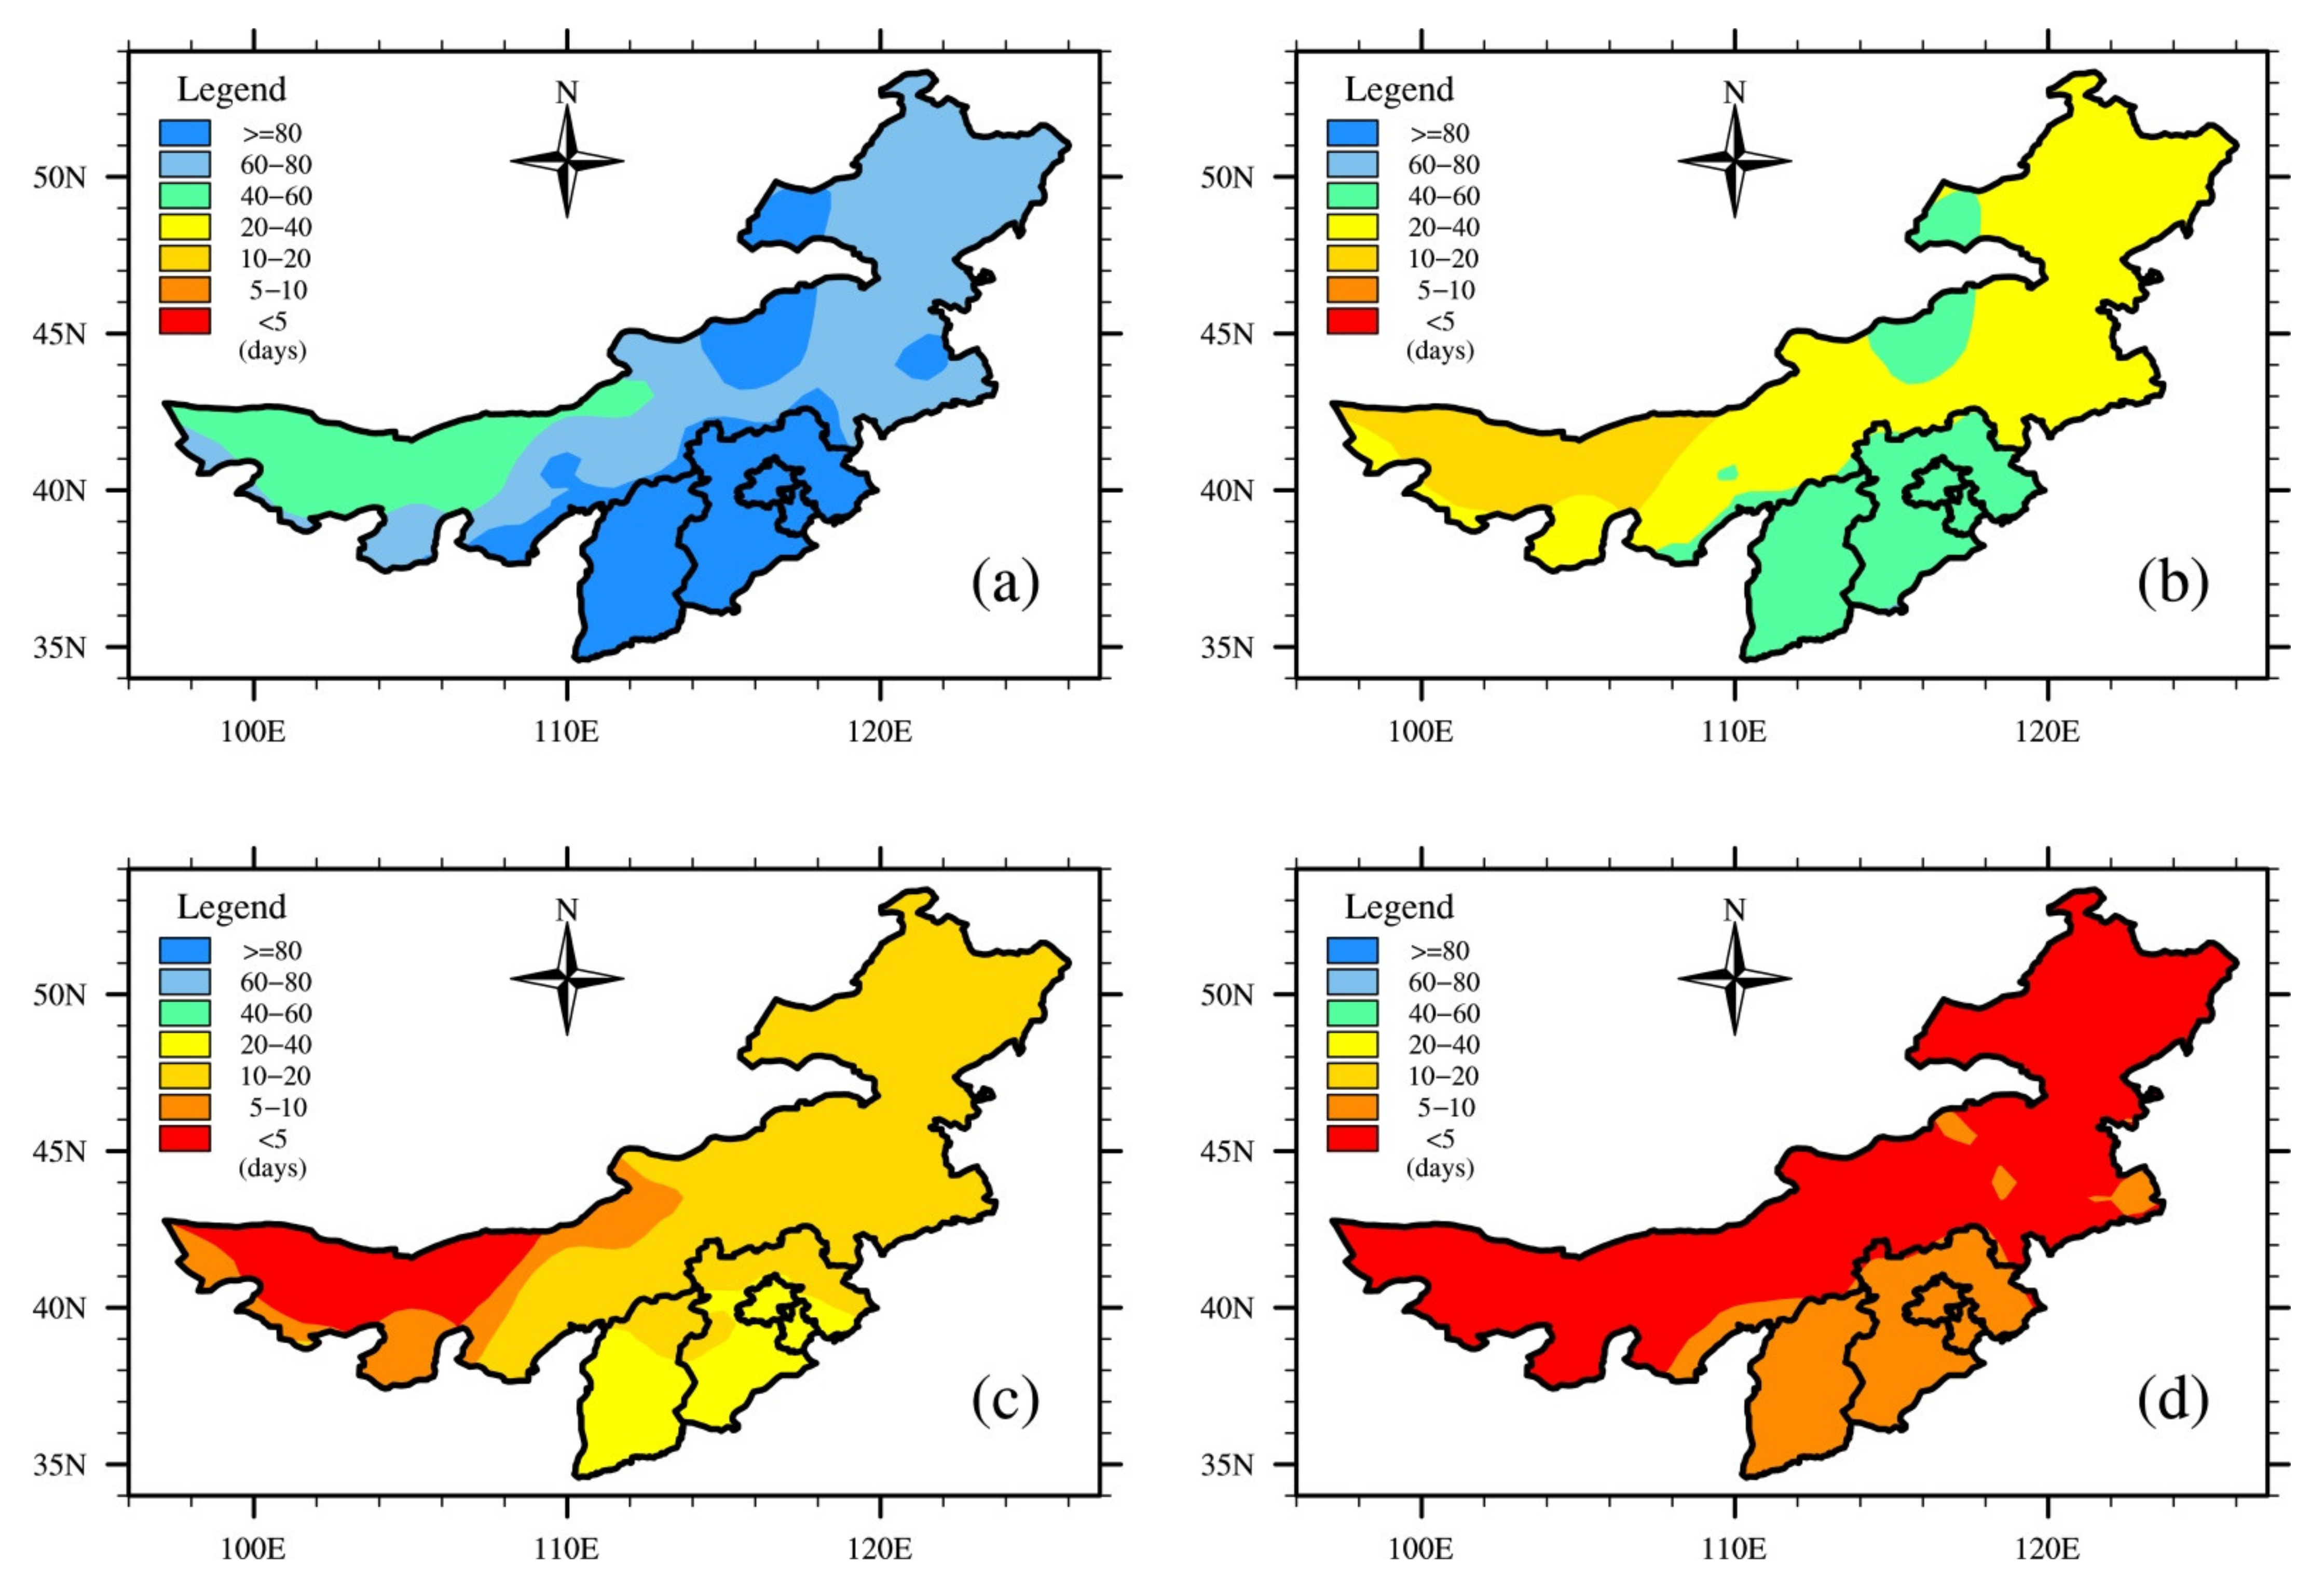
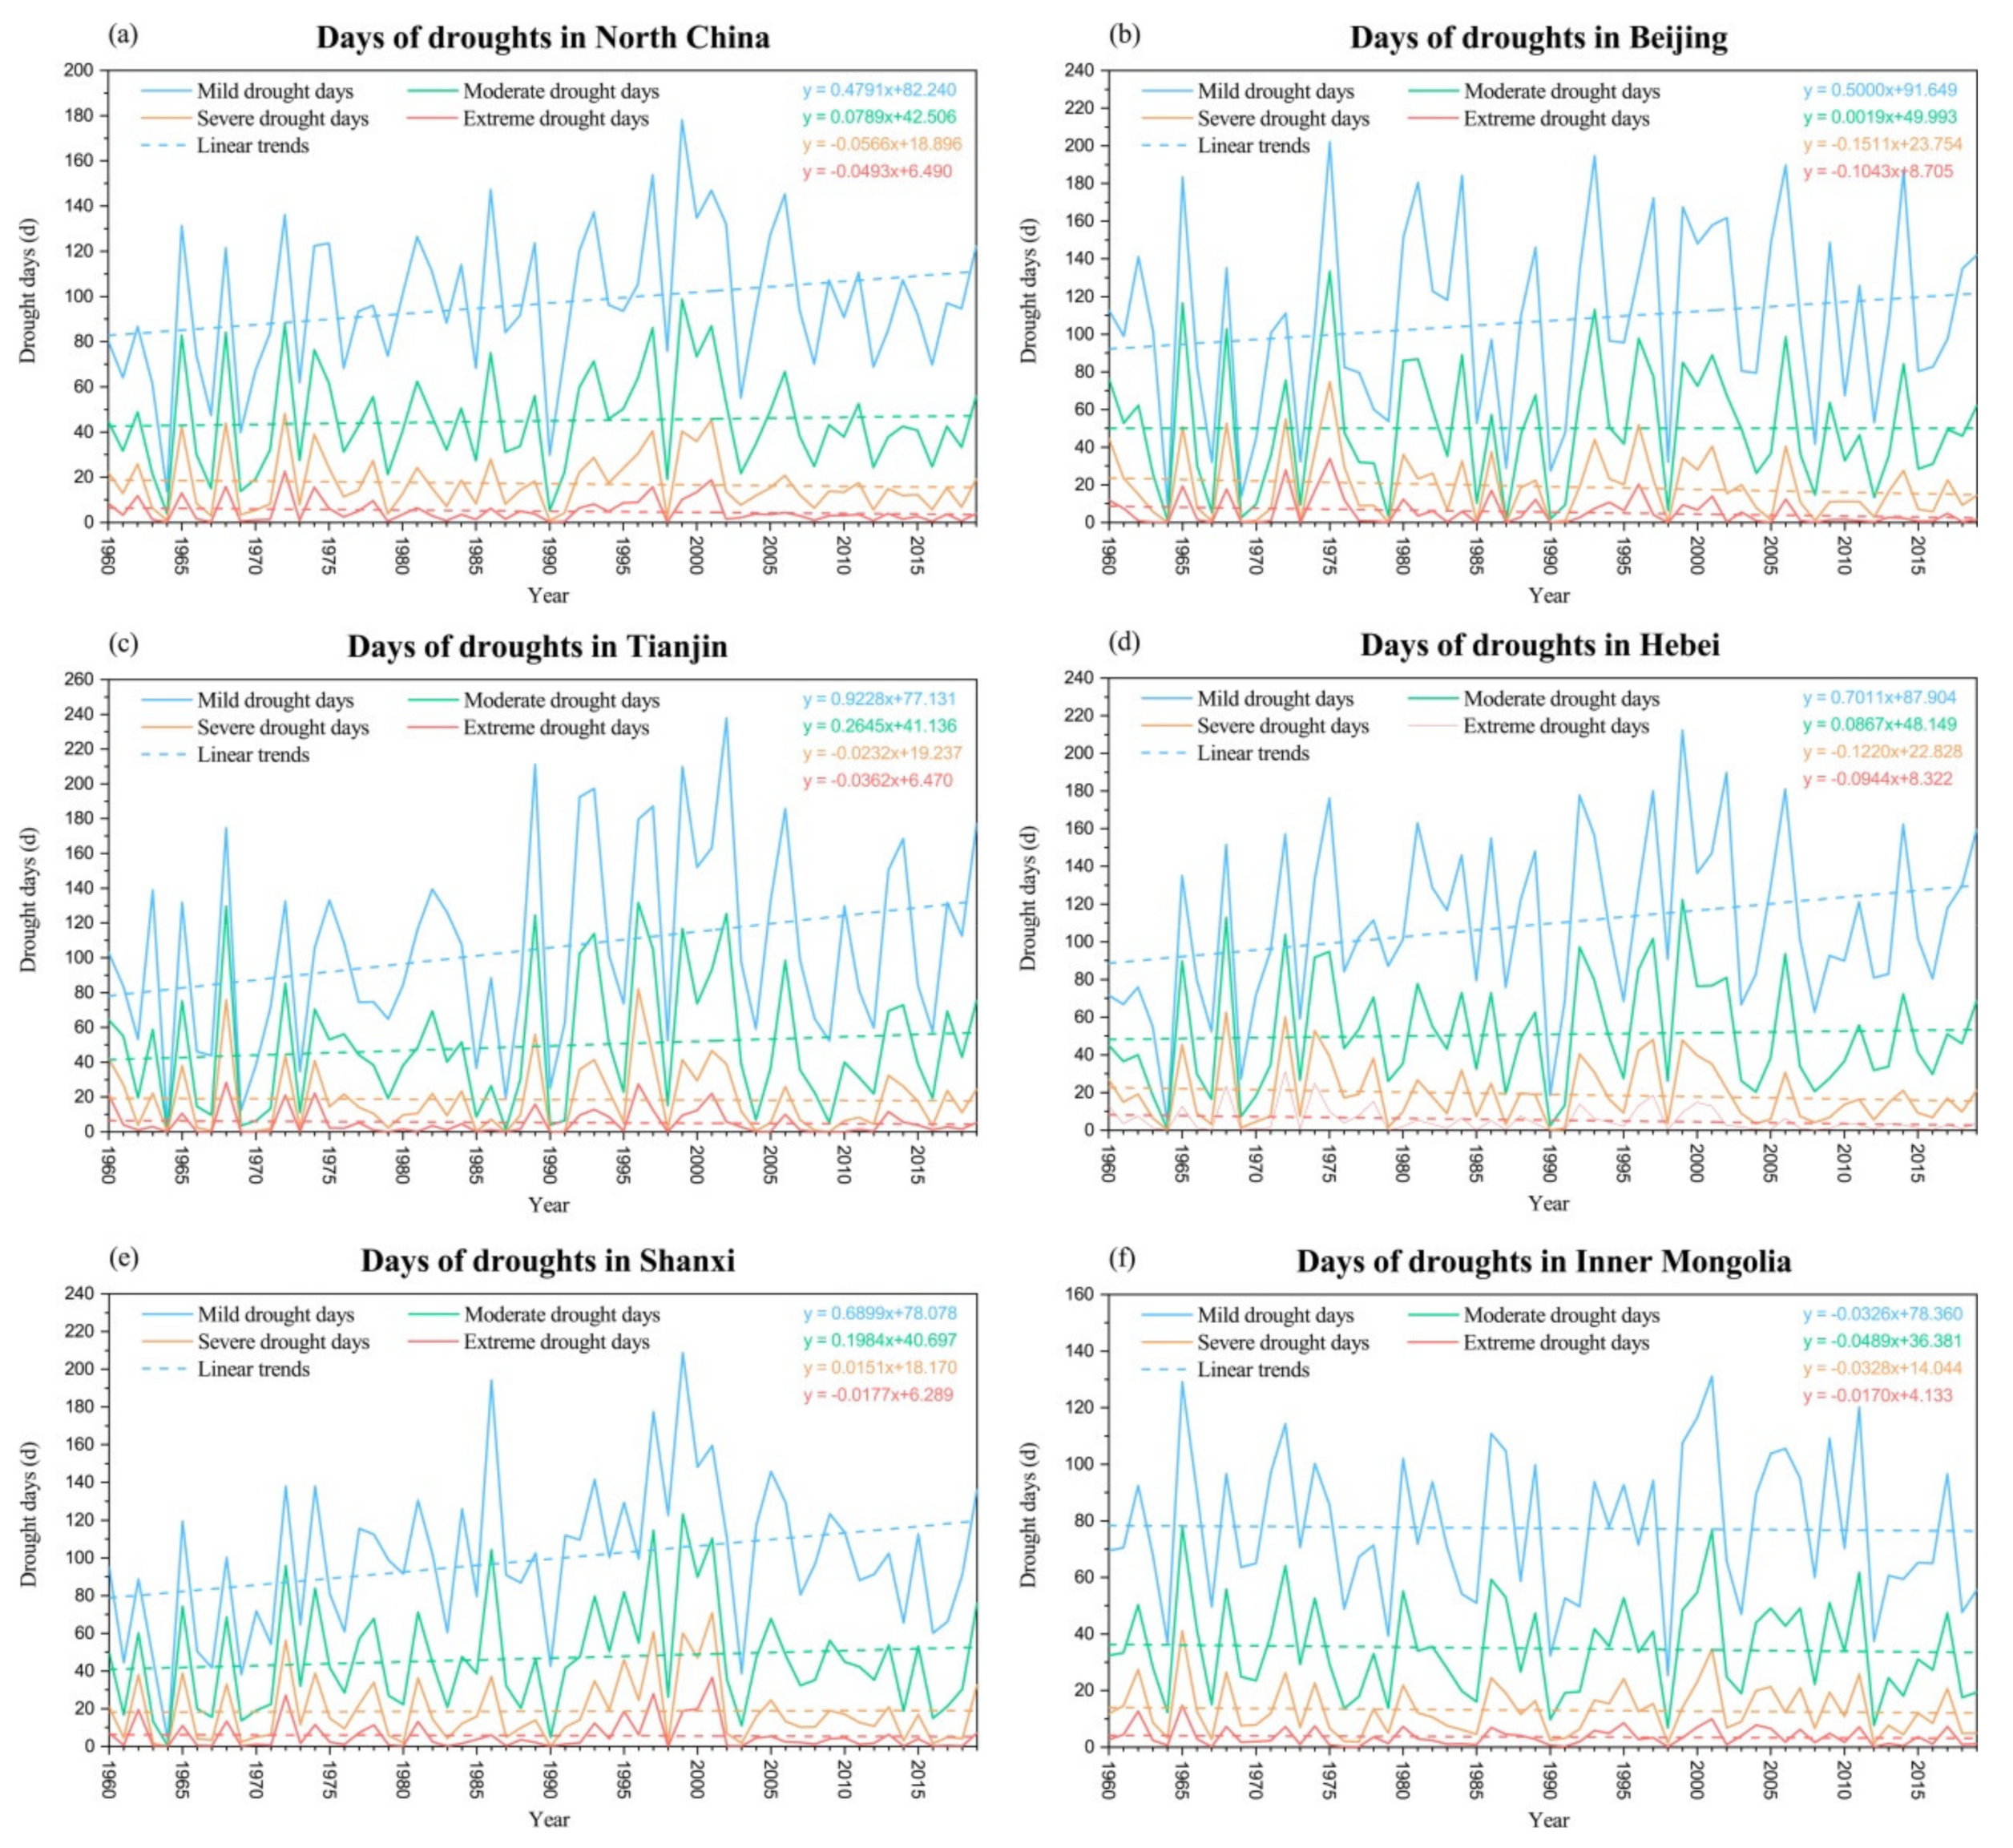
In North China, the annual average number of mild and moderate drought days showed an upward trend, while the number of severe and extreme drought days showed a downward trend. Most drought days occurred in 1999. The monthly distribution characteristics are as follows: the highest number of light drought days occurred in May and the lowest in January. The highest number of drought days in North China occurred in June. In terms of interdecadal changes, the number of mild drought and moderate drought days showed an increasing trend, the number of severe drought days showed a decreasing trend and the number of moderate drought days was the highest in the 1990s.
The frequency of drought in North China is between 66.7% and 86.7%, of which Hebei has the highest drought frequency, 86.7%, followed by Beijing, 80.0%. The average annual mild drought, moderate drought, severe drought and the highest number of drought days above occurred in Tianjin, and the highest number of extreme drought occurred in Shanxi. In terms of season, the highest number of drought days occurred in spring in Beijing, summer in Inner Mongolia and autumn and winter in Hebei. From the perspective of seasonal continuous drought, continuous drought in spring and summer was the most frequent (18 times), followed by continuous drought in summer and autumn (10 times).
The regional drought process identification method was used to effectively identify 75 regional drought processes in North China from 1960 to 2019 and monitor and evaluate the drought process from multiple perspectives such as duration, average impact area and drought process intensity. The evaluation results are in good agreement with the historical drought disasters.


