Article

Spatiotemporal Analysis of Land Use Patterns on Carbon Emissions in China

1
School of Economics and Management, China University of Geosciences (Wuhan), Wuhan 430079, China
2
School of Public Administration, Central China Normal University, Wuhan 430079, China
3
Department of Tourism Management, Jin zhong University, Jin Zhong 030619, China
4
School of Urban Planning & Design, Peking University Shenzhen Graduate School, Guangdong 518055, China
5
School of Public Administration, Hubei University, Wuhan 430062, China
*
Author to whom correspondence should be addressed.
Land 2021, 10(2), 141; https://doi.org/10.3390/land10020141
Submission received: 11 January 2021 / Revised: 28 January 2021 / Accepted: 29 January 2021 / Published: 1 February 2021

Abstract

:
Nowadays, China is the world’s second largest economy and largest carbon emitter. This paper calculates the carbon emission intensity and the carbon emissions per capita of land use in 30 provinces at the national level in China from 2006 to 2016. A spatial correlation model is used to explore its spatiotemporal features. The results show that (1) China’s land use carbon emissions continued to grow from 2006 to 2016. The spatial heterogeneity of carbon emission intensity of land use initially decreased and then increased during this period. The carbon emission of land use pattern reached a peak in 2015 and the land use carbon emission intensity was relatively lower in east China; (2) southern China accounts for a majority of the total Chinese carbon sink. Better economic structure, land use structure and industrial structure will lead to lower carbon emission intensity of land use; (3) carbon emissions per capita of land use in China are affected not only by land development intensity, urbanization level, and energy consumption structure, but also by the population policy. It is significant to formulate differentiated energy and land use policies according to local conditions. This study not only provides a scientific basis for formulating different carbon emission mitigation policies for the local governments in China, but also provides theoretical reference for other developing countries for sustainable development. It contributes to the better understanding of the land use patterns on carbon emissions in China.

1. Introduction

With the increase of greenhouse gas emission and concentration of global CO2 in the world, the carbon emission reduction has been paid more and more attention by all of society and has become a hot issue in academic research [1,2,3,4,5,6]. Land use change is an important factor in global climate change and the carbon cycle, which not only changes the natural carbon process on the surface, but also affects the carbon cycle rate by changing the human energy consumption intensity [7,8]. Strictly limiting and restricting land use can reduce the carbon emissions of residents’ lives [9], and even more, the rational regulation of land structure to mitigate climate change is more significant than reducing greenhouse gas emissions [10,11,12,13].
China is the world’s second largest economy and largest carbon emitter [14]. In the Paris climate talk on 30 November 2015, China pledged once again that its carbon emission would peak by around the year 2030 and China would strive to achieve this as soon as possible. Carbon emission per unit of gross domestic product in 2030 would reduce 60–65% compared with 2005. The share of non-fossil fuels would contribute 20% of the primary energy consumption and the forest reserves will increase by 4.5 billion cubic meters compared with 2005 [15]. Research on China’s terrestrial ecosystem carbon stocks and the effects of land use change are significant for China’s carbon mitigation [16,17,18,19].
However, most of the existing studies are limited to the case analysis in individual provinces and cities of China [5,20,21,22,23,24,25], which rarely provides more supports for the policy of carbon emission mitigation and the policy of urbanization on the national level. In addition, there is little discussion on the spatial relationship and correlation between the neighborhood units of the region in China, so the carbon emission intensity and the spatial correlation of land use cannot be clarified. To fill up this research gap, this paper calculates the carbon emission intensity of land use and the carbon emissions per capita of land use in 30 provinces at the national level in China from 2006 to 2016. It reveals the spatial correlation and distribution patterns by using the spatial autocorrelation method, which can provide a scientific basis on formulating different carbon emission mitigation policies for the local governments and contribute to better global sustainable development.
The remainder of the paper is organized as follows. Section 2 gives the related literature review. Section 3 presents the research methodologies and data sources. Section 4 displays the empirical analysis results. Section 5 draws the conclusion of this study.

2. Literature Review

The relationship between land use and carbon emission has been discussed in a large body of literature. Land use is one of the main anthropogenic causes of greenhouse effect [18,26]. There are significant differences in the biomass of different types of land, and the change of one kind of land class to the other kind of land inevitably causes the change of biomass, which leads to the change of carbon reserves [4,27]. Generally speaking, the density of organic carbon in each land use type in a descending order is woodland, grassland, cultivated land, water area, and construction land [22]. Therefore, conversion of woodland to other land use types will reduce carbon storage. It was found that the annual average carbon emissions from conversion of tropical forests of Latin America and Africa into farmland or grassland during 1990–2009 accounted for 50% and 65% of the total annual carbon emissions in these areas, respectively, so the protection and management of forests plays an important role in increasing the carbon storage of land ecosystem [28,29,30]. In addition, land use changes can also change regional microclimate to some extent, thus affecting the respiration of plants and soil, the decomposition rate of litter and so on, and then affecting the carbon process of the ecosystem [11,31,32].
In the meantime, the driving mechanism of carbon emissions from land use has been hotly discussed. It is said that carbon emissions from land use are affected by many factors, among which energy intensity is the decisive factor [33]. Population growth, economic output, industrial structure, land structure, urbanization and spatial expansion are also important factors for the growth of carbon emission from land use [7,34,35,36]. Energy efficiency and land intensity per unit GDP are the main restraining factors for the carbon emission from land use [36]. The carbon emission effect of land use is mainly reflected by the non-agrochemical land, the adjustment of land use structure, and the change of land use technology [37]. It is advocated that the transformation of forest to grassland and agricultural land would lead to the reduction of soil organic carbon reserves [18]. However, the carbon reserves of the soil decreased obviously in the initial period after the transformation of forest to grassland, and then resumed to the level before the transition [38]. These studies have analyzed the carbon emissions and their relationship with changes of land use, providing a useful guidance for the development of energy saving, emission reduction, and a low carbon economy.
What is more, there is a related research stream focusing on the accounting of land use carbon emissions. Carbon emission coefficients of different land use types and energy consumption carbon emission coefficients are always used for calculating of land use carbon emissions. The global forest carbon accumulation was estimated through sample plot inventory method [39]. The consequences of the past land cover changes on vegetative carbon stocks were explored with a combination of direct field measurements in the lowland Seattle Statistical Metropolitan Area region between 1986 and 2007 [40].
Besides, there is also a body of literatures concerning China’s certain ecosystems especially forest, grass, and crop vegetation. It was pointed out that China’s forest ecosystem was a carbon source from the late 1940s to the 1980s [41]. The carbon emission of agricultural land utilization in China during 1993–2008 was calculated and the carbon emission characteristics of various stages and provinces were explored [42]. Some scholars calculated the total amount of carbon emissions in the past 12 years in Jiangsu Province in China and analyzed its spatial distribution pattern. It was found that the carbon emissions showed an upward trend. The amount of carbon emissions in southern Jiangsu was higher than that in central Jiangsu [43].
However, to the best of our knowledge, regional differentiation and spatiotemporal pattern of land use carbon emissions at the national level is barely studied. There is only one research on the spatiotemporal analysis for the land use carbon emission on the national level [44]. In this study, the carbon emission intensity on land use patterns from 31 provinces in China is estimated. However, it is on the basis of the data of land use composition from 1990 to 2008. China has undergone marked changes over recent decades due to the rapid urbanization, agriculture development, and a series of afforestation initiatives [4]. Therefore, an updated analysis of the national carbon data of land use is needed to enrich our knowledge on global carbon emission reduction and sustainable development of society.

3. Methodology and Materials

3.1. Carbon Emission Estimation Method

3.1.1. Direct Carbon Emission Estimation Method

The carbon emissions of land use include direct carbon emissions and indirect carbon emissions. The former mainly refers to the carbon emissions caused by land use, and the latter is mainly the total anthropogenic carbon emissions carried on the land use types [44]. The amount of carbon emissions depends on the differences between the carbon source and carbon sink. The carbon source is reflected in the carbon emission intensity, and the carbon sink is reflected in the carbon storage and the accumulative rate of absorption [45]. Therefore, cultivated land and construction land are carbon sources, and forest and grassland are carbon sinks.
For the estimation of carbon emissions from arable land, forest, and grassland, the direct carbon emission coefficient method is used. The formula is as follows:
E k = E i = T i × δ i
In the formula, Ek represents the direct carbon emissions. Ei represents the carbon emissions from different land use types. Ti represents the area of land use type. δi represents the carbon emission or absorption coefficient of each land use type, in which the emission is positive and the absorption is negative. On the basis of previous research and considering the characteristics of the study areas, the carbon emission factors of the land use types of cultivated land, woodland, and grassland are 0.4220 t/(hm2·a), −0.0600 t/(hm2·a), and −0.0220 t/(hm2·a), respectively.

3.1.2. Indirect Carbon Emission Estimation Method

The carbon emission of construction land is calculated using the indirect estimation method, which is characterized by the amount of CO2 generated by energy consumption in production life. The selected energy sources include coal, coke, crude oil, gasoline, kerosene, diesel, fuel oil, natural gas, and electricity. The energy consumption is converted into standard coal. The calculation formula is as follows.
E t = E t i = E n i × θ i × f i
In the formula, Et represents the carbon emissions for construction land. Eti represents the carbon emissions of various energy sources. Eni represents the consumption of various energy sources. θi represents the coefficient of the conversion of various energy types to standard coal. fi is the carbon emission factor of various energy sources. The carbon emission coefficient of coal is 0.7560, taking the Energy and Economy Commission of Japan as a reference. The carbon emission coefficient of electricity is 0.7935, taking the Fossil Fuel Merge Net and the Power Generation Project with China Low Carbon Technology as a reference. The other energy carbon emission coefficient and the standard coal conversion coefficient are from the IPCC (Intergovernmental Panel on Climate Change) Guidelines for National Greenhouse Gas Inventories [46].

3.2. Spatial Correlation Model

3.2.1. Global Spatial Autocorrelation Model

This study uses the Moran’s I index to describe the average correlation degree, spatial distribution pattern, and its saliency of all spatial objects in the whole research area. If Xi is the observed value of area I, the global Moran’s I index of the variable is calculated using the following formula.
I = n i = 1 n j = 1 n w i j ( x i x ¯ ) ( x j x ¯ ) i = 1 n j = 1 n w i j i = 1 n ( x i x ¯ ) 2 = i = 1 n j = 1 n w i j ( x i x ¯ ) ( x j x ¯ ) S 2 i = 1 n j = 1 n w i j
In the formula, S2 represents 1 n i = 1 n ( x i x ¯ ) 2 and wij represents a space adjacency matrix. When the entity I is topological adjacent to the entity J with a common edge, the value is 1. Otherwise, it is 0.

3.2.2. Local Spatial Autocorrelation Model

Local statistics are applicable to identify small spatial correlations, verify hypotheses, and determine a distance, and there will be no correlation between space units beyond this distance [12,47]. Local autocorrelation can detect a high value accumulation area, namely a hot spot, and a low value accumulation area, namely a cold spot. In essence, the local spatial autocorrelation decomposes the Moran’s I into each regional unit. The local autocorrelation coefficient, LISA (Local Indicators of Spatial Association), defined in this study is as follows. For a space unit I, there is
I i = n ( x i x ¯ ) j = 1 n W i j ( x j x ¯ ) i ( x i x ¯ ) 2
In the formula, the sum of each row is 1, which is asymmetric. When the standardized transformation values of xi deviate from the mean, the local Moran’s I can be interpreted as a local instability index derived from the relationship between local and global statistics. The average number of Ii is equal to a proportion of the global I.
The Z test of LISA is as follows:
z = I i E ( I i ) V A R ( I i )
In the formula, VAR(I) is the theoretical variance of Moran’s I. E(I)=−1/(n − 1) is a theoretical expectation.

4. Results and Discussions

4.1. Spatiotemporal Characteristics of Carbon Emissions from Land Use

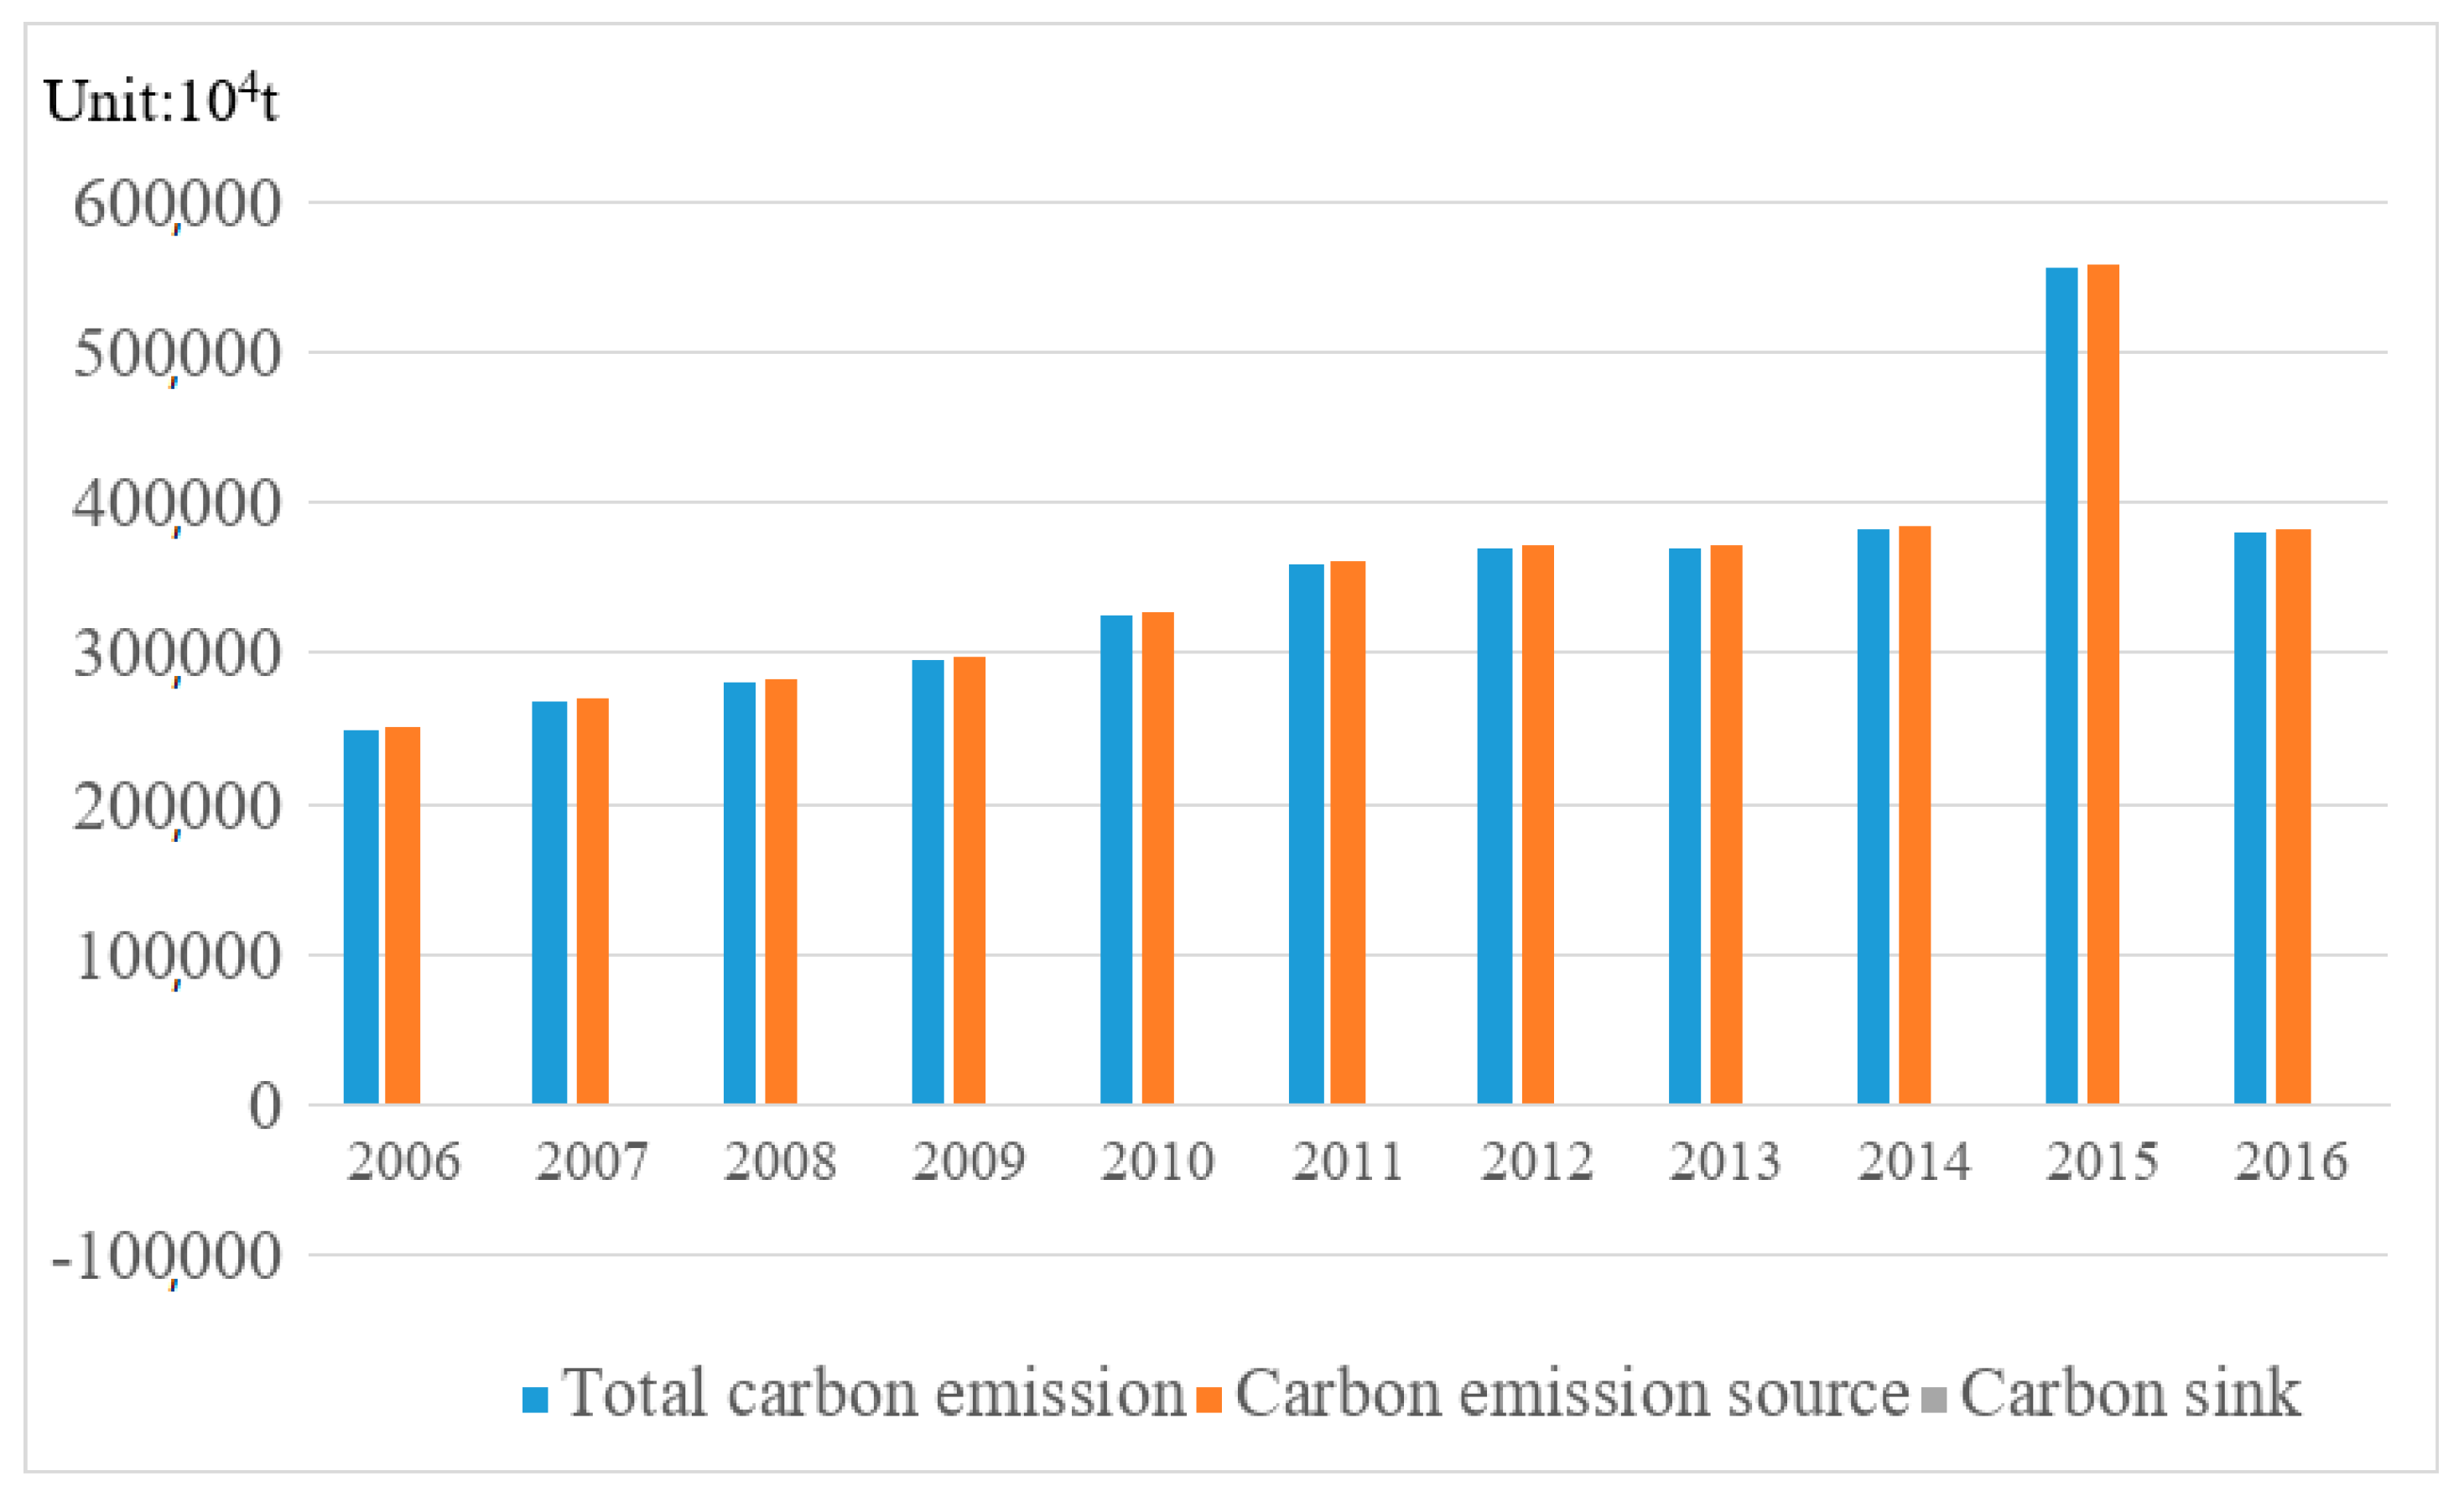
4.1.1. Temporal Characteristics of Carbon Emissions

Through calculation, the carbon emissions, carbon sources, and carbon sinks of different land use types in China from 2006 to 2016 were obtained. The results show that, from 2006 to 2016, China’s land use carbon emissions continued to grow, and its development went through three stages (Figure 1). From 2006 to 2011, the carbon emission of land use increased gradually from 248,128.744 × 104 t to 368,449.183 × 104 t. From 2011 to 2015, it was initially stable then quickly jumped to 554862.714 × 104 t. From 2015 to 2016, it decreased greatly to 379,797.774 × 104 t. During this period, carbon sources, carbon sinks, and average carbon emissions continued to rise, rising from 250,403.748 × 104 t to 382,237.248 × 104 t, 2275.005 × 104 t to 2439.474 × 104 t, and 8270.958 × 104 t to 12,659.926 × 104 t, respectively.
Among the two major carbon sources, the carbon emissions of construction land were the main ones, and their carbon emissions accounted for more than 96.8% of the total carbon sources, the proportion of which is still increasing. The proportions of carbon emissions of cultivated land were small, being below 3.2% of the total carbon sources. Its continuous decline further indicates that construction land is the main source of carbon emissions. From 2006 to 2011, the carbon emissions of construction land varied from 244,709.213 × 104 t to 355,145.049 × 104 t. From 2011 to 2015, the carbon emissions of construction land rose rapidly to 551,623.925 × 104 t. The carbon emissions of cultivated land during the whole study period remained below 5688.391 × 104 t and have been decreasing in recent years. As for the carbon sink, the proportion of carbon emissions in grassland decreased from 29.8% to 28.1%. Forest land is the main source of carbon sinks. Its carbon emissions account for more than 69.8% of the total amount of carbon sinks, and its proportion is constantly increasing. From 2006 to 2016, the carbon emissions of forest land increased from 1597.347 × 104 t to 1755.752 × 104 t, while the carbon emissions of grassland increased slowly from 677.657 × 10⁴ t to 683.721 × 10⁴ t.

4.1.2. Spatial Correlation of Land Use Carbon Emission Intensity

Since the land use structure and socio-economic development patterns of different provinces are significantly different, the total carbon use of land use in each province is not comparable. Therefore, the carbon emission intensity of land use is expressed in terms of carbon emissions per unit of gross domestic product to reflect the carbon emissions of land use and their relationship. According to the spatial autocorrelation analysis of land use carbon emission intensity in China from 2006 to 2016 (Table 1), Moran’s I values are positive for each year. The z value of each year is above the confidence level of 99% since 2012, except for the z value in 2015 which is not statistically significant, indicating that the national land use carbon emission intensity had a spatial positive correlation. These provinces with similar land use carbon emission levels are spatially concentrated, and the agglomeration situation is obvious from 2006.
On this basis, the trend of the concentration and dispersion of land use carbon emission intensity in local areas is further studied to identify ‘cold spot’ and ‘hot spot’ areas of land use carbon emission intensity (Figure 2).
The ‘high-high’ (HH) and ‘low-low’ (LL) quadrants in the Moran scatter plot (Figure 3) indicate that there is a strong spatial positive correlation among the observed values of land use carbon emission intensity. The spatial unit of carbon emission intensity of land use is homogenous. The ‘high-low’ (HL) and ‘low-high’ (LH) quadrants indicate a strong spatial negative correlation. That is, the spatial unit of land use carbon emission intensity is heterogeneous. From the Moran scatter plots of land use carbon emission intensity in the four years of 2006, 2009, 2013, and 2016, the number of samples in the HH and LL quadrants in each year account for 76.9%, 63.6%, 55.6%, and 72.6%, respectively. The corresponding sample proportions in the HL and LH quadrants are 23.1%, 36.4%, 44.4%, and 27.4%, respectively. This indicates that the spatial heterogeneity or discrete distribution pattern of land use carbon emission intensity decreased initially and then increased throughout the study period. However, in general, the spatial correlation of land use carbon emission intensity in the local range is high, and local agglomeration is significant. In particular, the spatial agglomeration of HH and LL is significant. The HL area here is of the local high-value outlier type. That is, the land use carbon emission intensity is relatively higher than that of the surrounding provinces. Only Guizhou and Shandong pass the test of statistical significance. On one hand, it shows that the carbon emission intensity of land use in Guizhou has always been at a high level in the country. This is because its economic development has been slow for a long time compared with surrounding provinces. The low energy efficiency, expanding area of urban construction, and decreasing area of forest land pushes up the carbon emission intensity of land use in Guizhou. Alternately, it reflects that Guizhou is surrounded by provinces with relatively low carbon intensities of land use, which further reflects the current low carbon intensity of land use in the Sichuan and Guizhou provinces. Compared with Guizhou, the provinces beside it have a relatively high rate of economic development and high energy efficiency, which is related to the low intensity of land use carbon emissions in these provinces. Shandong Province is China’s third largest economy and the second largest province. The large population, the rapid development of heavy industry enterprises, and the high level of land development have contributed to its carbon emissions, resulting in the increase of carbon emission intensity of land use.
The LH area here is the local low-value outlier type. That is, the land use carbon emission intensity is relatively lower than that of the surrounding provinces. Its spatial pattern is relatively stable, showing a trend of initially increasing and then decreasing. It is mainly distributed in East China and is significantly stable in Beijing and Tianjin. The transfer of the heavy chemical industry, upgraded industrial structure, and strictly controlled construction land area in Beijing and Tianjin contribute to the reduction of carbon emissions from land use, which ultimately leads to a low carbon emission intensity of land use.
From 2006 to 2016, the spatial pattern of the “cold spot” zone of land use carbon emission intensity in the country is relatively stable, showing a process of initially increasing and then decreasing, both in the Yangtze River Delta on the eastern coast and the Pearl River Delta on the southern coast. Guangdong, Guangxi, and Zhejiang are always in a prominent state. During this period, Fujian, Anhui, Shanghai, and Shandong are gradually removed from the “cold spot” significant area of land use carbon emission intensity. The distribution of “hot spot” significant areas of land use carbon emission intensity shows a decreasing trend year by year. It is mainly distributed in the northwestern region, where Xinjiang, Qinghai, and Gansu lie. Qinghai and Gansu are significantly stable (Table 2). This is mainly because the northwest region has long been an important natural gas base in China, and the mining and consumption of raw materials are relatively high. It not only has Tarim Oilfield, Xinjiang Oilfield, Tuha Oilfield, and Qinghai Oilfield, but also it has natural gas pipelines such as the West-East Gas Pipeline and the Suininglan Pipeline. With the deepening of economic globalization and regional economic integration, the trend of industrial cross-regional transfer has become increasingly evident. Chinese central government has encouraged the orderly transfer of industries in the eastern and central regions to the western region since 2007. The focus of national energy consumption is gradually shifting to the northwest. Gradually, the growth rate of total carbon emissions from social and economic activities carried by construction land is significantly higher than the rate of the expansion of construction land itself, resulting in high carbon emissions intensity of land use. The agglomeration of the “cold spot” area of land use carbon emission intensity is mainly due to the fact that the traditional high energy consuming industries in the Yangtze River Delta and the Pearl River Delta in the eastern coastal areas gradually shifted to the central and western regions after 2000, while the economic structure of intensive capital and knowledge innovation gradually reduced the dependence on primary energy consumption and improving energy efficiency.

4.1.3. Spatial Correlation of Carbon Emissions Per Capita on Land Use

According to the global spatial autocorrelation analysis of China’s carbon emissions per capita on land use from 2006 to 2016 (Table 3), the Moran’s I values are positive for each year, except for the z value in 2015 which was not statistically significant. They are at the confidence level of 95%, indicating that, based on land use, the carbon emissions per capita have a spatial positive correlation across the country. With an increasing value of Moran’s I, the provinces with similar carbon emissions per capita on land use show a more spatially agglomerated mode in space.
Although the global spatial autocorrelation index reflects the spatial correlation of carbon emissions per capita on land use across the country, it is difficult to find spatial correlations in different regions. Therefore, a local spatial autocorrelation index is needed to identify possible local significant spatial correlations and identify “cold spots” and “hot spots” for carbon emissions per capita on land use (Figure 4). From the Moran’s I scatter plots (Figure 5) of the country in 2006, 2009, 2013, and 2016, the number of provinces located in the HH and LL quadrants in each year accounted for 62.5%, 77.3%, 79.6%, and 79.2% of the whole nation. Provinces in the HL and LH quadrants take up 37.5%, 22.7%, 20.4%, and 20.8% correspondingly. This shows that the positive correlation of carbon emissions per capita on land use in space increased from 2006 to 2016. The agglomeration pattern is significant, and the homogeneous spatial units increased. The increase in the number of provinces distributed in the third quadrant indicates that the low value cluster area of carbon emissions per capita on land use expanded.
As for the HL areas, only Shaanxi passes the statistical significance test, indicating that this “convex point” may be a low probability event. As for the LH areas, they are distributed in East China, North China, and Central South of China, decreasing year by year. Jilin, Hubei, and Jiangsu have been gradually eliminated. No province passed the statistical significance test until 2016 (Table 4). Although Jilin is one of the earliest areas in China to carry out ecological province construction and has certain achievements, its industrial structure is still dominated by heavy industries with high energy consumption as an old industrial base. High energy consumption and high carbon emissions have become an important obstacle to develop a low carbon economy in Jilin Province. Due to the continuous influx of population and the impact of the two-child birth policy, the population in Hubei is increasing. With the rapid development of Hubei’s economy, the area of construction land in Hubei is increasing. In addition, the unreasonable energy structure dominated by the consumption of coal makes its carbon emissions per capita on land use continue to rise.
From 2006 to 2016, the spatial pattern of the “cold spot” area of carbon emissions per capita on land use in the country is relatively stable, showing a trend of initially increasing and then decreasing. It is mainly in the southwest and south-central regions, in which Sichuan and Hainan have a higher degree of stability as a “cold spot” zone. Hainan is the only tropical marine island in China. It is the most abundant forest ecosystem and the largest tropical agricultural base in China. It has less construction land, sparse population, and a less developed economy and general resource consumption. These factors contribute to its low carbon emissions per capita on land use. Land use in Sichuan is also dominated by grassland and woodland. Sichuan is one of the three major forest areas and five major pastoral areas in China. In addition, it has been unswervingly accelerating the transformation of its economic development mode, focusing on promoting the transformation of production methods to high efficiency, and vigorously developing hydropower, wind power, solar energy, and energy-saving environmental protection equipment industries over the years. This leads to the decline of the proportion of carbon consumption. In 2016, clean energy installation in Sichuan accounted for more than 80.0% of the market, and coal consumption only accounted for 35.0% of primary energy consumption [48].
After 2009, Yunnan province was excluded from the stable “cold spot” area. This is in line with the continuous development of Yunnan’s economy, increasing population, and increasing construction land area, resulting in an increase in carbon emissions per capita from land use. After 2013, Guangdong province was excluded from the stable “cold spot” area. This is in line with the increasing population of Guangdong province and the strong demand for energy consumption. The manufacturing industry in Guangdong still has a large demand for energy.
The distribution of “hot spots” in carbon emissions per capita from land use has changed greatly, showing a trend of initially increasing and then decreasing. Before 2009, the distribution was mainly concentrated in the northeast plain and the Mongolian plateau. Energy production and heavy industry account for a relatively high proportion of economic structure in those regions since they are important heavy industry and energy bases in China. At the same time, Inner Mongolia is also an important province for power transmission from the North China Power Grid. However, with the problem of population loss and aging, the economic development of these areas has been largely restricted. Long-term exploitation has caused the resources in these areas to be exhausted, resulting in slow economic growth, which gradually leads to the exclusion from the high-value “hot spot” significant area. In 2016, only Jiangsu passes the statistical significance test (Figure 2). This is in line with Jiangsu’s industrialization, rapid economic development, increasing population, and increasing energy consumption, which results in an increase in carbon emissions per capita from land use.

5. Conclusions and Policy Implications

This paper reveals the spatial correlation and distribution patterns of carbon emissions from land use by calculating the carbon emission intensity of land use and the carbon emissions per capita of land use in 30 provinces at the national level in China from 2006 to 2016. From 2006 to 2016, China’s land use carbon emissions went through three stages showing some evidences for the descending order of the density of organic carbon in each land use type from woodland, grassland, cultivated land, water area to construction land. Since the protection and management of forests plays an important role in increasing the carbon storage of land ecosystems, it is necessary to adhere to the principle of protecting nature, giving priority to conservation, protection, and natural restoration, and keep the natural ecological security boundary. It is also of great significance to accelerate the promotion of green and low-carbon development, continuously improving the quality and stability of the ecosystem, and comprehensively improving the efficiency of resource utilization.
In addition, the spatial heterogeneity of carbon emission intensity of land use from 2006 to 2016 indicates that better economic structure, land use structure, and industrial structure will lead to lower carbon emission intensity of land use in those areas. The spatial pattern of the “cold spot” area and “hot spots” area of carbon emissions per capita of land use in the country is affected by the population policy, land development intensity, urbanization level, and energy consumption structure in those areas. Those findings provide valuable reference for practitioners and decision-makers for implementing low carbon economy. Besides, the results indicate that it is of great significance to formulate differentiated energy and land use policies according to local conditions, with control of the carbon emission in Guizhou, Shandong, Qinghai, and Gansu, which have the high carbon emissions intensity of land use. More attention should be paid to Shaanxi and Jiangsu, where carbon emissions per capita of land use are high. In future studies, the spatial correlation and distribution patterns of carbon emissions from land use can be analyzed at the country level to deeper understand the differences in each province in China.

Author Contributions

Conceptualization, Q.L.; methodology, L.Z.; validation, B.Q.; writing—original draft preparation, Q.L.; writing—review and editing, Y.Z., C.W.; funding acquisition, L.Z., Q.L. All authors have read and agreed to the published version of the manuscript.

Funding

This research was funded by National Natural Science Foundation of China (Grant No. 41,801,205) and Special Funds of the Central University for Basic Scientific Research (Grant No. CUG190268).

Data Availability Statement

The data presented in this study are available on request from the corresponding author. The data are not publicly available due to privacy.

Conflicts of Interest

The authors declare no conflict of interest.

References

  1. Bryan, B.A.; Gao, L.; Ye, Y.; Sun, X.; Connor, J.D.; Crossman, N.D.; Stafford-Smith, M.; Wu, J.; He, C.; Yu, D.; et al. China’s response to a national land-system sustainability emergency. Nature 2018, 559, 193–204. [Google Scholar] [CrossRef] [PubMed]
  2. Piao, S.; Fang, P.; Ciais, P.; Peylin, P.; Huang, Y.; Sitch, S.; Wang, T. The carbon balance of terrestrial ecosystems in China. Nautre 2009, 458, 1009–1013. [Google Scholar] [CrossRef] [PubMed]
  3. Houghton, R.A. How well do we know the flux of CO2 from land usechange? Tellus Ser. B—Chem. Phys. Meteo. 2010, 62, 337–351. [Google Scholar] [CrossRef]
  4. Lai, L.; Huang, X.; Yang, H.; Chuai, X.; Zhang, M.; Zhong, T.; Chen, Z.; Chen, Y.; Wang, X.; Thompson, J.R. Carbon emissions from land-use change and management in China between 1990 and 2010. Sci. Adv. 2016, 2, 1–8. [Google Scholar] [CrossRef] [PubMed] [Green Version]
  5. Liang, S.; Chen, F.; Qu, J.F.; Zhang, S.L.; Hao, S.J. Comprehensive evaluation of agricultural modernization level in Jiangsu province under low carbon background. Jiangsu Agri. Sci. 2015, 43, 423–426. [Google Scholar]
  6. Jin, G.; Guo, B.S.; Deng, X.Z. Is there a decoupling relationship between CO2 emission reduction and poverty alleviation in China? Technol. Forecast. Soc. 2020, 151, 119856. [Google Scholar] [CrossRef]
  7. Xu, Q.; Yang, R.; Dong, Y. The influence of rapid urbanization and land use changes on terrestrial carbon sources/sinks in Guangzhou, China. Ecol. Indic. 2016, 70, 304–316. [Google Scholar] [CrossRef]
  8. Zhao, R.Q.; Huang, X.J. Carbon cycle of urban system: Characteristics, mechanism and theoretical framework. Chin. J. Ecol. 2013, 33, 358–366. [Google Scholar]
  9. Gebhart, D.L.; Johnson, H.B.; Mayeux, H.S.; Polley, H.W. The CRP increase in soil organic carbon. J. Soil Water Conver. 1994, 49, 488–492. [Google Scholar]
  10. Zomer, R.J.; Trabucco, A.; Bossio, D.A.; Verchot, L.V. Climate change mitigation: A spatial analysis of global land suitability for clean development mechanism afforestation and reforestation. Agri. Ecos. Environ. 2008, 126, 67–80. [Google Scholar] [CrossRef]
  11. Jin, G.; Chen, K.; Wang, P.; Guo, B.S.; Dong, Y.; Yang, J. Trade-offs in land-use competition and sustainable land development in the North China Plain. Technol. Forecast. Soc. 2019, 141, 36–46. [Google Scholar] [CrossRef]
  12. Jin, G.; Deng, X.Z.; Zhao, X.D.; Guo, B.S.; Yang, J. Spatiotemporal patterns in urbanization efficiency within the Yangtze River Economic Belt between 2005 and 2014. J. Geogr. Sci. 2018, 28, 1113–1126. [Google Scholar] [CrossRef] [Green Version]
  13. Deng, X.Z.; Huang, J.K.; Rozelle, S.; Zhang, J.P.; Li, Z.H. Impact of urbanization on cultivated land changes in China. Land Use Pol. 2015, 45, 1–7. [Google Scholar] [CrossRef]
  14. Yang, J.; Li, Y.; Hay, I. Decoding national new area development in China: Toward new land development and politics. Cities 2019, 87, 114–120. [Google Scholar] [CrossRef]
  15. NDRCC. Enhanced Actions on Climate Change: China’s Intended Nationally Determined Contributions; Department of Climate Change, National Development and Reform Commission of China: Beijing, China, 2015.
  16. Fang, J.; Chen, A.; Peng, C.; Zhao, S.; Ci, L. Changes in forest biomass carbon storage in China between 1949 and 1998. Science 2001, 292, 2320–2322. [Google Scholar] [CrossRef] [PubMed]
  17. Houghton, R.A. Magnitude, distribution and causes of terrestrial carbon sinks and some implications for policy. Clim. Pol. 2002, 2, 71–88. [Google Scholar] [CrossRef]
  18. Houghton, R.A.; Hackler, J.L. Emissions of carbon from forestry and land-use change in tropical Asia. Glob. Chang. Biol. 1999, 5, 481–492. [Google Scholar] [CrossRef]
  19. Ge, Q.; Dai, J.; He, F.; Pan, Y.; Wang, M. Land use changes and their relations with carbon cycles over the pass 300 a in China. Sci. Chin. Seri. D 2008, 51, 871–884. [Google Scholar] [CrossRef]
  20. Li, Y.; Huang, X.J.; Zhai, F. Analysis of carbon emission effects in different land uses in Jiangsu province. Agricul. Eng. 2008, 24, 102–107. [Google Scholar]
  21. Su, Y.L.; Zhang, Y.F. Study on carbon emission effects of land use change in Shaanxi Province. J. Soil Water Conserv. 2011, 25, 152–156. [Google Scholar]
  22. Chuai, X.W.; Huang, X.J.; Zheng, Z.Q. Impacts of land use change on carbon storage of terrestrial ecosystem in Jiangsu province. J. Res. Sci. 2011, 33, 1932–1939. [Google Scholar]
  23. Jiang, Q.O.; Deng, X.Z.; Zhan, J.Y. Impacts of cultivated land conversation on the vegetation carbon storage in the Huang-Huai-Hai Plain. Geogr. Res. 2008, 27, 839–846. [Google Scholar]
  24. Liu, Y.; Zhao, R.Q.; Jiao, S.X. The carbon sources/sinks of land use and their changes in Henan province. Res. Stud. Water Soil Conserv. 2010, 17, 154–157. [Google Scholar]
  25. Sun, Y.J.; Zhang, J.; Han, A.H. Biomass and carbon sequestration of young larch forests in Xingan. J. Ecol. 2007, 27, 1756–1762. [Google Scholar]
  26. Deng, X.Z.; Gibson, J. Improving eco-efficiency for the sustainable agricultural production: A case study in Shandong, China. Technol. Forecast. Soc. 2019, 144, 394–400. [Google Scholar] [CrossRef]
  27. Zhang, D.; Ge, W.; Zhang, Y. Evaluating the vegetation restoration sustainability of ecological projects: A case study of Wuqi County in China. J. Clean. Prod. 2020, 264, 121751. [Google Scholar] [CrossRef]
  28. Houghton, R.A.; House, J.I.; Pongratz, I.; Van Der Werf, G.R.; De Fries, R.S.; Hansen, M.C.; Le Quéré, C.; Ramankutty, N. Carbon emission from land use and land cover change. Biogeosciences 2012, 9, 5125–5142. [Google Scholar] [CrossRef] [Green Version]
  29. Yang, J.; Jin, G.; Huang, X.J.; Chen, K.; Meng, H. How to Measure Urban Land Use Intensity? A Perspective of Multi-Objective Decision in Wuhan Urban Agglomeration, China. Sustainability 2018, 10, 3874. [Google Scholar] [CrossRef] [Green Version]
  30. Zhang, D.; Jia, Q.; Xu, X.; Yao, S.; Chen, H.; Hou, X.; Zhang, J.; Jin, G. Assessing the coordination of ecological and agricultural goals during ecological restoration efforts: A case study of Wuqi County, Northwest China. Land Use Pol. 2019, 82, 550–562. [Google Scholar] [CrossRef]
  31. Chen, G.S.; Tian, H.Q. Land use/cover change effects on carbon cycling in terrestrial ecosystems. Chin. J. Plant Ecol. 2007, 24, 189–204. [Google Scholar]
  32. Zhang, L.; Jin, G.; Wan, Q.; Liu, Y.F.; Wei, X.J. Measurement of ecological land use/cover change and its varying spatiotemporal driving forces by statistical and survival analysis: A case study of Yingkou City, China. Sustainability 2018, 10, 4567. [Google Scholar] [CrossRef] [Green Version]
  33. You, H.Y.; Wu, C.F.; Sheng, P. Carbon emission efficiency of land use and its low carbon optimization: From the perspective of energy consumption. J. Nat. Resour. 2010, 25, 1875–1886. [Google Scholar]
  34. Zhao, Y.B.; Wang, S.J. The relationship between urbanization, economic growth and energy consumption in China: An econometric perspective analysis. Sustainability 2015, 7, 5609–5627. [Google Scholar] [CrossRef] [Green Version]
  35. Fang, C.L.; Wang, S.J.; Li, G.D. Changing urban forms and carbon dioxide emissions in China: A case study of 30 provincial capital cities. Appl. Energy 2015, 158, 519–531. [Google Scholar] [CrossRef]
  36. Zhao, R.Q.; Huang, X.J.; Liu, Y.; Zhong, T.; Ding, M.; Chuai, X. Carbon emission of regional land use and its decomposition analysis: Case study of Nanjing city, China. Chin. Geogr. Sci. 2015, 25, 198–212. [Google Scholar] [CrossRef]
  37. Qu, F.T.; Lu, N.; Feng, S.Y. Impact of land use change on carbon emissions. Chin. Popul. Resour. Environ. 2011, 21, 76–83. [Google Scholar]
  38. Moraes, J.L.; Cerri, C.C.; Melillo, J.M.; Kicklighter, D.; Neill, C.; Skole, D.L.; Steudler, P.A. Soil carbon stocks of the Brazilian Amazon Basin. Soil Sci. Soc. Am. J. 1995, 59, 244–247. [Google Scholar] [CrossRef]
  39. Dixon, R.K.; Brown, S.; Houghton, R.A.; Trexier, M.C.; Wisniewski, J. Carbon pool sand flux of global forest ecosystem. Science 1994, 263, 185–190. [Google Scholar] [CrossRef]
  40. Hutyran, L.R.; Yoon, B.; Hepinstall-Cymerman, J.; Alberti, M. Carbon consequences of land cover change and expansion of urban land: A case study in the Seattle metropolitan region. Landsc. Urban Plan. 2011, 103, 83–93. [Google Scholar] [CrossRef]
  41. Pang, G.X.; Li, L.Q.; Wu, L.S.; Zhang, X. Storage and sequenstration potential of topsoil organic carbon in China’s paddy soils. Glob. Chang. Biol. 2003, 10, 79–92. [Google Scholar]
  42. Li, B.; Zhang, J.X.; Li, H.P. Temporal and spatial characteristics of carbon emissions of agriculture in China and decomposition of influencing factors. Chin. J. Popul. Resour. Environ. 2011, 21, 80–86. [Google Scholar]
  43. Zhang, X.M.; Li, S.F.; Huang, X.J.; Li, Y. Analysis of carbon emission effects and spatial-temporal patterns in Jiangsu Province from 1996 to 2007. Resour. Sci. 2010, 32, 768–775. [Google Scholar]
  44. Sun, H.; Liang, H.M.; Chang, X.L.; Cui, Y.Q.; Tao, Y. Carbon emission and its spatial correlation of land use in China. Econ. Geogr. 2015, 35, 154–162. [Google Scholar]
  45. Sun, X.B. Carbon emission efficiency of land use change in Anhui economic circle. Nat. Res. J. 2012, 27, 394–401. [Google Scholar]
  46. IPCC. IPCC Guidelines for National Greenhouse Gas Inventories, Intergovernmental Panel on Climate Change. 2006. Available online: http://www.ipcc-nggip.iges.or.jp/public/2006gl/chinese/index.html (accessed on 25 September 2020).
  47. Guo, B.S.; He, D.W.; Zhao, X.D.; Zhang, Z.; Dong, Y. Analysis on the spatiotemporal patterns and driving mechanisms of China’s agricultural production efficiency from 2000 to 2015. Phys. Chem. Earth Parts A/B/C 2020, 120, 102909. [Google Scholar] [CrossRef]
  48. People’s Daily. Remember the Important Duty to Establish Beautiful Sichuan. 2017. Available online: http://paper.people.com.cn/rmrb/html/2017-09/05/nw.D110000renmrb_20170905_1-13.htm (accessed on 27 August 2020).
Figure 1. Trends of carbon emissions relating to land use in China from 2006 to 2016.
Land 10 00141 g001
Figure 2. The LISA (Local Indicators of Spatial Association) spatial agglomeration pattern of land use carbon emission intensity in typical years in China: 2006, 2009, 2013, and 2016.
Land 10 00141 g002
Figure 3. The Moran scatter diagram of carbon emission intensity on land use in China in typical years: 2006, 2009, 2013, and 2016.
Land 10 00141 g003
Figure 4. The LISA spatial agglomeration pattern of carbon emissions per capita on land use in typical years in China: 2006, 2009, 2013, and 2016.
Land 10 00141 g004
Figure 5. The Moran scatter diagram of carbon emission per capita on land use in typical years in China: 2006, 2009, 2013, and 2016.
Land 10 00141 g005
Table 1. The global autocorrelation Moran’s I of carbon emission intensity on land use in China from 2006 to 2016.
Item20062007200820092010201120122013201420152016
Moran’s I0.3270.2970.3440.3200.3380.3430.3460.3310.3130.0020.333
Z(I)2.4832.3592.3292.3212.3072.5742.6022.7442.6180.6692.853
Note: Z(I) > 1.96 indicates a significance level of 5%; >2.58 indicates a level of significance at 1%.
Table 2. Transfer path of spatial clusters and outliers for carbon emissions based on land use.
Type2006200920132016
HHXinjiang, Qinghai, GansuGansuXinjiang, Qinghai, GansuQinghai, Gansu
LLGuangdong, Fujian, Jiangxi, Zhejiang, Anhui, Shanghai, ShandongGuangdong, Fujian, Jiangxi, Zhejiang, Anhui, ShanghaiGuangdong, Jiangxi, Zhejiang, Shanghai, ShandongGuangdong, Jiangxi, Zhejiang
HLNoneNoneNoneGuizhou, Shandong
LHSichuan, Beijing, TianjingSichuan, Beijing, Tianjing, HeibeiSichuan, Beijing, TianjingBeijing, Tianjing
Table 3. The global autocorrelation Moran’s I of carbon emissions per capita on land use in China from 2006 to 2016.
Item20062007200820092010201120122013201420152016
Moran’s I0.2750.2700.3120.3020.3140.3150.3180.2960.2810.0230.281
Z(I)2.1441.9712.2012.0052.2142.3842.5142.3292.1580.9732.374
Note: Z(I) > 1.96 indicates a significance level of 5%; >2.58 indicates a level of significance at 1%.
Table 4. Transfer path of spatial clusters and outliers for carbon emissions per capita on land use.
Type2006200920132016
HHHeilongjiang, LiaoningHeilongjiang, Liaoning, Jinlin, NeimengguNoneJiangsu
LLYunnan, Sichuan, HainanYunnan, Sichuan, HainanSichuan, Hainan, Chongqing, GuangdongSichuan, Hainan, Chongqing,
HLNoneNoneNoneShaanxi
LHJilin, Hubei, JiangsuJilin, HubeiJiangsuNone
Publisher’s Note: MDPI stays neutral with regard to jurisdictional claims in published maps and institutional affiliations.

