Article

Establishing Regional Power Sustainability and Feasibility Using Wind Farm Land-Use Optimization

by
Anne A. Gharaibeh
1,*,
Deema A. Al-Shboul
1,
Abdulla M. Al-Rawabdeh
2,3 and
Rasheed A. Jaradat
2
1
Department of City Planning and Design, College of Architecture and Design, Jordan University of Science and Technology, Irbid 22110, Jordan
2
Department of Earth and Environmental Sciences, Yarmouk University, Irbid 21163, Jordan
3
Laboratory of Applied Geoinformatics, Yarmouk University, Irbid 21163, Jordan
*
Author to whom correspondence should be addressed.
Land 2021, 10(5), 442; https://doi.org/10.3390/land10050442
Submission received: 11 February 2021 / Revised: 16 April 2021 / Accepted: 17 April 2021 / Published: 21 April 2021

Abstract

:
Wind-farm planning optimization is important for decision-making concerning regional energy planning in developing countries. This process is governed by restrictions on site selection based on land suitability metric variables, wind turbine technology variables, and land-use governing criteria. This study aims to create a framework for land appropriation strategies for locating optimum sites suitable for wind farms. It is using Jordan as an Area of Interest (AOI), where the scope is to illustrate how this framework will employ wind turbine energy to positively enhance the national Gross Domestic Product (GDP). The methodology employs thirteen GIS thematic layers with a 250-m spatial resolution to substantiate how site-specific criteria, turbine type, and turbine hub height variables are determining factors in the optimal solution. This method involves selecting relevant factors, database construction, data layer generation and preparation, numerical ranking and weighting of each factor, and computation of the potential wind farm locations map by overlaying all the thematic GIS layers. The results showed that the establishment of wind farms would not only meet the AOI’s growing energy needs, rather exceed them to generating income for the developing nation. The results of the feasibility study will boost the national GDP by 3.4%; where, for example, one governorate alone could produce 274.3% of the total required national consumption at a turbine hub height of 50 m. The study attests to a valuable framework that can be implemented elsewhere to establish regional power sustainability and feasibility for other nations. The results show that an added land-use layer indicating the potential value of land in terms of its suitability for establishing wind farms should be considered in future sustainable regional planning studies when considering networks for smart cities, industrial cities, smart agriculture, and new agglomerations.

1. Introduction

Affordable energy resources are the primary motivation for enabling, enhancing, and activating economic forces around the world and are therefore considered key elements for sustainable socio-economic development [1]. In 2020, The International Renewable Energy Agency (IRENA) declared that by the end of 2018, renewable energy accounted for 26% of the total electricity generation (10% from wind). It predicted that this would continue to rise globally to an expected 60% (36% from wind) by 2050 [2].
Sustainable development is now a priority in governments’ agendas where more attention is given to the need for innovative scenarios, coordinated actions, and policies on developing the contributions of renewable energy [3,4]. Therefore, decision-makers must reconsider the methods used to grant energy sustainability, especially in terms of smart cities, industrial cities, smart agriculture, and new agglomerations while preserving agricultural lands and restricting urban growth [5,6]. Governmental plans can no longer separate energy planning from spatial planning [7,8]. The latter is responsible for state space and its use by the community, the stakeholders, and the developers under the umbrella of integrated sectoral policies that promote development and innovative actions [9]. Now, every region should follow a systematic framework for analysis that meets its energy needs from renewable resources [8,10]. An energy planning attempt involves finding a set of sustainable resources at micro and macro levels to optimally meet the energy requirements/demands of all tasks occurring at the centralized or decentralized levels [11,12,13].
Building a road map for renewable energy systems and land-use/landcover classification based on locally available resources at a regional scale will create the right climate that allows communities to find an appropriate framework of living, which provides comfort and welfare in cities. Renewable energy is an essential factor for societies to meet future demands for energy challenges to achieve the desired structure for their lives [14]. Energy is the infrastructure and the main factor for residential, industrial, and commercial activities. Thus, it requires decentralized energy planning approaches that secure wellbeing in both remote and near areas based on renewable energy availability. Land-use/land-cover classification criteria should constitute a renewable energy potential and suitability. It is expected that this new planning system that accounts for renewable energy will support and provide high-efficiency decision-making policies to facilitate sustainable economic growth and create smart cities, industrial cities, new agglomerations, smart agriculture, and a new communication network [11,15,16].

1.1. The Importance of Renewable Energy

Due to the environmental impacts of non-renewable energy and limited reserves, renewable energy is increasingly approached as an essential solution. There are several options for the type of renewable energy; however, determining factors such as environmental impacts, cleanliness, cost, stability, and efficiency also play a role in determining the type of energy [17,18,19]. The most appealing criterion in renewable energy is its reliable and stable supply of clean and environmentally friendly energy [17,18]. The use of renewable energy becomes more important in countries with a limited-to-no supply of local fossil fuels. Consequently, importing fossil fuels in large quantities for supplying everyday energy needs becomes prohibitive for citizens also required to purchase their daily food and needed services.
Renewable energy costs are dependent on the cost of infrastructure and maintenance fees [17,18]. Thus, it is independent of international fluctuations in fossil fuel prices [17,18]. Because of improving technologies and increased competition between supply providers, the cost of energy derived from wind, solar, biomass, and geothermal sources is declining [17,18].
It has been shown that income, energy use, economic growth, and human quality of life are positively correlated [20]. Therefore, the nature of renewable energy can lead to improvements in economic growth and sustainable development, which in most cases, can lead to increased income and better life quality [19]. The more the economy grows, the more demand is placed on energy. Especially in developing countries with limited resources, to sustain economic growth, it is also advantageous that energy be renewable [17,18,19]. Renewable, clean energy can grant opportunities for income generation, improved services, and improved agriculture. Decision-makers often encourage the use of renewable energy by providing tax cuts and flexible investment strategies for individuals and business entrepreneurs [19,21]. Despite the availability of fossil fuels, many countries such as Iran made efforts to reduce tariffs on wind energy and increase the prices of fossil fuels and electricity made depending on it to encourage the use of wind energy [22]. In the end, energy is essential for development where lower and stable renewable energy prices can help to create a more feasible business, thus providing more job opportunities and more capital, especially in developing countries [17,18,19].
Based on the global changes the world has witnessed, especially after the spread of the global pandemic of COVID-19, many cities have been isolated from each other. The pandemic has shown the urgent need to make energy readily available at remote sites and to create self-sufficient urban agglomerations [23]. Available energy will prevent the migration of people to major cities, thus complying with the new concept of spatial distancing. In many land-locked developing countries, urban agglomeration leads to urban sprawl, which is often concentrated on agricultural lands. They also suffer increased unemployment. Other remote places with less rainfall are not urbanized due to the inability to succeed in agricultural projects. By providing energy to remote places, we can protect agricultural lands that grant our food security thus, preserving fertile lands in rain-fed areas to protect them from urban sprawl [10,15,16]. The remote places (if equipped with renewable, cost-efficient energy) can house other investments, smart projects, and manufacturing facilities that can create job opportunities for the growing population. Especially in developing countries, policies that are made to sustain access to renewable energy are a major energy goal. This access to energy in rural and remote areas will ensure the protection of existing agricultural lands and allow the reclamation of less valuable lands by providing water for irrigation, establishing agricultural economic projects, and providing a protected climate for these crops. In the end, the goal is achieved by granting food sufficiency [24].

1.2. Wind Energy

Due to the enhanced technologies of wind turbines, wind energy is now more feasible than ever and is used widely offshore and inland around the world [17,19]. There are several opportunities with wind energy, such as socioeconomic development, accessibility of energy in remote places, and reliable energy security [19]. Wind energy projects are now intercountry cooperative establishments. For example, America is benefiting from Canadian wind projects, which support energy use in large cities such as New York [25,26]. The North Sea region energy project for 2050 is another example of intercountry cooperation that is expected to cover about 89% of the required electricity for England, Belgium, the Netherlands, Denmark, and Norway [27].
One key aspect of the availability of wind energy is the role of technological development in making this a sustainable solution. In other words, if there are no technological investments (mega-projects) in agriculture, manufacturing, technology, and services, the use of wind energy for housing alone is not feasible. Especially, when we want to develop the economy in a new region, technological development plans must precede the renewable energy projects [28]. If a remote region has a great potential for generating wind energy, it is then an important opportunity to create the type of technological mega-projects that will benefit from the energy infrastructure in that place. This idea is novel, especially when many are suffering unemployment and when the urban areas are sprawling onto the agricultural lands, such as the case of Jordan, Egypt, Syria, Iraq, and Sudan. It becomes a necessity to draw some of the population seeking job opportunities to other potential places. This will protect agricultural lands for future generations and create opportunities for manufacturing in other remote places where energy is affordable and making the investments feasible.
According to the World Wind Energy Association (WWEA) (2019) [29], wind power capacity around the world had reached 597 GW by the end of 2018, identifying China and the United States of America as leading countries with an accumulated wind capacity of 221 GW and 100 GW, respectively [30,31]. According to the WWEA, all wind turbines installed by the end of 2018 provided around 6% of the global electricity demand [29]. Swedish Wind Energy Association is targeting 100% renewable electricity by 2040 through wind power to combat climate change and improve competitiveness [32].
Because of its reliability, resilience, feasibility, and affordability, wind energy is one of the most commonly harvested renewable energy sources [22,33]. Selecting the best location for wind farms requires an examination of its environmental, social, economic, and technical limitations with variable methodologies [22,34,35]. It is the role of policies to balance between the needs of national goals and their environmental concerns [36]. Restrictions affecting potential wind turbine sites include low wind speed and land-use/land-cover limitations (i.e., urban areas, protected areas, and areas far from energy-consuming urban agglomerations) [34,37,38,39].
A critical challenge is to reinvent a comprehensive planning system to achieve sustainable energy-balanced regions [40]. Land suitability studies concentrating on finding proper lands for renewable energy production will reduce the gap between planning policies and renewable energy planning [40,41]. Geographic Information System (GIS) is one of the methods for identifying site suitability; thus, it is an essential tool for spatial planning (it is a comprehensive approach and geographical expression to the economic, social, cultural, and ecological policies of society. It aims to balance regional development and the physical organization of space according to an overall strategy) and management of renewable energy landscapes, such as wind farms. GIS-based approaches can help in minimizing errors by identifying the suitability of AOI through manipulating a combination of digital thematic maps and attribute data variables [42,43]. For example, Noorollahi, et al., (2016) [22] employed a Weighted Index Overlay (WIO) method using a GIS modeling approach with a Multi-Criteria Decision Making (MCDM) support system to determine potential locations for wind farms in Markazi Province, Iran.
Many variables are defined and judged by setting different criteria that are considered throughout restriction and suitability phases [22,44]. Noorollahi et al. (2016) [22] considered a group of criteria through two phases. The first employed restrictive criteria (residential areas, airports, ancient and cultural monuments, rivers, coastlines and wetlands, environmental protected areas, lakes and water bodies, faults, digital elevation model, and slope) [22]. The second employed suitability criteria (wind speed, electrical power lines, highway, roads, and railway) [22]. Similarly, Haaren and Fthenakis (2011) [45] define three stages to select the most feasible wind turbine sites in New York State, USA [45]. They identified geological constraints, cost value, and ecological impacts [45]. Other studies adopt climatic, socioeconomic, environmental, and geological variables to locate suitable sites for wind farms [45,46,47]. Some consider the economic feasibility aspect one of the most important optimization factors used to identify the locations of wind farms [38,45]. It is logical to say that wind turbines are best located in areas where wind energy can be harvested efficiently. However, if these optimal locations are remote, planning for development and investment projects should take place before the wind farms are installed, or it would be difficult to transport energy from such locations [28].
There are disparities among studies, each selecting different variables/criteria to find suitable locations for wind farms. This is usually based on their objectives, existing constraints, data availability, and identified most suitable turbine hub heights: 50 m [46,48,49], 80 m [22,38,49], and 100 m [49,50].
This study, however, adopts a comprehensive set of variables, including land-use/landcover, road network, electrical power lines grid, digital elevation model (slope and aspect), wind speed, and wind power density data at different heights. These variables are obtained spatially from GIS national records and are divided into two parts: restrictive and classifying layers. The primary difference between this study and existing studies is that this research utilizes nationwide wind power and wind energy maps that cover the whole geographic area instead of taking specific meteorological readings, which are limited to a few locations across the AOI [51]. The wind data is obtained from Global Wind Atlas to provide a more comprehensive data approach for developing countries that lack actual wind-related measurements and readings [52]. This research offers a spatial resolution of 250 m (which is high on a regional scale), thus increasing the accuracy when analyzing the AOI. Sites are selected based on feasibility through a cost-revenue optimization and energy production scenario using the available wind speed and wind power density at different heights (50 m, 100 m, 200 m) from Global Wind Atlas. Finally, due to the common seismic activities in the region, this research is adding earthquake potential hazard map criterion to the variables influencing the selection of wind farm suitable sites. The process will develop a framework that can be implemented in other places in the world.

1.3. Area of Interest (AOI)

Jordan is located between Asia and Africa and is considered a central transit area that plays a key role in linking electricity, gas, and oil networks between continents. Its 2020 estimated population of 10.1 million consists of 69.6% of residents and a staggering 30.4% of regional post-war refugees and immigrants [53]. Jordan has three main territorial regions with four governorates each: the Northern (Irbid, Ajloun, Jerash, and Mafraq) with an overall population of 2.73 million; the Central (Balqa, Amman, Madaba, and Zarqa) with an overall population of 6.053 million; and, the Southern region (Karak, Tafielah, Ma’an, and Aqaba) with an overall population of 0.75 million [53] (Figure 1). Jordan’s difference in elevation ranges from 430 m below sea level to 1754 m above sea level. This elevation difference (2184 m) is a positive factor for wind energy generation in most regions because it works to change the air pressure from one region to another. Thus, the flow of winds at various speeds and densities [54].
In recent years, Jordan has developed many policies and regulations to encourage renewable energy projects (wind, solar, and biomass) as a source of electricity generation. As an incentive, all renewable energy projects are of renewable energy are exempt from duties and taxes. Jordan has made several preparations to invest approximately $14–18 billion in renewable energy projects to address unavoidable rises in international oil prices, to reduce traditional fossil fuel energy consumption, and to face growth of energy demand and degradation in the natural environment [55].

1.4. Energy Situation in Jordan

According to The Statistical Review of World Energy (2020), fossil fuels are still the main energy source which supplies 84% of world energy [56]. In 2019 the growth consumption slowed by (+0.6%) compared to an average of 2%/year over the period between 2000 and 2018 due to the slower economic growth [56,57]. Jordan is no exception, where it has one of the most imported fossil fuel-dependent countries in the world in 2017 [58]. Eighty-nine to ninety-three percent of the country’s energy needs are met by oil and natural gas imports [59,60]. The remainder (7–11%) is supplied by renewable energy [59]. In 2018, foreign oil imports accounted for $3426 million USD (8.5% of total GDP of $40 billion USD) [61]. Furthermore, from 2001 and 2019, Jordan’s public debt has increased at an average annual rate of 9% [62]. The last three years had a rate of 11.8%. Besides the debt, the GDP growth rates continued to decline from 3.8% in 2011 to 1.8% in 2019 [63]. National Energy Strategy for 2007–2020 was created to select new projects to boost reliance on local energy sources from 4% to 40% by the end of the decade [55]. By establishing wind turbine farms, Jordan will thus be able to secure long-term energy by reducing its dependence on energy imports, meeting the growing demand for energy, securing long-term energy supplies, and avoiding the exploitation of the geography and climate of the region.

2. Methodology and Criteria Evaluation

This study investigates regional energy planning strategies using GIS to identify the most suitable areas for establishing wind turbine farms in Jordan. This methodology was divided into two stages. The first stage applied a restrictive method. At this stage, all unsuitable areas were excluded from the study. In the second stage, a classifying analytical method was applied to define the most suitable areas for harvesting wind energy at three different hub height scenarios: 50 m, 100 m, and 200 m. The analysis compared scenarios with each other to determine feasibility. It employed a systematic approach for regional spatial planning.
Many criteria help in determining the most appropriate location for wind farms. This study maps the most suitable areas for establishing wind farms by identifying the different suitability criteria used, calculating and applying the influence/weight of each criterion in the study based on Analytical Hierarchy Process (AHP) [64], and developing a GIS-based model to determine site suitability for the study area. Appendix A has the top-weighted criteria that had a very strong impact on the study. The study divided the previously identified criteria from the literature into four categories: economic, technical, environmental, and social [22,46,47,49,50,57,65]. The weights of each criterion were determined based on AHP method and compared with average weights from several literature sources [22,35,47,66] to give the final relative weighted scores.
The economic aspect affects the choices for suitable wind farm sites depending on site complexity and infrastructure costs in addition to the extreme energy production requirements. Therefore, site-specific criteria such as slope, aspect, distance to roads/railway, distance to airports, and proximity to the power grid are important variables [38,45]. These variables help in minimizing capital and operating costs when finding suitable sites for wind farms, thus making the project more feasible and accessible for investors.
Technical criteria consist of analyzing wind conditions which are the most important determinants for selecting wind farm locations to maximize energy production and minimize risk. They include the average wind speed, wind power density, proximity to the power grid, minimum turbine spacing, turbine size, and proximity to potential earthquake hazards [22,39,46,48,49,65]. Other technical factors will not be considered in this study, such as the wind park effect (this is the effect of aligning the wind turbines where each wind turbine will potentially reduce the speed of the wind behind it because of the wake effect [67,68]. Thus, aligning them at close distances will slow down the wind received by the next turbine in line along the prevailing wind direction.), air density, site-specific conditions, foundation material, and turbine design [69,70,71]. These factors are more site-specific at a micro-scale which is not the focus of this study. Environmental criteria determine certain restrictions such as proximity to environmental reserves, water bodies, forests, and quarry lands which affect water quality, biodiversity, and landscape/seascape [45,47]. Environmental reserves, archaeological sites, urban areas, forests, water bodies, quarries, and airports are excluded from the suitability including a buffer surrounding each location. Current micro-scale onsite vegetation, wildlife biodiversity, and other aesthetic values are not considered in this study due to the macro scale of this study.
Lastly, social criteria are one of the most critical considerations to address when locating wind farms because they affect national economic growth, ensure comprehensive advancement, and protect economic prosperity to boost urban living standards. To ensure the stable and efficient operation of wind power generation, the social capital that may be impacted by the proposed development should be identified and studied. Consequently, residential areas are defined and buffered (with a buffer parameter of 2000 m) to avoid and/or mitigate the impact of wind farms on the local population. Shadow flicker, noise, and visual impact are examples of specific issues that matter to the urban areas. To support public health and other social issues for each chosen wind farm, each may need a stand-alone dedicated micro study [72,73].

2.1. Preparation of Land Suitability Data

After determining the influential criteria, several map layers concerning the study area have been collected and digitized to address each criterion. Appendix B identifies data sources for each layer using ESRI ArcGIS software. All layered data was projected to a Universal Transverse Mercator (UTM) coordinate system WGS_1984_UTM_Zone_36N. Data layers had a standard 250 m spatial resolution.
A digital elevation model was integrated into the GIS to obtain slope (Figure 2a) and aspect (Figure 2b) maps. Wind speed and wind power density are illustrated at three hub heights 50 m (Figure 2c,f); 100 m (Figure 2d,g); and 200 m (Figure 2e,h). The study selected new classification layers for land-use/landcover, including forest, urban areas, quarries, and water bodies (Figure 2i) [74].
Utilizing the GIS OpenStreetMap (OSM), reserve layers were digitized and buffered by following polygons of preservation locations (Figure 3i). Similarly, airport location information was digitized and buffered (Figure 3j,k). The Euclidean distance function was processed for the road map layer, railway layer, and electrical power lines (Figure 2j–l).
The different classes of thematic layers of slope map (Figure 3a), aspect map (Figure 3b), wind speed map, and wind power density at three hub heights were assigned rating values corresponding to their relative contribution for selecting the best location for wind farms: 50 m (Figure 3c,f), 100 m (Figure 3d,g), and 200 m (Figure 3e,h). Then the road map layer (Figure 3k), railway layer (Figure 3l), electrical power lines layer (Figure 3m), and potential earthquake hazard layer (Figure 3n) [75].

2.2. Determination of Suitability Score and Weight Values

To determine the Suitability scores and weight values for the geographic location criterion, the researchers established standardized categories of suitability using a five-level ordinal scale including very high, high, moderate, low, and not suitable for each factor.
To achieve this, the study utilized a protocol of three stages incorporating multiple digital data layers for a wind farm suitability analysis. Stage one (i.e., restrictive method) excluding both restricted areas and their buffers in land-use/landcover criteria (environmental reserves, archaeological sites, urban areas, forests, water bodies, quarries, and commercial and military airports) (Table 1). In stage two (i.e., classifying analytical method) the suitability score values (rating values) for each geographic location within the single criterion (i.e., proximity to main roads and railway, proximity to main electrical power lines, slope, aspect, wind speed, wind power density, and proximity to faults as potential earthquake hazard locations) were determined based on an ordinal scale between 1 and 5 (Table 2). The classification considered 5 as most suitable and 1 as least suitable, and the 0 score value was considered as not suitable.

2.3. Determination of Suitability Score and Weight Values

In the third stage, the weight value for each criterion was calculated using AHP analysis and its pairwise matrix. AHP analysis is one of the most powerful and common multi-criteria decision-making tools in various fields of economics, politics, planning, and engineering [76]. It makes a hierarchical structure to classify and select alternatives by pairwise comparison of criteria to calculate the weight influence [77]. The pairwise matrix represents a theoretically founded approach to computing weights representing the relative importance of criteria.
Once the spatial distribution maps of the score values are generated for each criterion, the suitability map for wind farms was generated through an index overlay procedure using Equation (1). Each output raster cell is the sum of the weighted products for each corresponding cell factor which is produced using GIS overlay tool function.
S = i = 1 n w i k i
where: S—suitability score, wi—weight for each criterion i = 1, 2, …, n, ki—value for each pixel in the raster criterion map i = 1, 2, …, n, n—number of criteria.

3. Results

The results section will report the findings of suitability based on turbine hub height, then based on the geographic region. In each case, high suitability to low suitability is reported while indicating the sum of areas for each category. This section will proceed by providing a feasibility study based on the results. Further feasibility will be applied to the northern region to calculate the actual benefits of this study.

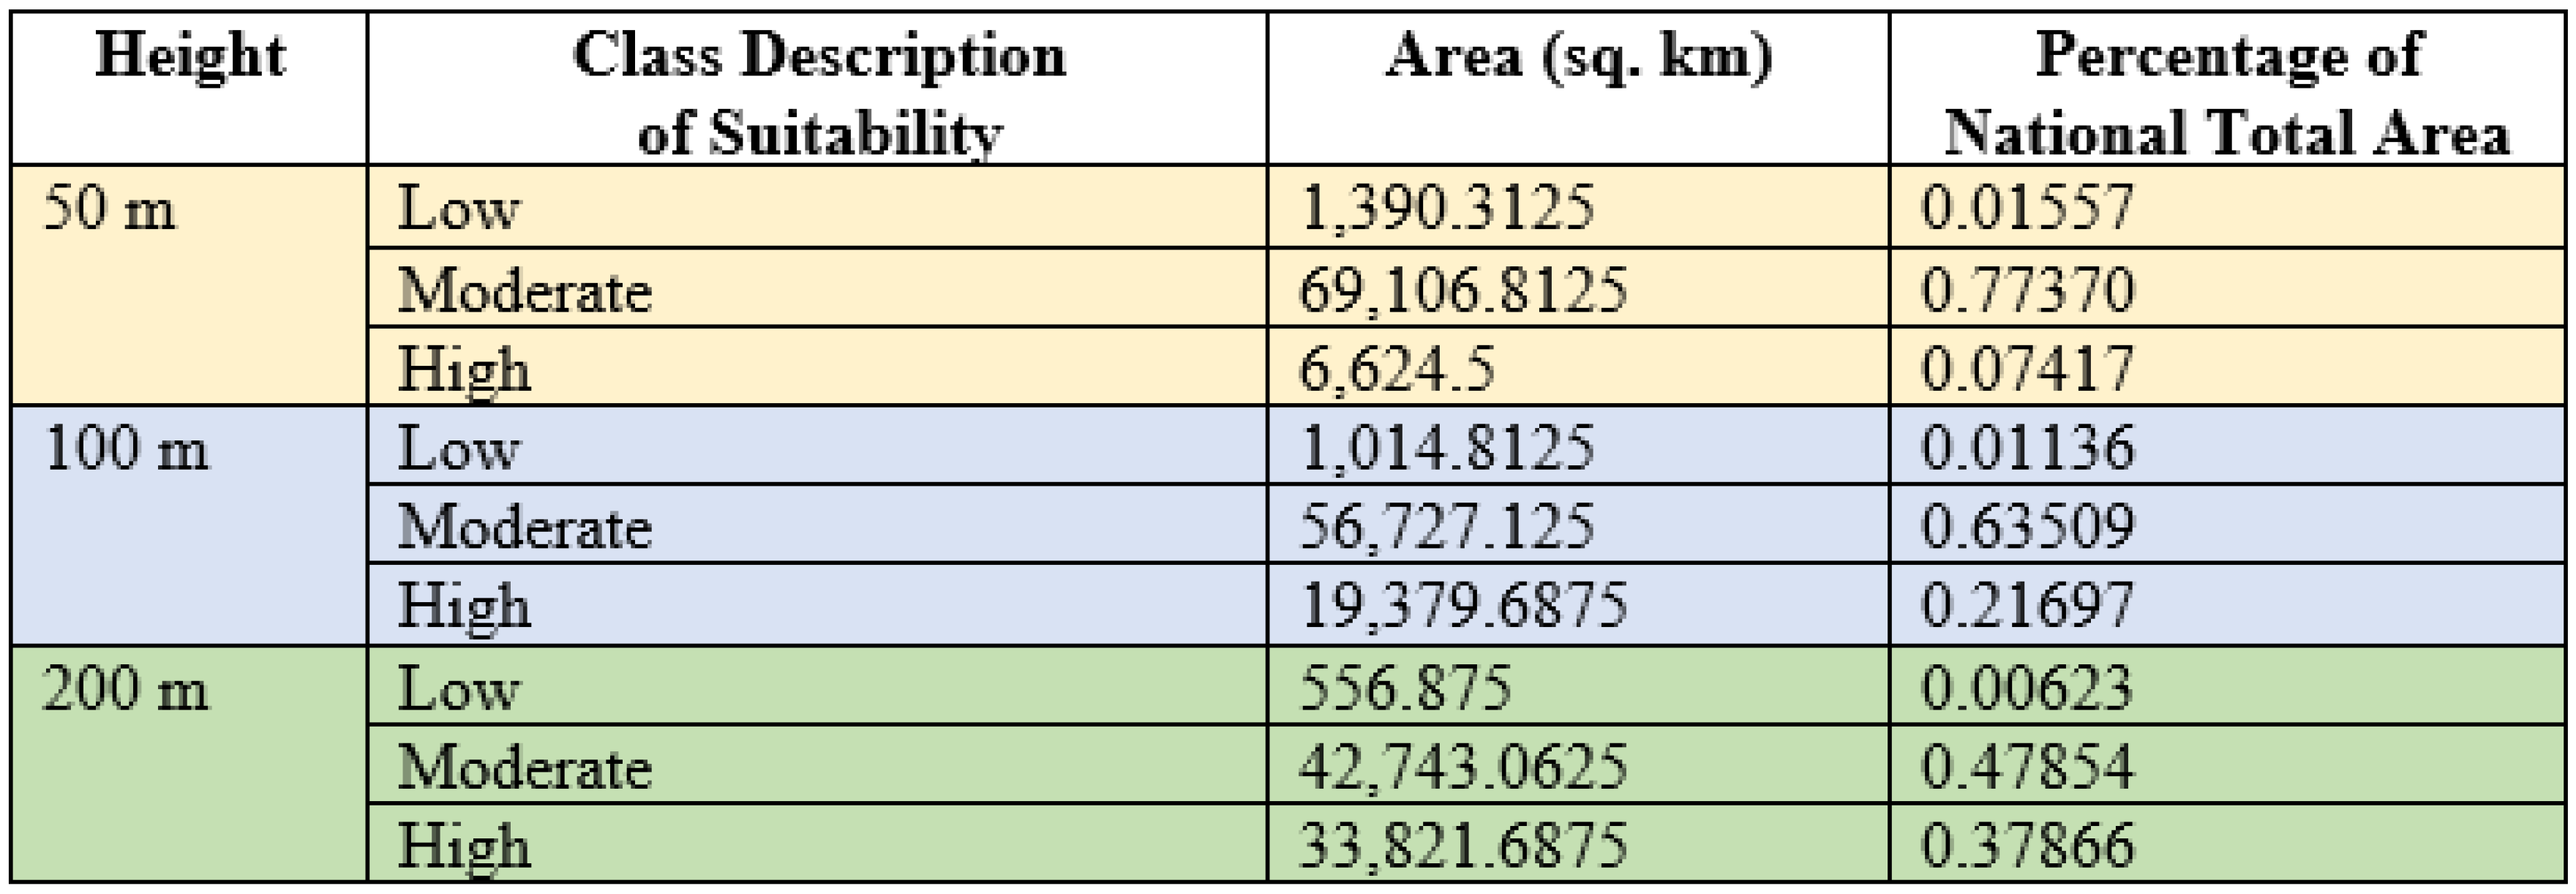
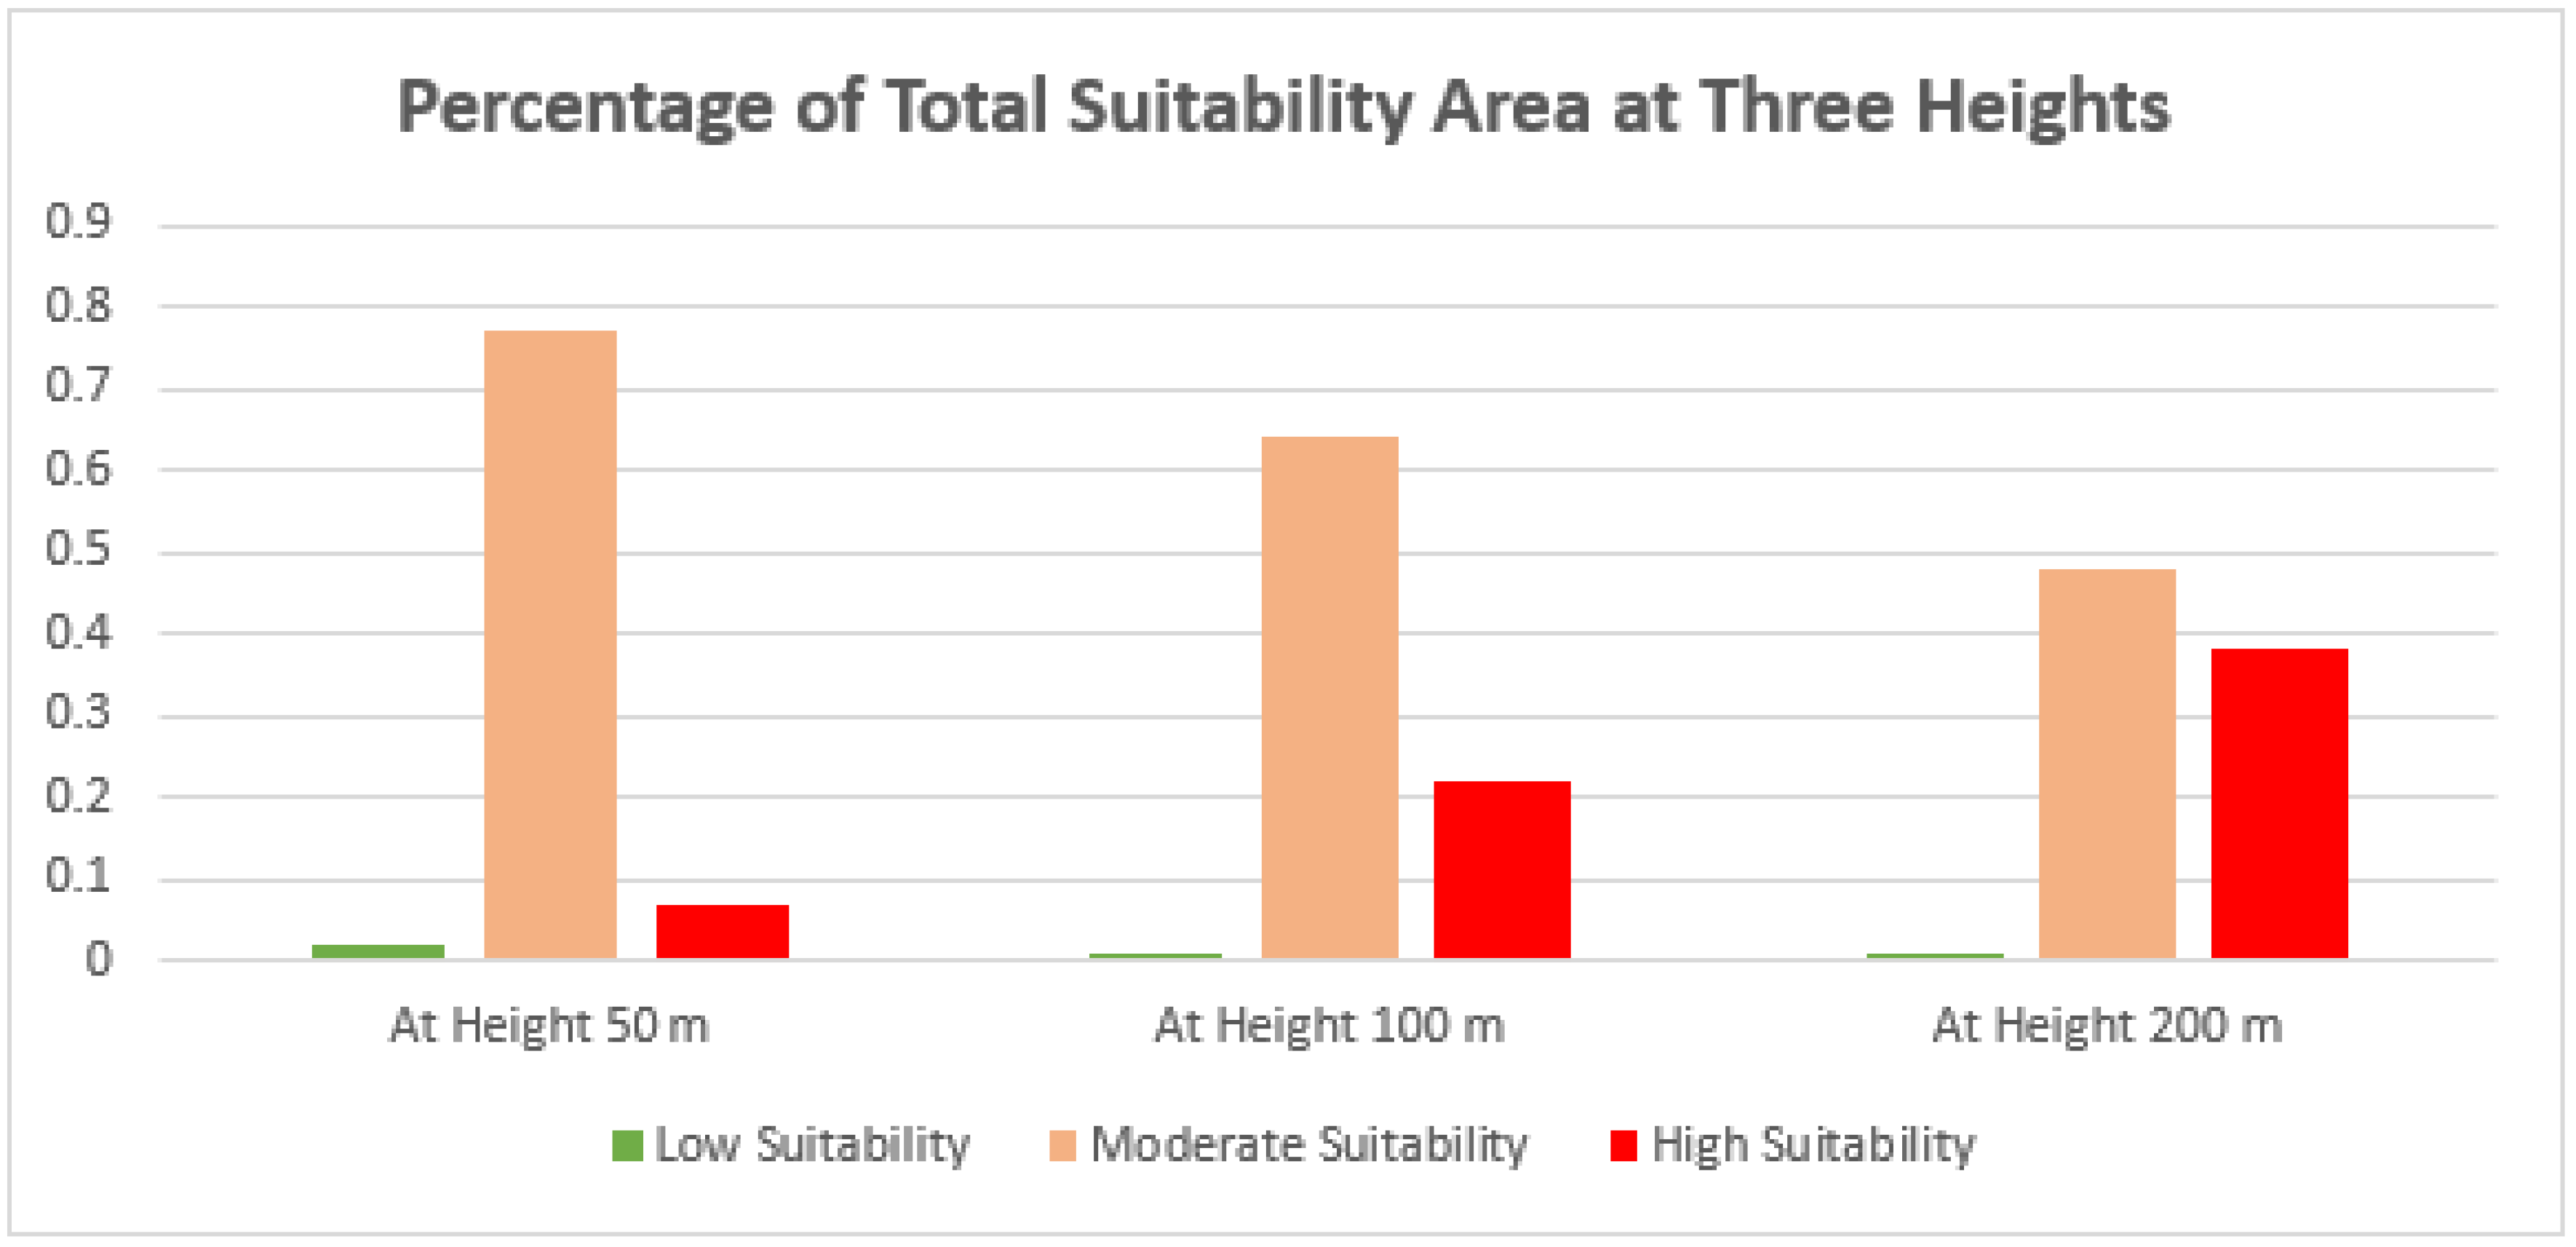
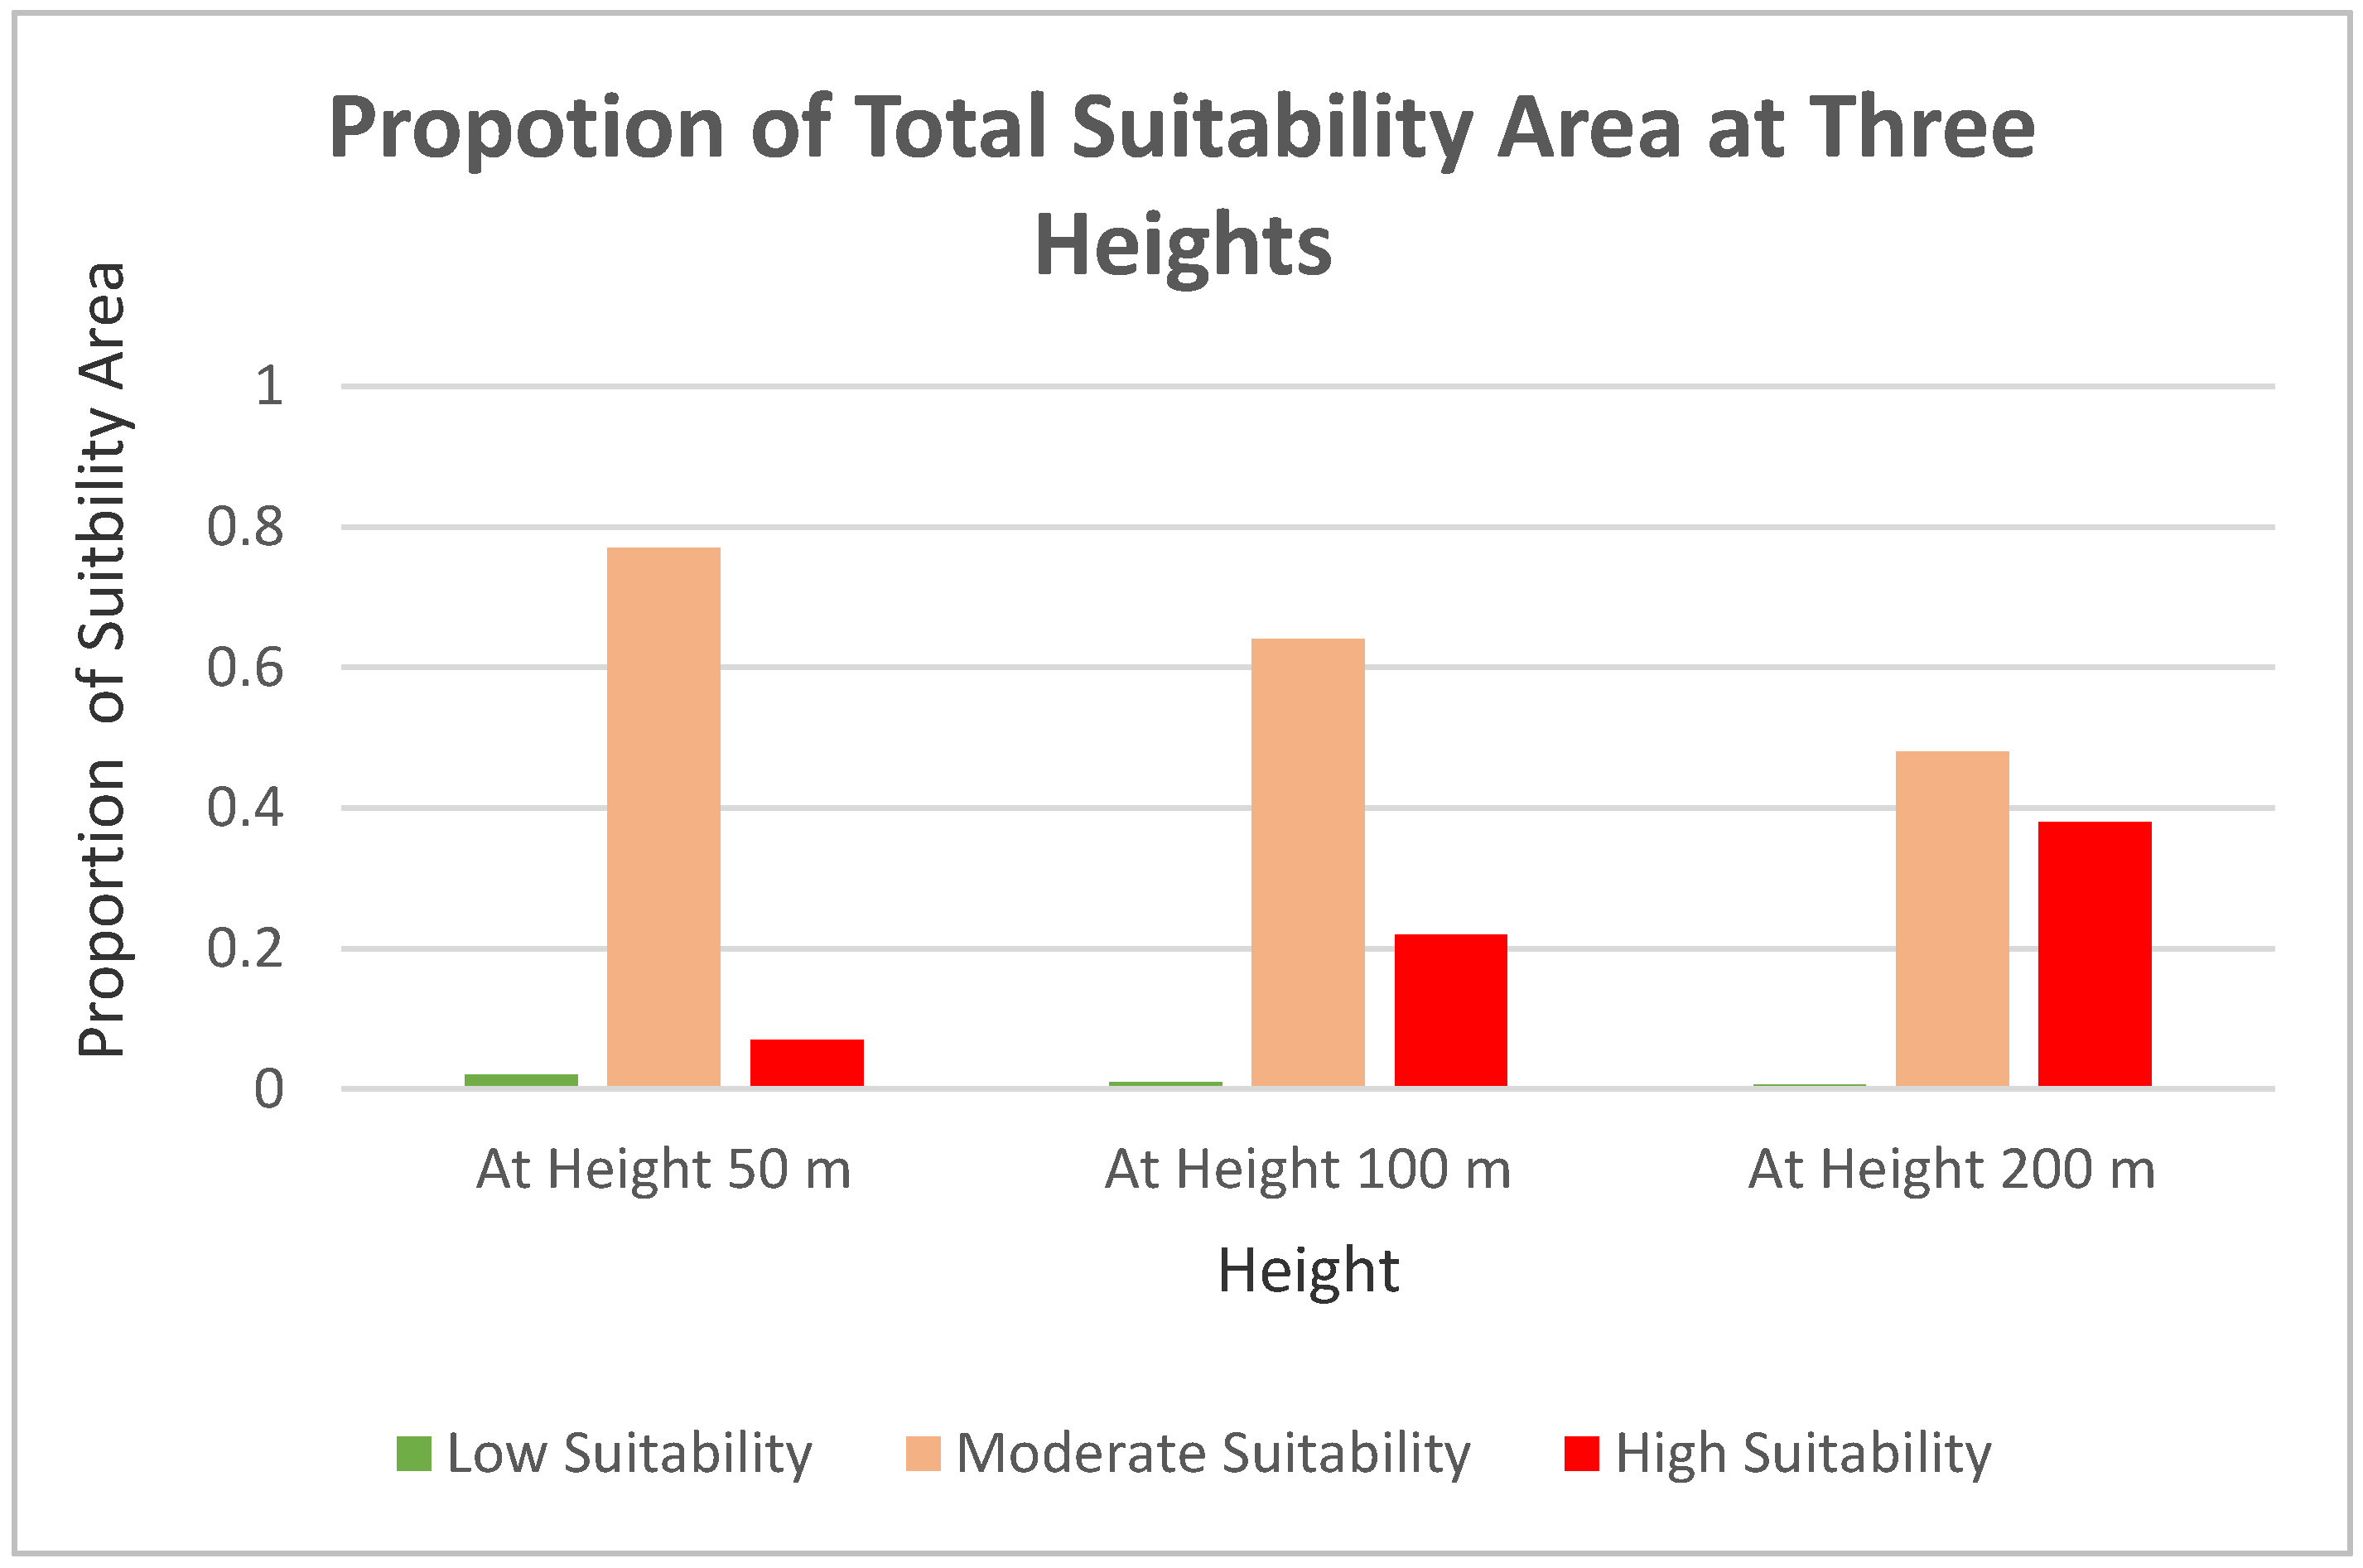
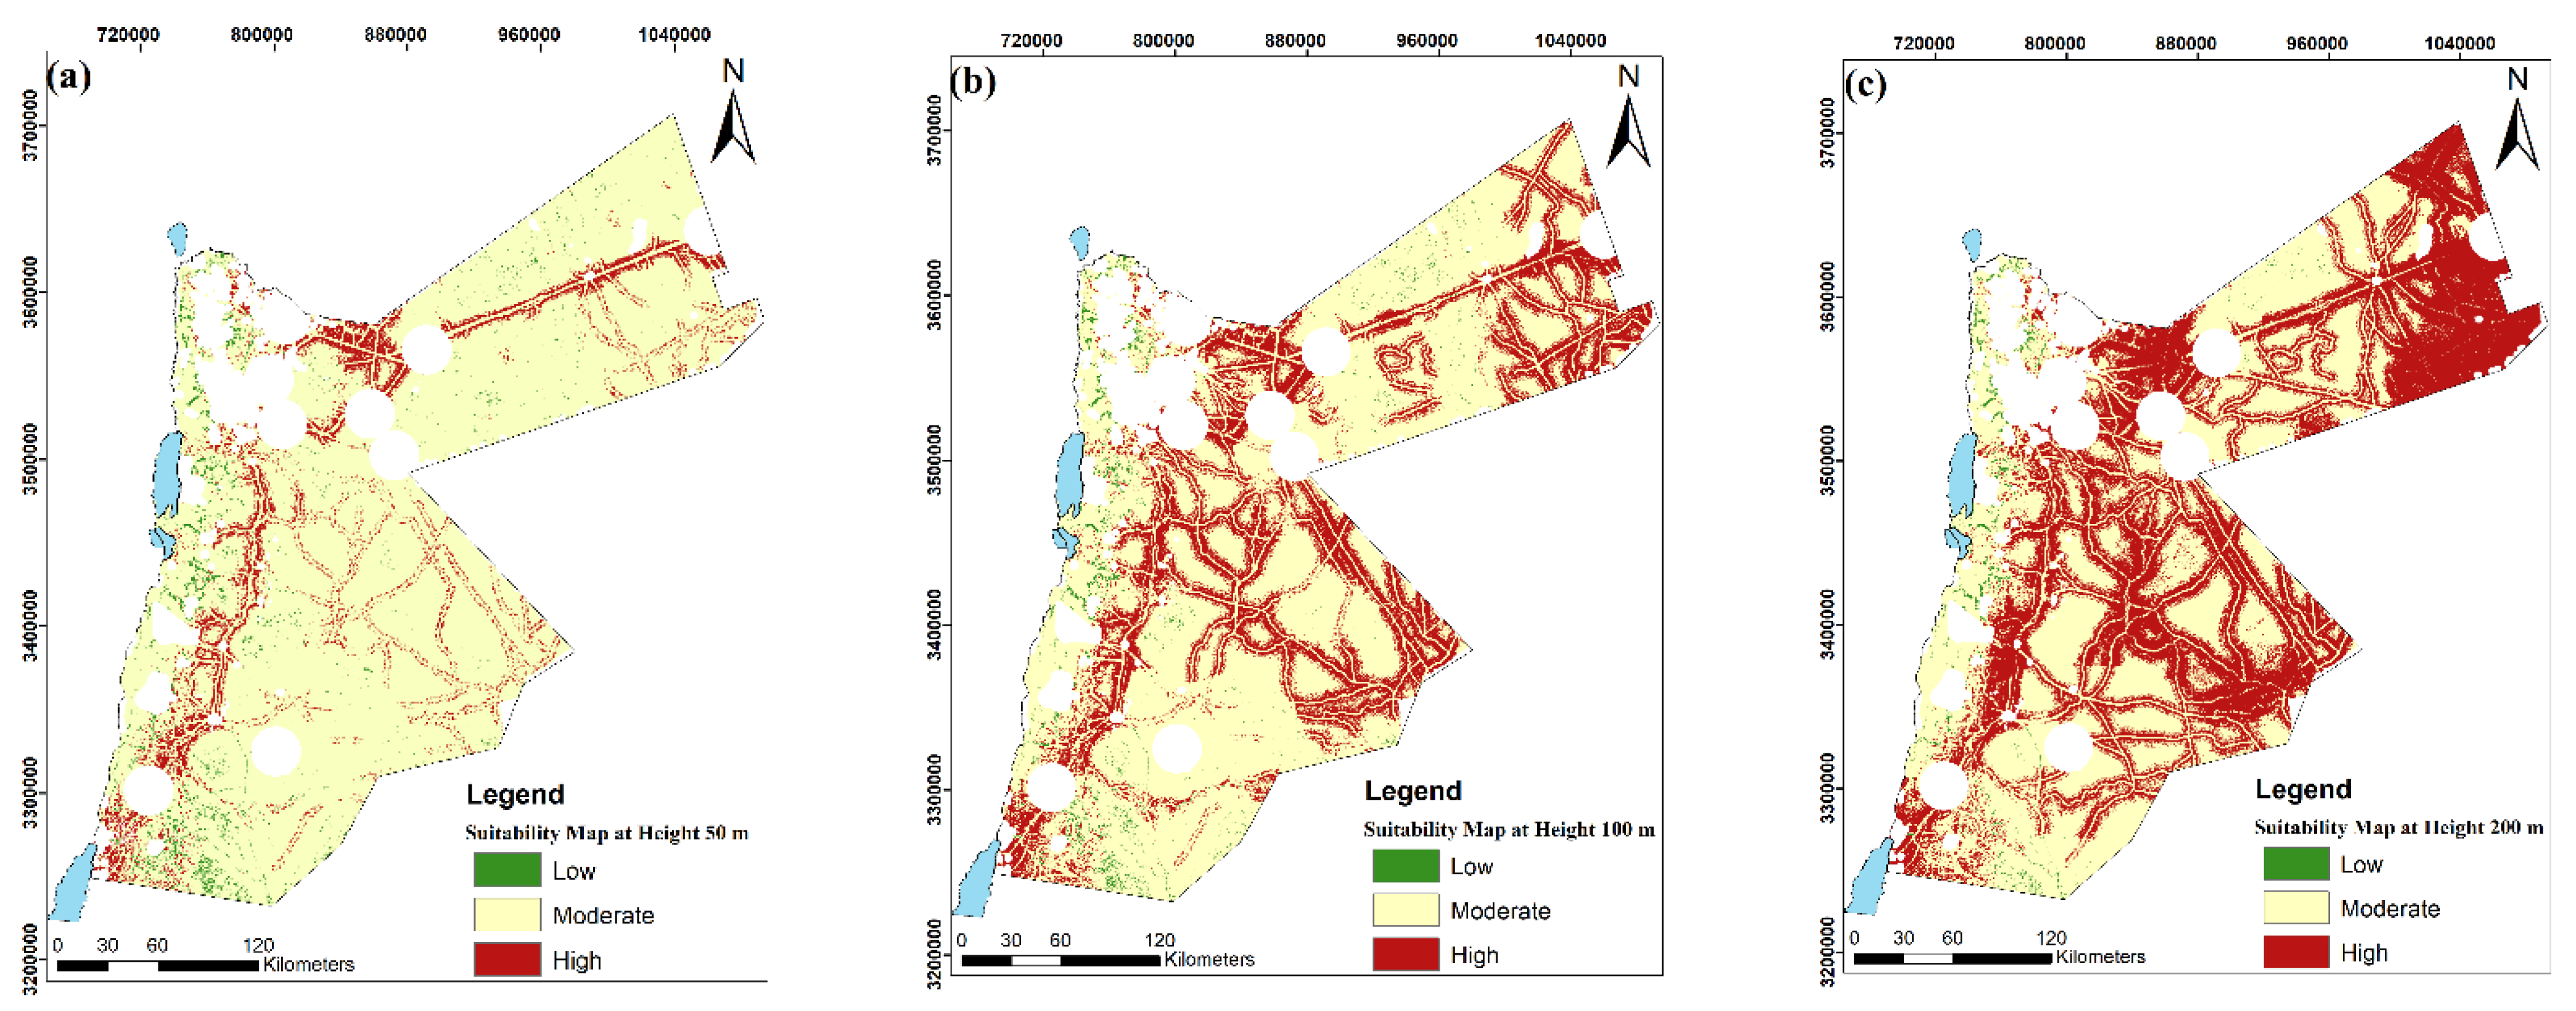
3.1. Land Suitability Results Based on Turbine Hub Height

National suitability maps are produced at three potential turbine hub heights: 50 m, 100 m, and 200 m (Figure 4 and Figure 5). The turbine hub heights are chosen due to the availability of maps for wind speeds and wind power density at these heights as obtained from Global Wind Atlas. Although commercial turbines are typically installed at a height of 80 m in most parts of the United States and the United Kingdom, a recent study by the National Renewable Energy Laboratory (2019) found that in 70% to 90% of locations (depending on the specific turbine configuration) in the United States, the more cost-effective option is to strive for 160 m hub heights [78].
It is found more common to use 75–134 m in the Middle East region [79]. For example, as established in Shobak at the south of Jordan, the turbine hub height was erected at 137 m on a land elevation of 1643 m above sea level [80,81]. In another project in Shobak, the turbine Tip Height of 180 m which include the turbine hub height was 112 m and a blade length of 68 m [82]. Depending on a variety of factors, including hub height, most suitable areas have a greater potential to generate electricity, while less suitable areas have a lower potential to generate electricity (Figure 5).
At a 50 m height, the total area identified with high suitability is 6624.5 km2 constituting 0.07 of the 89,342 km2 of the national area in Jordan; moderate suitability is 69,106.8 km2 constituting 0.77 of the national area; and low suitability is 1390.3 km2 constituting 0.02 of the national area (Appendix C and Appendix D).
Likewise, at 100 m height, high suitability is 19,379.7 km2 constituting 0.22 of the national area; moderate suitability is 56,727.1 km2 constituting 0.64; low suitability is 1014.8 km2 constituting 0.01 of the entire area of Jordan (Appendix C and Appendix D).
At 200 m height: high suitability is 33,821.7 km2, which constitutes 0.39 of the national area; moderate suitability is 42,743.1 km2, constituting 0.48 of the national area; and low suitability is 556.9 km2, constituting 0.01 of Jordan’s national area (Appendix C and Appendix D).
The highest percentage of the low and moderate suitability was at a height of 50 m, with a regarded area of 1390.3 km2, and 69,106.8 km2, respectively. For the high suitability class, the highest percentage was at a height of 200 m, with a regarded area of 33,821.7 km2 (Figure 4).

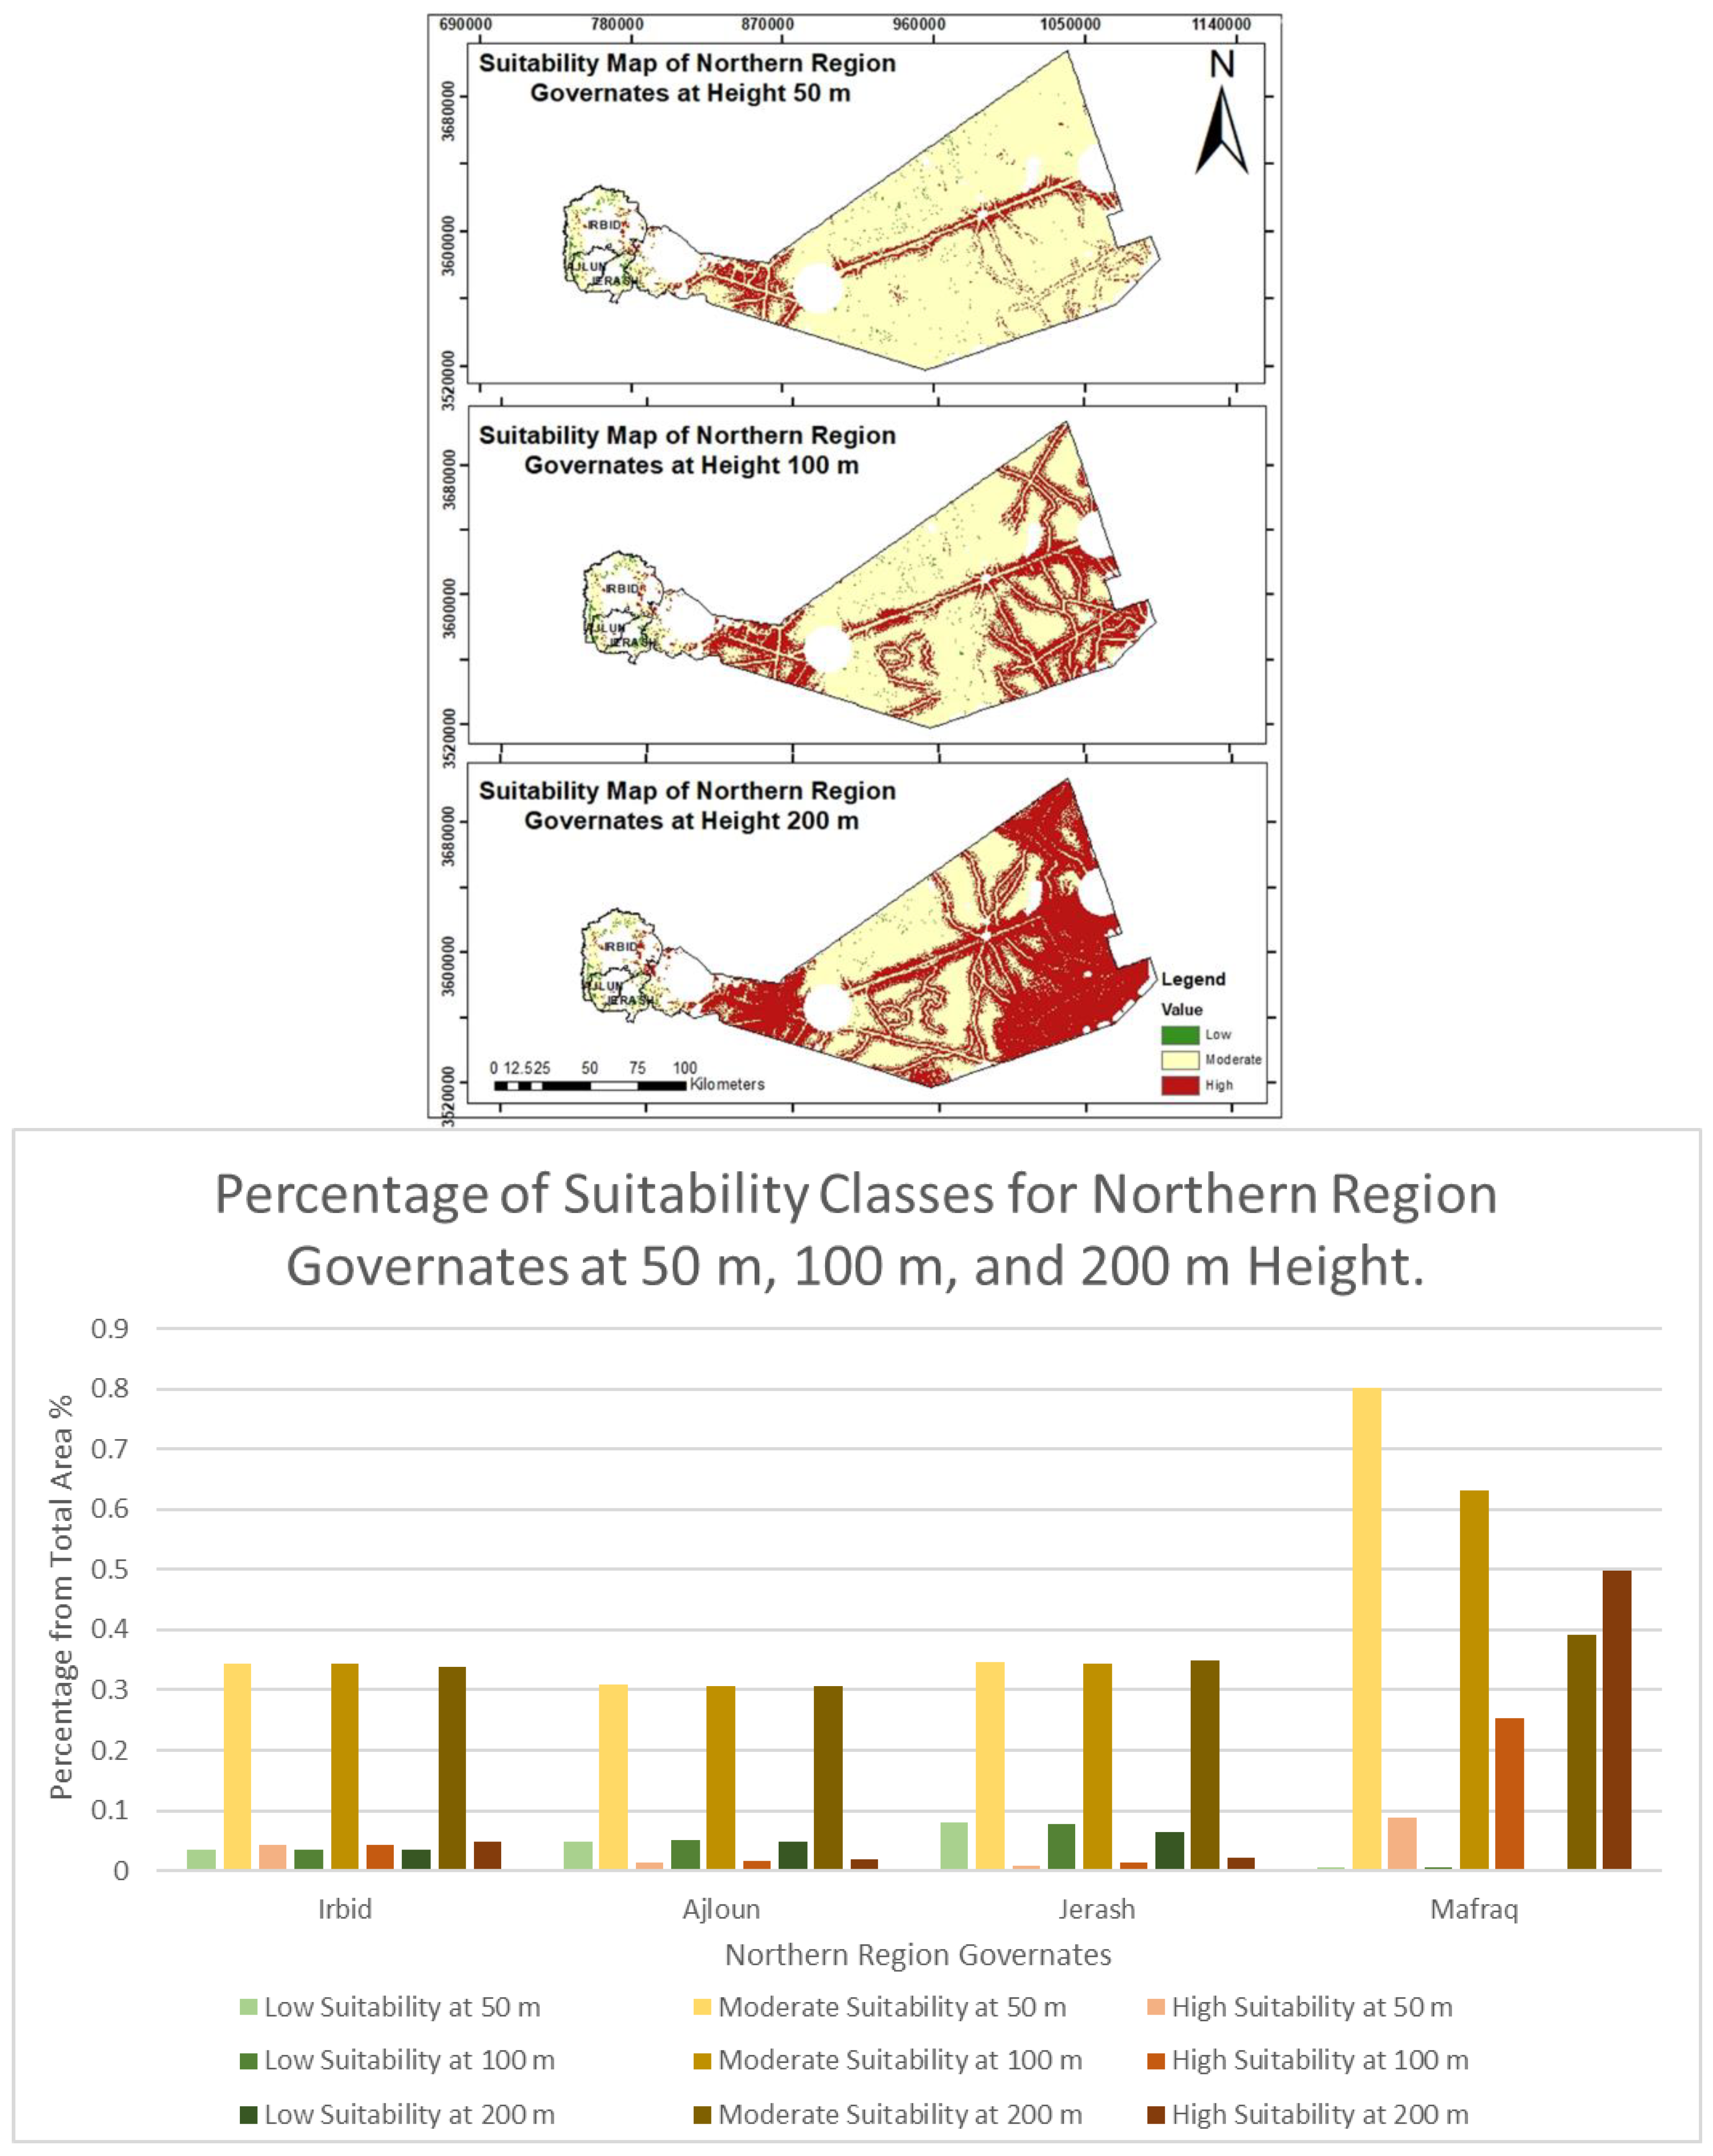
3.2. Findings Identified by Region

The following three sections will demonstrate the findings of each region concerning wind farm suitability areas associated with the different wind turbine heights. It includes the Northern, Middle, and Southern Regions.

3.2.1. Northern Region

At a height of 50 m, areas with high suitability in the Northern Region make up a total area of 2424.3 km2. Individual governorates within the region have the following high suitability shares: Mafraq (2346.0 km2), Irbid (65.8 km2), Ajloun (5.4 km2), and Jerash (4.1 km2).
At a height of 100 m, areas with high suitability total 6846.6 km2 with individual governorate shares as follows: Mafraq (6768.2 km2), Irbid (66.1 km2), Ajloun (7.25 km2), and Jerash (5.1 km2). Most suitable areas are increased by 2.8 fold when increasing wind turbine height from 50 m to 100 m.
At a height of 200 m, areas with high suitability total 13,345.3 km2. Governorate shares include Mafraq (13,251.8 km2), Irbid (76.5 km2), Jerash (9.4 km2), and Ajloun (7.6 km2). Most suitable areas increased 2-fold when increasing the height from 100 m to 200 m.
When reviewing all areas with the highest suitability, Mafraq governorate is most suitable at the three heights and has an outstanding total area of 22,366 km2 out of the total Northern region identified as having high suitability.
The results are summarized in the two figures displayed in Appendix E. The graph shows a comparison of findings and the figure shows the suitable areas in the Northern Region. Mafraq has a great potential for establishing wind farms.

3.2.2. Central Region

Areas identified with high suitability in the Central Region at a height of 50 m span a total area of 749.9 km2. Governorate shares include Amman (559.6 km2), Zarqa (142.8 km2), Madaba (42.8 km2), and Balqa (7.8 km2).
At the height of 100 m, areas with high suitability total 2513.9 km2. Governorate shares include Amman (1829.7 km2), Zarqa (623.6 km2), Madaba (55.7 km2), and Balqa (4.9 km2). Most suitable areas increased 3.3-fold when increasing turbine height from 50 m to 100 m.
At a height of 200 m, areas identified with high suitability total 4119.9 km2. Governorate shares include Amman (2811.5 km2), Zarqa (1214.5 km2), Madaba (89.4 km2), and Balqa (4.5 km2). The most suitable areas increased 1.6-fold when turbine height increased from 100 m to 200 m.
Reviewing the areas with high suitability, Amman governorate is the most suitable at the three heights and has a promising total area of 5200.8 km2.

3.2.3. Southern Region

Areas identified with high suitability in the Southern Region at a height of 50 m total 3357.1 km2. Governorate shares include Ma’an (1902.4 km2), Tafilah (269.9 km2), Aqaba (773 km2), and Karak (411.8 km2).
At a height of 100 m areas identified with high suitability total 9925.2 km2. Governorate shares include Ma’an (7619 km2), Aqaba (1103.1 km2), Karak (791.4 km2), and Tafilah (411.6 km2). The most suitable areas increased 2.9-fold when increasing turbine height from 50 m to 100.
At a height of 200 m, areas with high suitability total 16,262.5 km2. Governorate shares include Ma’an (13,236.1 km2), Aqaba (1391.4 km2), Karak (959.8 km2), and Tafilah (675.3 km2). The most suitable areas increased 1.6-fold when increasing turbine height from 100 m to 200 m.
Reviewing the areas with high suitability, Ma’an governorate is the most suitable at the three heights and has an outstanding total area of 22,757.5 km2 of suitable lands.

3.3. Feasibility Study Based on the Results

Wind power production projects come at a high cost initially but are profitable in the long run. Many factors affect the initial cost of investment: the cost of wind turbines, the number of turbines, construction cost, cost of project land acquisition, cost of transmission lines, taxes, and incentives [2,83]. According to the American Wind Energy Association (AWEA), commercial wind turbine costs range from $1.3–$2.2 million USD, for a 1 MW turbine in 2019. Today, most projects install a 2 MW wind turbine which costs around $3–$4 million USD per wind turbine [84], or high-capacity wind turbines with 3.45 MW which has an associated cost of $4 million USD [85]. According to National Renewable Energy Laboratories (NREL), Equation (2) is used to calculate the profitability (the cost to generate power) of wind turbine farm [86]:
Pcost to gen = [(FCR × IC)/AEP] + [(LRC + O&M + LLC)/AEP]
  • Pcost to gen: cost to generate power. FCR: fixed charge rate.
  • IC: initial capital, $.
  • AEP: net annual energy production, kWh.
  • LRC: levelized replacement cost, $.
  • O&M: cost for operations and maintenance, $.
  • LLC: land lease cost, $/year, $.
Assumptions given in this equation are that it uses wind turbines at a size of 1 MW at a height of 50 m, which costs approximately $1.3 million USD; 2 MW at a height of 100 m, which costs approximately $3 million USD; and 3.45 MW at a height of 200 m, which costs approximately $4 million USD). The wind turbine capacity factor is 35% and the life expectancy for the turbine is 25 years. The average revenue (cost to buyers) is $0.11, (FCR = 1% = 0.01) and the expected annual revenue is $200,000 USD (Appendix F). Substituting the values in the above equation, the results are as follows:
Pcost to gen at a height of 50 m = 3.3 c/kWh (Cent per kilowatt hour)
Pcost to gen at a height of 100 m = 3.5 c/kWh (Cent per kilowatt hour)
Pcost to gen at a height of 200 m = 2.9 c/kWh (Cent per kilowatt hour)
Equations (3)–(5) show that the cost to generate power is reasonable when using turbines at a height of 200 m. This is caused by the manufactured turbine itself. Since the selected turbine at a height of 200 m has the largest size (3.45 MW) and the expected life of a wind turbine is 25 years, it has to work approximately 4.7 years before costs are paid off. In return, it will continue to operate for 20.3 years at full profit. For detailed calculations see Appendix F.

3.4. Implementing the Study on the Northern Region/Mafraq Governorate

To examine the coverage and feasibility, this study tested the results in the Northern Region/Mafraq Governorate as an illustrative example (Table 3). This region provided a sufficient example where suitable areas were agglomerated at two major locations: one close to the urban areas and another far from urban areas. Data on electrical consumption in the Mafraq Governorate was available to support the results.
At a height of 50 m, suitable high lands at Mafraq Governorate could produce enough electrical energy to meet 274.3% of the total Jordanian energy demands (Appendix G). This means that Mafraq could generate sufficient electricity to fulfill all of Jordan’s electricity needs and have an excess of 174.3% that can be exported or used in other new functions such as heating in winter, which depended on fossil fuels mainly. The number of turbines required to cover 100% of Jordan’s electrical consumption is 5709. The annual profit of 5709 turbines would be $1.35 billion USD with an estimated cost of $7.42 billion USD.
At a height of 100 m, the number of turbines required to cover 100% of Jordan’s electrical consumption is 2854. The annual profit of 2854 turbines would be $1.31 billion USD with an estimated cost of $8.56 billion USD.
At a height of 200 m, the number of turbines required to cover 100% of Jordan’s electrical consumption is 1654. The annual profit of 1654 turbines would be $1.42 billion USD with an estimated cost of $6.62 billion USD.
These calculations show that it is more feasible to install turbines at 50 m height than it is at 100 m height in the Mafraq Governorate (Figure 6) (Table 3). However, installing turbines at 200 m height is less expensive and rather more rewarding (Figure 5). Figure 6 shows the relationship between the turbine height in meters, the annual profit, and the cost in American Dollars. The dotted trend line has the estimated cost, and the dashed trend line is the estimated annual profit. If this annual profit is steady, it is expected to take an average of 5.5, 6.5, and 4.7 years to regain the cost of the 50, 100, 200 m high turbine hub, respectively.
According to the World Bank, Jordan’s GDP is around $40 billion USD [61]. The calculations show that the highly suitable areas at a height of 50 m produce electrical energy that could boost the national GDP by 3.4% with an annual profit of $1.35 billion USD. Appendix G shows the consumption of electrical energy for the Mafraq governorate during 2017. July was the highest month of consumption with 99,353,787 kWh, while February was the lowest month of consumption with 63,803,956 kWh because they rely on fossil fuels for heating in the winter [58]. Once renewable energy is available at comparable prices, the total consumption may increase, necessitating the production of more wind energy in all Governorates based on the suitability map and the area characteristics. It is still unknown how the consumption pattern will evolve.
Currently, the Mafraq governorate’s energy needs account for 132,214,418 kWh/year [58]. To calculate the number of wind turbines needed to cover the electrical consumption of Mafraq governorate at a height of 50 m, Mafraq consumption was divided by the annual energy production for an individual wind turbine at a height of 50 m which results in a total of 43.1 wind turbines. This means that about 44 wind turbines are needed to cover the electrical consumption of the Mafraq governorate. At the height of 100 m, the number of wind turbines needed to cover the current demand is 21.6 turbines while 12.5 turbines are needed at a height of 200 m (Appendix G).

3.5. The Developed Framework

The implementation of a feasible regional wind farm planning framework will require several basic phrases. The first is studying the national electrical energy consumption. It is best if the information on power consumption and production is province- or governorate-based. In this case study, industrial use of electricity is negligible compared to domestic/commercial uses. However, when implemented in other case studies, domestic/commercial and industrial consumption may be separated to help in assessing the actual production and consumption times and amounts. It will also be useful to take into consideration any future policy-related aspects regarding power generation. A second important phase is to identify potential wind farm locations. This step is dependent on estimated or actual meteorological information in addition to other geo-information. The details of this phase are laid out in this study where spatial data exclusion precedes suitability analyses to account for some restrictions regarding wind speed, preserves, urban areas, etc., as explained in the suitability analysis. The third phase depends on wind turbine engine types, heights, availability, prices, etc. This is directly related to turbine technology and characteristics that are essential to calculate the feasibility of the proposed wind farm locations. Before the implementation of any selected site, the authorities or the investors are responsible not only for the feasibility of the project but also for its acceptance by the locals and the policy-makers. Therefore, additional phases are required to study the locations that best benefit urban areas as well as potential industrial or agricultural projects that are energy-dependent. A temporal plan must be laid out to study the time of consumption suited for the urban areas and the times when energy can be consumed by other rural and remote activities.

4. Discussion

The aims of this research are to re-highlight renewable energy sources with a focus on wind energy as an alternative energy source to fossil fuels, enhance the economic potential of Jordan by defining the most suitable areas for establishing wind turbine farms, and select the most feasible sites based on spatial cost-revenue optimization in Jordan. It is employing GIS to achieve long-term objectives such as improving environmental protection by lowering greenhouse gas emissions and addressing the depletion and consumption of electric power and its impact on the national GDP. This research assesses the economic, governmental, and environmental dimensions, to lead the way for integrated regional energy planning by combining the spatial mapping and land suitability demand for energy resources.
What sets this study apart from others is the following: First, it is discussing Jordan’s electric power production and import prices, as well as their effects on the country’s GDP. Second: it uses a resolution of 250 m at a regional planning scale which increases the accuracy of the site selection. Third: it selects the most feasible sites based on spatial cost-revenue optimization. Fourth: it introduces different scenarios at different prospect wind hub heights. Fifth: it applies a new earthquake potential hazard map criterion as part of selecting potential wind turbine sites. This research will be the first of its kind to study and analyze wind energy in Jordan at the regional scale and will therefore be the basic reference for many future subsequent studies.
Wind energy is considered more feasible than solar energy for many reasons; it uses less energy, produces less carbon dioxide, and can generate power 24 h/day since it is not dependent on sunlight, thus produces more total energy. One wind turbine can generate the same amount of energy in kWh as that produced by thousands of solar panels saving on area consumption, maintenance, and cleaning costs [88]. We have to acknowledge that this is an optimistic view of wind energy. The wind doesn’t always blow at the average or optimal speed in even the most suitable selected sites. Therefore, a hybrid energy system consisting of at least two of the many renewable sources (wind, solar light, water, geothermal heat, etc.) is a smart solution [89]. In a study on future energy scenarios in Jordan, one scenario that proposes a 100% renewable energy dependence suggests 55–67% reliance on wind energy as opposed to 13–15% reliance on PV-UTL among the many sources of local energy [90]. This hybrid energy system is used in many places around the world. It depends on producing energy for consumption from other sources such as fossil fuels and solar panels [89,91].
This research used GIS to find the best locations for wind farms based on comprehensive criteria, which can enable decision-makers to make appropriately informed decisions regarding their selection. Additional help is gained from integrating the GIS model with AHP to solve geospatial problems by determining how each criterion affects the study. The Expert Choice tool was employed for a more objective weighting process.
The study revealed many potential benefits for the economy in the AOI. According to the World Bank, Jordan’s current GDP is around $40 billion USD [61]. Examining the production potential of highly suitable areas at a height of 50 m, electrical energy production could increase the national GDP by 3.4% with an annual profit of $1.348 billion USD. This is not new in this field—many national studies aiming at boosting the local economy using wind energy are already applying it with great benefits to the local energy production and revenues. Leading countries include China, USA, Germany, India, Spain, UK, France, Canada, Sweden, Netherlands, and Denmark [25,26,27]. Climate Council news announced that many countries are already achieving in their dependence on renewable energy [92]. For example, Costa Rica is already 95% dependent on renewable sources of energy; Nicaragua is 90% dependent on renewable sources; Scotland is 98% dependent on wind energy now; and Uruguay is 100% dependent on a hybrid system of wind and solar energy [92].
Individual governorates and their municipalities should take into consideration a framework for implementing wind energy projects surrounding urban areas. The steps towards implementation are as follows; review the map of high suitable areas for wind farms from this study; determine the height of the optimal turbine hub, calculate wind speed at the selected height; study the feasibility of selected areas at the selected height; and select the type of wind turbine.
Electricity production revenue can be reinvested with ways to improve the country and its infrastructure. Many identified highly suitable lands are in remote areas where energy can be used to serve for:
  • Providing a new land-use planning system that supports and protects the lands designated for generating wind energy to enable all areas to operate with high productivity while providing the necessary energy for that. This is established by creating a land-use layer indicating the suitability of land for wind farm installations. In this respect, the United States is one of the leading nations [78]. India, too, is working to close energy gaps for its rapidly expanding population by developing maps for solar and wind suitability classes [93]. A consolidated effort is being made to unify constraints for appropriate land selection for onshore wind installations on a European scale [94].
  • Creating controlled-climate agricultural areas in which agriculture can depend on modern concepts for lush growth. As long as the necessary energy for irrigation, lighting, and climate control is available, we can speed up production processes and develop more productive crop-based needs to create food security for an expanding population. In addition to the direct employment opportunities in wind farm installations, there are indirect employment opportunities in the investment projects. For example, wind power farms indirectly boosted the Brazilian agricultural employment levels by 64% and the wages by 131% [95]. They found that it also boosted the industrial and construction sectors, especially among the less-educated population, enhancing the social and economic status of their families and increasing social welfare in this developing nation. An earlier study on “valuing the attributes of renewable energy investments” also found that the benefits of renewable energy projects are mainly on the socioeconomics of the rural population [96].
  • Producing the energy needed to establish new industrial cities in remote areas and providing the necessary infrastructure. This will create new job opportunities, increase gross domestic product, and enhance industrial production, which will positively affect exports. Such projects will create employment opportunities and encourage migration to rural areas. A recent study in Wales, UK, that investigated the complex investment in energy and other industries showed that success is also related to the amount of local capital. Therefore, when the regional investment falls short, investment is more likely to be handled at the national level than locally to maintain its sustainability [97].
  • Instead of living in the areas most suitable for farming, the wind farm project will encourage the urbanization of more arid regions to spare the fertile lands for food production. When energy is readily available, many challenging living conditions may be overcome such as the souring hot days when energy is so cheap to cool the living quarters. Also, with readily available energy, the creation of smart cities becomes attractive. A living example is Masdar City in Abu Dhabi, the United Arab Emirates, which stands as a model for a smart, sustainable city benefiting from solar energy [98]. If established in remote arid areas, this will also secure jobs for the new agglomerations and prevent migration to big cities.
In this study, the generated maps are not just for the greater national and governorate goals but also to support the development of remote lands for farming purposes by providing energy for irrigation which would also support the growing food-based needs of an expanding population. It can also support the generation of many types of industrial sites in remote arid lands.

5. Conclusions

By investing in wind energy, Jordan can reduce its dependency on fossil fuels. Wind energy farm investments will introduce dynamic and socioeconomic development, employment opportunities, and environmental protection.
The proposed framework estimates the geographical distribution of wind energy resources by including environmental, technical, social, and economic criteria to achieve a framework for spatial regional energy planning. This study added a new criterion responsible for geological faults to account for seismic activity. GIS software identified the most suitable areas for establishing wind farms in Jordan. This methodology was divided into two stages. The first stage applied a restrictive method. At this stage, all unsuitable areas were excluded. The second stage followed an analytical method to define the most suitable areas for harvesting wind energy at three different elevation scenarios (50 m, 100 m, and 200 m). The criteria were given weights based on an AHP method through the system software called Expert Choice.
The outcomes of the case study show that 7.4% (6624.5 km2) of the study area has high suitable areas for the installation of wind farms at a height of 50 m; 21.7% (19,379.6875 km2) of the study area has high suitable areas at a height of 100 m; and, 37.9% (33,821.7 km2) of the study area has high suitable areas at a height of 200 m. Additionally, 77.3% (69,106.8 km2); 63.5% (56,727.1 km2); and, 47.8% (42,743.1 km2) have moderate suitability at 50 m, 100 m, and 200 m heights, respectively. 1.6% (1309.3 km2); 1.1% (1014.8 km2); and 0.6% (556.9 km2) have low suitability at 50 m, 100 m, and 200 m heights, respectively.
This leads to the conclusion that the area of suitable high lands increases with the height of the prospect wind hub. However, the moderately suitable land area increases as the height decrease. Second, suitable land is sufficient at moderate and high levels on all three hub elevations. However, there isn’t much of a distinction in wind turbine installation costs between the three kinds of wind turbine heights. Although from many perspectives it is practically more difficult to establish the 200 m hub turbines, it is not so much more than the cost of the 100 m hub turbines. A wide study on the United States showed that technologies with larger potential can now be found, such as tubular steel using soft-soft design criteria [78]. They are prominent in the United States. But to weigh things out, it is wiser to choose manageable heights of 100–150 m.
What happens when the wind isn’t strong enough to keep the turbine running? It’s worth considering incorporating solar energy into the same wind turbine tower to help the blades maintain momentum on sunny and less windy days. Engineers in charge of more innovative design should look into using the towers to gather solar energy while still producing energy with the wind. Some studies already started exploring this alternative [67]. There is a vast array of innovation that has yet to be explored that has the potential to increase the economics of wind power [78,99]. Research on developing technology, materials, and aerodynamics is gradually bringing affordable, viable, and appealing solutions.
The produced maps serve as an atlas for wind farm planning in the AOI. They will surely aid the process of sustainable regional planning by exhibiting suitable locations and levels of suitability. The suitability is also based on the feasibility and the potential of adapting places to the restrictive criteria while abiding with the local policies. Once the locations are appropriate and feasible, they present a valuable future regional optimization plan to boost the national economy and make living sustainable and affordable for people.
The results could be supported by developing a road map for renewable energy systems based on locally available resources. Future land-use plans and comprehensive plans should include a wind farm suitability layer to facilitate future investment in wind farms for urban, agricultural, and industrial purposes. This will help future high-efficiency decision-making policies foster long-term economic growth in the places suited for energy production and consumption while sparing fertile lands for rain-fed food production. This finding is backed by prior regional studies on land suitability and landscape character preservation [74,100].

6. Recommendations

It is recommended to undertake further studies for each governorate to calculate energy demands, the amount of energy that could potentially be generated, the real impact of this influx of energy on individual cities, and how the produced energy may be used or consumed. It is also recommended to re-examine the tariff price per watt and the proper scenarios for returns of investment value on exporting energy costs. Additionally, it is advised to study the effects of changing peak hour demands through a decrease of the tariff rate during the hours when the load is low to encourage people to use electrical energy at low hour demand times and reduce energy needs during peak times. The most intelligent approach is to use hybrid power systems that support energy with both wind and solar energy [91]. Although solar panel maintenance is expensive, in semi-arid regions such as the Middle East, the use of solar panels is a smart alternative to complete power generation and maintain it at all times [101]. Weighing the cost/benefit is important, but it is wise to weigh the percentage of each power so that optimization can be achieved by utilizing both solar and wind power in any location [89].
Other scenarios for using wind farms are possible such as the potential hydrogen production from wind farms [102]. In this case, a whole line of direct production is introduced that may as well elevate the GDP levels for any country. Besides, and under other similar research, it is possible to carry this a step further by finding the levels of acceptance of these farms by the locals and policy-makers. Since there is a lot of impact on the landscape character and place memory in the minds of locals, they often have varied opinions towards landscape change [100,103]. Therefore, consultation with the locals is also important to consider. Many recent studies focus on technological legitimation (community acceptance), indicating the importance of public participation in decision-making [104].
This research is subject to several limitations, including the inability to access up to date digital maps (land-use/landcover, wind speed, wind power density, electrical power lines, roads); more detailed feasibility studies; and the inaccessible information regarding actual local monitoring for wind speed and wind power density at different heights in the most suitable locations.

Author Contributions

Conceptualization, A.A.G., and D.A.A.-S.; methodology, D.A.A.-S. and A.M.A.-R.; software, A.M.A.-R. and D.A.A.-S.; validation, R.A.J., A.M.A.-R., and D.A.A.-S.; formal analysis A.M.A.-R., and D.A.A.-S.; investigation, A.M.A.-R., and D.A.A.-S.; resources, A.M.A.-R., and D.A.A.-S.; data curation, A.A.G., D.A.A.-S., A.M.A.-R., and R.A.J.; writing—original draft preparation, A.A.G., D.A.A.-S., A.M.A.-R., and R.A.J.; writing—review and editing, A.A.G., R.A.J., and A.M.A.-R.; visualization, D.A.A.-S. and A.M.A.-R.; supervision, A.A.G., A.M.A.-R., and R.A.J.; project administration, A.A.G.; funding acquisition, A.A.G. All authors have read and agreed to the published version of the manuscript.

Funding

This research was funded by the Deanship of Research at Jordan University of Science and Technology, grant number 689-2018.

Data Availability Statement

The data presented in this study are available on request from the corresponding author.

Acknowledgments

This work is part of a larger project on sustainable regional planning supported by fund number 689-2018. We thank the Deanship of Research at Jordan University of Science and Technology for granting us this fund. Special thanks to Global Wind Atlas, Danmarks Tekniske Universite, where we obtained wind speed and wind power density estimates [52].

Conflicts of Interest

The authors declare no conflict of interest.

Appendix A

Table A1. Top Criteria that Were Weighed and Had a Very Strong Impact on the Study.
CriteriaAverage%
Wind Speed66.5%
Wind Power Density43.8%
Proximity to Urban Areas 22%
Electrical power Lines 19.8
Highway and Railway Roads 13.6%
Attitude13.6%
Distance to Protected Areas 13%
Slope10.9%
Land Use/ Land Cover10%
Important Places10%
Population Density8.4%
Proximity to Forest6.45%
Proximity to Water Bodies5.2%
Distance to Airports2.7%
Proximity to Village Areas2.2%

Appendix B

Resources for each layer were using ESRI ArcGIS 10.5 software. All layered data was projected to a Universal Transverse Mercator (UTM) coordinate system WGS_1984_UTM_Zone_36N. Data layers had a standard 250 m spatial resolution. In particular, Wind data was obtained from the Global Wind Atlas 3.0; a free web-based application developed, owned, and operated by the Technical University of Denmark (DTU) in partnership with the World Bank Group, utilizing data provided by Vortex, with funding provided by the Energy Sector Management Assistance Program (ESMAP). https://globalwindatlas.info accessed on 12 Feburary 2019.
Table A2. Description of Criteria Used in This Study and Its Sources.
CriteriaData SourceType
Land Use /Land CoverRoyal Jordanian Geographic Center (RJGC) derived from Landsat 8, 2016.Vector (polygon)
RoadsOpen Street Map.
https://www.openstreetmap.org/#map=7/31.300/37.131 (accessed on 3 February 2021)
Vector (line)
Electrical Power LinesOpen Street Map.
https://www.openstreetmap.org/#map=7/31.300/37.131 (accessed on 3 February 2021)
Vector (line)
Digital Elevation Model/DEMAlaska Satellite Facility, 12.5-meter resolution, 2019.
https://www.asf.alaska.edu/ (accessed on 3 February 2021)
Raster
Wind SpeedGlobal Wind Atlas, 2019.
https://globalwindatlas.info/en/area/Jordan?print=true (accessed on 3 February 2021)
Raster
Wind Power DensityGlobal Wind Atlas, 2019.
https://globalwindatlas.info/en/area/Jordan?print=true (accessed on 3 February 2021)
Raster
Potential Earthquake HazardJaradat, R.A., Nusier, O.K., Awawdeh, M.M., Al-Qaryouti, M.Y., Fahjan, Y.M. and Al-Rawabdeh, A.M., 2008. Deaggregation of probabilistic ground motions for selected Jordanian cities. Jordan Journal of Civil Engineering, 2(2), 172–196, 2008.Raster
Environmental PreservationsDigitized by the Author.
https://www.openstreetmap.org/#map=13/29.8354/35.2831 (accessed on 3 February 2021)
Vector (Polygon)
Military AirportDigitized by the Author.
https://www.openstreetmap.org/#map=13/29.8354/35.2831 (accessed on 3 February 2021)
Vector (Point)
Commercial AirportDigitized by the Author.
https://www.openstreetmap.org/#map=13/29.8354/35.2831 (accessed on 3 February 2021)
Vector (Point)

Appendix C

Figure A1. Suitable classes and land areas for wind energy at the three heights (50-m, 100-m, and 200-m) for Jordan.
Land 10 00442 g0a1

Appendix D

Figure A2. Land Area Percentage of Total Suitability Area at the Three Heights in Jordan.
Land 10 00442 g0a2

Appendix E

Figure A3. Suitability map and graph for the Northern Region at the three different heights.
Land 10 00442 g0a3

Appendix F. Finding Values for the Equations at the Three Different Heights: 50 m, 100 m, and 200 m

FCR: fixed-rate, is “the fraction of the Total Installed Cost that must be set aside each year to retire capital costs which include interest on debt, return on equity, and so forth” In Jordan, all power generation projects of renewable energy are exempted from duties and taxes. In this case, we will assume a 1% for each project.
  • FCR = 0.01
  • IC: the initial cost for each turbine (million USD).
  • IC = $1.3 million USD, for a wind turbine of 1 MW at a height of 50 m.
  • IC = $3 million USD, for a wind turbine of 2 MW at a height of 100 m.
  • IC = $4 million USD, for a wind turbine of 3.45 MW at a height of 200 m.
  • AEP: for annual energy production, assume a 35% capacity factor (according to the nameplate rating; the turbine will generate an average of 35%).
  • For a height of 50 m:
  • AEP = 1000 kW × 24 hr/day × 365 day/year × 0.35
  • AEP = 3,066,000 kWh/year
  • For a height of 100 m:
  • AEP = 2000 kW × 24 hr/day × 365 day/year × 0.35
  • AEP = 6,132,000 kWh/year
  • For a height of 200 m:
  • AEP = 3450 kW × 24 hr/day × 365 day/year × 0.35
  • AEP = 10,577,700 kWh/year
  • LRC: The Leveled Replacement cost is: (Cost of Turbine/ Expected Life). Turbine life expectancy is 25 years.
  • For a height of 50 m:
  • LRC = $1.3 million USD/25years
  • LRC = $52,000 USD/year
  • For a height of 100 m:
  • LRC = $3 million USD/25years
  • LRC = $120,000 USD/year
  • For a height of 200 m:
  • LRC = $4 million USD/25years
  • LRC = $160,000 USD/year
  • O&M: Operations and Maintenance cost. According to American Wind Energy Association (AWEA), O&M is estimated at 8% of annual gross revenue.
  • According to NEPCO, each 1 kWh is sold by $0.11.
  • For a height of 50 m:
  • O&M = AEP × average gross revenue/kWh × 0.08
  • O&M = 3,066,000 × 0.11 × 0.08
  • O&M = $26,980.8 USD
  • For a height of 100 m:
  • O&M = AEP × average gross revenue/kWh × 0.08
  • O&M = 6,132,000 × 0.11 × 0.08
  • O&M = $53,961.6 USD
  • For a height of 200 m:
  • O&M = AEP × average gross revenue/kWh × 0.08
  • O&M = 10,577,700 × 0.11 × 0.08
  • O&M = $93,083.76 USD
  • LLC: The land lease cost, according to AWEA statics is estimated at 5% of annual revenue.
  • LLC = $10,000 USD
  • Pcost to gen = [(FCR × IC)/AEP] + [(LRC + O&M + LLC)/AEP].
  • For a height of 50 m:
  • Pcost to gen = [(0.01 × 1,300,000)/3,066,000] + [(52,000 + 26,980.8 + 10,000)/3,066,000].
  • Pcost to gen = [0.0042] + [0.029].
  • Pcost to gen = 0.033
  • Pcost to gen = 3.3 c/kWh (cent per kilowatt hour).
  • For a height of 100 m:
  • Pcost to gen = [(0.01 × 3,000,000)/6,132,000] + [(120,000 + 53,961.6 + 10,000)/6,132,000].
  • Pcost to gen = [0.0049] + [0.030].
  • Pcost to gen = 0.035
  • Pcost to gen = 3.5 c/kWh (cent per kilowatt hour).
  • For a height of 200 m:
  • Pcost to gen = [(0.01 × 4,000,000)/10,577,700] + [(160,000 + 93,083.76 + 10,000)/10,577,700].
  • Pcost to gen = [0.0038] + [0.025].
  • Pcost to gen = 0.029
  • Pcost to gen = 2.9 c/kWh (cent per kilowatt hour).
  • To find the total Annual Expenses:
  • Tae = Pcost to gen × AEP
  • Tae: total annual expenses
  • Pcost to gen: cost to generate power.
  • AEP: net annual energy production, kWh.
  • For a height of 50 m:
  • Tae = $0.033 kwh × 3,066,000 kWh/year
  • Tae = $101,178 USD
  • For a height of 100 m:
  • Tae = $0.035 kwh × 6,132,000 kWh/year
  • Tae = $214,620 USD
  • For a height of 200 m:
  • Tae = $0.029 kwh × 10,577,700 kWh/year
  • Tae = $306,753.3 USD
  • To find Annual Gross Income:
  • Ig = Tarif Price × AEP
  • Ig: annual gross income
  • AEP: net annual energy production, kWh.
  • For a height of 50 m:
  • Ig = 0.11 c/kWh × 3,066,000 kWh/year
  • Ig = $337,260 USD
  • For a height of 100 m:
  • Ig = 0.11 c/kWh × 6,132,000 kWh/year
  • Ig = $674,520 USD
  • For a height of 200 m:
  • Ig = 0.11 c/kWh × 10,577,700 kWh/year
  • Ig = $1,163,547 USD
  • To find the annual profit (Pa) of the turbine:
  • Pa = (Pselling price – Pcost to gen) × AEP
  • Pa: annual profit
  • Pselling price: selling price power
  • Pcost to gen: cost to generate power
  • AEP: net annual energy production, kWh.
  • For a height of 50 m:
  • Pa = ($0.11 – $0.033) × 3,066,000 kWh/year
  • Pa = $236,082 USD
  • For a height of 100 m:
  • Pa = ($0.11 – $0.035) × 6,132,000 kWh/year
  • Pa = $459,900 USD
  • For a height of 200 m:
  • Pa = ($0.11 – $0.029) × 10,577,700 kWh/year
  • Pa = $856,793.7 USD
  • To calculate how long it will take for this investment to be paid off:
  • BEP = Cturbine/Pa
  • BEP: Break-Even Point
  • Cturbine: turbine cost
  • Pa: annual profit
  • For a height of 50 m:
  • BEP = $1,300,000 USD/$236,082 USD
  • BEP = 5.5 years
Since the expected life of a wind turbine is 25 years, it has to work approximately 5.5 years before costs are paid off. It will continue to operate for 19.5 years at full profit. Jordan has sold electricity at 11 c/kWh, Power generation by wind turbines costs 3.3 c/kWh, this means that 7.7 c/kWh will be the direct profit for the country.
  • For a height of 100 m:
  • BEP = $3,000,000 USD/$459,900 USD
  • BEP = 6.5 years
Since the expected life of a wind turbine is 25 years, the turbine has to operate for 6.5 years before its costs are paid off. It will continue to operate for 18.5 years at full profit. Jordan has sold electricity at 11 c/kWh, Power generation by wind turbines costs 3.5 c/kWh, this means that 7.5 c/kWh will be the direct profit for the country.
  • For a height of 200 m:
  • BEP = $4,000,000 USD/$856,793.7 USD
  • BEP = 4.7 years
Since the expected life of a wind turbine is 25 years, it has to work approximately 4.7 years before costs are paid off. It will continue to operate for 20.3 years at full profit. Jordan has sold electricity at 11 c/kWh, Power generation by wind turbines costs 2.9 c/kWh, this means that 8.1 c/kWh will be the direct profit for the country
The area for each turbine depends on the state of the site. Distance between turbines expressed in the rotor diameter of the turbine (D). Range of this space 6 - 10 D. Many considerations should take into account when deciding the range, such as turbine hub (m), wind direction, terrain, and other setback regulations.
This spacing performs a compromise between compactness, thus minimizes the initial cost, and prevents any disturbance in airflow which would create turbulence, and makes the turbine less efficient. In this study, assumption of area = 6D × 10D is assumed per turbine, at a height of 50 m (D = 50 m), at a height of 100 m (D = 100 m), and at a height of 200 m (D = 150 m). Jordan consumes 17,504,000,000 kWh/year of electrical energy (NEPCO, 2017).

Appendix G

Table A3. Consumption of Electrical Energy for Mafraq Governorate During 2017.
MonthElectrical Energy Consumed (kWh)The Rank of Electrical Consumption from the Lowest (11) to the Highest (1)
February63,803,95611
January64,580,91210
December67,633,5069
March72,241,6888
April72,241,6888
November77,284,6547
May80,693,5406
June86,369,5905
October89,975,1934
July94,945,5983
September97,801,3672
August99,353,7871
Total132,214,418 kWh/year

Appendix H. Calculations of the Feasibility of Installed Wind Turbines in Mafraq Governorate at Three Heights 50 m, 100 m, and 200 m.

Area of Mafraq at a height of 50 m, high suitability class = 2349 km2
To calculate the area required for each turbine:
The required area of each turbine depends on the nature of the terrain, aligned orientation, the number of turbine lines, the capacity size of each turbine, the wind rose for a site, and many more. The installation area should have 10 rotor diameters of clearance in the direction of the wind and 3 rotor diameters in every other direction (total 6D). We assumed here to take the average space required to install each turbine is 6Dx10D (National Wind Watch, 2021).
  • Required area = 6D × 10D
  • Required area = 6 (50) × 10 (50)
  • Required area = 150,000 m2, convert the area unit to Km2 = 0.15 km2
To calculate the number of turbines required to cover all electrical consumption of Jordan:
  • Number of turbines = Jordan’s electrical annual energy consumption/annual energy production for each turbine
  • Number of turbines = (17,504,000,000 kWh/year)/(3,066,000 kWh/year)
  • Number of turbines = 5709
To calculate the area required for 5709 turbines:
  • Area required for 5709 turbines = Number of turbine × area required for each turbine
  • Area required for 5709 turbines = 5709 × 0.15 Km2
  • Area required for 5709 turbines = 856.35 km2
To calculate the remaining of high suitable area:
  • Remaining of high suitable area = High suitable area - Area required for 5709 turbines
  • Remaining of high suitable area = 2349 km2 − 856.35 km2
  • Remaining of high suitable area = 1492.65 km2
To calculate how much energy these turbines provide:
  • AEPtotal = Number of turbines × AEP for each turbine.
  • AEPtotal = 5709 × 3,066,000 kWh/year
  • AEPtotal = 17,503,794,000 kWh/year
To calculate the annual profit of 4996 turbines:
  • The annual profit from 5709 turbine = 5709 turbine × annual profit (Pa) from one turbine at a height of 50 m = 5709 × $236,082 USD.
  • The annual profit from 5709turbine = $1,347,792,138 USD
Calculating the cost of 5709 turbines:
  • wind turbine farm in Mafraq at a height of 50 m costs = number of turbines × cost of the turbine.
  • wind turbine farm in Mafraq at a height of 50 m costs = 5709 × $1.3 million USD.
  • wind turbine farm in Mafraq at a height of 50 m costs = $7,421,700,000 USD
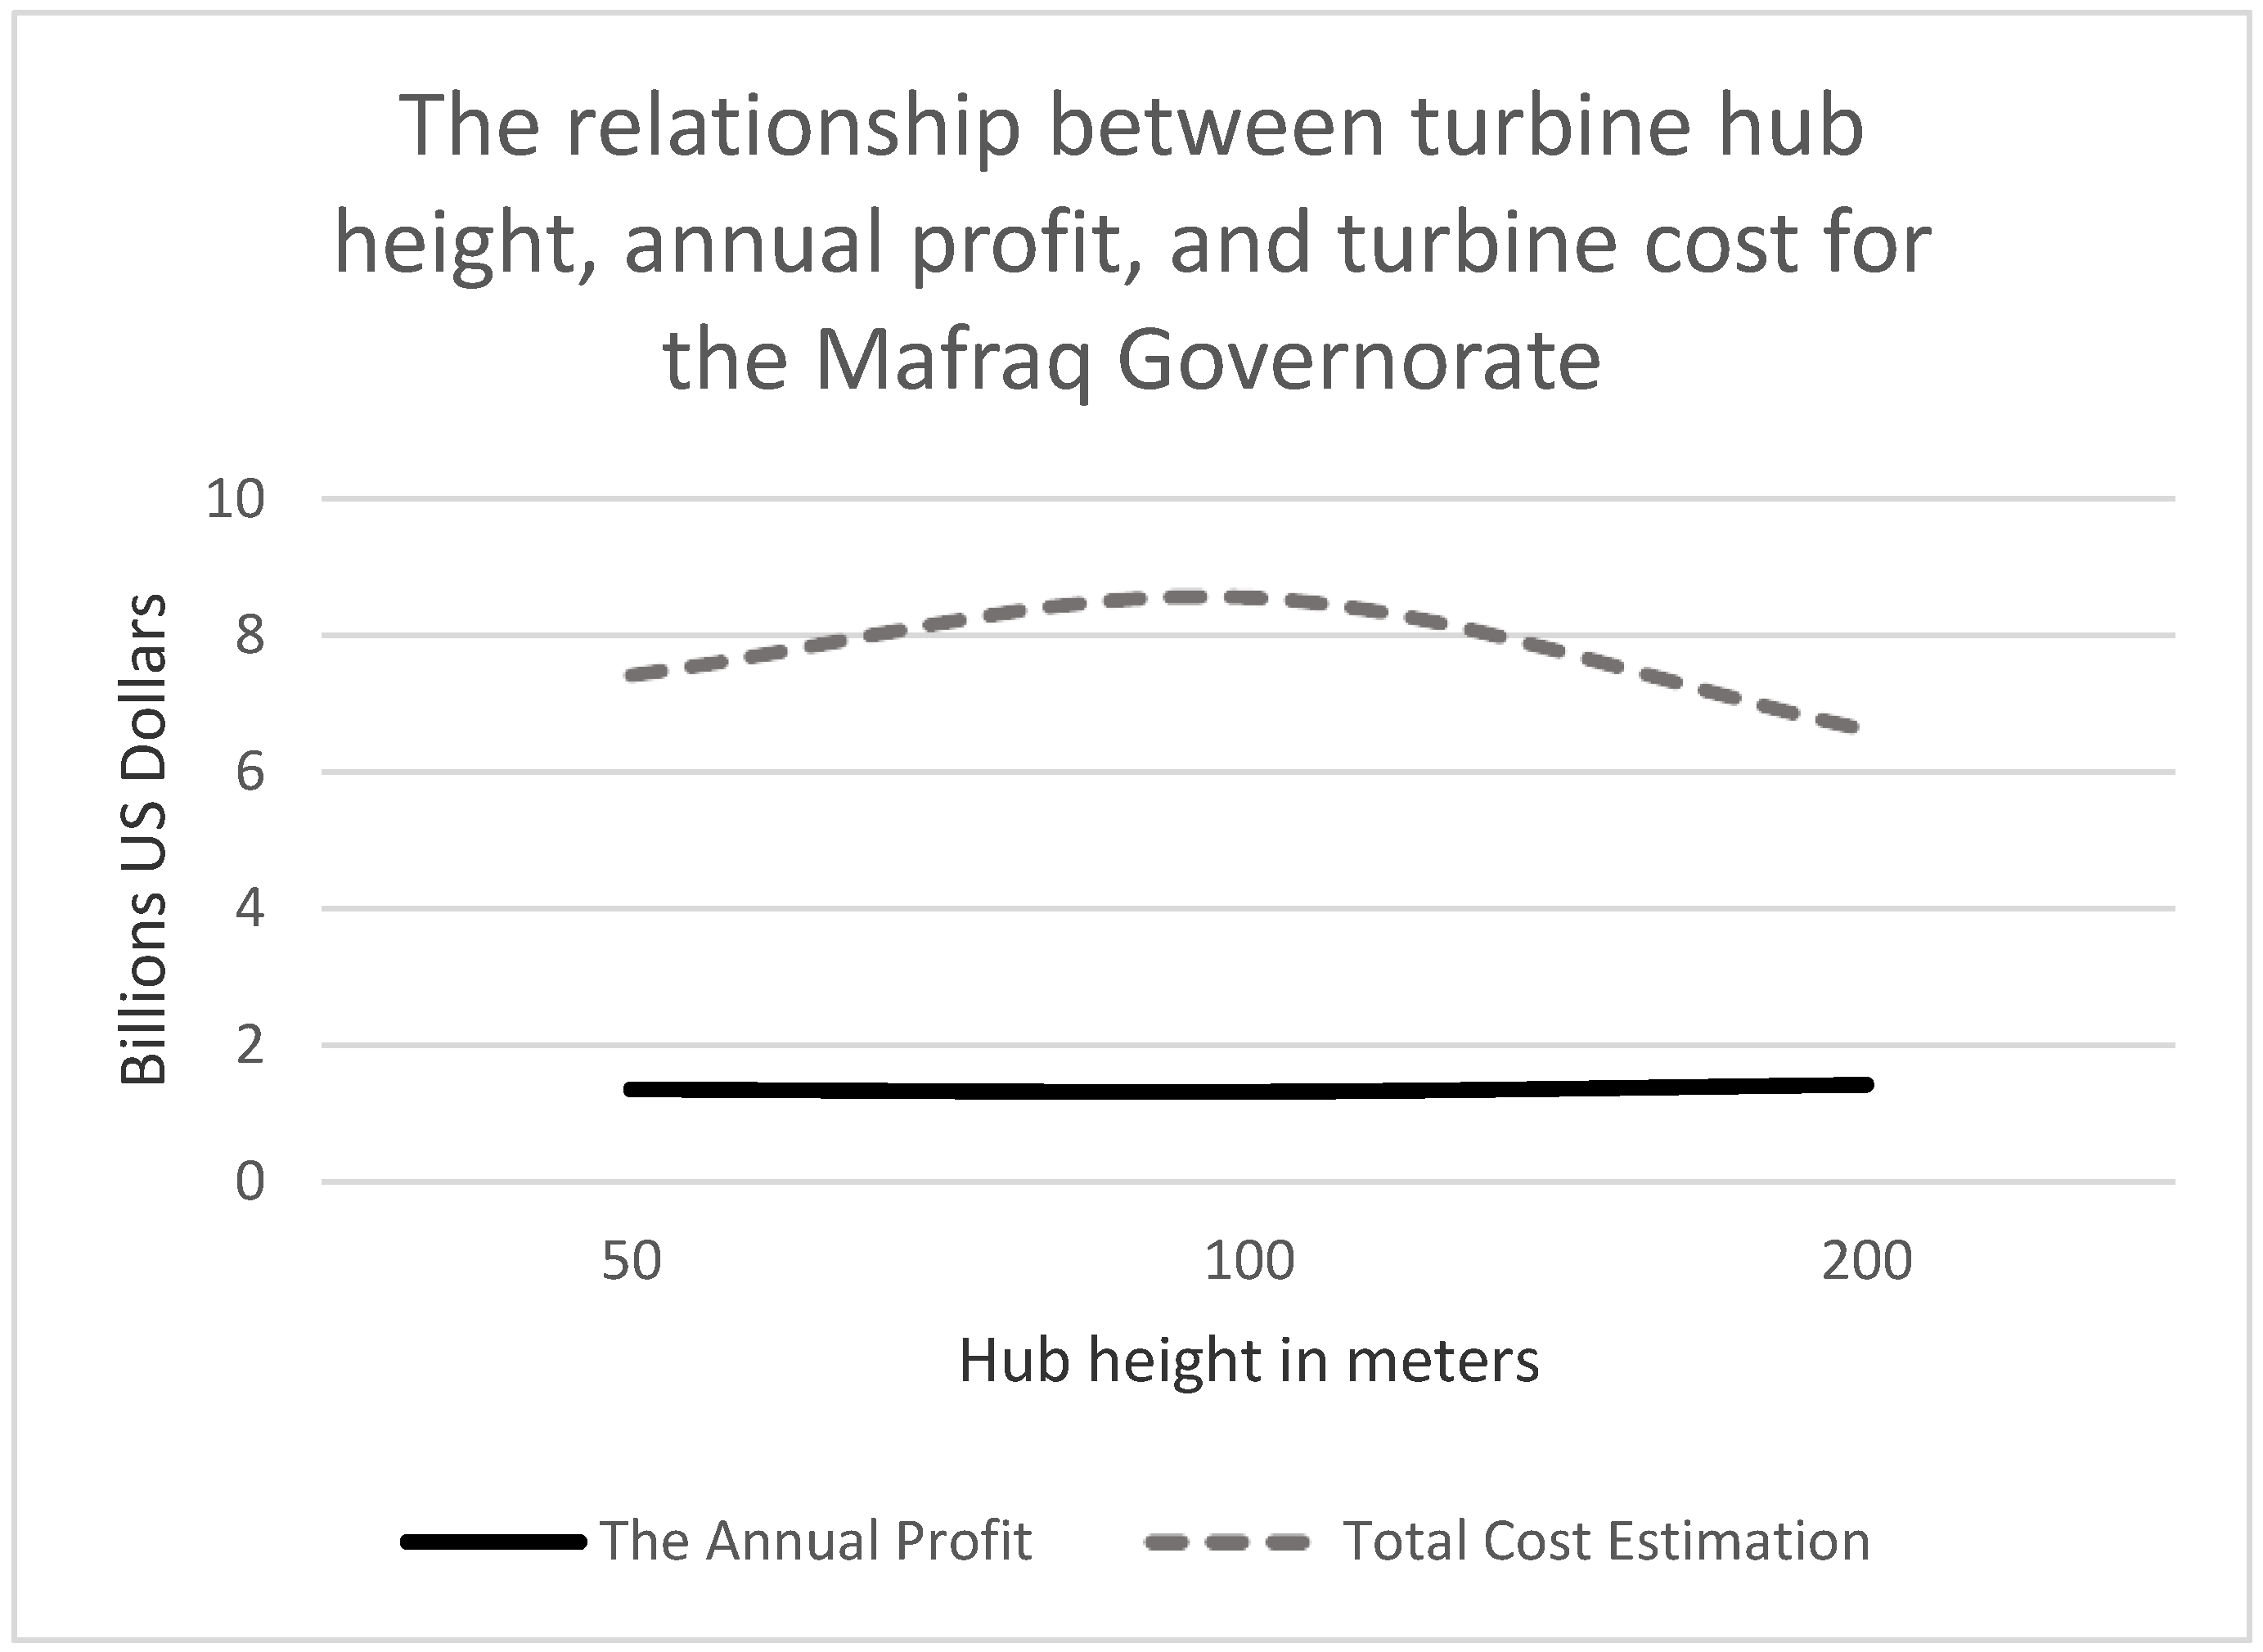
  • 5709 turbines are required at a height of 50 m to cover all of Jordan’s electricity needs. The Annual profit will be $1,347,792,138 USD, with cost estimation $7,421,700,000 USD.
  • Area of Mafraq at a height of 100 m, high suitability class = 6768.2 km2
To calculate the area required for each turbine:
  • Required area = 6D × 10D
  • Required area = 6 (100) × 10 (100)
  • Required area = 600,000 m2, convert the area unit to Km2 = 0.6 km2
To calculate the number of turbines required to cover all electrical consumption of Jordan:
  • Number of turbines = Jordan’s electrical annual energy consumption/annual energy production for each turbine
  • Number of turbines = (17,504,000,000 kWh/year)/(6,132,000 kWh/year)
  • Number of turbines = 2854
To calculate the area required for 2854 turbines:
  • Area required for 2854 turbines = Number of turbine × area required for each turbine
  • Area required for 2854 turbines = 2854 × 0.6 km2
  • Area required for 2854 turbines = 1712.4 km2
To calculate the remaining of high suitable area:
  • Remaining of high suitable area = High suitable area - Area required for 2854 turbines
  • Remaining of high suitable area = 6768.2 km2 − 1712.4 km2
  • Remaining of high suitable area = 5055.8 km2
To calculate how much energy these turbines provide:
  • AEPtotal = Number of turbines × AEP for each turbine.
  • AEPtotal = 2854 × 6,132,000 kWh/year
  • AEPtotal = 17,500,728,000 kWh/year
To calculate the annual profit of 2854 turbines:
  • The annual profit from 2854 turbines = 2854 turbine × annual profit (Pa) from one turbine at a height of 100 m = 2854 × $459,900 USD.
  • The annual profit from 2854 turbine = $1,312,554,600 USD
Calculating the cost of 2854 turbines:
  • wind turbine farm in Mafraq at a height of 100 m costs = number of turbines × cost of the turbine.
  • wind turbine farm in Mafraq at a height of 100 m costs = 2854 × $3 million USD.
  • wind turbine farm in Mafraq at a height of 100 m costs = $8,562,000,000 USD
  • 2854 turbines are required at a height of 100 m to cover all of Jordan’s electricity needs. The Annual profit will be $1,312,554,600 USD, with cost estimation $8,562,000,000 USD.
  • Area of Mafraq at height of 200 m, high suitability class = 13,251.8 km2
To calculate the area required for each turbine:
  • Required area = 6D × 10D
  • Required area = 6 (150) × 10 (150)
  • Required area = 1,350,000 m2, convert the area unit to km2 = 1.35 km2
To calculate the number of turbines required to cover all electrical consumption of Jordan:
  • Number of turbines = Jordan’s electrical annual energy consumption/annual energy production for each turbine
  • Number of turbines = (17,504,000,000 kWh/year)/(10,577,700 kWh/year)
  • Number of turbines = 1654
To calculate the area required for 1654 turbines:
  • Area required for 1654 turbines = Number of turbine × area required for each turbine
  • Area required for 1654 turbines = 1654 × 1.35 km2
  • Area required for 1654 turbines = 2232.9 km2
To calculate the remaining of high suitable area:
  • Remaining of high suitable area = High suitable area - Area required for 1654 turbines
  • Remaining of high suitable area = 13,251.8 km2 − 2232.9 km2
  • Remaining of high suitable area = 11,018.9 km2
To calculate how much energy these turbines provide:
  • AEPtotal = Number of turbines × AEP for each turbine.
  • AEPtotal = 1654 × 10,577,700 kWh/year
  • AEPtotal = 17,495,515,800 kWh/year
To calculate the annual profit of 1654 turbines:
  • The annual profit from 1654 turbine = 1654 turbine × annual profit (Pa) from one turbine at a height of 200 m = 1654 × $856,793.7 USD.
  • The annual profit from 1654 turbine = $1,417,136,779.8 USD
Calculating the cost of 1654 turbines:
  • wind turbine farm in Mafraq at a height of 200 m costs = number of turbines × cost of the turbine.
  • wind turbine farm in Mafraq at a height of 200 m costs = 1654 × $4 million USD.
  • wind turbine farm in Mafraq at a height of 200 m costs = $6,616,000,000 USD
  • 1654 turbines are required at a height of 200 m to cover all of Jordan’s electricity needs. The Annual profit will be $1,417,136,779.8 USD, with cost estimation $6,616,000,000

References

  1. Rajakumar, D.G.; Nagesha, N. Sustainability Through Renewable Energy: Economic and Environmental Analysis of Wind Farms in Karnataka. Int. J. Emerg. Technol. Adv. Eng. 2012, 2, 396–402. [Google Scholar]
  2. IRENA. Global Renewables Outlook: Energy transformation 2050; Dhabi, A., Ed.; International Renewable Energy Agency: Abu Dhabi, United Arab Emirates, 2020. [Google Scholar]
  3. WEC. World Energy Insights Brief 2019; Dhabi, A., Ed.; World Energy Council: London, UK, 2019. [Google Scholar]
  4. PT. Powering Tomorrow; the Winds of Change and the Power Network. Article 4/6. Arnhem: Det Norske Veritas (DNV). 2020. Available online: https://www.dnv.com/publications/the-winds-of-change-and-the-power-network-186589 (accessed on 20 April 2021).
  5. Marcu, I.; Suciu, G.; Bălăceanu, C.; Vulpe, A.; Drăgulinescu, A.-M. Arrowhead technology for digitalization and automation solution: Smart cities and smart agriculture. Sensors 2020, 20, 1464. [Google Scholar] [CrossRef] [PubMed] [Green Version]
  6. Al-Kofahi, S.D.; Gharaibeh, A.A.; Bsoul, E.Y.; Othman, Y.A.; Hilaire, R.S. Investigating domestic gardens’ densities, spatial distribution and types among city districts. Urban. Ecosyst. 2019, 22, 567–581. [Google Scholar] [CrossRef]
  7. Asarpota, K.; Nadin, V. Energy strategies, the urban dimension, and spatial planning. Energies 2020, 13, 3642. [Google Scholar] [CrossRef]
  8. Chigudu, A.; Chirisa, I. The quest for sustainable spatial planning framework in Zimbabwe and Zambia. Land Use Policy 2020, 92, 104442. [Google Scholar] [CrossRef]
  9. Bafarasat, A.Z. Reflections on the three schools of thought on strategic spatial planning. J. Plan. Lit. 2015, 30, 132–148. [Google Scholar] [CrossRef]
  10. Cajot, S.; Peter, M.; Bahu, J.M.; Guignet, F.; Koch, A.; Maréchal, F. Obstacles in energy planning at the urban scale. Sustain. Cities Soc. 2017, 30, 223–236. [Google Scholar] [CrossRef]
  11. Hiremath, R.B.; Shikha, S.; Ravindranath, N.H. Decentralized energy planning; modeling and application—A review. Renew. Sustain. Energy Rev. 2007, 11, 729–752. [Google Scholar] [CrossRef]
  12. van Dam, J.; Junginger, M.; Faaij, A.P. From the global efforts on certification of bioenergy towards an integrated approach based on sustainable land use planning. Renew. Sustain. Energy Rev. 2010, 14, 2445–2472. [Google Scholar] [CrossRef]
  13. Li, L. Optimal Coordination Strategies for Load Service Entity and Community Energy Systems Based on Centralized and Decentralized Approaches. Energies 2020, 13, 3202. [Google Scholar] [CrossRef]
  14. Qazi, A.; Hussain, F.; Rahim, N.A.; Hardaker, G.; Alghazzawi, D.; Shaba, K.; Haruna, K. Towards Sustainable Energy: A Systematic Review of Renewable Energy Sources, Technologies, and Public Opinions. IEEE 2019, 7, 63837–63851. [Google Scholar] [CrossRef]
  15. Stoeglehner, G.; Niemetz, N.; Kett, K.-H. Spatial dimensions of sustainable energy systems: New visions for integrated spatial and energy planning. Energy Sustain. Soc. 2011, 1, 1–9. [Google Scholar] [CrossRef] [Green Version]
  16. Mourmouris, J.C.; Potolias, C. A multi-criteria methodology for energy planning and developing renewable energy sources at a regional level: A case study Thassos, Greece. Energy Policy 2013, 52, 522–530. [Google Scholar] [CrossRef]
  17. Rawat, D.; Sauni, P. Importance and prospects of renewable energy: Emerging issues in India. Int. J. Art Humanit. Sci. 2015, 2, 11–18. [Google Scholar]
  18. Shahzad, U. The need for renewable energy sources. Int. J. Inf. Technol. Electr. Eng. 2015, 4, 16–19. [Google Scholar]
  19. Sen, S.; Ganguly, S. Opportunities, barriers and issues with renewable energy development–A discussion. Renew. Sustain. Energy Rev. 2017, 69, 1170–1181. [Google Scholar] [CrossRef]
  20. Lambert, J.G.; Hall, C.A.; Balogh, S.; Gupta, A.; Arnold, M. Energy, EROI and quality of life. Energy Policy 2014, 64, 153–167. [Google Scholar] [CrossRef] [Green Version]
  21. Sen, S.; Ganguly, S.; Das, A.; Sen, J.; Dey, S. Renewable energy scenario in India: Opportunities and challenges. J. Afr. Earth Sci. 2016, 122, 25–31. [Google Scholar] [CrossRef]
  22. Noorollahi, Y.; Yousefi, H.; Mohammadi, M. Multi-criteria decision support system for wind farm site selection using GIS. Sustain. Energy Technol. Assess. 2016, 13, 38–50. [Google Scholar] [CrossRef]
  23. Edomah, N.; Ndulue, G. Energy transition in a lockdown: An analysis of the impact of COVID-19 on changes in electricity demand in Lagos Nigeria. Glob. Transit. 2020, 2, 127–137. [Google Scholar] [CrossRef]
  24. Prasad, G.; Stone, A.; Hughes, A.; Stewart, T. Towards the Development of an Energy-Water-Food Security Nexus Based Modelling Framework as a Policy and Planning Tool for South Africa; University of Cape Town: Cape Town, South Africa, 2012. [Google Scholar]
  25. IRENA. REmap 2030: A Renewable Energy Roadmap; Dhabi, A., Ed.; International Renewable Energy Agency: Abu Dhabi, United Arab Emirates, 2014. [Google Scholar]
  26. IRENA. Rethinking Energy; Dhabi, A., Ed.; International Renewable Energy Agency: Abu Dhabi, United Arab Emirates, 2014. [Google Scholar]
  27. Koivisto, M.; Gea-Bermúdez, J.; Kanellas, P.; Das, K.; Sørensen, P. North Sea region energy system towards 2050: Integrated offshore grid and sector coupling drive offshore wind power installations. Wind Energy Sci. 2020, 5, 1705–1712. [Google Scholar] [CrossRef]
  28. Yüksel, S.; Dinçer, H.; Uluer, G. The Role of Technological Development on Renewable Energy Usage: An Econometric Analysis for G7 Countries. In Handbook of Research on Sustainable Supply Chain Management for the Global Economy; Akkucuk, U., Ed.; IGI Global: Hershey, PA, USA, 2020; pp. 136–153. [Google Scholar]
  29. WWEA. World Wind Energy Association, World Wind Energy Association. 2014. Available online: https://wwindea.org/ (accessed on 26 February 2019).
  30. CWEA. Statistics of Chinese Installed Wind Power Generation Capacity 2018; Chinese Wind Energy Association: Beijing, China, 2019. [Google Scholar]
  31. WWE Association. World Wind Energy Association, 25 February 2019. Available online: https://library.wwindea.org (accessed on 28 December 2019).
  32. SWEA. 100 Percent Renewable Electricity by 2040 Wind Power: Combating Climate Change; Swedish Wind Energy Association: Stockholm, Sweden, 2019; pp. 1–30. [Google Scholar]
  33. Saidur, R.; Rahim, N.; Islam, M.; Solangi, K. Environmental impact of wind energy. Renew. Sustain. Energy Rev. 2011, 15, 2423–2430. [Google Scholar] [CrossRef]
  34. Siyal, S.H.; Mortberg, U.; Mentis, D.; Welsch, M.; Babelon, I.; Howells, M. Wind energy assessment considering geographic and environmental restrictions in Sweden: A GIS-based approach. Energy 2015, 83, 447–461. [Google Scholar] [CrossRef]
  35. Szurek, M.; Blachowski, J.; Nowacka, A. GIS-Based Method For Wind Farm Location Multi-Criteria Analysis. Min. Sci. 2014, 21, 65–81. [Google Scholar]
  36. Loring, J.M. Wind energy planning in England, Wales and Denmark: Factors influencing project success. Energy Policy 2007, 35, 2648–2660. [Google Scholar] [CrossRef]
  37. Rinne, E.; Holttinen, H.; Kiviluoma, J.; Rissanen, S. Effects of turbine technology and land use on wind power resource potential. Nat. Energy 2018, 3, 494–500. [Google Scholar] [CrossRef]
  38. Villacreses, G.; Gaona, G.; Martínez-Gomez, J.; Jijon, D.J. Wind Farms Suitability Location Using Geographical Information System (GIS), Based on Multi-Criteria Decision Making (MCDM) Methods: The Case of Continental Ecuador. Renew. Energy 2017, 109, 275–286. [Google Scholar] [CrossRef]
  39. Watson, J.J.; Hudson, M.D. Regional Scale wind farm and solar farm suitability assessment using GIS-assisted multi-criteria evaluation. Landsc. Urban Plan. 2015, 138, 20–31. [Google Scholar] [CrossRef]
  40. Poggi, F.; Firmino, A.; Amado, M. Moving Forward on Sustainable Energy Transitions: The Smart Rural Model. Eur. J. Sustain. Dev. 2015, 4, 43. [Google Scholar] [CrossRef]
  41. Poggi, F.; Firmino, A.; Amado, M. Planning renewable energy in rural areas: Impacts on occupation and land use. Energy 2018, 155, 630–640. [Google Scholar] [CrossRef]
  42. Qaddah, A.A.; Abdelwahed, M.F. GIS-based site-suitability modeling for seismic stations: Case study of the northern Rahat volcanic field, Saudi Arabia. Comput. Geosci. 2015, 83, 193–208. [Google Scholar] [CrossRef]
  43. Latinopoulos, D.; Kechagia, K. A GIS-based multi-criteria evaluation for wind farm site selection. A regional scale application in Greece. Renew. Energy 2015, 78, 550–560. [Google Scholar] [CrossRef]
  44. Krarti, M.; Dubey, K.; Howarth, N. Towards energy landscapes–Pathfinder for sustainable wind power locations. Energy 2017, 134, 611–621. [Google Scholar]
  45. Haaren, R.V.; Fthenakis, V. GIS-based wind farm site selection using spatial multi-criteria analysis (SMCA): Evaluating the Case For New York State. Renew. Sustain. Energy Rev. 2011, 15, 3332–3340. [Google Scholar] [CrossRef]
  46. Chamanehpour, E. Site Selection of Wind Power Plant Using Multi-Criteria Decision-Making Methods in GIS: A Case Study. Comput. Ecol. Softw. 2017, 7, 49–64. [Google Scholar]
  47. Effat, H.A. Spatial Modeling of Optimum Zones for Wind Farms Using Remote Sensing and Geographic Information System, Application in the Red Sea, Egypt. J. Geogr. Inf. Syst. 2014, 6, 358–374. [Google Scholar] [CrossRef] [Green Version]
  48. Janke, J.R. Multicriteria GIS modeling of wind and solar farms in Colorado. Renew. Energy 2010, 35, 2228–2234. [Google Scholar] [CrossRef]
  49. Al-Yahyai, S.; Charabi, Y.; Gastli, A.; Al-Badi, A. Wind Farm Land Suitability Indexing Using Multi-Criteria Analysis. Renew. Energy 2012, 44, 80–87. [Google Scholar] [CrossRef]
  50. Ali, S.; Taweekun, J.; Techato, K.; Waewsak, J.; Gyawali, S. GIS based site suitability assessment for wind and solar farms in Songkhla, Thailand. Renew. Energy 2019, 132, 1360–1372. [Google Scholar] [CrossRef]
  51. Anagreh, Y.; Bataineh, A. Renewable energy potential assessment in Jordan. Renew. Sustain. Energy Rev. 2011, 15, 2232–2239. [Google Scholar] [CrossRef]
  52. GWA. Global Wind Atlas, DTU powered by WAsP. 2019. Available online: https://globalwindatlas.info/ (accessed on 25 January 2021).
  53. DOS. Population Projections for the Kingdom’s Residents during the Period 2015–2050; Jordan Department of Statistics: Amman, Jordan, 2016.
  54. Al-Addous, M.; Jaradat, M.; Albatayneh, A.; Wellmann, J. The Significance of Wind Turbines Layout Optimization on the Predicted Farm Energy Yield. Atmosphere 2020, 11, 117. [Google Scholar] [CrossRef] [Green Version]
  55. Ministry of Energy and Mineral Resources. 2018. Available online: http://memr.gov.jo/Default.aspx (accessed on 16 April 2021).
  56. BP. Statistical Review of World Energy; British Petroleum: London, UK, 2020. [Google Scholar]
  57. Farooq, M.U.; Mahmood, A.; Sidhu, G.A.S.; Ullah, M.N.; Khan, Z.A. Wind Power and Smart Grid as an Environmental Obligation in Context of Energy Security for Pakistan. J. Basic Appl. Sci. Res. 2013, 9, 518–527. [Google Scholar]
  58. NEPCO. Annual Report; National Electric Power Company: Amman, Jordan, 2017. [Google Scholar]
  59. NEPCO. National Electrical Power Company, May 2019. Available online: http://www.nepco.com.jo/en/Default_en.aspx (accessed on 17 April 2019).
  60. Abu-Rumman, G.K.A.; Khdair, S. Current status and future investment potential in renewable energy in Jordan: An overview. Heliyon 2020, 6, e03346. [Google Scholar] [CrossRef] [PubMed]
  61. WB. The World Bank. 2019. Available online: https://www.worldbank.org/ (accessed on 10 March 2021).
  62. Kandah, A. The Impact of Public Debt on Economic Growth in Jordan; The Jordan Times: Amman, Jordan, 2020. [Google Scholar]
  63. TE. Jordan GDP Annual Growth Rate; Trading Economics: New York, NY, USA, 2020. [Google Scholar]
  64. Saaty, T.L. How to make a decision: The analytic hierarchy process. Interfaces 1994, 24, 19–43. [Google Scholar] [CrossRef] [Green Version]
  65. Bennui, A.; Rattanamanee, P.; Puetpaiboon, U.; Phukpattaranont, P.; Chetpattananondh, K. Site Selection for Large Wind Turbine Using GIS. In Proceedings of the PSU-UNS International Conference on Engineering and Environment, Phuket, Thailand, 10 May 2007; pp. 561–566. [Google Scholar]
  66. Jahangiri, M.; Ghaderi, R.; Haghani, A.; Nematollahi, O. Finding the best locations for establishment of solar-wind power stations in Middle-East using GIS: A review. Renew. Sustain. Energy Rev. 2016, 66, 38–52. [Google Scholar] [CrossRef]
  67. Demirdelen, T.; Ekinci, F.; Mert, B.; Karasu, İ.; Tümay, M. Green touch for hydrogen production via alkaline electrolysis: The semi-flexible PV panels mounted wind turbine design, production and performance analysis. Int. J. Hydrogen Energy 2020, 45, 10680–10695. [Google Scholar] [CrossRef]
  68. Sun, J.; Sun, X.; Huang, D. Aerodynamics of vertical-axis wind turbine with boundary layer suction–Effects of suction momentum. Energy 2020, 209, 118446. [Google Scholar] [CrossRef]
  69. Liserre, M.; Cárdenas, R.; Molinas, M. Overview of multi-MW wind turbines and wind parks. IEEE Trans. Ind. Electron. 2011, 58, 1081–1095. [Google Scholar] [CrossRef]
  70. Pourrajabian, A.; Mirzaei, M.; Ebrahimi, R.; Wood, D. Effect of air density on the performance of a small wind turbine blade: A case study in Iran. J. Wind Eng. Ind. Aerodyn. 2014, 126, 1–10. [Google Scholar] [CrossRef]
  71. Adhikari, S.; Bhattacharya, S. Vibrations of wind-turbines considering soil-structure interaction. Wind Struct. 2011, 14, 85–112. [Google Scholar] [CrossRef] [Green Version]
  72. El-Moghrabi, L.; Masri, I. Environmental and Social Impact Assessment (ESIA) for Shobak 45 MW Wind Power Project in Ma’an; ECO Consult: Amman, Jordan, 2017. [Google Scholar]
  73. Heras, J.; Martín, M. Social issues in the energy transition: Effect on the design of the new power system. Appl. Energy 2020, 278, 115654. [Google Scholar] [CrossRef]
  74. Gharaibeh, A.A.; Shaamala, A.H.; Ali, M.H. Multi-Criteria Evaluation for Sustainable Urban Growth in An-Nuayyimah, Jordan; Post War Study. Procedia Manuf. 2020, 44, 156–163. [Google Scholar] [CrossRef]
  75. Jaradat, R.A.; Nusier, O.K.; Awawdeh, M.M.; Al-Qaryouti, M.Y.; Fahjan, Y.M.; Al-Rawabdeh, A.M. Deaggregation of Probabilistic Ground Motions for Selected Jordanian Cities. Jordan J. Civ. Eng. 2008, 2, 172–196. [Google Scholar]
  76. Chai, J.; Liu, J.N.K.; Ngai, E.W.T. Application of decision-making techniques in supplier selection: A systematic review of literature. Expert Syst. Appl. 2013, 40, 3872–3885. [Google Scholar] [CrossRef]
  77. Leal, J. AHP-express: A simplified version of the analytical hierarchy process method. MethodsX 2020, 7, 100748. [Google Scholar] [CrossRef] [PubMed]
  78. Lantz, E.J.; Roberts, J.O.; Nunemaker, J.; DeMeo, E.; Dykes, K.L.; Scott, G.N. Increasing Wind Turbine Tower Heights: Opportunities and Challenge; National Renewable Energy Laboratory: Golden, CO, USA, 2019.
  79. Giani, P.; Tagle, F.; Genton, M.G.; Castruccio, S.; Crippa, P. Closing the gap between wind energy targets and implementation for emerging countries. Appl. Energy 2020, 269, 115085. [Google Scholar] [CrossRef]
  80. Al-Masri, H.M.; AbuElrub, A.; Ehsani, M. Optimization and Layout of a Wind Farm Connected to a Power Distribution System. In Proceedings of the 2018 IEEE International Conference on Industrial Technology (ICIT), Lyon, France, 20 February 2018; pp. 1049–1054. [Google Scholar]
  81. Al-Soud, M. Assessment of wind characteristics and wind potential energy yield in the Jordanian southern region. J. Energy Power Eng. 2015, 9, 348–357. [Google Scholar]
  82. Hamzeh, A.; Awad, M. Wind power generation in Jordan: Current situation and future plans. In The Age of Wind Energy. Innovative Renewable Energy; Milborrow, A.S.a.D., Ed.; Springer: Berlin/Heidelberg, Germany, 2020; pp. 63–77. [Google Scholar]
  83. IRENA. Future of Wind: Deployment, Investment, Technology, Grid Integration, and Socioeconomic Aspects (A Global Energy Transformation Paper); Dhabi, A., Ed.; International Renewable Energy Agency: Abu Dhabi, United Arab Emirates, 2019. [Google Scholar]
  84. Daniels, L.; Hoistad, C.; Turner, D. WINDUSTRY. 2019. Available online: http://www.windustry.org (accessed on 13 April 2019).
  85. PSC. Shobak 45MW Wind Power Project, Shobak Wind Energy; Jordan Wind Project Company PSC: Amman, Jordan, 2017.
  86. The National Renewable Energy Laboratory. NREL Transforming Energy. 2018. Available online: https://www.nrel.gov/ (accessed on 13 April 2019).
  87. NWW. National Wind Watch, National Wind Watch. Available online: https://www.windpowerengineering.com/windpower-profitability-and-break-even-point-calculations/ (accessed on 10 April 2021).
  88. Solar Reviews. 2019. Available online: https://www.solarreviews.com/ (accessed on 28 May 2019).
  89. Tafarte, P.; Kanngießer, A.; Dotzauer, M.; Meyer, B.; Grevé, A.; Millinger, M. Interaction of electrical energy storage, flexible bioenergy plants and system-friendly renewables in wind-or solar PV-dominated regions. Energies 2020, 13, 1133. [Google Scholar] [CrossRef] [Green Version]
  90. Weinstein, M. Future Scenarios for Energy Security and Sustainable Desalination in Jordan. Master’s Thesis, KTH School of Industrial Engineering and Management, Stockholm, Sweden, 2020. [Google Scholar]
  91. Hou, H.; Xu, T.; Wu, X.; Wang, H.; Tang, A.; Chen, Y. Optimal capacity configuration of the wind-photovoltaic-storage hybrid power system based on gravity energy storage system. Appl. Energy 2020, 271, 115052. [Google Scholar] [CrossRef]
  92. 11 countries leading the charge on renewable Energy. 2021. Available online: https://www.climatecouncil.org.au/11-countries-leading-the-charge-on-renewable-energy/ (accessed on 21 March 2021).
  93. Saraswat, S.; Digalwar, A.; Yadav, S.; Kumar, G. MCDM and GIS based modelling technique for assessment of solar and wind farm locations in India. Renew. Energy 2021, 169, 865–884. [Google Scholar]
  94. Ryberg, D.; Tulemat, Z.; Stolten, D.; Robinius, M. Uniformly constrained land eligibility for onshore European wind power. Renew. Energy 2020, 146, 921–931. [Google Scholar] [CrossRef]
  95. Gonçalves, S.; Rodrigues, T.; Chagas, A. The impact of wind power on the Brazilian labor market. Renew. Sustain. Energy Rev. 2020, 128, 109887. [Google Scholar] [CrossRef]
  96. Bergmann, A.; Hanley, N.; Wright, R. Valuing the attributes of renewable energy investments. Energy Pol. 2006, 34, 1004–1014. [Google Scholar] [CrossRef]
  97. Jones, C.; Munday, M. Capital ownership, innovation and regional development policy in the economic periphery: An energy industry case. Local Econ. 2020, 35, 545–565. [Google Scholar] [CrossRef]
  98. Griffiths, S.; Sovacool, B. Rethinking the future low-carbon city: Carbon neutrality, green design, and sustainability tensions in the making of Masdar City. Energy Res. Soc. Sci. 2020, 62, 101368. [Google Scholar] [CrossRef]
  99. Elsisi, M.; Tran, M.; Mahmoud, K.; Lehtonen, M.; Darwish, M. Robust Design of ANFIS-Based Blade Pitch Controller for Wind Energy Conversion Systems Against Wind Speed Fluctuations. IEEE Access 2021, 9, 37894–37904. [Google Scholar] [CrossRef]
  100. Gharaibeh, A.A.; Jaradat, R.A.; Okour, Y.F.; Al-Rawabdeh, A.M. Landscape Perception and Landscape Change for the City of Irbid, Jordan. J. Archit. Plan. 2017, 29, 89–104. [Google Scholar]
  101. Tazay, A.F.; Ibrahim, A.M.A.; Noureldeen, O.; Hamdan, I. Modeling, control, and performance evaluation of grid-tied hybrid PV/wind power generation system: Case study of Gabel El-Zeit region, Egypt. IEEE Access 2020, 8, 96528–96542. [Google Scholar] [CrossRef]
  102. Leahy, P.; McKeogh, E.; Murphy, J.; Cummins, V. Development of a viability assessment model for hydrogen production from dedicated offshore wind farms. Int. J. Hydrogen Energy 2020. [Google Scholar]
  103. Russell, A.; Firestone, J.; Bidwell, D.; Gardner, M. Place meaning and consistency with offshore wind: An island and coastal tale. Renew. Sustain. Energy Rev. 2020, 132, 110044. [Google Scholar] [CrossRef]
  104. Rohe, S. The regional facet of a global innovation system: Exploring the spatiality of resource formation in the value chain for onshore wind energy. Environ. Innov. Soc. Transit. 2020, 36, 331–344. [Google Scholar] [CrossRef]
Figure 1. The Hashemite Kingdom of Jordan, Source: GIS World Imagery, GeoEye IKONOS.
Land 10 00442 g001
Figure 2. Base maps of Jordan containing necessary information layer inputs; (a) Slope Map, (b) Aspect Map, (c) Wind Speed (m/s) at a height of 50 m Map, (d) Wind Speed (m/s) at a height of 100 m Map, (e) Wind Speed (m/s) at a height of 200 m Map, (f) Wind Power Density (W/m2) at a height of 50 m Map, (g) Wind Power Density (W/m2) at a height of 100 m Map, (h) Wind Power Density (W/m2) at a height of 200 m Map, (i) land-use/landcover LULC Map, (j) Euclidean Distance Main Road Map, (k) Euclidean Distance Railway Map, (l) Main Electrical Power Lines Map, (m) Potential Earthquake Hazard Map.
Land 10 00442 g002
Figure 3. Rating maps of (a) Slope Map, (b) Aspect Map, (c) Wind Speed (m/s) at a height of 50 m Map, (d) Wind Speed (m/s) at a height of 100 m Map, (e) Wind Speed (m/s) at a height of 200 m Map, (f) Wind Power Density (W/m2) at a height of 50 m Map, (g) Wind Power Density (W/m2) at a height of 100 m Map, (h) Wind Power Density (W/m2) at a height of 200 m Map, (i) Environmental Reserves Buffer Location Maps, (j) Airports Buffer Location Map, (k) Euclidean Distance Main Road Map, (l) Euclidean Distance Railway Map, (m) Main Electrical Power Lines Map, (n) Potential Earthquake Hazard Map.
Land 10 00442 g003
Figure 4. Land Area Percentage of total suitability area at three heights for the whole national area.
Land 10 00442 g004
Figure 5. Final wind farm suitability locations at three heights; (a) 50 m, (b) 100 m, (c) 200 m. White areas are the areas excluded from the study due to restrictions on the use of wind turbine farms.
Land 10 00442 g005
Figure 6. The relationship between turbine hub height, annual profit (solid trend line), and turbine cost (dashed trend line) for the Mafraq Governorate.
Land 10 00442 g006
Table 1. Land-use/Landcover constraints- unsuitable areas.
CriteriaSub-CriteriaData (Unsuitable Areas)
Land-use/LandcoverEnvironmental preservationsArea in distance < 2000 m
Proximity to urban areasArea in distance < 2000 m
Proximity to water bodiesArea in distance < 1000 m
Proximity to forestArea in distance < 2000 m
Quarries Area in distance < 200 m
Proximity to commercial airportsArea in distance < 2500 m
Proximity to military airportsArea in distance < 15,000 m
Table 2. Factors used to determine suitability for wind farm locations considering environmental and geospatial data goals.
CriteriaSuitability Scores (0 Is Unsuitable and 5 Is Most Suitable) and Weigh Values for Each Criterion Factors Weights *
012345
Proximity to Roads<500 m>8001 m6001–8000 m4001–6000 m2001–4000 m501–2000 m15
Proximity to Railway<250 m---->250 m5
Proximity to Electrical Power Lines<250 m>8001 m6001–8000 m4001–6000 m2001–4000 m250–2000 m10
Slope>15°10.1–15°-5.1–10°-0–5°10
AspectS-WS, E-S-E, E-N-N, N-W, W, Flat5
Wind Speed<5 m/s5–6 m/s6–7 m/s7–8 m/s 8–9 m/s>9 m/s30
Wind Power Density<200 W/M201–400 W/M401–600 W/M601–800 W/M801–1000 W/M>1000 W/M20
Proximity to faults **0.61–0.7 g0.51–0.6 g0.41–0.5 g0.31–0.4 g0.21–0.3 g0.11–0.2 g5
Total 100%
* The weights are based on AHP matrix. The sum of the factor weights equals 100. ** Potential Earthquake Hazard (Peak Ground Acceleration) (1 g = 9.81 m/s2).
Table 3. Feasibility of Installing Wind Turbines in the Northern Region/Mafraq Governorate for High Suitable Areas Class at Three Heights (50 m, 100 m, and 200 m).
Hub Height (m)High Suitable Areas (km2)Rotor Diameter, D (m)Equation *Area For each Turbine (km2)Number of Turbines Required to Cover all Needs of JordanInstallation Area (km2)Remaining Area (km2)AEP Total (kWh/year)The Annual Profit (Billion $ USD)Total Cost Estimation (Billion $ USD)
=6D × 10D **=Jordan’s Electrical Annual Energy Consumption/Annual Energy Production for Each Turbine=Number of Turbine × Area Required for Each Turbine=High Suitable Area—Total Area Required for Turbines=Number of Turbines × AEP for Each Turbine.=Number of Turbines × Annual Profit (Pa) for Each Turbine=Number of Turbines × Cost of Each Turbine
502349.0500.155709856.351492.6517,503,794,000$1.348 $7.422
1006768.21000.6028541712.45055.817,500,728,000$1.313 $8.562
20013,251.81501.3516542232.911,018.917,495,515,800$1.417 $6.616
* Appendix H has the full calculations. ** National Wind Watch; a coalition of groups and individuals working to save rural and wild places from heedless industrial wind energy development. National Wind Watch, Inc, “Presenting the facts about industrial wind power”. Main website: https://www.wind-watch.org/faq-size.php (accessed on 25 January 2021). Calculations link: https://www.windpowerengineering.com/windpower-profitability-and-break-even-point-calculations/ (accessed on 16 April 2021) [87].
Publisher’s Note: MDPI stays neutral with regard to jurisdictional claims in published maps and institutional affiliations.

