Abstract
Nowadays, anthropic pressures are continuously transforming the landscape mosaic, leading to issues related to habitat fragmentation and the loss of ecosystem functions. In this study, a landscape-change analysis over the 1990–2018 timeframe of the case study area of Metropolitan City of Naples (MCN) (southern Italy) was performed to evaluate trends, causes, and results of the landscape transformations. We preliminary performed a spatial–temporal fragmentation-expansion analysis in the MCN through the landscape expansion index (LEI), and subsequently determined the impacts on the eco-mosaic. The multitemporal analysis (1990–2018) highlighted an urban expansion in the MCN. The LEI analysis depicted a dual tendency in the increased fragmenting of the MCN’s eco-mosaic. The urban landscape has compacted in the hollow areas, and in the meantime there has been a sprawling expansion of the urban fabric. The most impacted land-use category was “Agricultural areas”, of which 57.42 km2 have been lost in 28 years, with negative impacts on ecological connectivity. Finally, we investigated the relationship between the increase and type of landscape fragmentation and the demographic flows over time. We found that the areas affected by demographic growth were the same ones characterized by an edge expansion of the urban patterns. Conversely, where there has been a demographic decrease, an infilling behavior of urban fabric has been noted. This study highlights a possible correlation between the expansion type of the urban fabric and the demographic flows in a region as a main driver. The outcome of 30-year transformations is the actual ecological network in which Core Areas, Buffer Zones, and Primary Connections covered 35.3%, 11.1%, and 39.6%, respectively, of the total surface of the MCN, covering an overall area of 1008.4 km2.
1. Introduction
Several fast processes reducing resources and biodiversity of the ecosphere have characterized the last decades, and also have led to cultural-diversity erosion, defined as the loss of knowledge and identity resulting from the combination of historical and ongoing environmental/land-use processes [1,2]. The rhythms of human-related processes, which are moving progressively further from ecosystem scale and the land-use conversion, are continuously transforming the eco-mosaic with broader implications regarding the habitat fragmentation and loss of ecosystem functions [3]. Furthermore, fragmentation impacts are likely to be exacerbated by the effects of climate change, since the resilience of habitats is reduced [4]. In this context, new scientific knowledge is required to analyze landscape changes and predict future scenarios that may have key roles in the development of sustainable land-management strategies and landscape preservation.
Structure, functioning, and changes are the main features identifying landscape mosaics [5,6], and the pattern analysis represents an important tool to understand dynamism in the eco-mosaic systems [7,8]. Landscape mosaic configuration and the dynamic change processes of patterns through time have been important in studying landscape ecology [7,9,10,11]. Over time, transformations, occurring in patterns, change the configuration of landscape mosaic, and result in different conformations of ecological networks with different and specific features [6,12].
In the Anthropocene, main forces rearranging and shaping landscape patterns consist of social, environmental, economic, and institutional impulses [6,13,14], identifiable with the urbanization process [15,16,17,18,19,20].
The urbanization process triggers the gradual transformations of natural ecosystems into seminatural and semiartificial ecosystems, until they become artificial ecosystems, with consequent loss of functionality in the ecological network [18,19,21]. The provision of ecosystem services, functionality, permeability to species flow, and the healthiness of ecological processes are also influenced by the eco-mosaic and ecological-network fragmentation as a result of natural disturbances and/or human activities [6,18,22,23]. The main changes in the ecological network include isolation of natural patches, with subsequent increasing edge effects, and decline in patch size with loss of habitats [6,24]. Rapid and uncontrolled urbanization may also cause socioeconomic problems like rural economic stability and lifestyle loss, as well as continuous expansion into agricultural and natural areas [19,25,26].
Seto et al. [27] predicted that, if urban expansion trends continue at the current rate, by 2030 urban land cover will increase to about three times with respect to the global urban area of 2000, with considerable loss of habitats. Their global-scale forecast analyses also suggested that Africa and Europe are expected to have the highest percentages of Alliance for Zero Extinction (AZE) species to be impacted by urban expansion.
As concerns the Italian context, the Metropolitan City of Naples (MCN) records the highest population density. In last two decades, the urban growth in the MCN caused the creation of a continuous urban pattern where undifferentiated suburbs suffer from both socioeconomic and environmental disorders [28]. Given this background, in this study, the MCN was chosen as the research area to investigate the extent to which the environmental eco-mosaic has been influenced by landscape changes over time and related to demographic modeling. The aims of this study were: (i) the spatial and temporal (1990–2018) evaluation of fragmenting expansion in the MCN’s eco-mosaic; (ii) the determination of occurred impacts on the landscape and ecological mosaic due to fragmentation in the last three decades; (iii) the identification of the ecological network in the MCN as a result of long-term changes; and (iv) the evaluation of the relationship between the increase in fragmenting and the demographic flows over time.
2. Methods
2.1. Study Area
The study area was the Metropolitan City of Naples (MCN), which is located in southern Italy (Figure 1). It is composed of 92 municipalities, extending over 1173.30 km2 with a resident population of 3,084,890 inhabitants. These features make the MCN the first urban district in Italy for inhabitant density [28,29]. In fact, 53.17% of the entire Campania regional population resides in its territory, with a population density of approximately 2.629 inhabitants/km2 [30]. Despite the strong anthropic pressure, an extraordinary variety of valuable landscape persists in the MCN [28,29]. This area has a great intrinsic value, due to the complexity of territorial patches, the presence of valuable landscapes, and many economic, cultural, and geo-environmental resources [28,31,32]. Among the main natural elements characterizing the MCN landscape are the volcanic complex of Mount Somma-Vesuvius, the volcanic area of Phlegrean Fields, and the plain that extends into the neighboring province of Caserta and laps the first slopes of the Partenio Mts. and the Lattari Mts. [28,31]. The morphological unit north of Naples is constituted by the hill of Camaldoli, which slopes down to the Campi Flegrei.
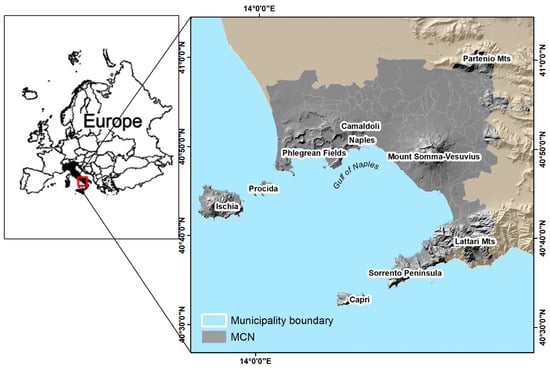
Figure 1.
Study-area map: the Metropolitan City of Naples (MCN), located in Southern Italy.
The marine ecosystem and the Neapolitan Archipelago, with the main islands of Ischia, Capri, and Procida, are of considerable historical, landscape, and ecological importance [31,33]. This territory is characterized by a widespread historical–archaeological heritage in an urban fabric developed without rules. The municipalities in the south of the MCN were built on ancient texture without taking into account adequate urban planning, as in the cases of Pompei, Herculaneum, Torre Annunziata, and Portici.
2.2. Data
Available data used in this study were obtained starting with the Corine Land Cover (CLC) 1990 [34] and 2018 [35] raster maps, the Carta della Natura della Regione Campania 2018 (scale 1: 25,000) [36], and Tree Cover Density 2018 [37]. The fragmentation map, the subsequent spatial analyzes, and the ecological network map were carried out with the open-source software Quantum GIS [38].
2.3. Spatial Analysis
Characterizing a landscape, assessing the ecological connections, and quantifying the structural changes over time has become possible with the implementation of geographic information system (GIS) techniques [7]. The GIS environment has become a very central tool in landscape analysis because of its efficiency in the preparation and management of geo-spatial information, and for its effectiveness in data visualization [39].
The FragScape tool [40], a Qgis plugin that works with vector and raster, was used to process the Corine Land Cover 1990 and Corine Land Cover 2018 raster maps, carrying out an analysis of the landscape mosaic and compositional changes over time (1990–2018) [6] using differences in land cover as input data. Polygons referring to CLC artificial categories (“1. Artificial Surfaces”—except “1.4.1 Green urban areas”), or otherwise not referring to natural and seminatural ones (“1.4.1 Green urban areas”; “2. Agricultural areas”; “3. Forest and seminatural areas”; “4. Wetlands”; “5. Water bodies”), were selected for fragmenting in the two considered years (1990 and 2018). The landscape expansion index (LEI) was calculated using the new patches generated by the landscape-changes analysis [7,41]. The LEI determination was carried out by creating a vector file and a buffer of 10 m around each new artificial patch. Following the methodology described by Liu et al. [7], a value between 0 and 100 was assigned to each patch, in order to evaluate the urban-expansion type that occurred in the last 28 years in the MCN. The LEI calculation was performed by creating a buffer around the polygons generated by the multitemporal fragmentation analysis, and considered the relationship between the buffer overlap areas and the pre-existing fragmenting patches, as in the following Equation (1) [7]:
where Ao is the overlapping area between the buffer and the pre-existing patch, and Av is the area of the buffer that does not overlap with any patch. Three types of expansion were highlighted based on the value of the LEI: infilling (100 ≥ LEI > 50), edge expansion (50 ≥ LEI > 0), and outlying (LEI = 0) [6,7,41]. Once the value of the LEI was determined, the mean expansion index (MEI) and area-weighted mean expansion index (AWMEI) were calculated to improve the urban-expansion analysis. The MEI was obtained by averaging the LEI of all patches, and the AWMEI was computed simply as an area-weighted mean, as described in Liu et al. [7].
2.4. Impacts on the Eco-Mosaic
The impact of urban expansion on the eco-mosaic was assessed considering land-use changes from natural and seminatural to urban uses over time (refer to Section 2.3). The new fragmenting patches (refer to Section 2.3) were employed to study which land uses have been degraded, by overlapping them and the Corine Land Cover 1990 map. The overlapping areas were subsequently clipped to depict the eroded features over the course of 28 years in the MCN’s eco-mosaic.
2.5. Ecological Network
Recent works of landscape analysis and planning concerning Italian districts were taken as references in the MCN’s ecological-network assessment [6,29]. The 2018 ecological network was intended as a product of the action of the fragmenting occurred from 1990 to 2018.
A division of the study area into zones, distinct by level and naturalness value (which were assumed to be ecologically permeable [42]), was carried out [6,18,29] until Core Areas, Buffer Zones, and Primary Connections were identified [6,29]. Core Areas were identified by taking into account the Site of Community Interest (SIC) and Special Protection Areas (SPA) defined by the Council Directive 2006/105/Ec [43]. The polygons belonging to the “Official List of Protected Natural Areas” (EUAP), a list created and periodically updated by the Ministry of the Environment, and the protection of the territory and the sea [29] were added to the Core Areas. Polygons depicted in the Carta della Natura 2018 [36], having a value for “ecological_value” from “very high” to “very low”, which intercept the Core Areas and expand outside of them, were chosen for the Buffer Zones representation. Primary Connections were identified through the patches present in the Carta della Natura 2018, which consisted of complex and extensive agricultural systems, and through the Tree Cover Density 2018. In this way, the areas useful for the mobility of the species and genetic flows were identified [6,29].
2.6. Demographic Flows and Fragmentation Trend over Time
The population density data [30] was used to identify the resident flows in the MCN municipalities over the time interval considered. Population density in 1990 and 2018 were registered for each MCN municipality, and weighted with the resident populations in 1990 and 2018 [30] in order to obtain a nondimensional index. The two indices were compared by subtracting the oldest data from the most recent, and the resulting value was attributed to each municipality. Positive values indicated an increase in the resident population from 1990 to 2018, while negative values indicated the opposite. The data obtained were compared by superimposing the patches of increased fragmentation in the GIS environment.
3. Results
3.1. Multitemporal Analysis of MCN Landscape Transformations, 1990–2018
The comparison between the levels of the MCN’s eco-mosaic fragmentation, due to the expansion of the fragmenting areas at the expense of natural and seminatural patches in the two extremes of the time interval considered (1990–2018), allowed us to spatially analyze the diachronic development of the MCN.
In Figure 2, the evolution of fragmentation in the investigated timeline is shown. The resulting fragmenting in 2018 is represented with a black layer, while the 1990 fragmenting is depicted with grey-colored shapes (Figure 2). The two layers have been overlapped to highlight the differences that occurred in the 28 years (Figure 2). The resulting image shows the increase of fragmenting, represented by the black polygons that are not common and overlapped by the grey ones (Figure 2).
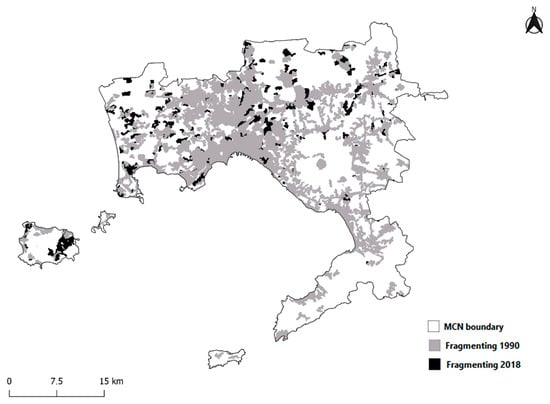
Figure 2.
Fragmenting of the Metropolitan City of Naples (MCN)’s eco-mosaic in 1990 (grey layer) and 2018 (black layer). The overlap between the two layers highlights the increase in fragmenting that occurred in the last three decades (black polygons).
The comparison shows that 196 new patches were added in 2018, contributing to an increase in the fragmentation of the eco-mosaic (Figure 2), for a total of 59.5 km2 (5.07% of the MCN’s surface). The average annual fragmenting area increase in the MCN in the considered time period was, on average, 2.1 km2/year (about 0.17%).
For each of the identified patches, the value of the LEI was calculated [6,7,41] to evaluate the type of expansion that took place over the time considered. The result of the spatial analysis made it possible to divide the added 196 polygons into three categories based on the LEI index: outlying, infilling, and edge-expansion calculated [6,7,41]. The result of the attribution of the expansion categories has been mapped in Figure 3 using three different colors to indicate the patches pertaining to each of the aforementioned categories. For each type of expansion, the relative areas and the percentage on the total area of increased fragmentation at the end of 2018 have been reported (Table 1). The percentages of the total number of new polygons were calculated in relation to the number of patches of each category (Table 1).
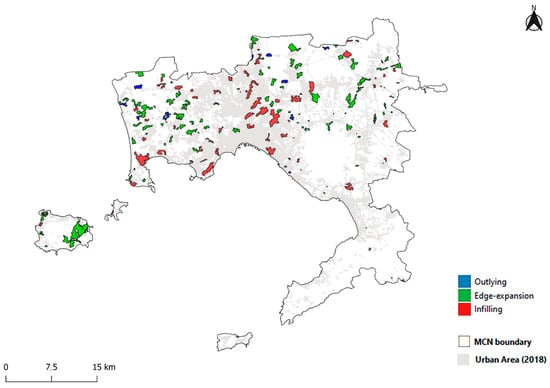
Figure 3.
Spatial occurrence of outlying, edge-expansion, and infilling types of fragmenting expansion over the 1990–2018 timeframe in the Metropolitan City of Naples (MCN), southern Italy.

Table 1.
Patterns of outlying, edge-expansion, and infilling over the 1990–2018 timeframe in Metropolitan City on Naples (MCN), Southern Italy.
From the calculation of the additional MEI and AWMEI indices [7], it appeared that the mean expansion index was 43.3 and area-weighted mean expansion index was 42.6.
3.2. Impacts on the Eco-Mosaic
Figure 4 shows the result of the vector Corine Land Cover 1990 overlap and cut, with the polygons representing the fragmenting increase, from the spatial analysis. This methodology made it possible to preserve information relating to the use of the land prior to the fragmentation expansion [34]. The Corine Land Cover provides a three-level categorization of soil usage with increasing detail [34,35]. The differences in the first level of classification have been represented in the map using different colors (Figure 4A), and the third-level differences have been highlighted in Figure 4B. To facilitate the understanding of Figure 4, a summary table of the data relating to the land-use categories that have been most affected over time has been created (Table 2). The results of the overlap between the map showing fragmenting over time (Figure 3) and the Corine Land Cover 1990 [34] have been summarized to highlight the eroded areas (km2 and in percentage) for each category of land use, both at the first level and in the detail of the third-level Corine Land Cover (Table 2).
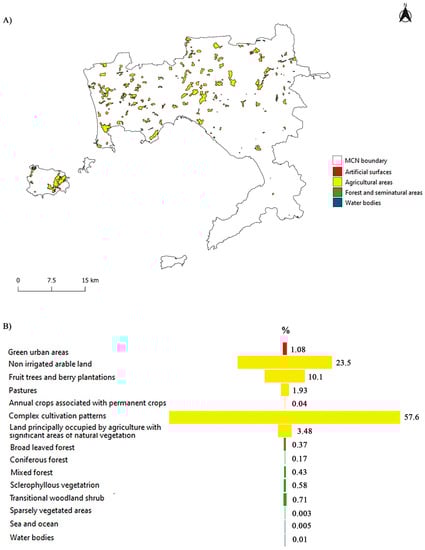
Figure 4.
Impact of fragmentation on the MCN’s eco-mosaic over time (1990–2018). (A) The first level of Corine Land Cover classification, spatially represented with different colors; (B) funnel chart showing the percentage of eroded CLC categories (third level).
Table 2.
Eroded area in km2 and in percentage of total fragmentation for each category of land use, for both the first- and third-level Corine Land Cover 1990.
The category of land use that has suffered the most from the impact of fragmenting expansion is “2. Agricultural areas”, of which 57.42 km2 have been lost over time, corresponding to 96.42% of the total areas that shifted to non-natural (refer to Section 2.3) land use (Table 2, Figure 4). In descending order, we found the categories “Forest and seminatural areas” (1.44 km2), “Artificial surfaces” (0.68 km2), and “Water bodies” (0.01 km2) (Table 2). The clear prevalence of agricultural areas is evident from the dominance of the yellow color used to describe them in Figure 4.
Inside the agricultural areas, the most affected category was “2.4.2 Complex cultivation patterns”, of which 36.35 km2 have been lost in three decades (Table 2). Another important area loss was registered for “2.1.1 Nonirrigated arable land”, for which a decrease of 12.18 km2 was highlighted (Table 2).
3.3. Ecological Network of the MCN
The identification of Core Areas, Buffer Zones, and Primary Connections made it possible to build the MCN’s ecological-network map (Figure 5). Core Areas, Buffer Zones, and Primary Connections covered 414.2 km2, 129.9 km2, and 464.3 km2, respectively, consisting of 35.3%, 11.1%, and 39.6%, respectively, of the total surface of the MCN in 2018. The entire ecological network of the MCN covered an area of 1008.4 km2, corresponding to 86.0% of the total MCN area. In accordance with Coppola et al. [29], the most extended Core Areas occurred in correspondence to: (i) Mount Somma-Vesuvius (where the national park of the Vesuvio volcano falls); (ii) Phlegrean Fields, Lattari Mts., and Partenio Mts. (which are regional parks); (iii) Ischia Island; and (iv) the Naples Hills’ Metropolitan Park (in which the Camaldoli Hill falls).
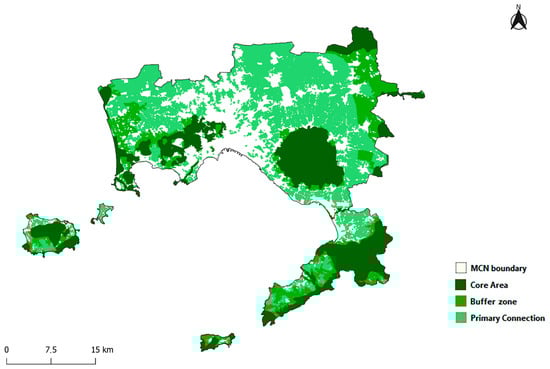
Figure 5.
Map of the Metropolitan City of Naples (MCN)’s ecological network, representing the spatial relationships between Core Areas, Buffer Zones, and Primary Connections.
3.4. Demographic Flows and Fragmentation Trend over Time
The demographic data indicated that an overall population growth in the MCN occurred from 1990 to 2018, with an increase of 84,976 individuals. The analysis of the demographic flow that took place from 1990 to 2018 is illustrated in Figure 6. Two different shades of gray were used to indicate the municipalities in which an increase or decrease in the population density was observed. The overlap of this result with the increase in fragmentation (Figure 4) highlighted a correlation between the type of fragmentation that occurred and the population dynamics. From the cartography (Figure 6), it can be deduced that most of the areas affected by an “infilling” fragmentation fell in municipalities that were subject to a decrease in population density between 1990 and 2018. On the other hand, the municipalities in which an increasing trend for population density over time was measured showed a greater presence of “edge-expansion” areas (Figure 6). The development of new “outlying” typology also occurred more frequently in the municipalities where the population density grew over time (Figure 6).
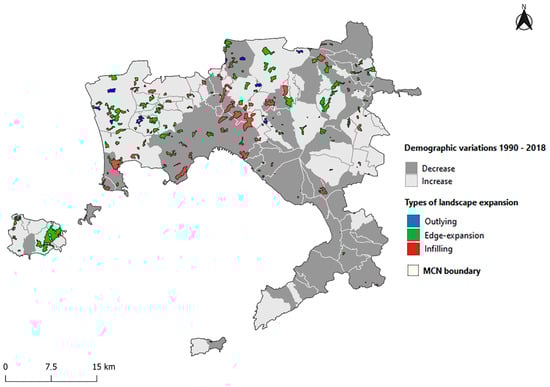
Figure 6.
Map showing the demographic variation and type of landscape-fragmentation trend over time (1990–2018) in the MCN.
4. Discussion
The cumulative effects of landscape changes over longer time periods are difficult to observe, and subsequently are often underestimated [24]. In our study, the full extent of the landscape alterations over three decades and its relationship with eco-mosaic transformations was evaluated, using a complex study area (the MCN) where the urban and natural features varied massively. We highlighted that important fragmentation processes were already present in 1990, and that in the following 28 years, nothing has been gained in terms of recovering ecological connectivity. The multitemporal analysis (1990–2018) highlighted an urban expansion in the MCN, mainly affecting the Ischia Island area and the northern part of the study area (Figure 2 and Figure 3). The LEI, MEI and AWMEI indices were calculated for the analysis of urban expansion and the consequent fragmentation of the landscape. The LEI and its variants can be used to identify the types of expansion of a given landscape and to describe the modification process over time between two temporal points [6,7,41]. LEI analysis allows the exploration of the percentage of patches for each expansion type [6,7,41]. The “edge-expansion” type represented the most frequent fragmentation expansion type in the MCN, both for area and number of patches (53.6% and 49.5%, respectively—Table 1). The “infilling” category showed and area increase percentage of 40.5% and an increase percentage for number of patches of 40.3% (Table 1). The least represented category was “outlying”, the development of new fragmenting cores external to the pre-existing urban fabric, for which an increase of 5.9% for the area and 10.2% of the number of new patches added were recorded (Table 1). This spatial distribution of expansion categories showed a dual tendency in the increased fragmentation of the MCN’s eco-mosaic [7]. The urban landscape has compacted in the empty areas that have been filled over time by the “infilling” areas, and in the meantime, we have witnessed a sprawling expansion that has led to a widening of the borders by projecting the offshoots of the ecologically impermeable areas out of the urban landscape (Figure 3 and Figure 4). This expansion trend was particularly evident in the case of the island of Ischia, where the urban development has increased considerably to cover the eastern areas of the island almost entirely (Figure 1, Figure 2 and Figure 3) [44]. The values obtained for the indices derived from the LEI (MEI and AWMEI) were 43.3 and 42.6, respectively. Values of these two indices above 50.0 indicate an average trend toward urban compaction [7]; however, since our results were below the threshold of 50.0, the main trend toward expansion of the boundaries of urban areas was confirmed [7].
The eco-mosaic fragmentation and the related increase in urbanization have, as their first repercussions, the consumption of land, which changes its intended use and its ecological properties irreversibly [28,45,46,47,48]. The multitemporal analysis using the Corine Land Cover allowed us to verify which land uses were most affected by urban expansion in 28 years (Figure 4). Therefore, we found that almost all of the increase in fragmentation affected soils intended for agricultural use (Figure 4, Table 2). From 1990 to 2018, about 57.42 km2 of agricultural land were consumed, of which 36.35 km2 belonged to the “Complex Cultivation Patterns” category (Table 2). This particular category includes by definition a “mosaic of small, cultivated land parcels with different cultivation types (annual crops, pasture and/or permanent crops), eventually with scattered houses or gardens” [49]. It was therefore characterized by a higher level of biodiversity than large-scale intensive agriculture, which leads to a flattening of biodiversity [6,50]. The decrease of these areas represents a problem for the loss of landscape, social and cultural value, and in terms of ecological connectivity and biodiversity [6,45,50,51,52]. Agricultural areas in which nonintensive activities are carried out represent a key component in the ecological connectivity of the landscape [6,50,53,54]. The 28-year loss of a vast surface of this land type has certainly undermined the integrity of the MCN’s ecological network, reducing the resilience of habitats and increasing their fragility [6,29,45,55]. The other land-use categories that have undergone erosion were minimally represented compared to agricultural areas, but a decrease was recorded for urban green areas, forests, and habitats linked to water bodies (Table 2).
The 30 years of landscape transformations led to the actual ecological network. In the MCN, the main Core Areas are located in correspondence to Mount Somma-Vesuvius, the Lattari Mountains, the Phlegrean Fields area, and the islands of Ischia and Capri (Figure 1 and Figure 5). Other areas are located at the level of the Sorrento Peninsula, the Partenio Mountains, and in the western coastal area of the MCN (Figure 1 and Figure 5). Buffer Zones have the role of attenuating the transition to habitats in the Core Areas and ensuring their gradualness [6,29]. The spatial analysis and ecological-network map (Figure 5) showed that the surface area for this category was considerably small, slightly exceeding the surface of the Core Areas. A critical situation was evident in the Core Area corresponding to the Somma-Vesuvius complex; this particular area was in fact almost totally uncovered, as the buffer zone was almost inexistent (Figure 5). The loss of the buffer zone may indicate a high vulnerability of the core area (Figure 2), despite being subject to formal protection [45]. More than 80% of the MCN’s ecological was occupied by primary connections, represented by tree coverings and by nonintensive agricultural territories, where the level of biological permeability is kept high [28,29,51]. Figure 5 highlights an important fracture in the ecological network that starts from the city of Naples and expands to the north, separating the MCN’s ecological network into two sections located to the east and west of the capital.
The latest analysis carried out in this work has allowed us to identify a relationship between eco-mosaic transformation and demographic flows (one of the possible drivers of the urbanization phenomenon) from a multitemporal approach. It was possible to correlate the demographic dynamics to the types of urban growth/expansion (Figure 6). The cartography allowed us to evaluate the existence of an apparent relationship between the “outlying” and “edge-expansion” areas, and the population increase at the municipality level (Figure 6). The increase in the compaction of the urban agglomeration was found mostly in areas subject to depopulation (Figure 6). It is therefore possible to hypothesize that the main driver regulating the type of urban expansion of the MCN was the flow of population that moved from the more urbanized and central areas to settle in the suburbs, where the cost of living is certainly lower.
Our findings were in accordance with other research (Feng et al., 2021, Xie et al., 2017), illustrating the high explanatory power of population density in landscape transformation.
The overall analyses showed a growing urban environment that is tending to transform into a megacity. However, to clearly predict future scenarios, it would be necessary to investigate more than two timeframes in a longer period. In our case study, it was not possible to create a forecasting model to hypothesize the future development of the urban area, the eco-mosaic transformation, and the ecological network due to the lack of data. In addition, future research would be suitable to account for the role of other driving factors of landscape transformation, as also investigated in other studies worldwide (Feng et al., 2021, Van der sluis, 2019).
5. Conclusions
The results obtained in this work may provide a scenario on which to base further studies on a local, national, or international scale comparing trends, drivers, and outcomes in metropolitan-area transformations. A complete knowledge of these transformations would help to design a strategy aimed at containing the fragmenting increase of the landscape and improving environmental connectivity in rapidly expanding and sometimes uncontrolled urban contexts.
The results of this work depict a rather worrying situation according to other previous studies in the case-study area [29,45]. Over the course of 28 years, the agricultural areas of high ecological and social value that characterized the suburbs and less densely populated centers have been sacrificed for a wicked, uncontrolled, and not always legal urban development, at a sustained speed [56]. The definition and identification of agricultural areas of high ecological and naturalistic value is important, as they offer the opportunity to complete the habitat conservation strategy, preserve biodiversity, enhance examples and testimonies of considerable interest (also from a historical point of view and cultural), within the agricultural territory. Eco-mosaic fragmentation and disruption, as well as loss of landscape diversity, are the main transformations of urban areas developing in metropolitan regions and megalopolises [53,57,58,59]. In this scenario, the risk is a rapid and inexorable deterioration of the ecological value of the territory, and of the cultural and historical potential inherent in the differences between characteristic communities that lose their identity in favor of a social and cultural flattening. The conservation of these areas also would be important for their social role, since they constitute a strong element of sociocultural aggregation.
Although the protected natural areas (the Core Areas of the ecological network) have been protected overall by functional protection regimes, the eco-mosaic tissue of the Metropolitan City of Naples appears torn in the middle, where a barrier has been placed that does not allow easy ecological permeability. The recovery and strengthening of the ecological network are strategies that require the implementation of green infrastructures, restrictions for protection and conservation, and careful planning of the next urban developments [6,29]. This is more a priority in territories characterized by social problems like organized crime, unemployment and youth challenges, illegal housing and corruption of businesses, and environmental and urban degradation [45,55]. Preserving the connectivity of natural and seminatural patches in the eco-mosaic certainly requires a permanent assessment of urban sprawl.
Author Contributions
Conceptualization, C.G., A.P. and D.Z.; methodology, D.Z., C.F. and A.P.; software, C.F., D.Z. and A.P.; validation, B.P., R.S., and C.G.; data curation, D.Z. and A.P.; writing—original draft preparation, D.Z. and A.P.; writing—review and editing, D.Z., C.G., A.P., M.T. and B.P. All authors have read and agreed to the published version of the manuscript.
Funding
This research received no external funding.
Institutional Review Board Statement
Not applicable.
Informed Consent Statement
Not applicable.
Conflicts of Interest
The authors declare no conflict of interest.
References
- Farina, A. Landscape Ecology in Action; Metzler, J.B., Ed.; Springer: Berlin/Heidelberg, Germany, 2000. [Google Scholar]
- Agnoletti, M.; Rotherham, I.D. Landscape and biocultural diversity. Biodivers. Conserv. 2015, 24, 3155–3165. [Google Scholar] [CrossRef]
- Surya, B.; Hadijah, H.; Suriani, S.; Baharuddin, B.; Fitriyah, A.T.; Menne, F.; Rasyidi, E.S. Spatial Transformation of a New City in 2006–2020: Perspectives on the Spatial Dynamics, Environmental Quality Degradation, and Socio—Economic Sustainability of Local Communities in Makassar City, Indonesia. Land 2020, 9, 324. [Google Scholar] [CrossRef]
- Kertész, Á.; Nagy, L.A.; Balázs, B. Effect of land use change on ecosystem services in Lake Balaton Catchment. Land Use Policy 2019, 80, 430–438. [Google Scholar] [CrossRef]
- Zipperer, W.C.; Wu, J.; Pouyat, R.V.; Pickett, S.T.A. The Application of Ecological Principles to Urban and Urbanizing Landscapes. Ecol. Appl. 2000, 10, 685. [Google Scholar] [CrossRef]
- Pili, S.; Serra, P.; Salvati, L. Landscape and the city: Agro-forest systems, land fragmentation and the ecological network in Rome, Italy. Urban For. Urban Green. 2019, 41, 230–237. [Google Scholar] [CrossRef]
- Liu, X.; Li, X.; Chen, Y.; Tan, Z.; Li, S.; Ai, B. A new landscape index for quantifying urban expansion using multi-temporal remotely sensed data. Landsc. Ecol. 2010, 25, 671–682. [Google Scholar] [CrossRef]
- Lausch, A. Applicability of landscape metrics for the monitoring of landscape change: Issues of scale, resolution and interpretability. Ecol. Indic. 2002, 2, 3–15. [Google Scholar] [CrossRef]
- Turner, M.G. Landscape Ecology: The Effect of Pattern on Process. Annu. Rev. Ecol. Syst. 1989, 20, 171–197. [Google Scholar] [CrossRef]
- Jianguao, W.; John, L.D. A spatially explicit hierarchical approach to modeling complex ecological systems: Theory and applications. Ecol. Modell. 2002, 153, 7–26. [Google Scholar]
- McGarigal, K. Landscape Pattern Metrics. In Wiley StatsRef: Statistics Reference Online; John Wiley & Sons, Ltd.: Chichester, UK, 2014. [Google Scholar]
- Kong, F.; Yin, H.; Nakagoshi, N.; Zong, Y. Urban green space network development for biodiversity conservation: Identification based on graph theory and gravity modeling. Landsc. Urban Plan. 2010, 95, 16–27. [Google Scholar] [CrossRef]
- Antrop, M. Landscape change and the urbanization process in Europe. Landsc. Urban Plan. 2004, 67, 9–26. [Google Scholar] [CrossRef]
- Harden, C.P.; Chin, A.; English, M.R.; Fu, R.; Galvin, K.A.; Gerlak, A.K.; McDowell, P.F.; McNamara, D.E.; Peterson, J.M.; Poff, N.L.; et al. Understanding Human–Landscape Interactions in the “Anthropocene”. Environ. Manag. 2014, 53, 4–13. [Google Scholar] [CrossRef] [PubMed]
- Li, Y.; Li, Y.; Zhou, Y.; Shi, Y.; Zhu, X. Investigation of a coupling model of coordination between urbanization and the environment. J. Environ. Manag. 2012, 98, 127–133. [Google Scholar] [CrossRef]
- Zhao, Y.; Wang, S.; Zhou, C. Understanding the relation between urbanization and the eco-environment in China’s Yangtze River Delta using an improved EKC model and coupling analysis. Sci. Total. Environ. 2016, 571, 862–875. [Google Scholar] [CrossRef] [PubMed]
- Allington, G.R.; Li, W.; Brown, D.G. Urbanization and environmental policy effects on the future availability of grazing resources on the Mongolian Plateau: Modeling socio-environmental system dynamics. Environ. Sci. Policy 2017, 68, 35–46. [Google Scholar] [CrossRef]
- Peng, J.; Tian, L.; Liu, Y.; Zhao, M.; Hu, Y.; Wu, J. Ecosystem services response to urbanization in metropolitan areas: Thresholds identification. Sci. Total Environ. 2017, 607, 706–714. [Google Scholar] [CrossRef]
- Zheng, D.; Zhang, G.; Shan, H.; Tu, Q.; Wu, H.; Li, S. Spatio-Temporal Evolution of Urban Morphology in the Yangtze River Middle Reaches Megalopolis, China. Sustainability 2020, 12, 1738. [Google Scholar] [CrossRef]
- Ustaoglu, E.; Williams, B. Determinants of Urban Expansion and Agricultural Land Conversion in 25 EU Countries. Environ. Manag. 2017, 60, 717–746. [Google Scholar] [CrossRef]
- Mallarach, J.M.; Marull, J. Impact assessment of ecological connectivity at the regional level: Recent developments in the Barcelona Metropolitan Area. Impact Assess. Proj. Apprais. 2006, 24, 127–137. [Google Scholar] [CrossRef]
- Colantoni, A.; Mavrakis, A.; Sorgi, T.; Salvati, L. Towards a ‘polycentric’ landscape? Reconnecting fragments into an integrated network of coastal forests in Rome. Rend. Lince 2015, 26, 615–624. [Google Scholar] [CrossRef]
- Tomao, A.; Quatrini, V.; Corona, P.; Ferrara, A.; Lafortezza, R.; Salvati, L. Resilient landscapes in Mediterranean urban areas: Understanding factors influencing forest trends. Environ. Res. 2017, 156, 1–9. [Google Scholar] [CrossRef]
- Jaeger, J.A.G.; Soukup, T.; Schwick, C.; Madriñán, L.F.; Kienast, F.; Feranec, J.; Feranec, G.; Jaffrain, G. Chapter 20 Landscape Fragmentation in Europe. In European Landscape Dynamics; Apple Academic Press: Palm Bay, FL, USA, 2016; pp. 157–198. [Google Scholar]
- Cellamare, C. Fuori Raccordo: Abitare l’altra Roma; Donzelli Editore: Roma, Italy, 2016; p. XIV-362. [Google Scholar]
- Colantoni, A.; Pili, S.; Mosconi, E.M.; Poponi, S.; Cecchini, M.; Doria, P. Metropolitan Agriculture, Socio-Demographic Dynamics and the Food-City Relationship in Southern Europe. Curr. Policy Econ. Eur. 2017, 28, 1–24. [Google Scholar]
- Seto, K.C.; Güneralp, B.; Hutyra, L.R. Global forecasts of urban expansion to 2030 and direct impacts on biodiversity and carbon pools. Proc. Natl. Acad. Sci. USA 2012, 109, 16083–16088. [Google Scholar] [CrossRef]
- De Toro, P.; Iodice, S. Ecosystem Health Assessment in urban contexts: A proposal for the Metropolitan Area of Naples (Italy). Aestimum 2018, 72, 39–59. [Google Scholar] [CrossRef]
- Coppola, E.; Rouphael, Y.; De Pascale, S.; Moccia, F.D.; Cirillo, C. Ameliorating a Complex Urban Ecosystem Through Instrumental Use of Softscape Buffers: Proposal for a Green Infrastructure Network in the Metropolitan Area of Naples. Front. Plant Sci. 2019, 10, 410. [Google Scholar] [CrossRef] [PubMed]
- Italian National Institute of Statistics. 2019. Available online: http://www.istat.it (accessed on 1 February 2021).
- ISTAT Il Territorio Rurale della Campania. 6 Censimento Generale dell’Agricoltura. Agriregionieuropa 2010, p. 480. Available online: http://www.agricoltura.regione.campania.it/pubblicazioni/pdf/territorio_rurale.pdf (accessed on 1 February 2021).
- Sciarrillo, R.; Zuzolo, D.; Cicchella, D.; Iannone, F.; Cammino, G.; Guarino, C. Contamination and ecological risk assessment of the seaport of Naples (Italy): Insights from marine sediments. J. Geochem. Explor. 2020, 210, 106449. [Google Scholar] [CrossRef]
- Buonocore, E.; Appolloni, L.; Russo, G.F.; Franzese, P.P. Assessing natural capital value in marine ecosystems through an environmental accounting model: A case study in Southern Italy. Ecol. Model. 2020, 419, 108958. [Google Scholar] [CrossRef]
- European Environment Agency (EEA) European Union, Copernicus Land Monitoring Service. 2021. Available online: https://land.copernicus.eu/pan-european/corine-land-cover/clc-1990 (accessed on 8 January 2021).
- European Environment Agency (EEA) European Union, Copernicus Land Monitoring Service. 2021. Available online: https://land.copernicus.eu/pan-european/corine-land-cover/clc2018 (accessed on 8 January 2021).
- Bagnaia, R.; Viglietti, S.; Laureti, L.; Giacanelli, V.; Ceralli, D.; Bianco, P.; Loreto, A.; Luce, E.; Fusco, L. Carta Della Natura Della Regione Campania: Carta Degli Habitat Alla Scala 1:25.000. 2017 [Italian]; ISPRA: Roma, Italy, 2009. [Google Scholar]
- European Environment Agency (EEA) European Union, Copernicus Land Monitoring Service 2021. Available online: https://land.copernicus.eu/pan-european/high-resolution-layers/forests/tree-cover-density/status-maps/tree-cover-density-2018 (accessed on 8 January 2021).
- QGIS. Geographic Information System. QGIS Association. 2021. Available online: http://www.qgis.org (accessed on 14 November 2020).
- Ricca, N.; Guagliardi, I. Multi-Temporal Dynamics of Land Use Patterns in a Site of Community Importance in Southern Italy. Appl. Ecol. Environ. Res. 2015, 13, 677–691. [Google Scholar] [CrossRef]
- Amsallem, J.; Umr, I.; Agroparistech, J.C.; Tetis, U.M.R. FragScape v1.0. 2019, pp. 1–12. Available online: https://plugins.qgis.org/plugins/FragScape/ (accessed on 14 November 2020).
- Moll, M.S.; Fernández, L.; Ángel, R. Descripción y cálculo de índices de fragmentación urbana: Herramienta IndiFrag. Rev. Teledetección 2015, 77–90. [Google Scholar] [CrossRef]
- Dickson, B.G.; Albano, C.M.; McRae, B.H.; Anderson, J.J.; Theobald, D.M.; Zachmann, L.J.; Sisk, T.D.; Dombeck, M.P. Informing Strategic Efforts to Expand and Connect Protected Areas Using a Model of Ecological Flow, with Application to the Western United States. Conserv. Lett. 2017, 10, 564–571. [Google Scholar] [CrossRef]
- Council Directive 2006/105/Ec. OJ L 363, 20.12.2006, 36. 2006. Available online: http://ec.europa.eu/environment/nature/natura2000 (accessed on 5 February 2021).
- Alberico, I.; Petrosino, P. The hazard indices as a tool to support the territorial planning: The case study of Ischia island (Southern Italy). Eng. Geol. 2015, 197, 225–239. [Google Scholar] [CrossRef]
- Fiorini, L.; Zullo, F.; Marucci, A.; Romano, B. Land take and landscape loss: Effect of uncontrolled urbanization in Southern Italy. J. Urban Manag. 2019, 8, 42–56. [Google Scholar] [CrossRef]
- Institute, T.W. State of the World, Our Urban Future; Norton, N.Y., Ed.; The Worldwatch Institute: Washington, DC, USA, 2007. [Google Scholar]
- Jaeger, J.A.; Bertiller, R.; Schwick, C.; Kienast, F. Suitability criteria for measures of urban sprawl. Ecol. Indic. 2010, 10, 397–406. [Google Scholar] [CrossRef]
- Barrington-Leigh, C.; Millard-Ball, A. A century of sprawl in the United States. Proc. Natl. Acad. Sci. USA 2015, 112, 8244–8249. [Google Scholar] [CrossRef]
- European Environment Agency (EEA) European Union, Copernicus Land Monitoring Service. 2021. Available online: https://land.copernicus.eu/user-corner/technical-library/corine-land-cover-nomenclature-guidelines/html/index-clc-242.html (accessed on 2 March 2021).
- Salvati, L. Agro-forest landscape and the ‘fringe’ city: A multivariate assessment of land-use changes in a sprawling region and implications for planning. Sci. Total. Environ. 2014, 490, 715–723. [Google Scholar] [CrossRef]
- Sallustio, L.; Pettenella, D.; Merlini, P.; Romano, R.; Salvati, L.; Marchetti, M.; Corona, P. Assessing the economic marginality of agricultural lands in Italy to support land use planning. Land Use Policy 2018, 76, 526–534. [Google Scholar] [CrossRef]
- Romano, G.; Sasso, P.D.; Liuzzi, G.T.; Gentile, F. Multi-criteria decision analysis for land suitability mapping in a rural area of Southern Italy. Land Use Policy 2015, 48, 131–143. [Google Scholar] [CrossRef]
- Duvernoy, I.; Zambon, I.; Sateriano, A.; Salvati, L. Pictures from the other side of the fringe: Urban growth and peri-urban agriculture in a post-industrial city (Toulouse, France). J. Rural. Stud. 2018, 57, 25–35. [Google Scholar] [CrossRef]
- Padró, R.; La Rota-Aguilera, M.J.; Giocoli, A.; Cirera, J.; Coll, F.; Pons, M.; Pino, J.; Pili, S.; Serrano, T.; Villalba, G.; et al. Assessing the sustainability of contrasting land use scenarios through the Socioecological Integrated Analysis (SIA) of the metropolitan green infrastructure in Barcelona. Landsc. Urban Plan. 2020, 203, 103905. [Google Scholar] [CrossRef]
- Pinotti, P. The Economic Costs of Organised Crime: Evidence from Southern Italy. Econ. J. 2015, 125, F203–F232. [Google Scholar] [CrossRef]
- CUFAA, S.P. Consumo di Suolo, Dinamiche Territoriali e Servizi Ecosistemici. Ist. Super. Per la Prot. e la Ric. Ambient. 2018, p. 293. ISBN 978-88-448-0902-7. Available online: https://www.isprambiente.gov.it/it/pubblicazioni/rapporti/consumo-di-suolo-dinamiche-territoriali-e-servizi-ecosistemici.-edizione-2018 (accessed on 1 February 2021).
- Bruegmann, R. Sprawl: A Compact History; University of Chicago Press: Chicago, IL, USA, 2005. [Google Scholar]
- Salvati, L.; Quatrini, V.; Barbati, A.; Tomao, A.; Mavrakis, A.; Serra, P.; Sabbi, A.; Merlini, P.; Corona, P. Soil occupation efficiency and landscape conservation in four Mediterranean urban regions. Urban For. Urban Green. 2016, 20, 419–427. [Google Scholar] [CrossRef]
- Salvati, L.; Ranalli, F.; Carlucci, M.; Ippolito, A.; Ferrara, A.; Corona, P. Forest and the city: A multivariate analysis of peri-urban forest land cover patterns in 283 European metropolitan areas. Ecol. Indic. 2017, 73, 369–377. [Google Scholar] [CrossRef]


Publisher’s Note: MDPI stays neutral with regard to jurisdictional claims in published maps and institutional affiliations. |
© 2021 by the authors. Licensee MDPI, Basel, Switzerland. This article is an open access article distributed under the terms and conditions of the Creative Commons Attribution (CC BY) license (https://creativecommons.org/licenses/by/4.0/).