1. Introduction
The increased air temperature levels associated with climate change will likely result in decreased snowpack, leading to earlier peak flows [
1], reduced summer flows [
2], and increased stream temperatures [
3,
4]. The combined effects of climate change and shifts in land cover, such as those associated with urbanization or forestry, are also linked to increased stream temperature [
5,
6], a trend seen in many regions across the United States [
7,
8] and Europe [
9,
10,
11].
Increased stream temperatures are associated with detrimental ecological impacts [
8], including reduced dissolved oxygen concentrations [
3], reduced species richness and diversity in stream ecosystems [
12], and changes in primary production and nutrient uptake [
13]. An increase in stream temperature can lead to lethal and sub-lethal effects in cold-water fish species such as salmonids [
14,
15], a species of concern in the Pacific Northwest region in the United States and Canada. Multiple biotic and abiotic factors influence stream temperature, including atmospheric characteristics such as precipitation and air temperature lapse rates [
16], basin elevation [
17], streamflow volume [
18], streambed surface [
19], flooding events [
20], shallow groundwater inflows [
21], and topography [
22].
Stream temperature dynamics differ across spatial and temporal scales. The primary drivers of stream temperature vary with climate, season [
23], stream size and order [
24], and distance from the headwaters [
25]. Daraio and Bales [
26] found that land-use change, particularly the conversion to urban development, was associated with stream temperature increases near the headwaters of a stream, but climate change was more influential on modeled stream temperature over a larger spatial scale. Webb et al. [
27] found that stream discharge demonstrated more influence on short-term stream temperature, although the air temperature was more impactful on stream temperature over more extended periods and when streamflow was below median levels. Leach et al. [
28] found that western Oregon’s headwater streams showed considerable temperature variability during summer and dry winter seasons. Mayer [
23] found that thermal sensitivity to air temperature was lower in summer than other times of the year in humid and semiarid systems in the Pacific Northwest. In the same study, Mayer also found that the monthly baseflow index, channel slope, and channel length were important predictors of stream temperature during the summer, while annual stream temperature was explained mainly by air temperature and streamflow. Similarly, the stream heat budget and thermal capacity can also vary across temporal and spatial scales and are crucial to understanding stream temperature dynamics.
The thermal capacity of a stream is primarily a function of stream depth and velocity. Greater streamflow volume is associated with lower stream temperatures [
16,
27,
29], indicating that the increased thermal capacity associated with greater streamflow volume may mitigate some increases in air temperature. Additionally, stream temperatures in snowmelt-fed, steeper-elevation systems have been less sensitive to air temperature changes than lower elevation, rain-dominated stream systems [
30]. Woltemade [
18] found that while stream temperature was strongly associated with both riparian cover and air temperature, the relative influence of both was reduced with increased discharge. Channel width and streamflow velocity also impact the level of influence solar radiation will have on stream temperature [
31], and areas of steeper gradient and greater stream velocity may warm less quickly than areas with a shallower gradient. Smaller streams may be more impacted by ambient temperature increases, although groundwater inputs in small streams may mitigate these impacts [
32]. In particular, deep groundwater-fed streams are less impacted by fluctuations in air temperature than streams with shallower flow sources [
33].
In addition to air temperature, solar radiation also plays a significant role in the heat budget of a stream. Multiple studies [
19,
34,
35] have indicated that solar radiation strongly influences stream temperature. Riparian vegetation, in particular, has been the focus of many studies into stream temperature dynamics and water quality [
36,
37,
38,
39,
40]. Land-use changes, particularly the removal and alteration of riparian vegetation, can influence stream temperature by increasing the amount of solar radiation that reaches a stream. Riparian vegetation removal has been associated with increases in maximum and mean stream temperature [
15,
25,
26,
34,
35,
36,
37,
38,
39,
40,
41,
42,
43] and reducing undercanopy diurnal temperature ranges [
41,
42]. For example, Johnson and Jones [
43] found an increase in maximum stream temperatures and that maximum stream temperatures occurred earlier in the year following riparian vegetation removal. Johnson [
19] also found that riparian shade was associated with reduced maximum stream temperature but not reduced daily mean or minimum temperature. It is also important to note that while riparian canopy reduces solar radiation that reaches the water [
24,
44], it does not cool the water directly [
45].
A variety of physically-based (e.g., Heat Source [
46], SSTEMP [
47]) and machine learning/statistically based (regression [
48,
49,
50], neural network [
51,
52]) models have been used to understand the impact of environmental characteristics on stream temperature. A review of various approaches used in stream temperature modeling was written by Benyahya et al. [
53]. Regression analyses to assess stream temperature have been widely used and vary in type (e.g., multiple linear vs. logistic), the number and type of parameters used, and spatial and temporal scale. For example, Neumann et al. [
54] used stepwise regression to model maximum daily stream temperature using daily maximum air temperature and streamflow in Reno, NV. Piotrowski and Napiorkowski [
55] assessed six catchments using a logistic regression model incorporating air temperature, flow, and sun declination. Segura et al. [
56] used a multiple linear regression approach to predict stream temperatures based on air temperature and examined the relationship between site-specific characteristics, such as drainage and forest cover, and stream temperature. Arismendi [
48] found that regression approaches using air temperature were able to predict stream temperatures during the period of data collection but performed poorly at predicting stream temperatures outside of this period.
Support vector regression (SVR), an application of the support vector machine (SVM) algorithm, is a commonly used non-parametric supervised classification approach that, either solo or in combination with SVM, has been used in several hydrologic prediction applications, including precipitation downscaling [
57], lake water levels [
58], flood frequency [
59], streamflow prediction [
60,
61], and water temperature predictions (e.g., [
62,
63]). SVR is a robust regression approach that predicts values based on a best-fitting line (hyperplane) while minimizing the error within a set threshold (Ɛ). Rehana [
63] found that SVR performed better than a multiple linear regression approach to model river temperature and Quan et al. [
62] found that SVR-based models performed better than an artificial neural network model to predict reservoir temperature.
Most studies assessing stream temperature–environment relationships have been conducted in temperate forests. This study aimed to enhance base knowledge of land cover and environment interactions influencing stream temperature variability in a semiarid agricultural corridor in northcentral Oregon, USA. Study objectives were to: (1) characterize riparian vegetation shade-stream temperature and subsurface flow-stream temperature connections at the reach scale; and (2) develop a support vector regression model to assess stream temperature–environment relations at the larger valley scale.
4. Discussion
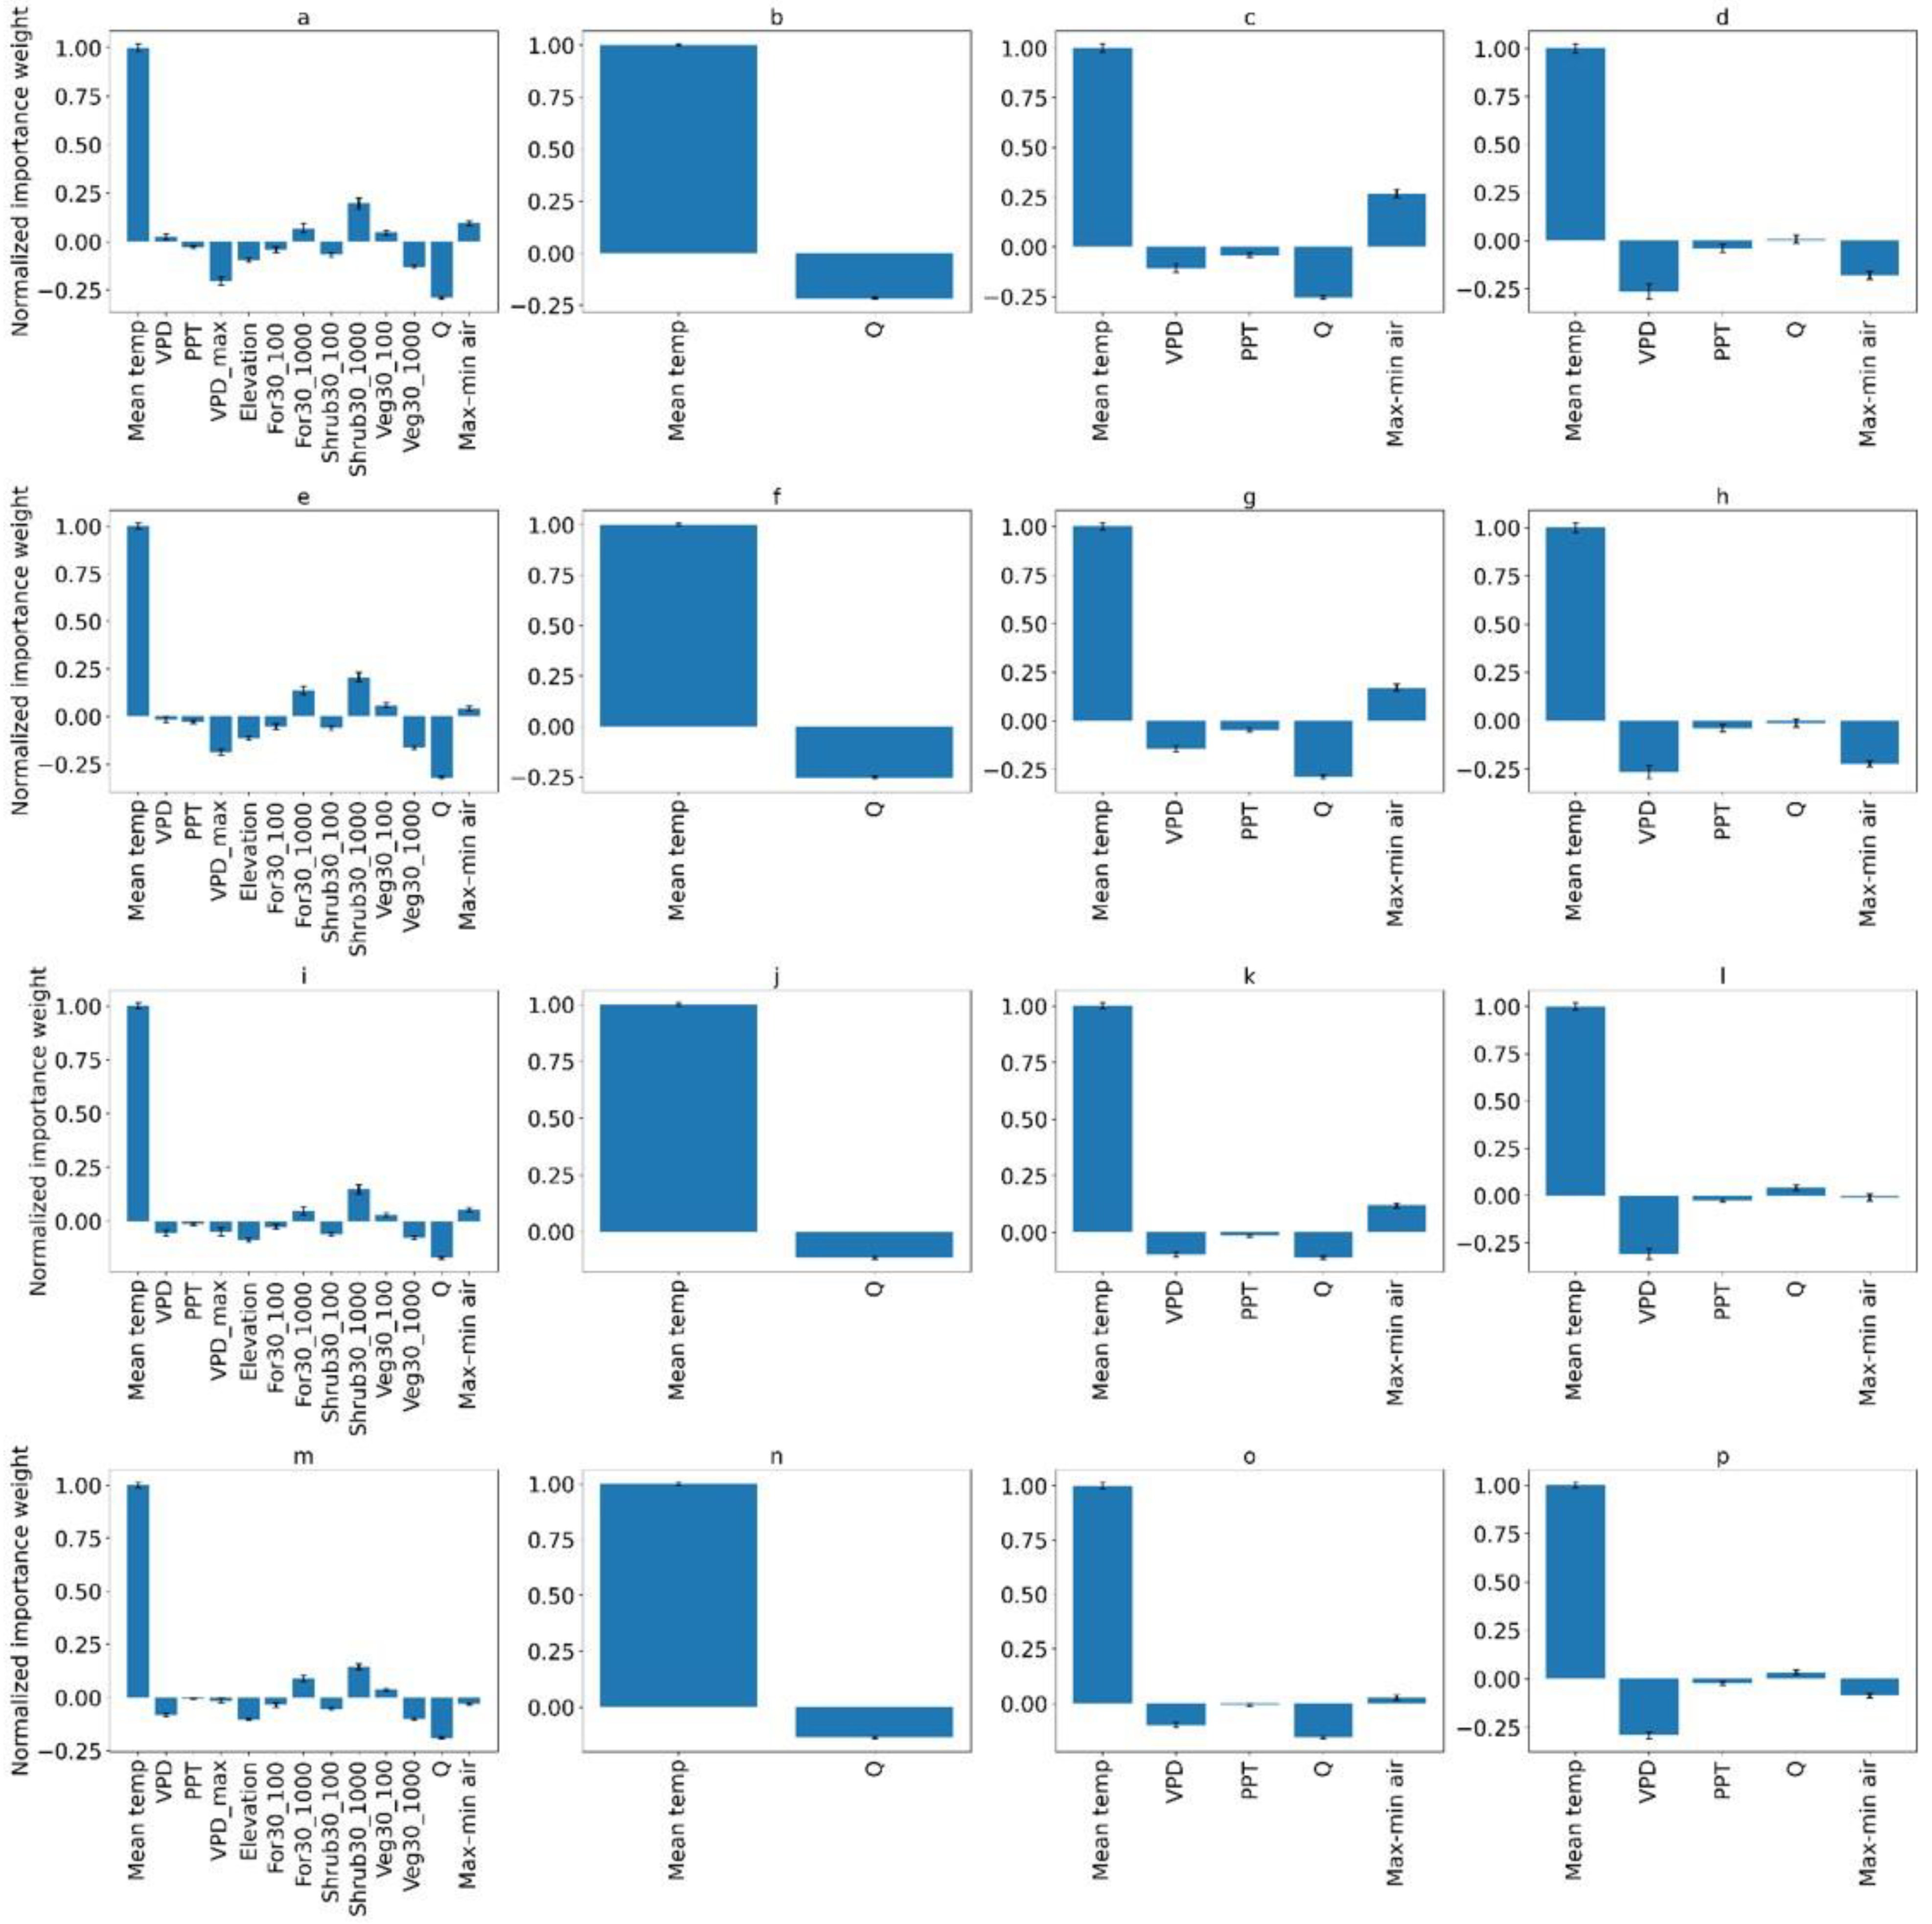
This research examined the relationship between stream temperature and various environmental parameters in a semiarid riparian ecosystem. Study results show that air temperature, followed by
Q in the cooler months and
VPD during the warmer months, was the most significant factor associated with stream temperature at both the reach and valley scales. Similar to other studies [
28,
75,
76], we found that stream temperature and environment relationships are highly seasonal.
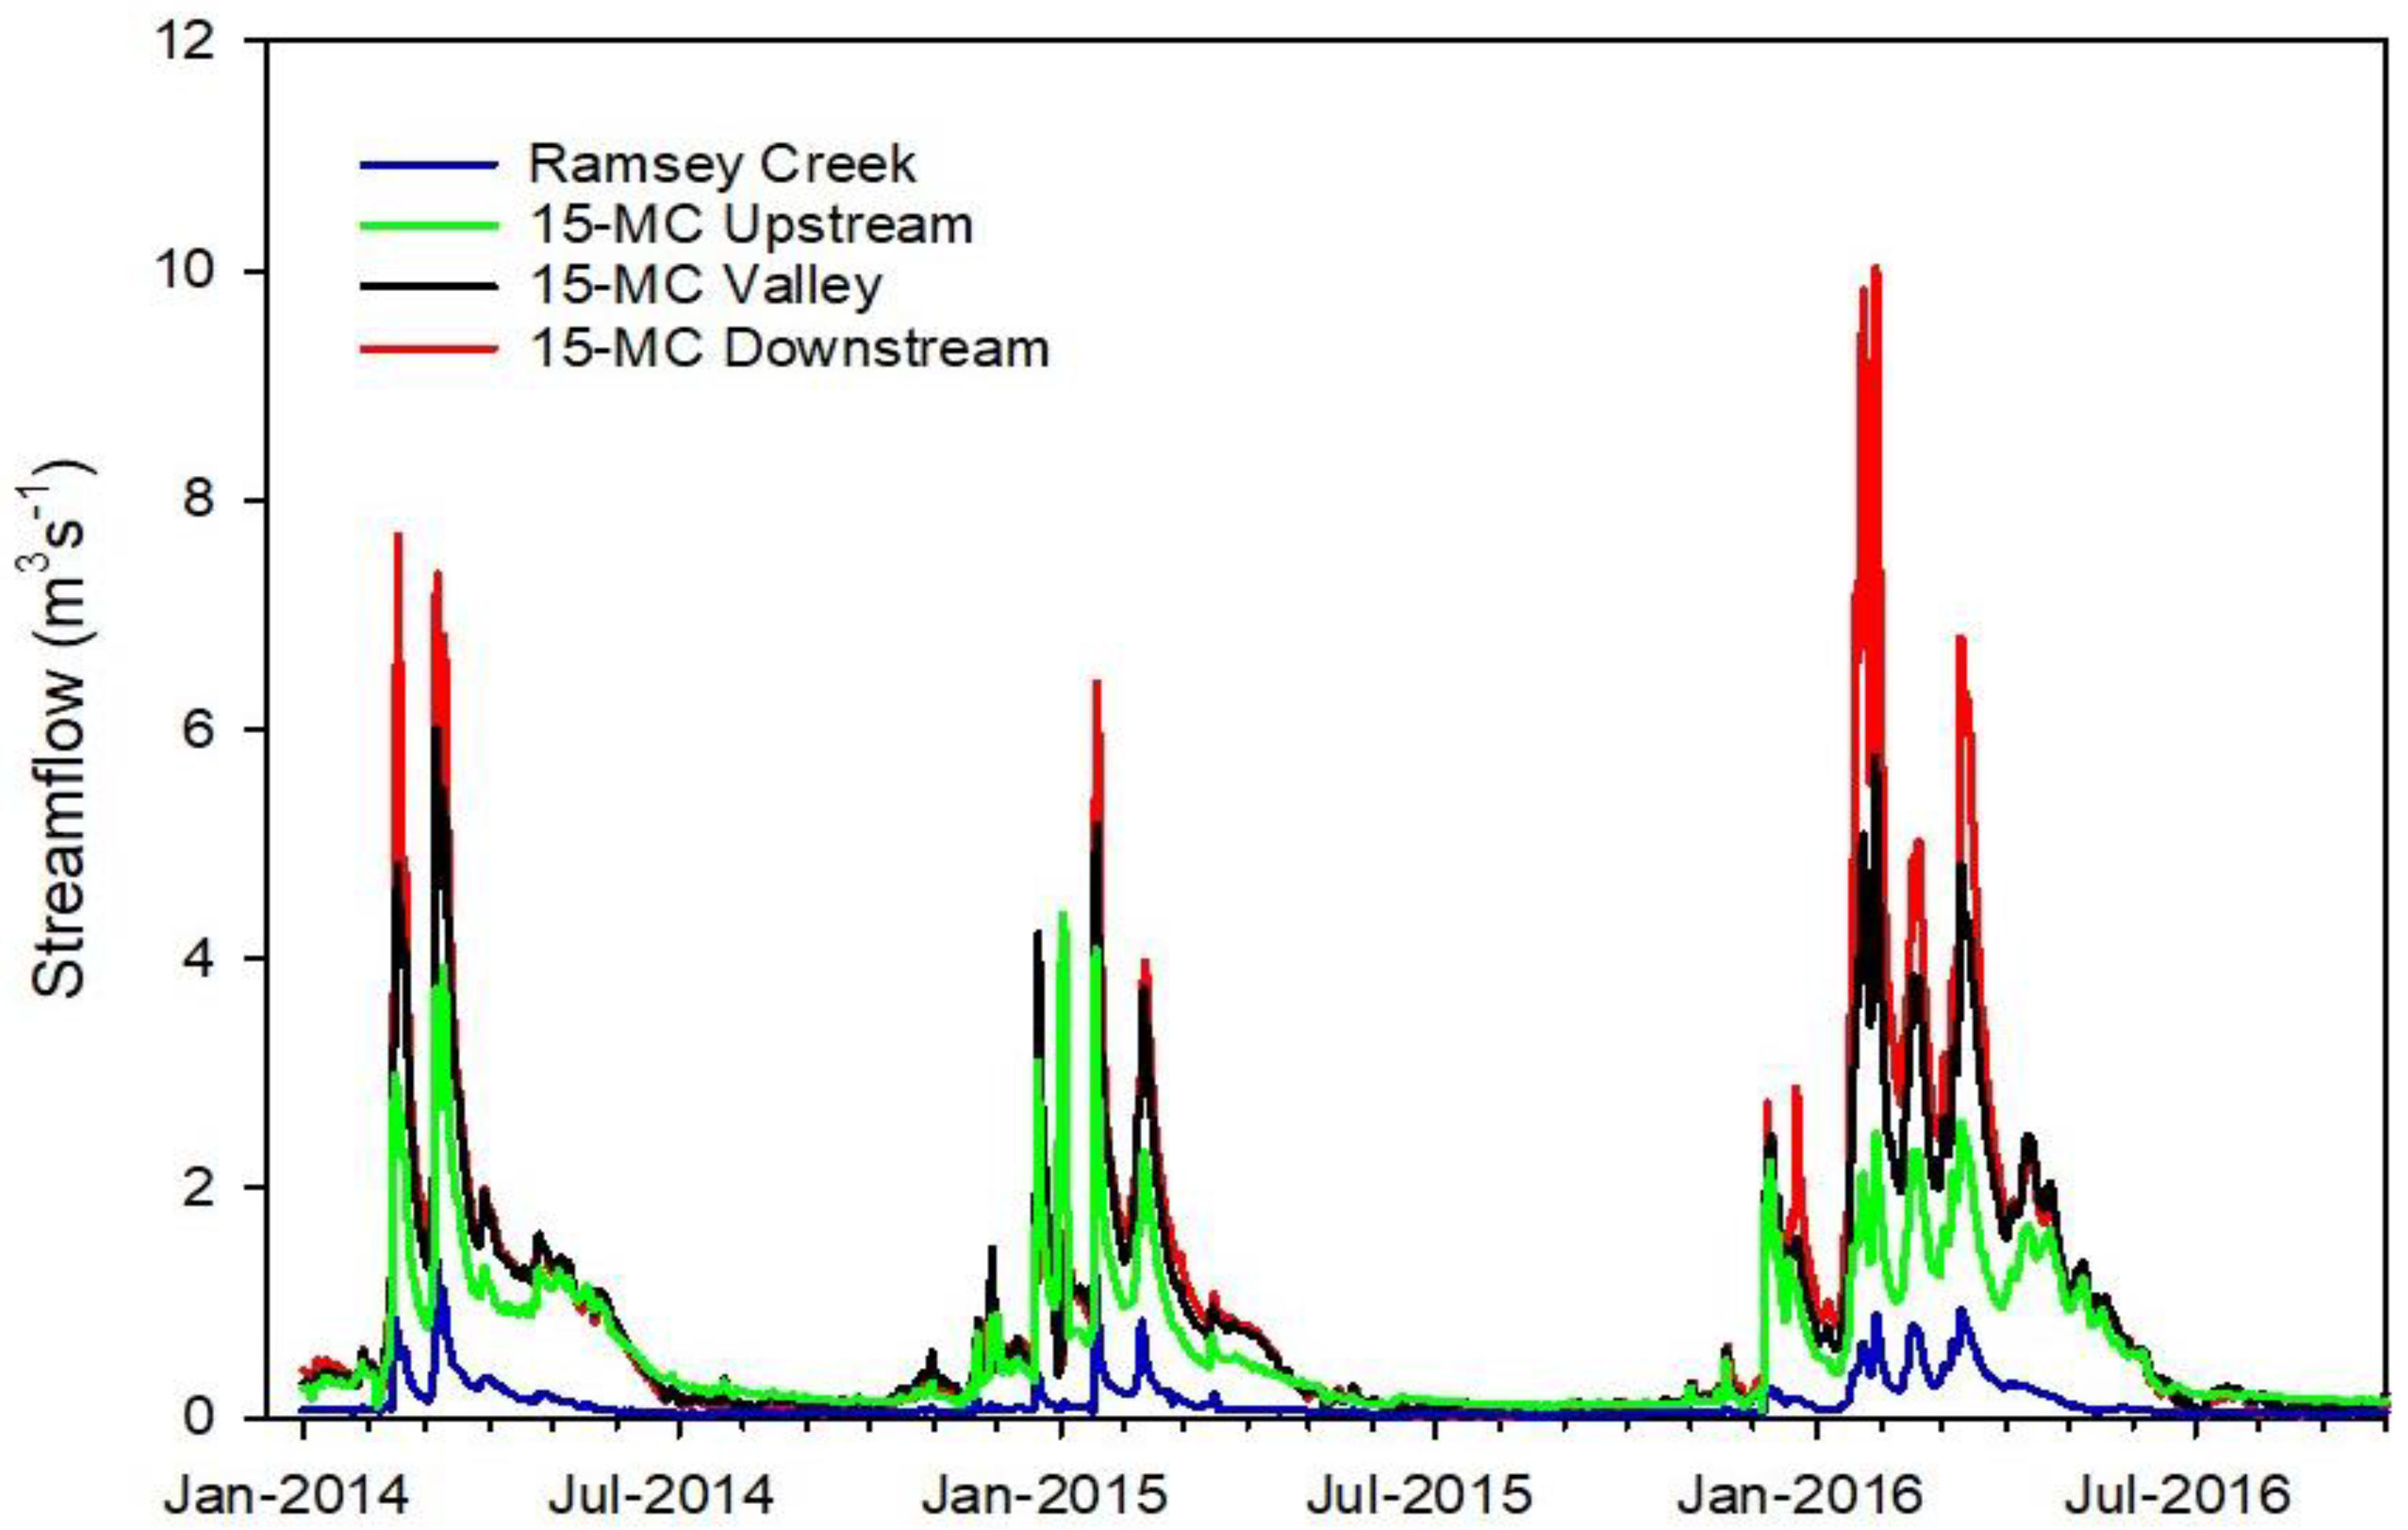
Q was negatively related with stream temperature and was the second-largest factor influencing stream temperature. The exception to this was when
Q was lowest, in which there was a minimal positive association indicated between streamflow volume and stream temperature. By comparison, Isaak et al. [
7] found that streamflow explained almost half of stream temperature variation during summer months while air temperature accounted for most long-term stream temperature differences for 18 monitoring sites in the northwestern United States.
We found no statistical differences in stream temperature between sites with different canopy cover. Land cover was marginally associated with stream temperature. Similarly, Łaszewski and Kiryła (2008) used Sentinel (1 and 2) imagery to assess the relationship between forested areas and stream temperature and did not find statistically significant differences in thermal regimes based on forest cover [
77]. This contrasts with Horne and Hubbart [
78], who found that forested land use was negatively correlated with stream temperature at a West Virginia study site. Other studies have also found riparian vegetation shading to be negatively correlated with stream temperature (e.g., [
42,
79,
80,
81]).
Due to the frequency of NAIP imagery collection, riparian land cover was only assessed for the summer of 2016. Land cover classes may have changed throughout this study (e.g., agricultural fields may have been harvested). However, since most of the riparian areas in the valley are under a long-term conservation program agreement, it was assumed that minimal land cover changes occurred along the entire 15-MC riparian corridor evaluated. While the NAIP-based classification approach yielded generally good results, this approach may not have accounted for shading associated with other vegetation, including understory. Further, while riparian land cover and stream shading are related, riparian vegetation classification should not be directly equated with riparian shading. Other factors, such as slope and aspect, can also influence incoming solar radiation and were not assessed during this study. The aggregated effect of vegetation along the entire stream may help to modulate stream temperature overall. For example, a study conducted by the Oregon Department of Environmental Quality using the Heat Source model [
46] found that increasing riparian vegetation to site potential and increasing
Q would reduce peak 7DADM, with increased riparian vegetation being the most important factor influencing stream temperature [
82].
The marginal temperature differences between different locations along the reach (regardless of canopy cover) may also be influenced by stream velocity and discharge. Steep gradients help move water through the landscape relatively rapidly during the snowmelt runoff season. As a result, movement through shaded or non-shaded areas may be less influential than at lower velocities. During the year, the lowest shallow groundwater temperatures were associated with greater rates of streamflow during the spring snowmelt but not the lowest annual stream temperatures, reemphasizing the importance of ambient conditions.
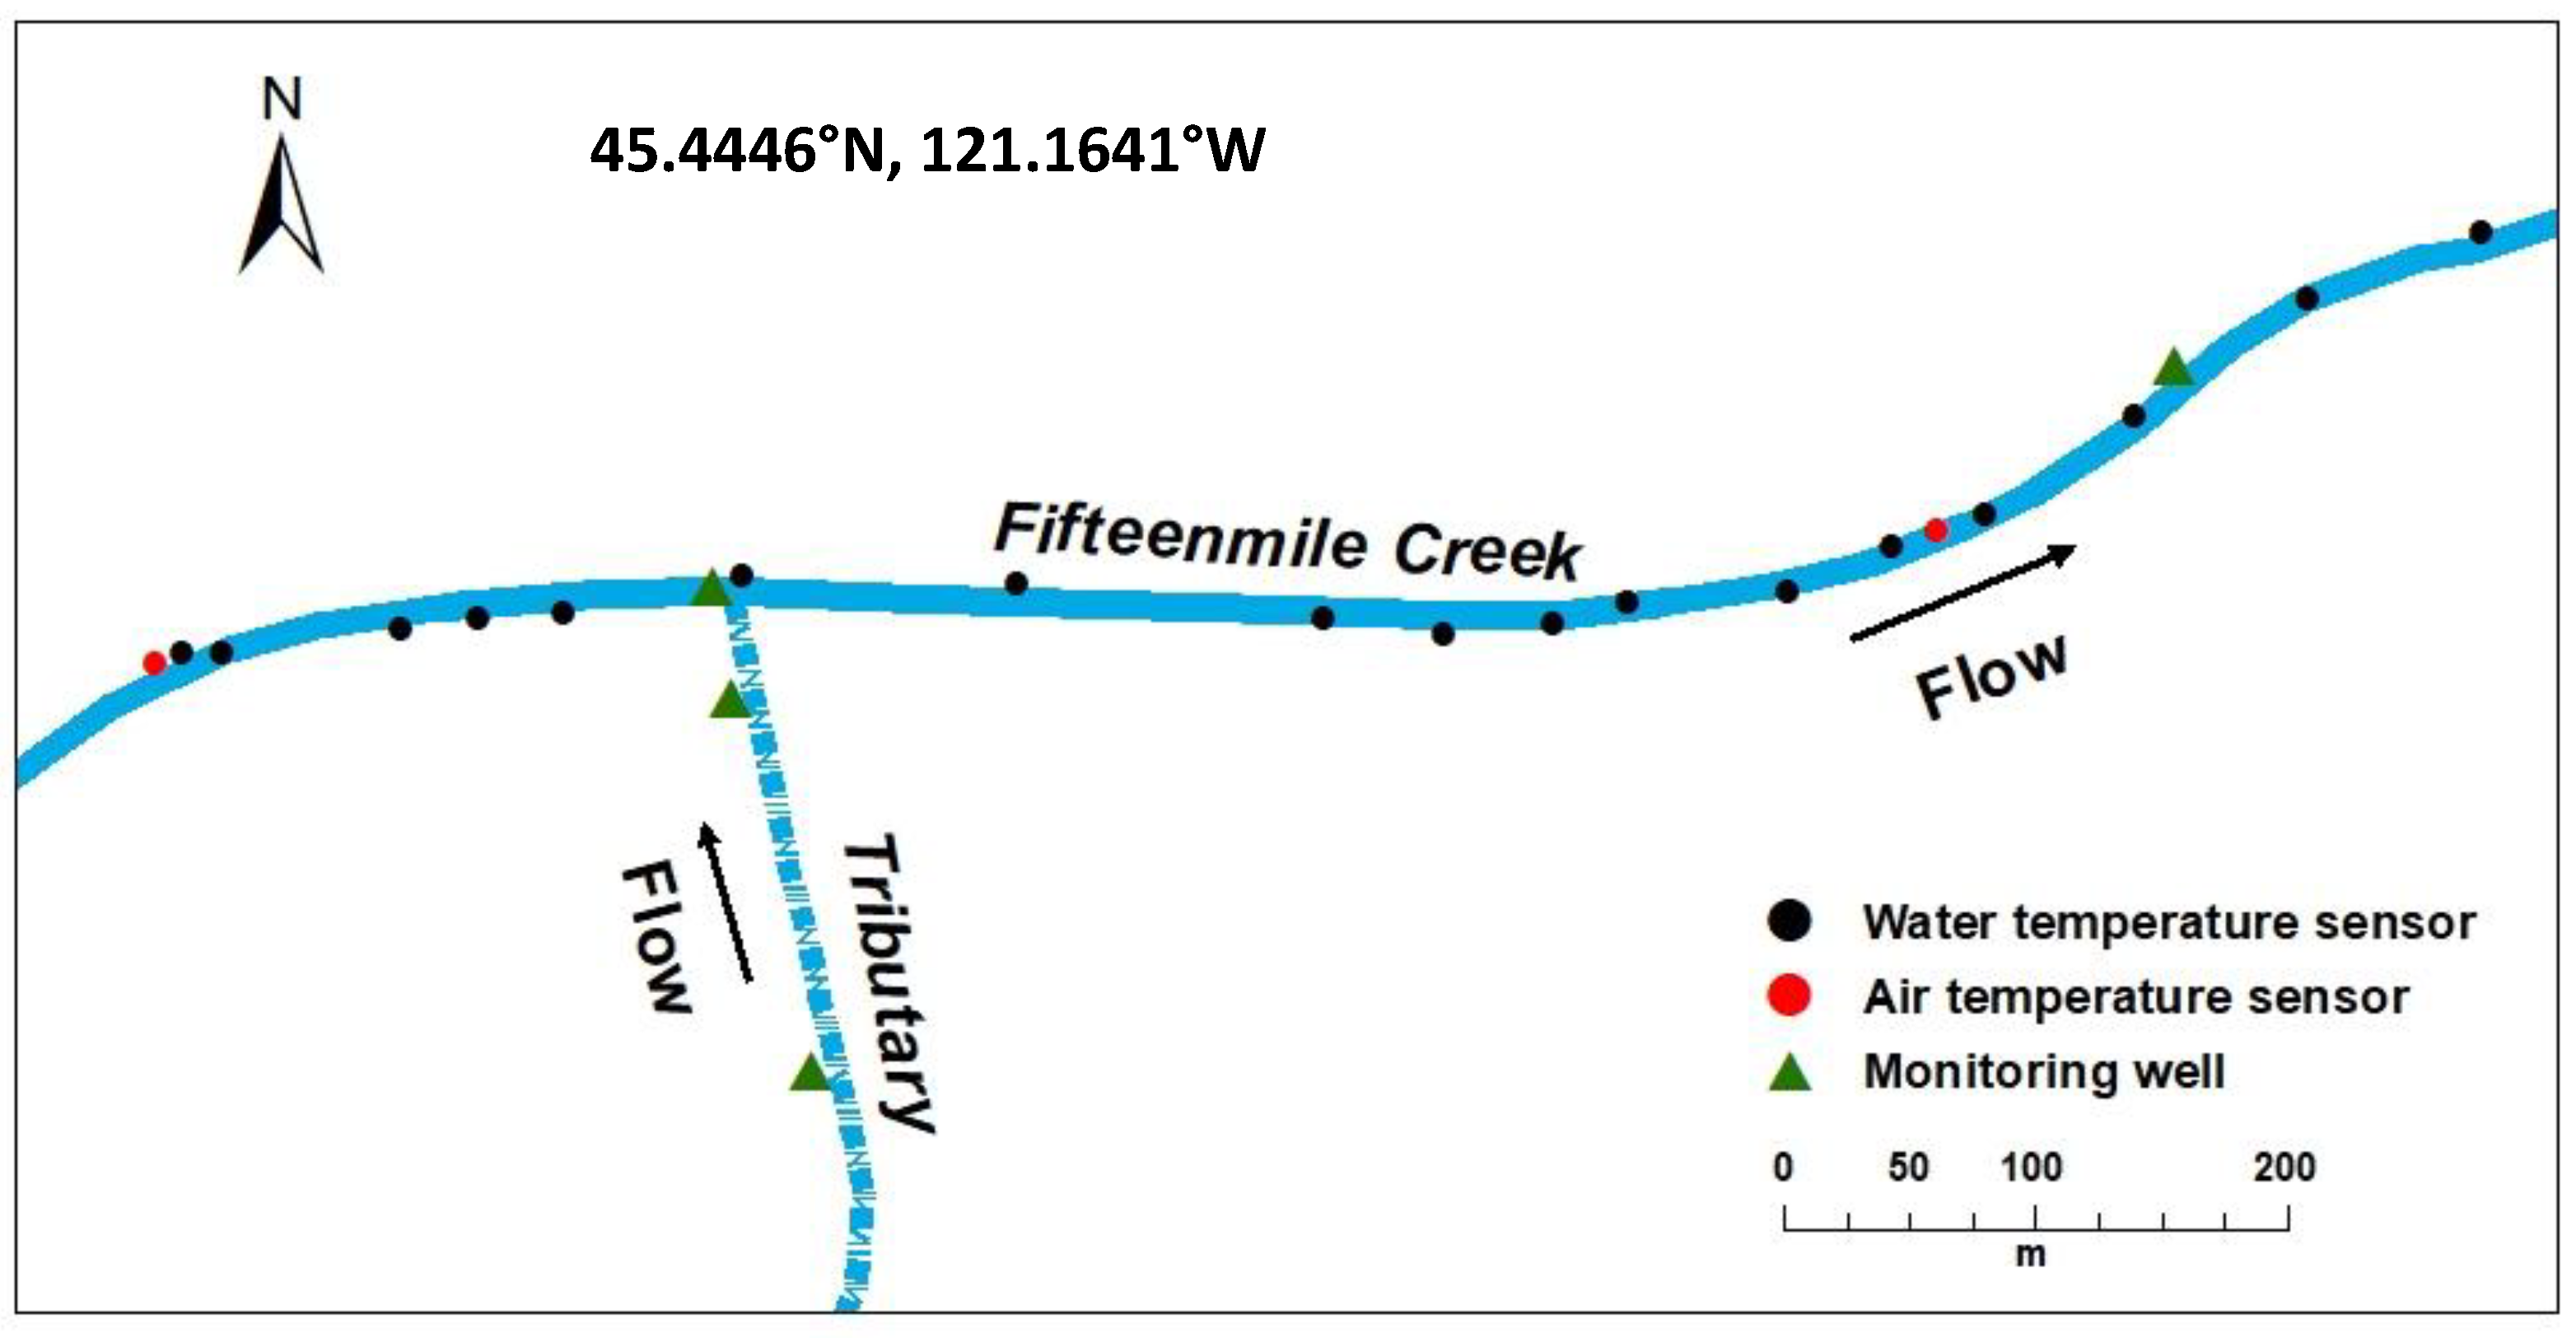
There was a lack of data regarding subsurface flows outside the 800 m reach evaluated; therefore, shallow groundwater flows were not included in the SVR analyses. Similar to that reported by Simmons et al. [
80], our study indicated that colder groundwater inputs could influence stream temperature, at least at a small scale. This suggests that subsurface flows may serve as a modulating influence and potentially produce cold-water habitat at the confluence. Mean daily shallow groundwater temperatures just before the confluence with the intermittent tributary were lower than those downstream, indicating that the influence of groundwater inflows may be localized.
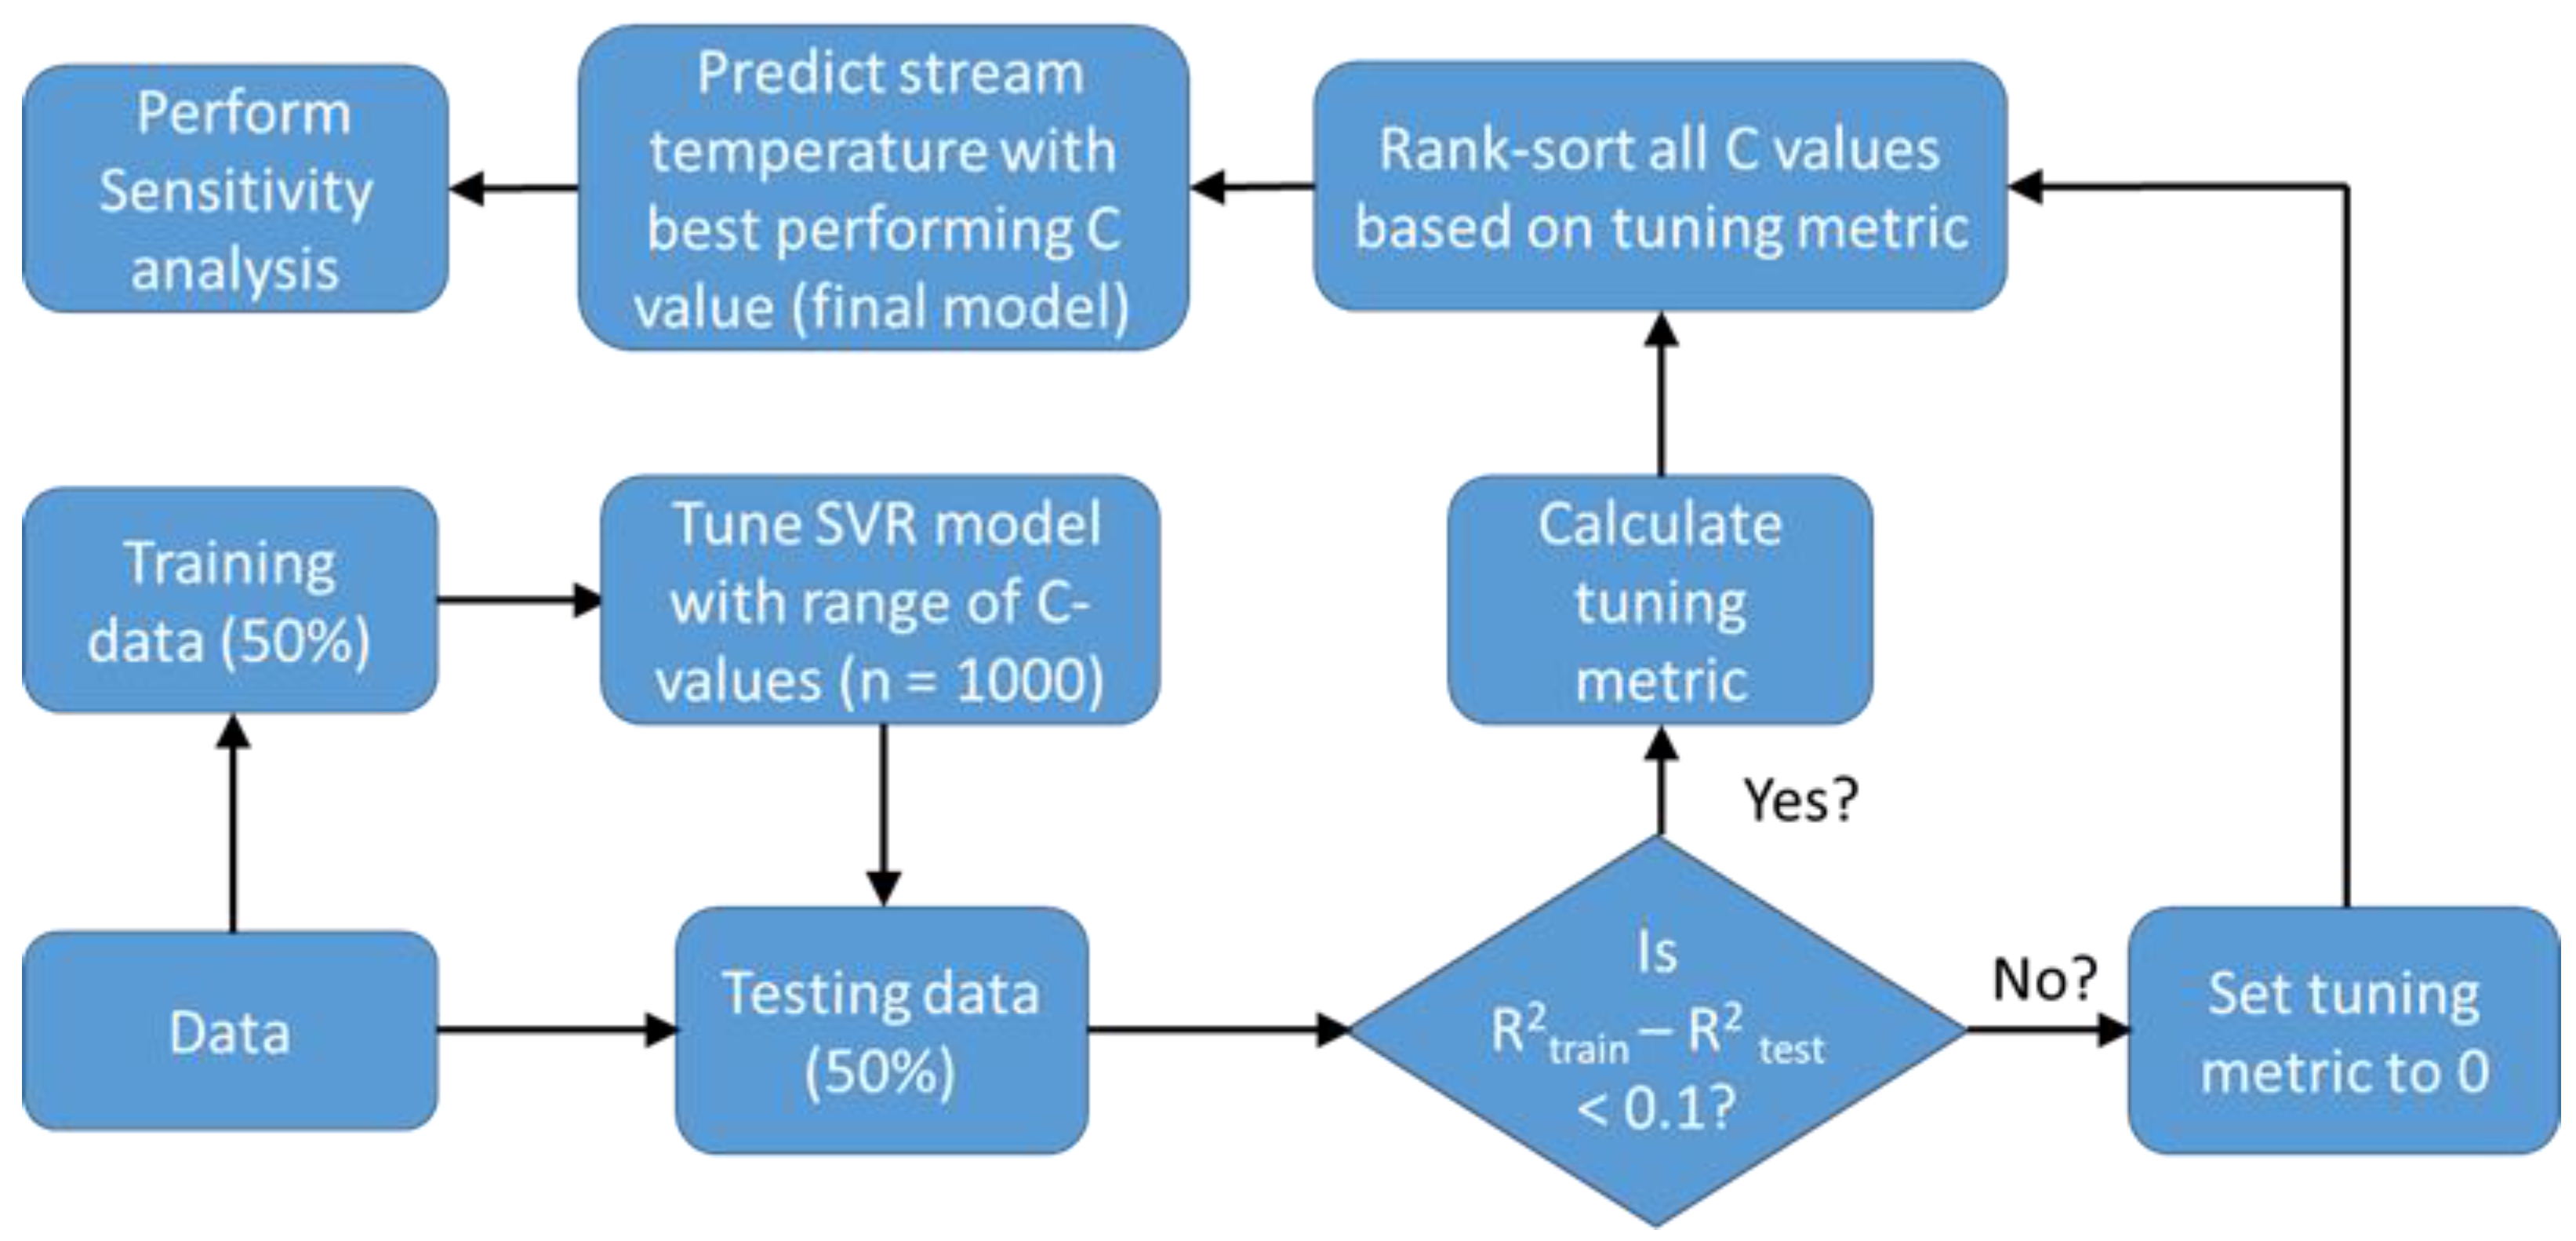
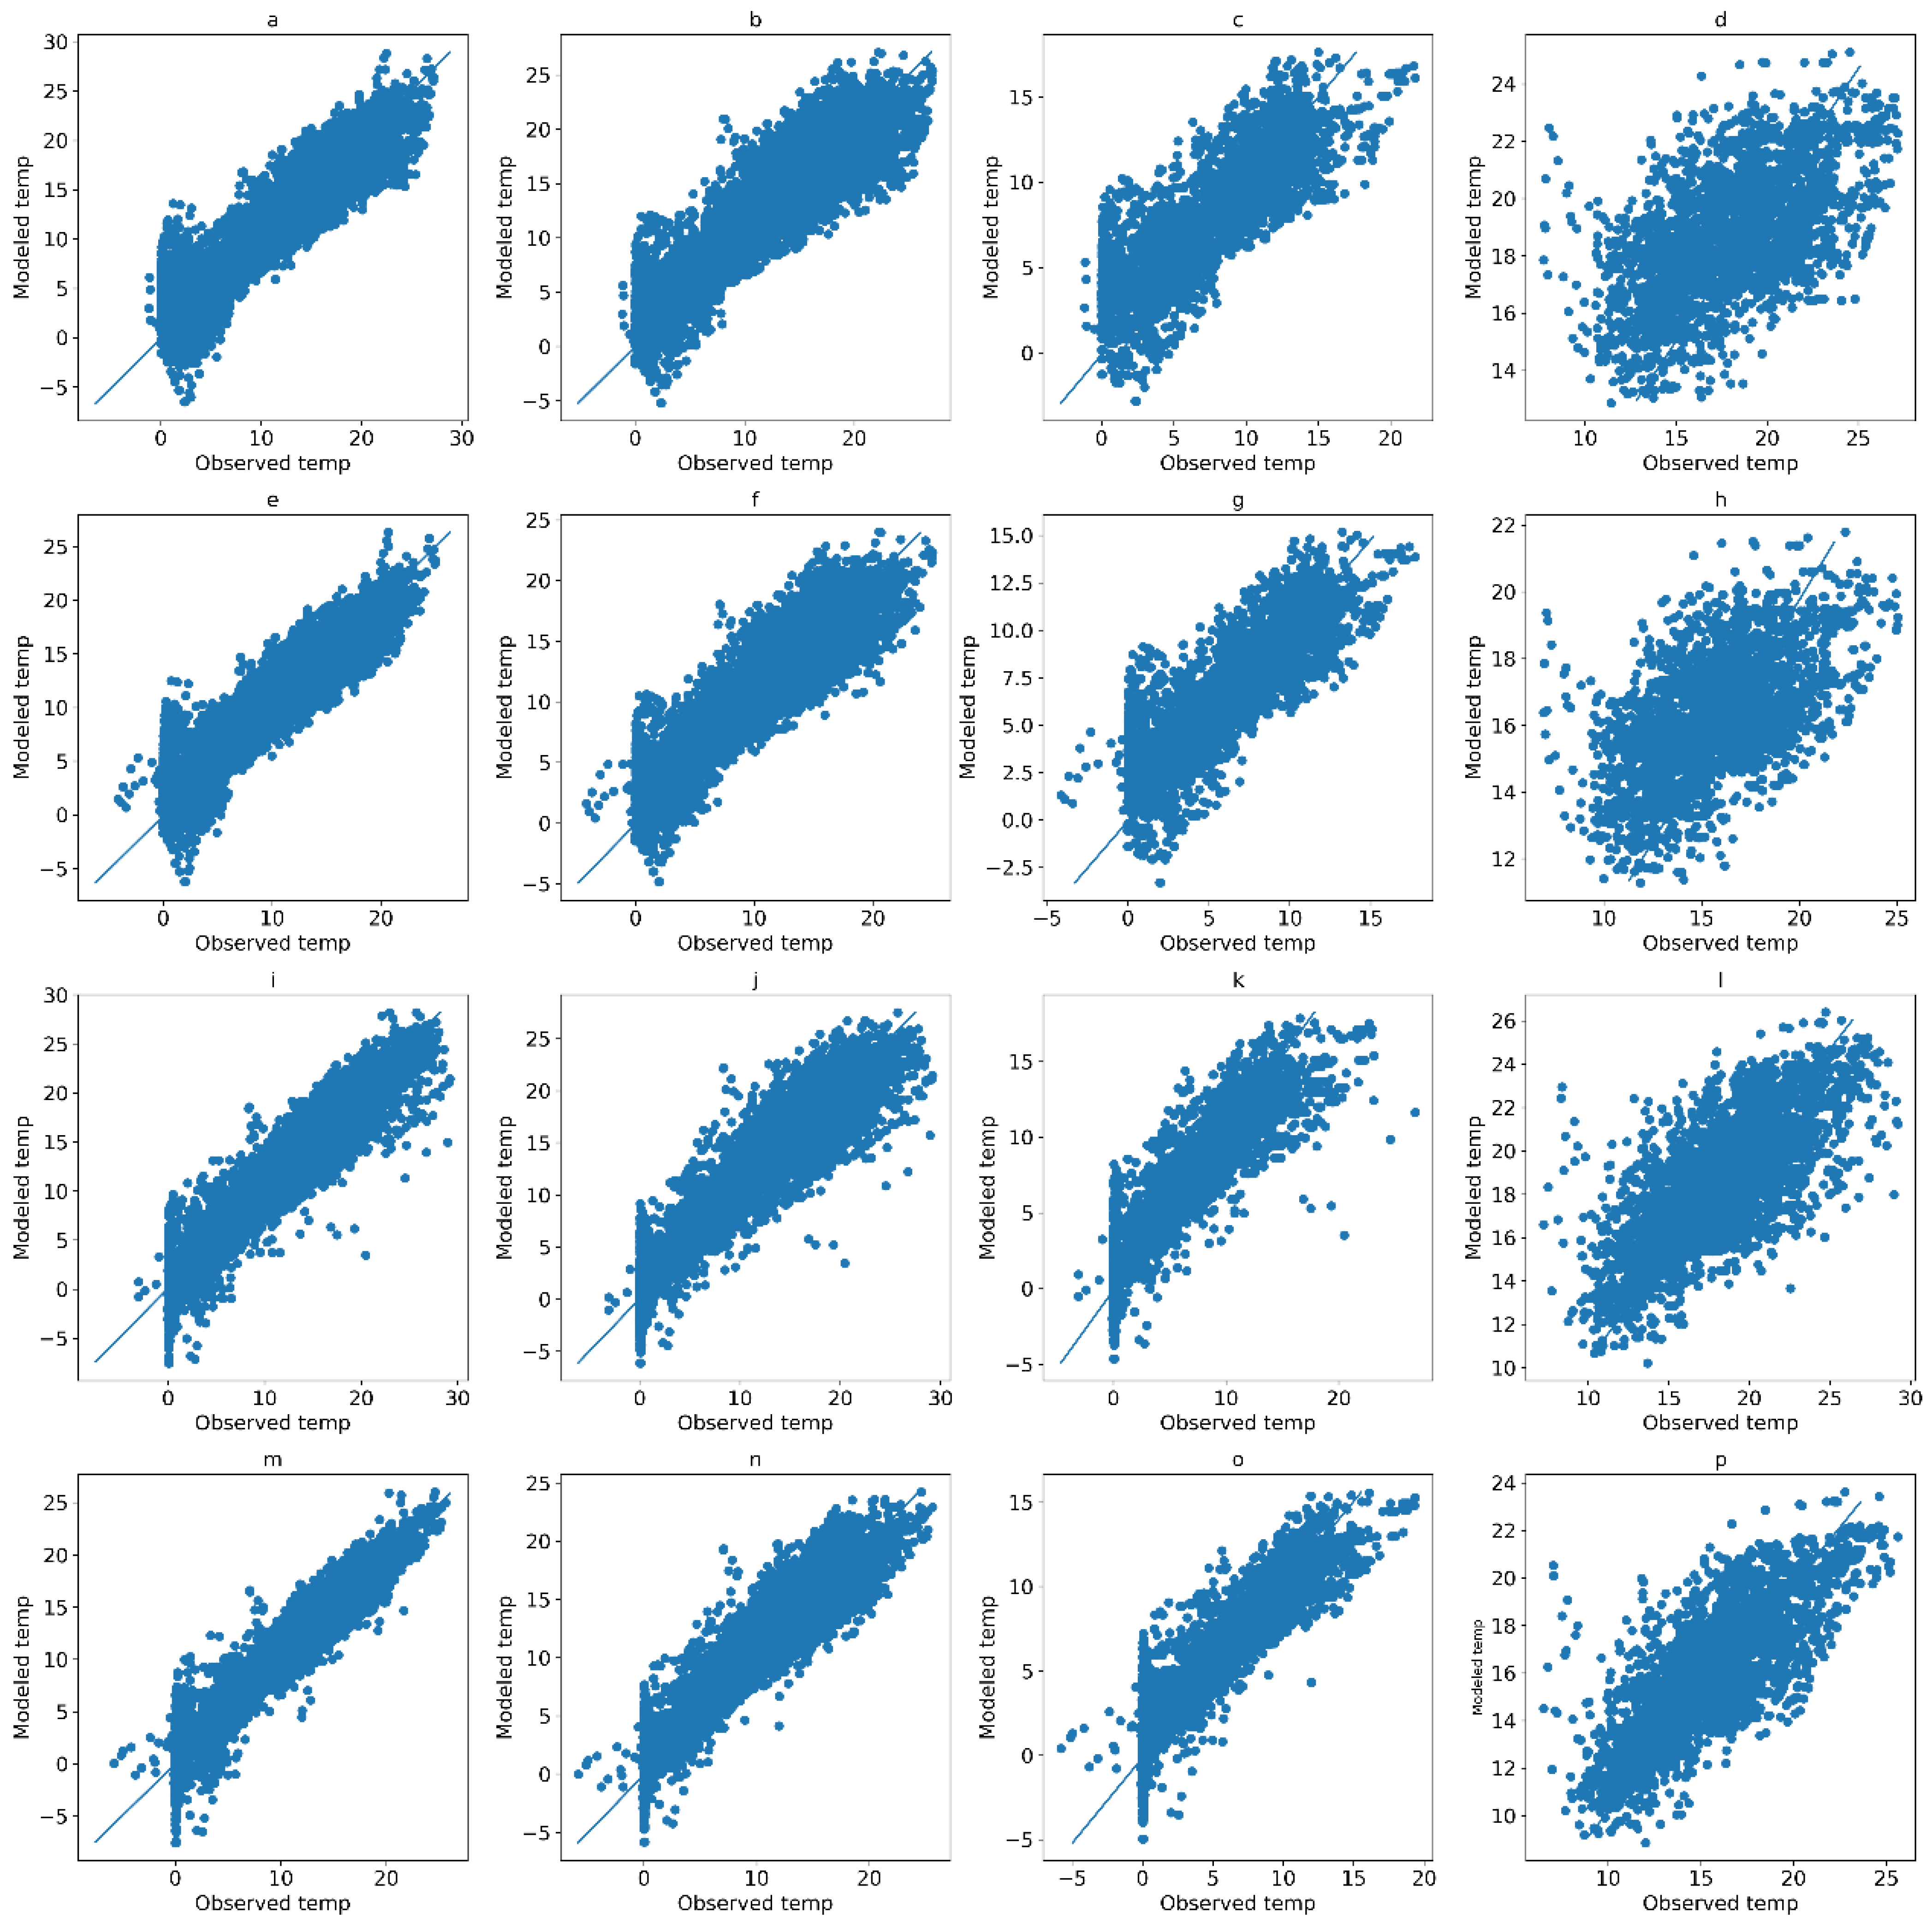
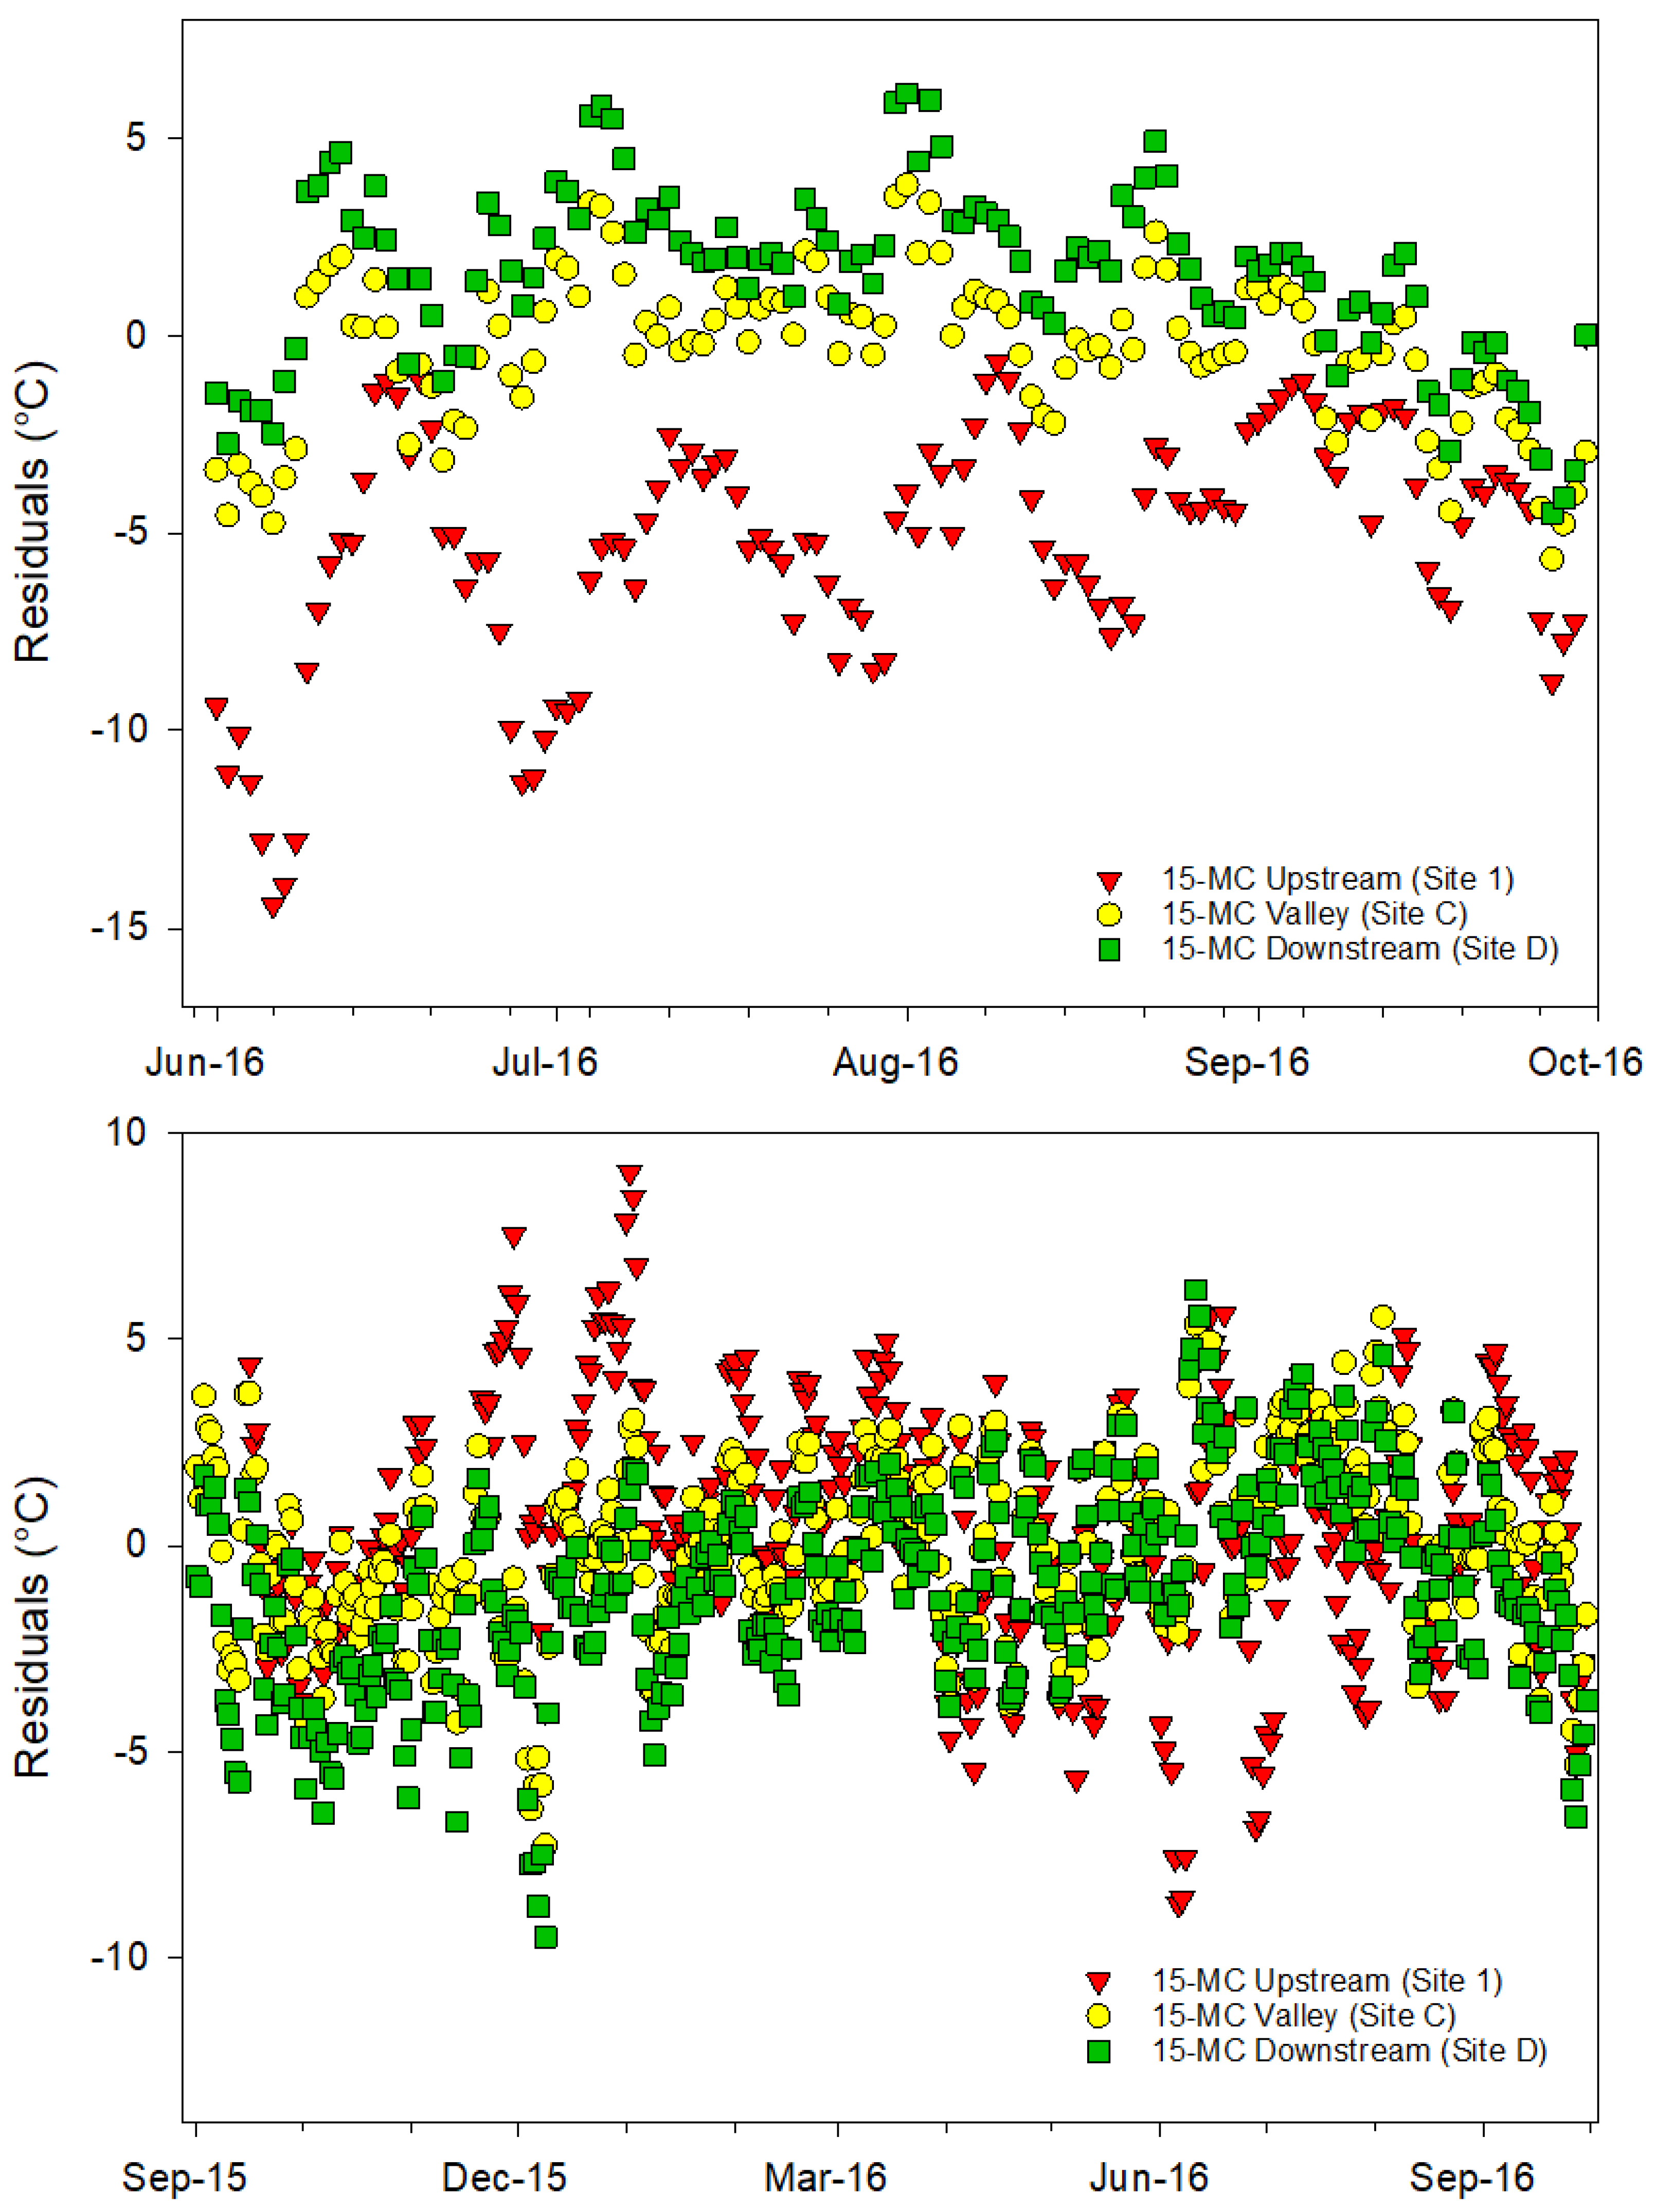
The overall SVR model performance varied with the stream temperature scenario tested, the environmental parameters included, and the period assessed (seasonal vs. full-year). Variations were expected based simply on the number of parameters used, as an increase in regression parameters is generally associated with an increase in R2 values. However, the inclusion of land cover parameters and additional atmospheric variables (e.g., PPT and VPD) modestly improved performance over the analysis that only used air temperature and Q. The SVR model performed the worst during the seasons when Q was the lowest and stream temperatures were the greatest. This suggests that other factors not examined in the SVR used in this study may also affect stream temperature.
The SVR model results highlight several limitations to the use of regression approaches. For example, hysteresis associated with seasonal changes is difficult to capture in stream temperature models. Regression models are often more effective for stream temperature modeling at weekly or longer scales due to the presence of autocorrelation at shorter time scales [
22,
83]. However, we found that the SVR model we tested generally performed better on daily scales than on weekly scenarios. Further, the relationship between air and stream temperature is not linear in all cases [
22,
84], particularly at high and sub-zero water temperatures. Therefore, non-linear approaches (e.g., [
85]) are also commonly used. The SVR analysis applied in our study was able to predict general stream temperature patterns but did not predict extreme maximum and minimum stream temperatures (as the water temperature remains relatively constant with air temperature at or below freezing). This suggests that a non-linear approach may be more appropriate for modeling temperature beyond certain thresholds (e.g., sub-zero stream temperature). However, this study’s SVR approach is an easily replicable approach that can be applied at other study sites, provided that these limitations are acknowledged.
This research highlighted several critical areas for future research into stream temperature dynamics in semiarid systems. Stream temperature can be impacted by environmental characteristics that were beyond the scope of this study (e.g., riparian soil types). For example, streambed heat exchange can impact stream temperature dynamics of shallow streams [
86]. Irrigation can also influence groundwater discharge to stream resulting in impacts on stream temperature [
87]. Further, the monitoring sites selected for this study were chosen to represent different areas along the longitudinal gradient and were also based on landowner participation; additional sites at higher and lower elevations could provide a more comprehensive model. Land use and land cover beyond the riparian area may also play a role in stream temperature dynamics. While beyond this study’s scope, future research should address the role that ecohydrologic connections across the landscape (e.g., land-use practices outside of the riparian area) may play in stream temperature dynamics.
We did not attempt to model stream temperature regimes under alternative environmental conditions, such as altered land cover or increased air temperatures. Therefore, our results should be interpreted with caution regarding how changes derived from land management practices, such as the planting or removal of riparian vegetation, may influence stream temperature.


