3.1. Estimation Results
We estimated our model as both a linearized spatial multinomial logit and a non-spatial version. The results of that model gave estimates of the probability of a hectare being in a particular use by grid cell, taking into account spatial dependence of the land shares across cells. We estimated land use changes in two different time intervals, one for 2006 to 2011 and the other for 2011 to 2016, then compared differences between those periods.
We found that the coefficient estimates were generally robust between the non-spatial fractional multinomial logit and the spatial version. In terms of choice between the spatial and non-spatial versions, we found that the spatial lag parameter estimates were all positive and significant at the 1% level, except for urban lands (
Table 4). This implied that the estimates without spatial lag terms could lead to biased estimates [
44], and thus, we focused on the spatial estimates in the rest of this paper.
Comparing the results for the period 2001–2006 with those for the period 2006–2011, we found that the cropland share was more influenced by land use patterns in nearby areas in the latter time interval, with pastureland and grassland being less dependent. The spatial dependence terms were mostly significant, excluding those for urban, which likely reflects the fact that allocation to urban lands is largely irreversible. Moreover, the spatial dependence in forestlands was found to be negative. This may be related to the forest fragmentation problem, in which a large forest is segmented into small and sparse forests mostly due to forest loss or distributional changes for other land uses [
22,
45]. In this case, a large forest may compete with nearby forests and lead to negative spatial dependence on contiguous forest shares. The results differed from those in a China setting [
28,
46] which found increasing spatial dependence over time. Whether country-specific characteristics affect spatial dependence, or whether other structural changes have occurred should be further investigated.
Table 5 and
Table 6 contain estimates of the average effects of the independent variables on land use change for the intervals 2006–2011 and 2011–2016, respectively. We found that the partial effects of the explanatory variables were mostly consistent across these intervals.
Table 7 also shows calculated inflection points for each measure and the signs of the partial effects before and after the inflection points.
The results indicate that higher annual average temperatures above 10 °C led to a decrease in crop and forest lands and an increase in pasture and grasslands. We also found that forest land increased up to an annual average temperature of 12.2 °C and fell above that, while urban land increased up to 16.4 °C and fell thereafter. Collectively, these results for grass and pasture lands reflected a move into crop or forest or urban lands as temperatures increased in areas cooler than the inflection point and movement into grass and pasture lands above that point. The increasing and decreasing effects on crop and forest land-use changes were stronger (with larger magnitudes in quadratic terms) than the effects on urban land-use changes, while the effects from the propensity of grassland to move into other uses were stronger than those for pasture land. Increases in precipitation led to movements into crop, pasture, and forest lands up to the inflection point but decreased thereafter. The opposite effect was seen for grass and urban lands. Larger levels of variation in temperature generally decreased crop, grass, and urban land use but increased that for pasture and forest. For precipitation, greater variation decreased crop and pasture usage but increased that for forest, grass, and urban.
Higher elevations decreased both the crop and pasture shares. This indicated that crop and pasture lands tend to be in lower altitude areas. Land slopes had negative impacts on cropland shares and positive impacts on pasture, forest, and grass. Thus, croplands were more common on flat lands while grazing and forest were favored as slope increased.
Soil quality (in the form of land capability class as it improves moving downward toward 1) positively affected crop, pasture, and forest shares, with the effect greater in the latter time interval for crops and pasture but less for forest. This may indicate that crop and pasture lands were more dependent on land or soil quality between the periods, whereas forests were less dependent.
Increases in the proportion of irrigated land led to greater crop and urban land shares but had negative impacts on pasture, forest, and grasslands. Clearly, more irrigation water supports more land use for crops and also likely indicates available water for urban expansion.
Increases in farm net income decreased crop land use but increased pasture. This may imply that croplands respond more to longer-run asset values but less to short-run annual income, while pasturelands do the opposite.
Non-farm income decreased land use for crops and pasture but increased that for grasslands, forest, and urban lands. This likely reflects greater off-farm commitments and consequent adoption of less labor-intensive forms of land use.
Areas with higher population density increased the incidence of pasture and urban lands but exerted negative impacts on grasslands. This implies that as population grows, grasslands may be converted to pasture or urban lands. It also indicates the pasture lands may be near to urban lands to maintain tax reductions for agricultural land uses involving livestock.
Land use in the previous period positively affected land use in the current period, as we saw in
Table 1. Clearly, land allocated for a particular use tends to remain in that use in the next period. However, there are more complex relationships between land uses. Increases in previous forest shares had negative impacts on current cropland shares and vice versa. This may imply that as the region becomes more forested, croplands tend to move into forest lands, but as cropland shares increase, forests are likely to be converted to cropland perhaps due to the incidence of supporting infrastructure. We also found that pastureland and grasslands compete, as pasture decreased when grassland increased or vice versa. This may be because they are competitive as land uses for grazing. We also found that large shares of forests and grasslands in the previous period decreased the probability that land would change to urban use in the current period. This indicates that urban lands are most likely to be developed from crop and pasture lands and less likely to be developed from forest and grasslands.
3.2. Simulation under Climate Scenarios
Using temperature and precipitation estimates from the Representative Concentration Pathways (RCP) of the Coupled Model Intercomparison Project Phase 5 (CMIP5), we applied the model to project land use allocations in 2030, 2050, and 2070. We obtained downscaled projected temperature and precipitation outputs from six climate models: CanESM2, CCSM4, CESM1-CAM5, GFDL-CM3, HadGEM2-ES, and MPI-ESM-MR from the CONUS 1/8 degree BCSD (bias-corrected and spatially downscaled) files available from the Technical Service Center, US Bureau of Reclamation [
47]. We use the RCP 2.6 scenario implying optimistic conditions with the lowest level of greenhouse gas emissions, RCP 4.5 scenario deemed as an intermediate scenario, and RCP 8.5 scenario as the hottest scenario. Because we focused on the climate effects on land use changes, we predicted land shares while holding all other variables at current levels. We evaluated the change in shares from the 2016 level.
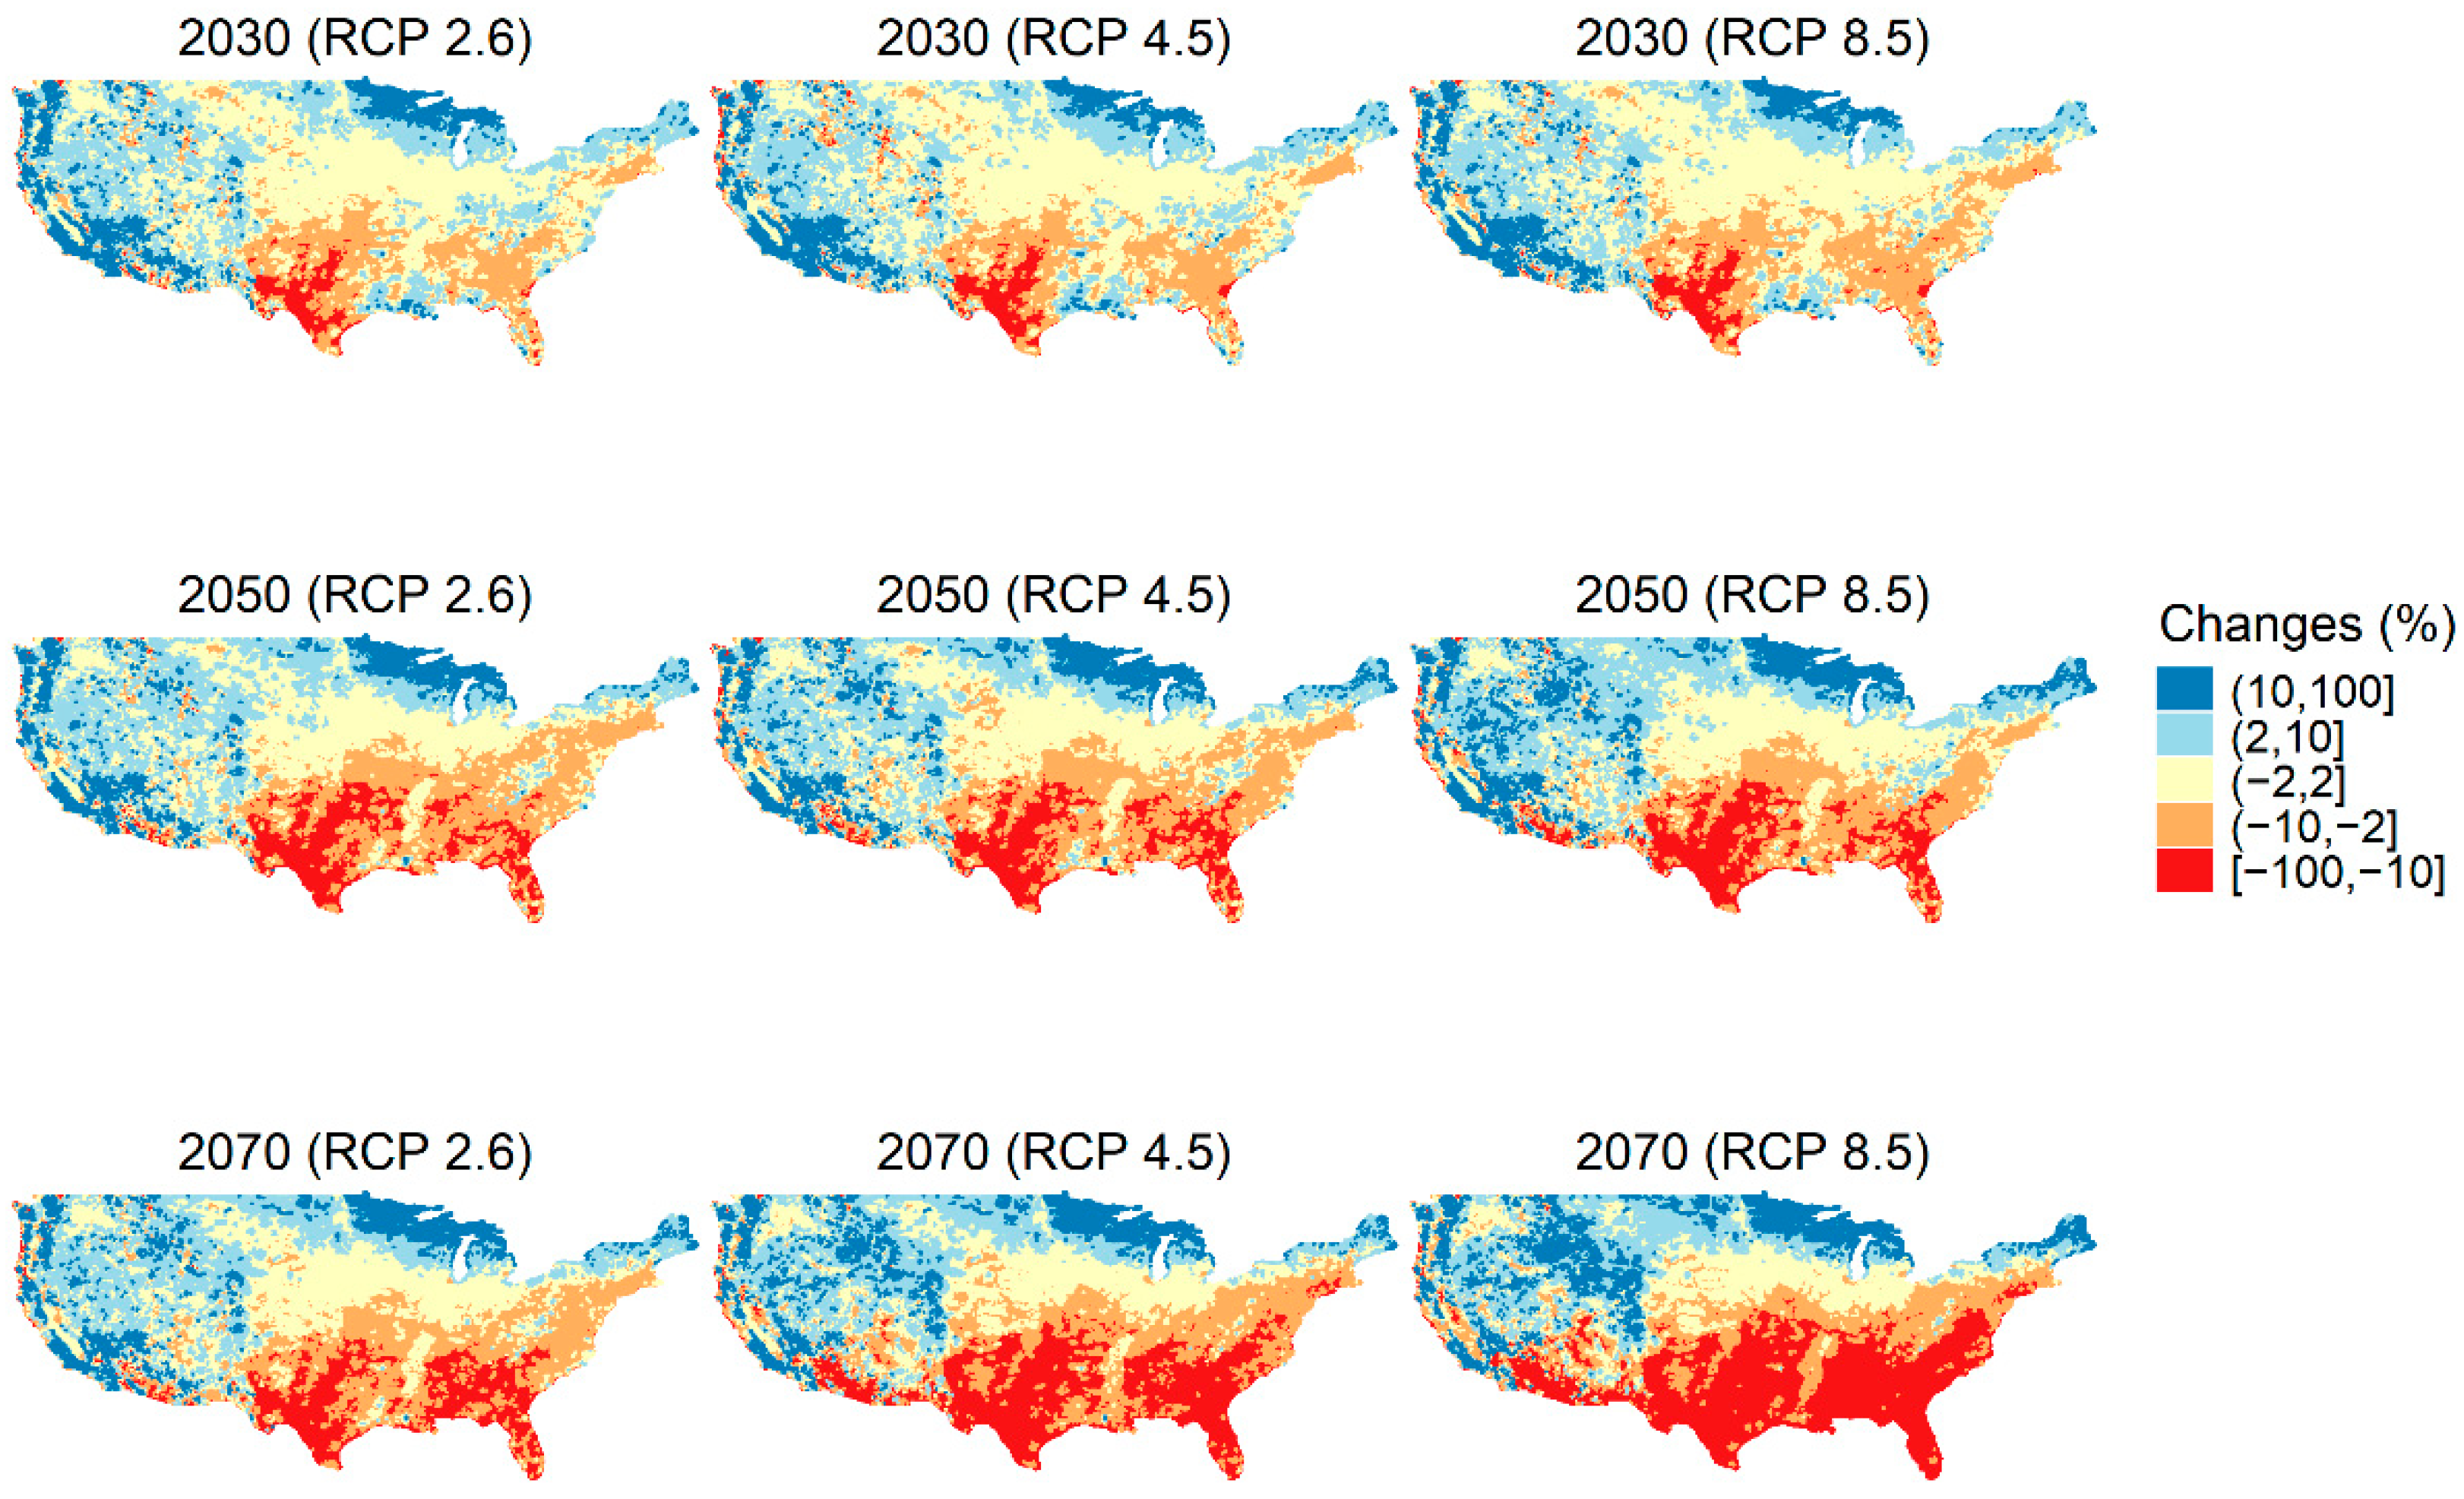
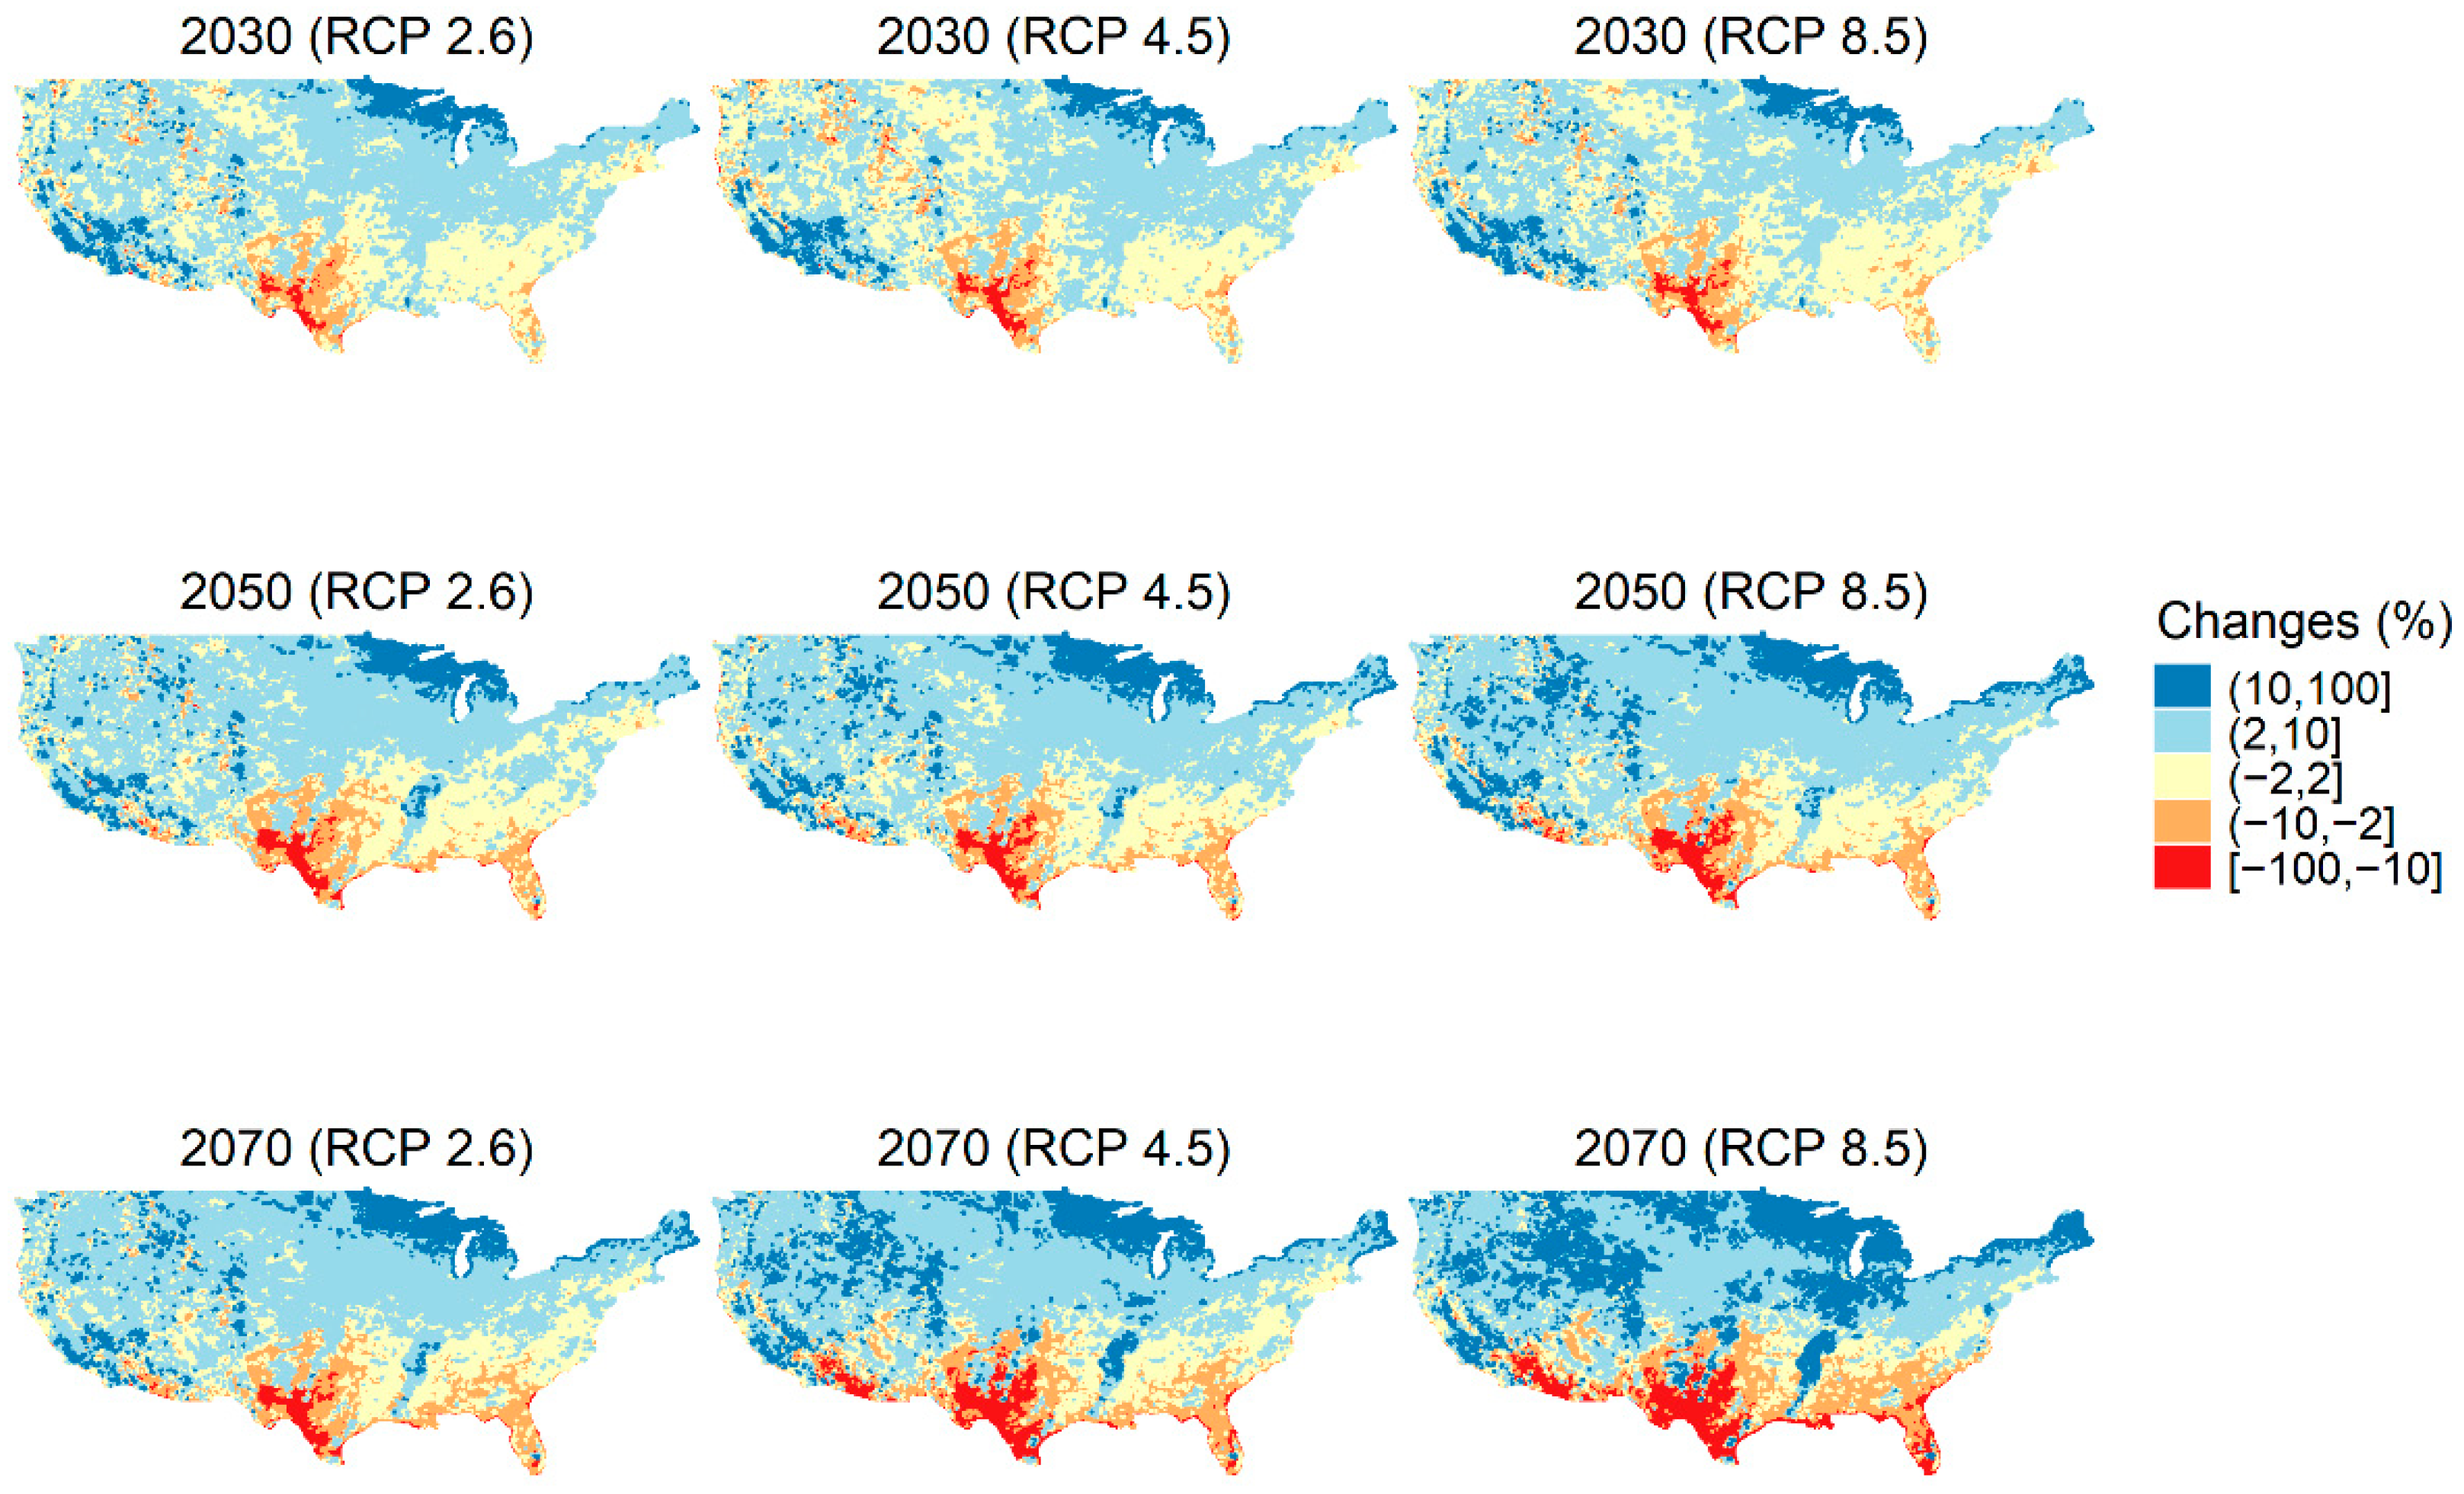
Figure 2 shows the changes in land share for crops under the RCP scenarios. As expected, the RCP 2.6 scenario yielded the least change while RCP 8.5 yielded the largest. In the figure, we see cropland shares decreasing in southern areas and increasing in the Northern, Mountain and Pacific areas.
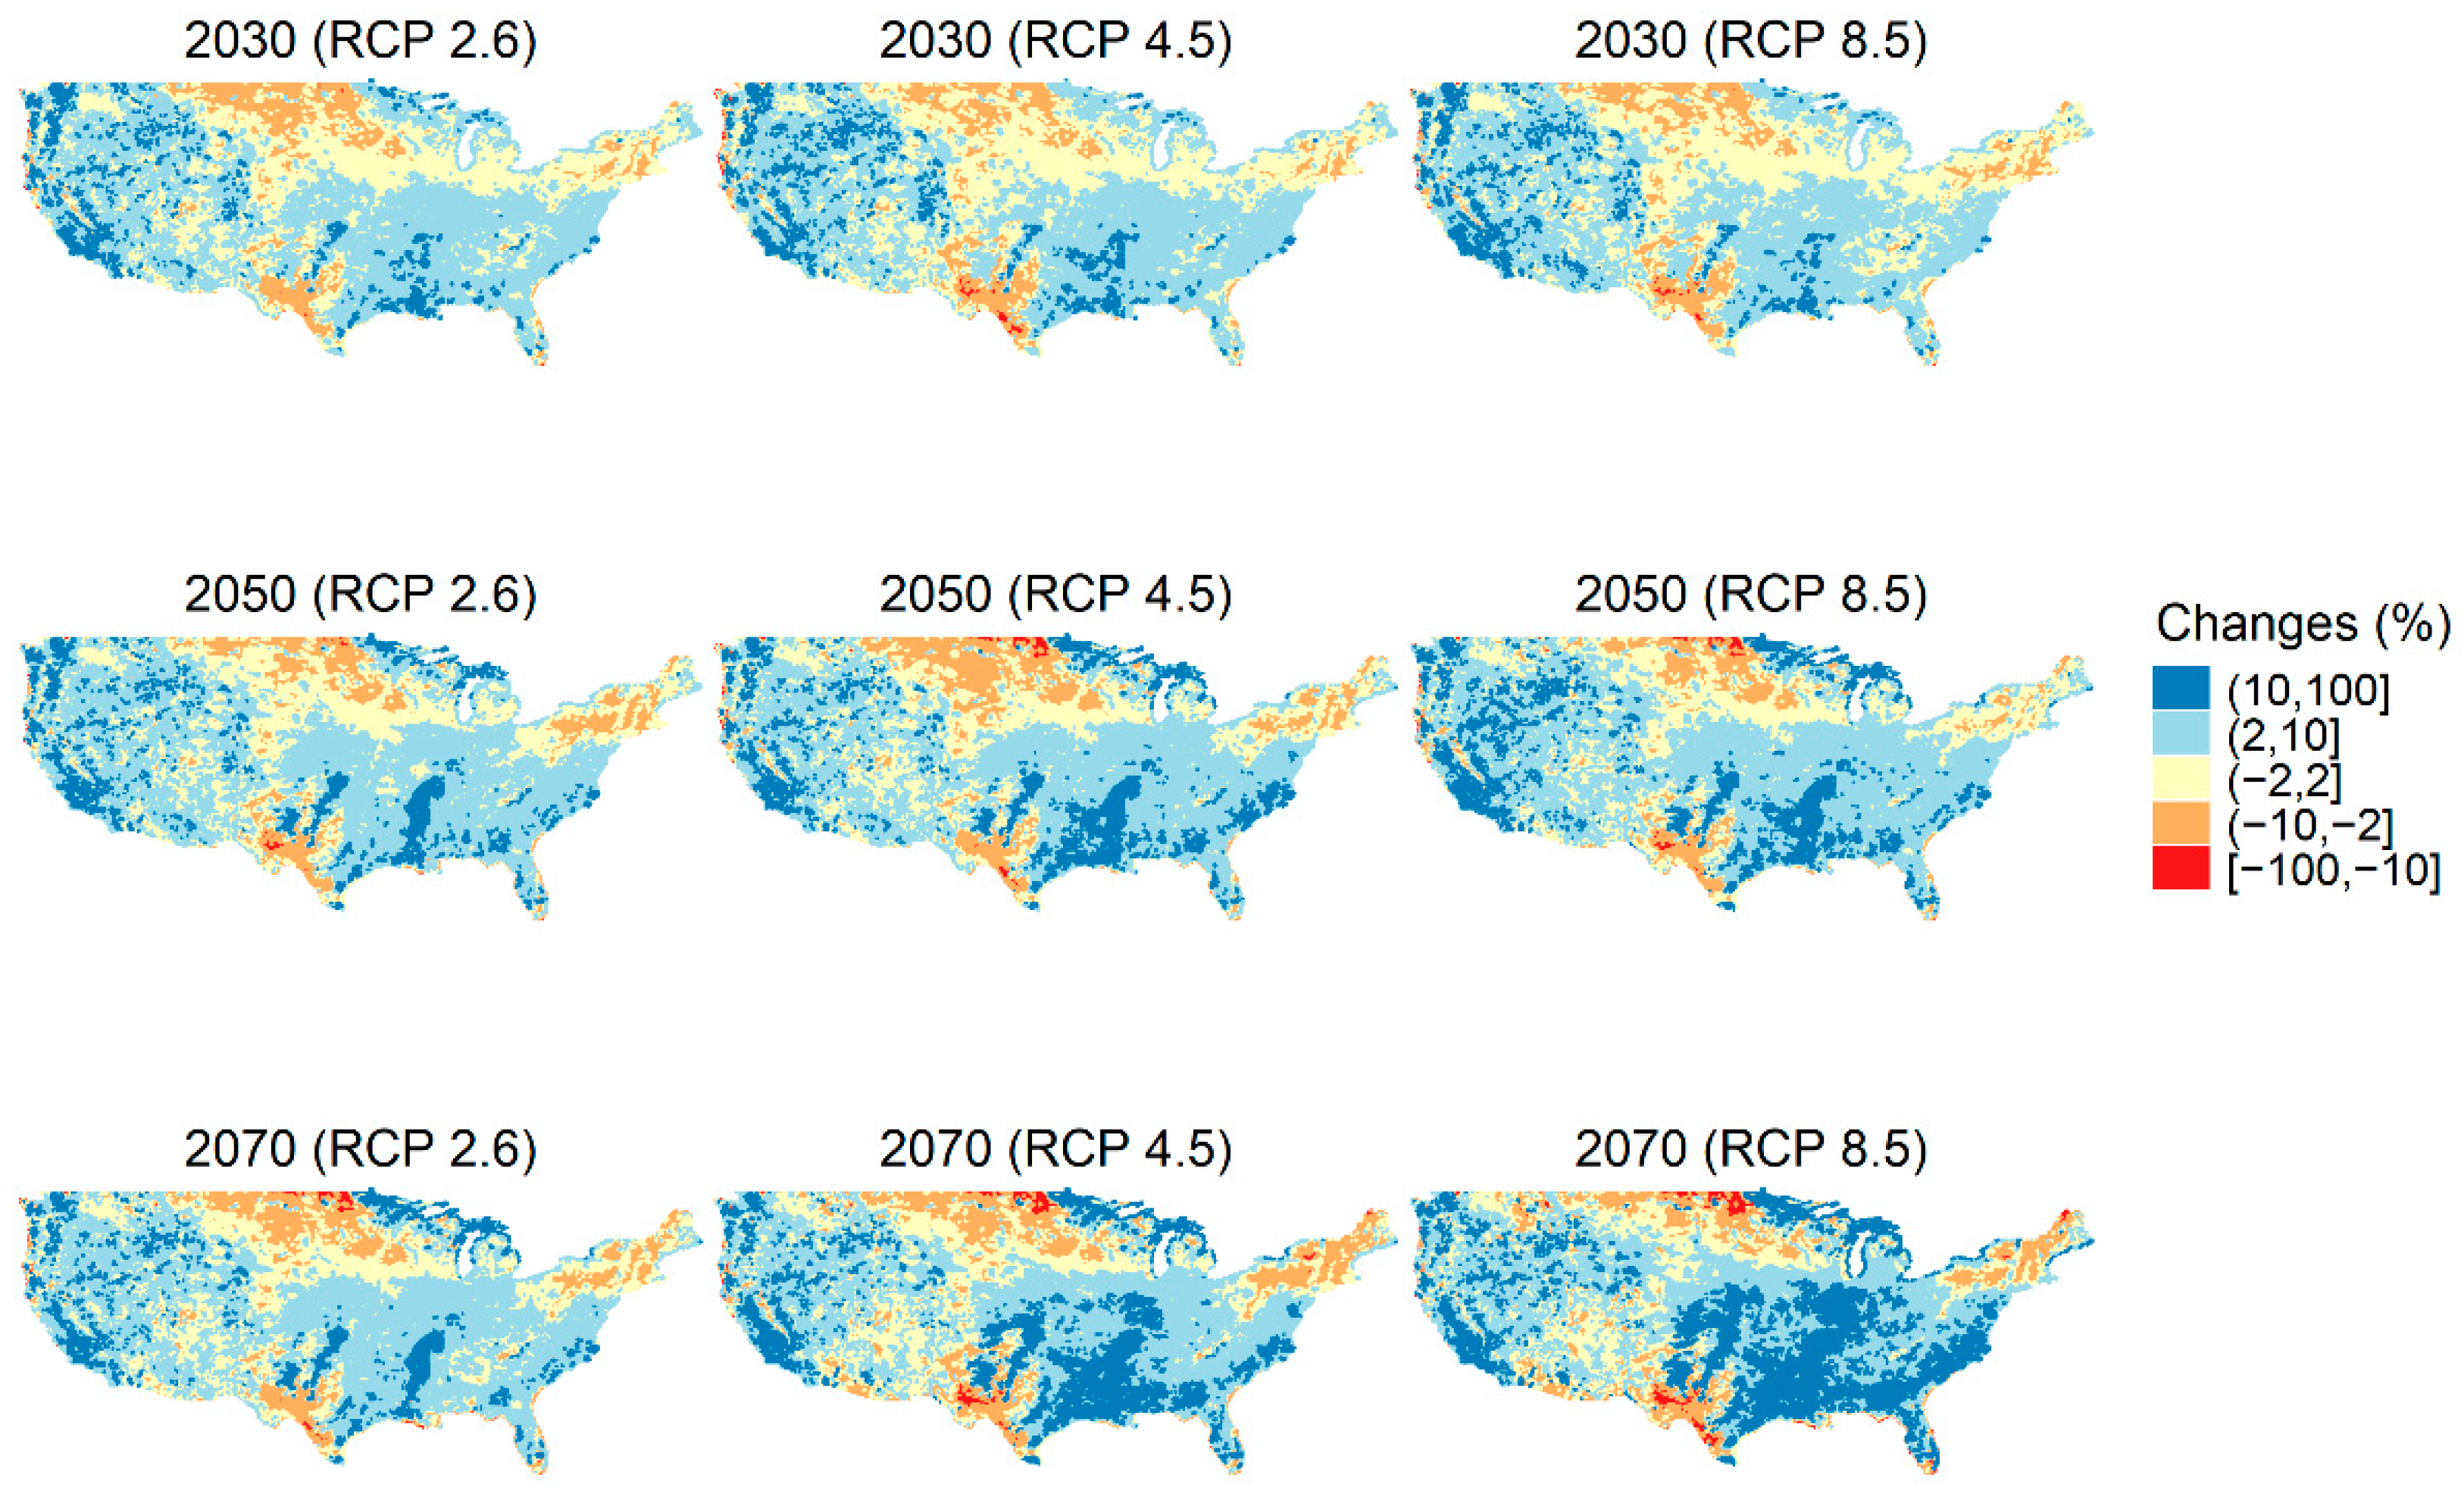
Figure 3 and
Figure 4 portray the projected pasture and grassland shares for 2030, 2050, and 2070 compared to 2016. These figures illustrate decreasing shares in the Northern and Midwestern areas, while Southern areas exhibit increasing shares. Again, we see greater sensitivity under RCP 8.5 than under RCP 2.6 or RCP 4.5, particularly in the Midwest. The results for pasture and grass shares are quite similar, reflecting their common use for livestock and the possibility of a rather easy shift between those classifications. This indicates that croplands move into pasture or grass as climate change proceeds.
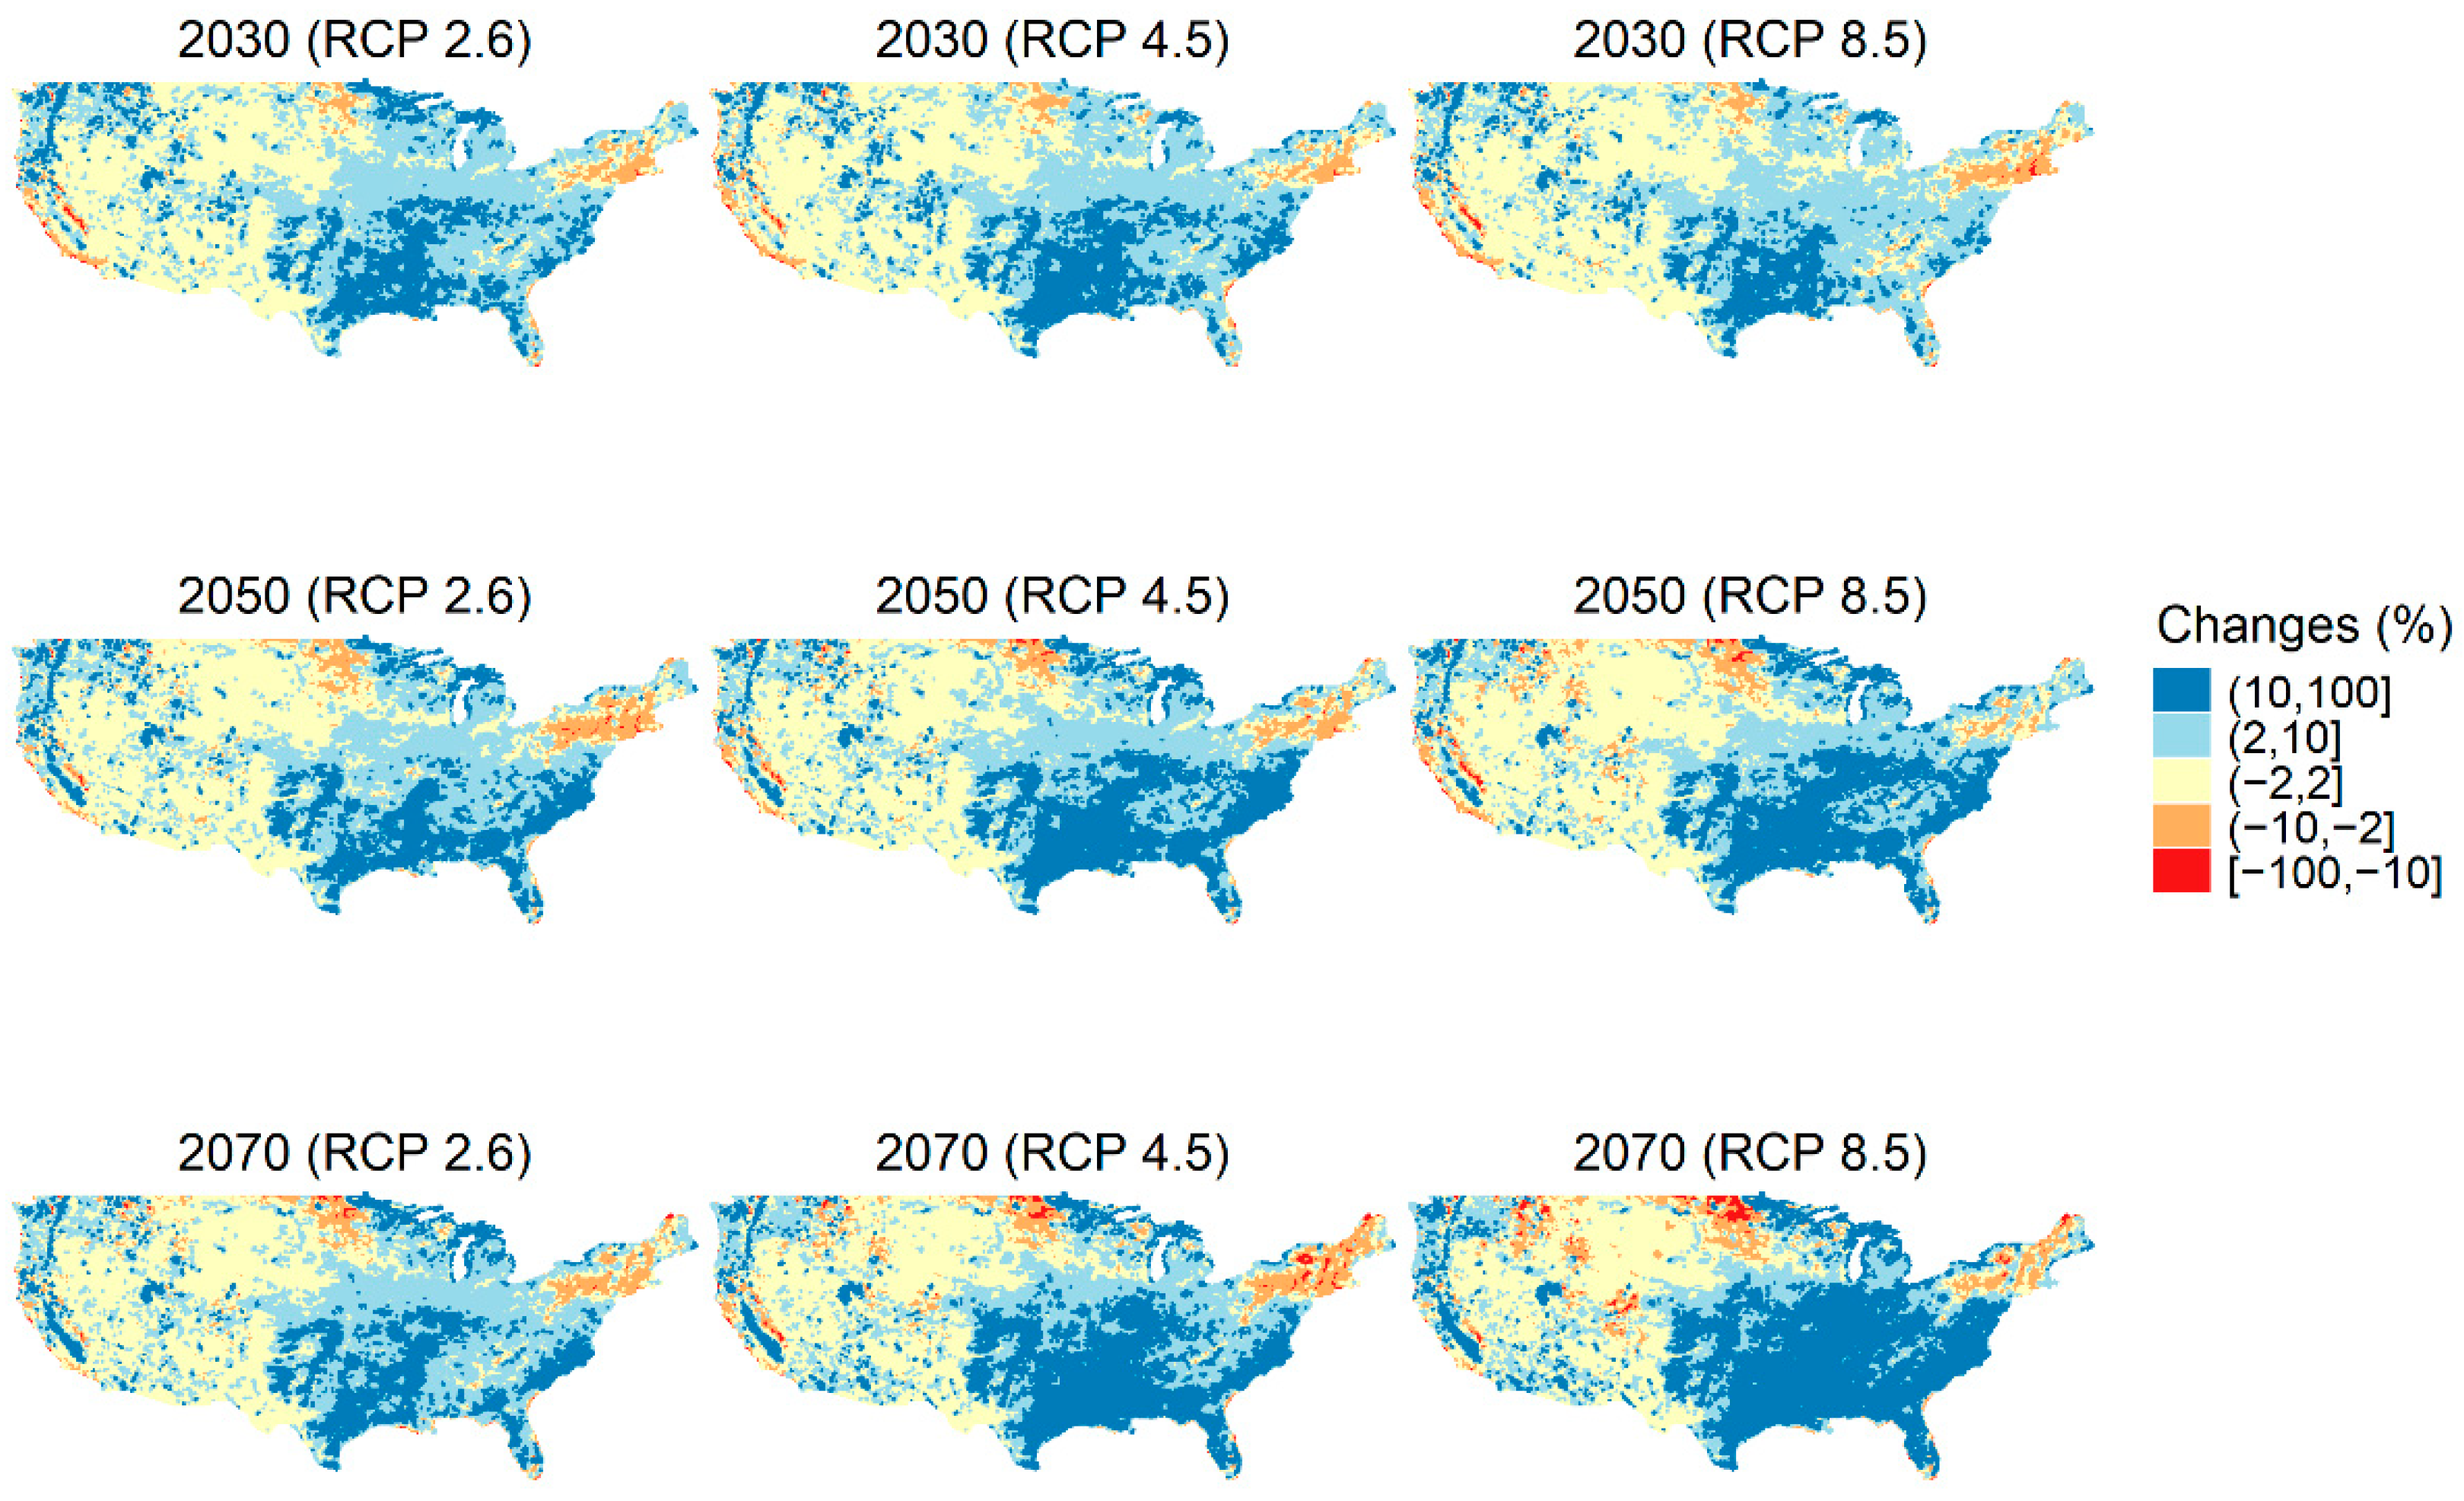
Figure 5 and
Figure 6 show projected shares of forest and urban land. In general, they show similar patterns. This may be because the areas with a large share of forest are near more highly developed areas. While both forest and urban land shares decrease in the lower latitudes and increase in the higher latitudes, the increasing forest land share in the Midwestern areas but decreasing shares in the Rocky Mountains likely reflect moisture conditions. The RCP 8.5-based estimates again show greater changes than those for RCP 2.6 or RCP 4.5.


