Article

Tracking Deformation Processes at the Legnica Glogow Copper District (Poland) by Satellite InSAR—I: Room and Pillar Mine District

by
Benedetta Antonielli
1,*,
Alessandra Sciortino
2,
Stefano Scancella
3,
Francesca Bozzano
1,3 and
Paolo Mazzanti
1,3
1
Department of Earth Sciences & CERI Research Center on Geological Risks, Sapienza University of Rome, P. le A. Moro 5, 00185 Rome, Italy
2
Department of Civil, Construction-Architectural and Environmental Engineering (DICEAA), University of L’Aquila, Via Giovanni Gronchi, 18, 67100 L’Aquila, Italy
3
NHAZCA S.r.l., Via Vittorio Bachelet, 12, 00185 Rome, Italy
*
Author to whom correspondence should be addressed.
Land 2021, 10(6), 653; https://doi.org/10.3390/land10060653
Submission received: 18 May 2021 / Revised: 11 June 2021 / Accepted: 15 June 2021 / Published: 18 June 2021
(This article belongs to the Special Issue Geomatics for Resource Monitoring and Management)

Abstract

:
Mining exploitation leads to slow or rapid ground subsidence resulting from deformation until the collapse of underground post-mining voids following excavation activities. Satellite SAR interferometry capabilities for the evaluation of ground movements allows the monitoring of intensive surface mine subsidence and can provide new knowledge about the risks in the mining industry. This work integrates both conventional and advanced Differential SAR Interferometry (DInSAR) to study the ground subsidence in the Legnica Glogow Copper District (LGCD, Poland) by processing about 400 Sentinel-1 images from October 2014 to April 2019. Even without field data and information on past and ongoing excavation activities, the DInSAR approach allowed us to identify 30 troughs of subsidence, ranging from 500 m to 2.5 km in diameter, which in some cases, took place several times during the analyzed time span. The cumulative subsidence in 4 years and 7 months exceeds 70 cm in several zones of the LGCD. The sub-centimetric precision achieved by advanced analysis (A-DInSAR), allowed us to monitor the real extent of the mining influence area on the surface, with deformation velocities of up to 50 mm/year. The ground deformation detected at LGCD can be due to both mining-induced tremors and roof subsidence above the underground excavation rooms. As deformations do not occur concurrently with tremors, this can be related to excavation activities or to degradation of abandoned mines.

1. Introduction

As an active mining district, the Legnica Glogow Copper District (LGCD, Poland) represents a dynamic environment that evolves very quickly in time, following the ore exploitation activities in the room-and-pillar mines. The Lower Silesian region is widely exploited for copper extraction, and the LGCD mines represent an important source of ore managed by the KGHM (Polish acronym for Copper Mine and Mill Company), a mining company owned by the Polish government. The whole district is a risk-prone area that can be affected by subsidence and stability issues of the underground chambers and excavation fronts. Therefore, the active mining districts need accurate monitoring for preserving the safety of operators during the works and of nearby urban settlements.
The monitoring of mining subsidence by traditional techniques, such as field surveys, leveling, total stations, or GNSS, is labor-intensive and time-consuming [1,2] and it is usually limited to areas of a few square kilometers. Traditional techniques are indeed conducted on a point-by-point basis with limited spatial coverage, while the ground subsidence generally affects large areas [3]. Satellite remote sensing technologies such as Synthetic Aperture Radar (SAR) Interferometry (InSAR), can overcome this limitation, allowing us to analyze wide areas and obtain information from the past by means of data archives. InSAR has gained more and more utilization in mines monitoring, providing ground deformation measurements with sub centimeter accuracy [4,5,6,7,8]. This technique is very effective for structural health monitoring purposes involving structures like dams (e.g., [9,10,11] and Cultural Heritage degradation (e.g., [12])). Specifically, Advanced Differential SAR Interferometry (A-DInSAR) can provide information about the ongoing and past deformations with millimeter accuracy and can be used for many different applications in the field of engineering geology, e.g., subsidence and settlements [13,14], landslides (e.g., [15,16]), glaciers, and dynamics of permafrost [17,18].
In underground mines of copper ores, the most common and dangerous threats are represented by seismic tremors and rock bursts. In the room-and-pillar system, the deposit bed is cut (using blasting technique) into rooms and belts, which create technological pillars. The operating pressure causes damages to these pillars [19], which can evolve following a rock burst. An intact rock mass can therefore be affected by seismic tremors induced by mining work in an area that was previously aseismic. Tremors are the result of energy release due to the rock mass overstressing process in the pillars (the rock burst phenomenon). The related fracturing causes subsidence that affects not only excavations and underground infrastructure, but also the terrain surface. Therefore, the superficial ground deformation phenomena that can occur at active room and pillar mining districts can be related to both (i) land subsidence above the underground excavation rooms, produced at the advancing working face in the excavation direction (e.g., [20]) or due to yielding in the abandoned mines (e.g., [20]), and (ii) mining-induced tremors, related to post-pillar-failure disasters [19,20]. The effect of mining-induced tremors also results in a subsidence phenomenon, but it could take place in peculiar ways and times (e.g., [21]).
The (i) land subsidence due to underground ore exploitation is well known in literature and it can range from small-scale collapses to regional settlements. Its mechanism depends on the geological characteristics, the mechanical properties of the rocks, and the applied extraction technology [1,3]. During the excavation activities, in general the subsidence basin is expanding along the advancing direction of the working face [22,23] and the deformation rate increases consistently with the advancing distance, until it stabilizes at a critical value. The support provided by the reserved pillars decreases the deformation [22]. Moreover, especially in abandoned areas, the collapse of a single pillar affected by the coupled effects of weathering and stress can results in ground subsidence at the surface. Cascading pillar settlements may occur if the neighboring pillars cannot carry the additional load, or if the resulting roof span is too large for effective load transfer [20], and may occur in a couple of hours or decades after mine abandonment. This makes it difficult to establish the exact cause-effect relationship and the timing of the ground subsidence above the mines by geodetic measurements like InSAR.
Regarding mining-induced tremors (ii), an intense seismicity has been documented at LGCD (e.g., [24,25]): according to the local mining monitoring system and the national seismological survey carried out by the Institute of Geophysics in the Polish Academy of Sciences (IGF PAS), more than 2000 events with magnitudes between 0.9 and 3.5 are recorded yearly in this district [25]. The mining-induced earthquakes can cause the formation of large subsidence troughs occurring rapidly as a result of the release of seismic energy, with dimensions of a few square kilometers and total subsidence of the order of about 10 centimeters [26].
A-DInSAR algorithms, such as Persistent Scatterers Interferometry (PSI), can provide precise results regarding the relatively slow displacement, but this multitemporal technique has drawbacks in measuring fast deformations [27], due to ambiguity in the unwrapping procedure. Ng et al. [28] suggested the consecutive DInSAR method with a shorter temporal baseline as the most appropriate tool for fast terrain motions detection. A solution to deal with a strong subsidence in the center of the subsidence trough is the combination of two techniques: conventional (DInSAR) for the fast motions and advanced (A-DInSAR) for the residual subsidence [29]. Because traditional differential interferometry exploits image pairs, the accuracy of this technique is limited by factors related to spatial and temporal decorrelation, signal delays due to the atmospheric artifacts, and orbital or topographic errors [30]. Despite these problems, many scientists have successfully applied the consecutive DInSAR approach to the monitoring of fast-mining-related subsidence [3,4,5,6,7,8,29,31].
This paper focus on the deformation phenomena that affect the room-and-pillar LGCD copper mine (Figure 1) using purely satellite SAR interferometry, and in particular combining both Advanced Differential SAR Interferometry (A-DInSAR) and Differential SAR Interferometry (DInSAR). Even without detailed information on current excavation activities, and without the support of field data, this work highlights the capabilities of SAR satellite monitoring of ground subsidence resulting from mining. Such a deformation phenomenon could introduce significant geological risk in the densely populated area (Lower Silesian voivodeship, south-western Poland) where several urban centers and critical infrastructure like the Żelazny Most Tailings Dam are located. The A-DInSAR analysis of this important storage facility, adjacent to the LGCD area, is described in a dedicated paper (Mazzanti et al., accepted).

Geological Setting

The Legnica-Głogow Copper District (LGCD) is located in the Lower Silesia region (SW Poland), at the southern termination of the Fore-Sudetic Monocline. The latter is composed of metamorphic rocks and volcanogenic-sedimentary beds. It is represented by a thick epi-Hercynian sequence of sediments and rocks of the Lower and Upper Permian, which were respectively dated to the Rotliegende and Zechstein ages (Figure 2, [21]). The tectonic units that occur in the mining area are represented by: (i) the Proterozoic-Palaeozoic metamorphic basement, (ii) the Permo-Triassic complex of sedimentary rocks, which is smoothly dipping to the NE, and above the latter, and (iii) a more or less horizontal Cenozoic sediments sequence [32]. The copper ore deposits belong to the Permo-Triassic complex of sedimentary rocks and in particular to the Kupferschiefer Formation and to the basal part of the Zechstein Limestone, and the mines are localized at the boundary between the platform and the basin facies of the Zechstein Limestone ([33]; Figure 2a,b).
Stratiform mineralization founded within sandstones, shales, and dolomites, occurs in different amounts from mine to mine and is located at depths between 600 m and 1200 m (www.mining-technology.com, accessed on 15 May 2021). The roof of the LGCD mines consists of sub-horizontal limestone or dolomite strata 200 m thick, while anhydrite and gypsum layers, parallel to the bedding, lie above (Figure 2b). The ore is located above the basement rocks at the intersection with two NW-SE and NNE-SSW striking fault systems that control the regional distribution of the metal and the content of mineralization and its geometry [34]; the ore is tectonically disturbed by a dense grid of fractures and faults [35,36]. The dominant fault system in the mining area coincides with the fault zone of Rudna and Lubin (Figure 2a). These two faults represent parallel structures striking NW-SE and have large stratigraphic throws, and the Rudna fault is considered the most important due to the potential seismic hazard (Figure 2).

2. Materials and Methods

InSAR (Interferometric Synthetic Aperture Radar, [37]) is based on the comparison between RADAR images acquired in different times over the same area. Differential SAR Interferometry (DInSAR) has been successfully applied in the investigation of different ground deformation processes and is mainly characterized by impulsive or intermittent behavior. Indeed, DInSAR provides good results for the investigation of displacement characterized by wide, spatially smooth deformation processes, such as coseismic and postseismic deformations [38,39,40], volcanic deformation processes [41,42], or ice and glacier dynamics [17,43] or landslide detection [44,45,46]. Furthermore, mining-related deformations phenomena have also been detected and measured by DInSAR (e.g., [3,29]).
On the other hand, the Advanced Differential SAR Interferometry (A-DInSAR) approach consists of the combination of information from a large number of SAR images, allowing us to derive the temporal evolution of displacements of objects on the ground during the investigated period. Successful applications to settlement/subsidence-related issues have been carried-out through an A-DInSAR approach in the last few years [3,13,14,29,47,48].
In this study, Sentinel-1 SAR images were analyzed using a hybrid approach based on the standard Differential Interferometry (DInSAR) and Multi-Image techniques.
As part of this process, 411 C-band and Sentinel-1 SAR scenes (in both ascending and descending orbital geometries) were acquired from the ESA archives for a time span of about 5 years from October 2014 to April 2019. We used Interferometric Wide beam mode in Single Polarization (IW) SAR images, characterized by a spatial resolution of approximately 5 × 20 m, a wavelength of 5.6 cm (C-band), and a 250 km wide images (Table 1).

2.1. Multi-Temporal DInSAR Analysis

The DInSAR technique is based on the analysis of the phase variations by coupling 2 SAR images collected at different times (namely “interferograms”). The differential interferograms were computed to consider both temporal and spatial coherence. For this reason, we performed a multi-temporal DInSAR analysis based on Minimum Spanning Tree graph (MST, [49]), creating a framework for optimal interferometric pairs selection. MST involve a set of interferograms from SAR stack corresponding to the minimum best coherent graph, which were obtained by connecting all the images of the dataset. A total amount of 411 interferograms between couples of images in the same orbital geometry spanning for the entire monitoring period were processed. The availability of images both in ascending and descending orbital geometry allowed us to have a redundant and independent source of information.
A key step to achieve reliable results about displacement occurrences was the detection and subtraction of the topographic component on differential interferograms. The Shuttle Radar Topography Mission (SRTM) 1 arc-sec (30 m resolution) DEM, provided by the US Geological Survey, was used to remove the topographic component from the generated interferograms.
The generated interferograms were unwrapped [50,51] to create deformation maps which show displacement values continuously in space. The Goldstein filter [52] was applied to support the Minimum Cost Flow (MCF) phase unwrapping procedure. The phase difference ∆φ in the LOS from 205 ascending unwrapped interferograms were converted to displacement values in LOS direction (dLOS) using the Equation (1)
dLOS = λ·∆φ/4π
where λ is the wavelength used by the C-band sensor.
The displacement measured by the unwrapped interferograms was cumulated over time to obtain a cumulative displacement map, with centimetric accuracy. In particular, the cumulative surface displacement was computed using the contribution of interferograms generated from consecutive pairs of SAR images.

2.2. Advanced DInSAR Analyses (A-DInSAR)

Advanced Differential Interferometric SAR (A-DInSAR) analysis was performed to acquire information regarding displacements that affected the ground surface over the LGCD area since 2014.
The multi-temporal interferometric analysis was carried out using the Persistent Scatterers Interferometry (PSI) technique [27,53,54,55,56] and proprietary procedures implemented in SARPROZ software [57].
A large-scale study was performed on an area of about 700 km2, carrying out a conventional PSI approach in accordance with Ferretti et al. [53,54]. Specifically, to reduce the decorrelation effects, all images were related to a single master image, which was selected by considering the perpendicular and temporal baselines. After all images were co-registered to the master image, the maps of radar parameters were generated: the reflectivity map (multi-temporal amplitude value for each pixel) and the amplitude stability index map (coefficient of the amplitude variation). These maps were used to estimate the quality of the persistent scatterer candidates (PSCs) as a first step of the PSI workflow. A network of PSCs was created to estimate preliminary height and displacement parameters. This step is needed to detect and remove the atmospheric phase screen (APS) starting from the residual phase components. For each persistent scatterer (PS), the velocity values along the Line of Sight (LOS), displacement time series, and height were computed. It is worth mentioning that (i) displacements were measured along the satellite LOS as the path between the satellite sensor and the target (e.g., look angle in Table 1), and that (ii) these values of displacements were relative to a reference point identified in a stable region. At the end of the PSI workflow, the more reliable PSs were selected by applying a high temporal coherence threshold (>0.6). For such PSs, the time series of displacements has been provided.
Lastly, the Up-Down and East-West displacement rates were retrieved by combining the ascending and descending orbital geometry [58]. An application for vector decomposition owned by NHAZCA S.r.l. was used for this purpose, according to the following steps: (1) the study area was discretized in a regular grid of hexagonal cells; (2) when the cells contained at least one PS both from the ascending and the descending geometry, the vertical and horizontal velocity rates could be achieved; (3) the ascending and descending LOS velocities were projected along the vertical and horizontal directions (up-down and east-west) by a vector decomposition. The horizontal component along the north-south direction cannot be measured because the satellites fly in a near-polar orbit approximately perpendicular to the LOS.

3. Results

Figure 3a,b show the deformations along the east-west direction and along the up-down direction, respectively, relating to the LGCD area. The maximum vertical displacement rate is a subsidence value up to −50 mm/year (red color in Figure 3b), that has been observed in correspondence with Tarnowek, near the tailing basin and east of Polkowice. Regarding the horizontal deformations (east-west direction), the maximum velocity values were up to 46 mm/year toward east (blue colors in Figure 3a), observed in the city of Polkowice, and −28 mm/year toward west (orange colors in Figure 3a). The east-west and up-down time series of displacement for the Polkowice, Tarnowek, and Moskorzyn areas are shown in Figure 4. The time series were retrieved averaging the time series for 3 neighboring PSs, so that the observed trend is more representative for the areas, without any isolated outliers.
The velocity maps obtained by the A-DInSAR approach (Figure 3a,b) highlight the presence of some widespread deformations above the room and pillar mines of the LGCD, showing a complex and discontinuous pattern in space. Furthermore, the trend of the deformation of each zone is gradual, i.e., highly deforming areas are surrounded by zones that show minor and gradual deformation.
To investigate the deformation pattern observed in the study area in detail, the DInSAR (Differential SAR Interferometry) approach was used, with the analysis and interpretation of 400 interferograms relating to the time period from October 2014 to April 2019. In the interferograms, the areas affected by deformation (with rates in the order of some centimeters for month) are represented by the so-called interferometric fringes, i.e., bands of color from blue to red, which corresponds to a ground displacement of 2.8 cm each (for C-band sensors). The deformation areas are characterized by concentric fringes, with sub-circular or ellipsoidal shapes, with dimensions ranging from 500 m to 2.5 km in diameter. Although the observed fringes represent a LOS displacement (moving away from the sensor), the latter was considered here as vertical deformation, namely subsidence, neglecting the possible occurrence of minor horizontal components. Figure 5 shows an interferogram with temporal baseline of 48 days that represents several subsidence troughs occurring sparsely throughout the mining area. The zones affected by intense deformation were mapped in all the available interferograms for a total of 30 subsidence troughs in the whole analyzed time span.
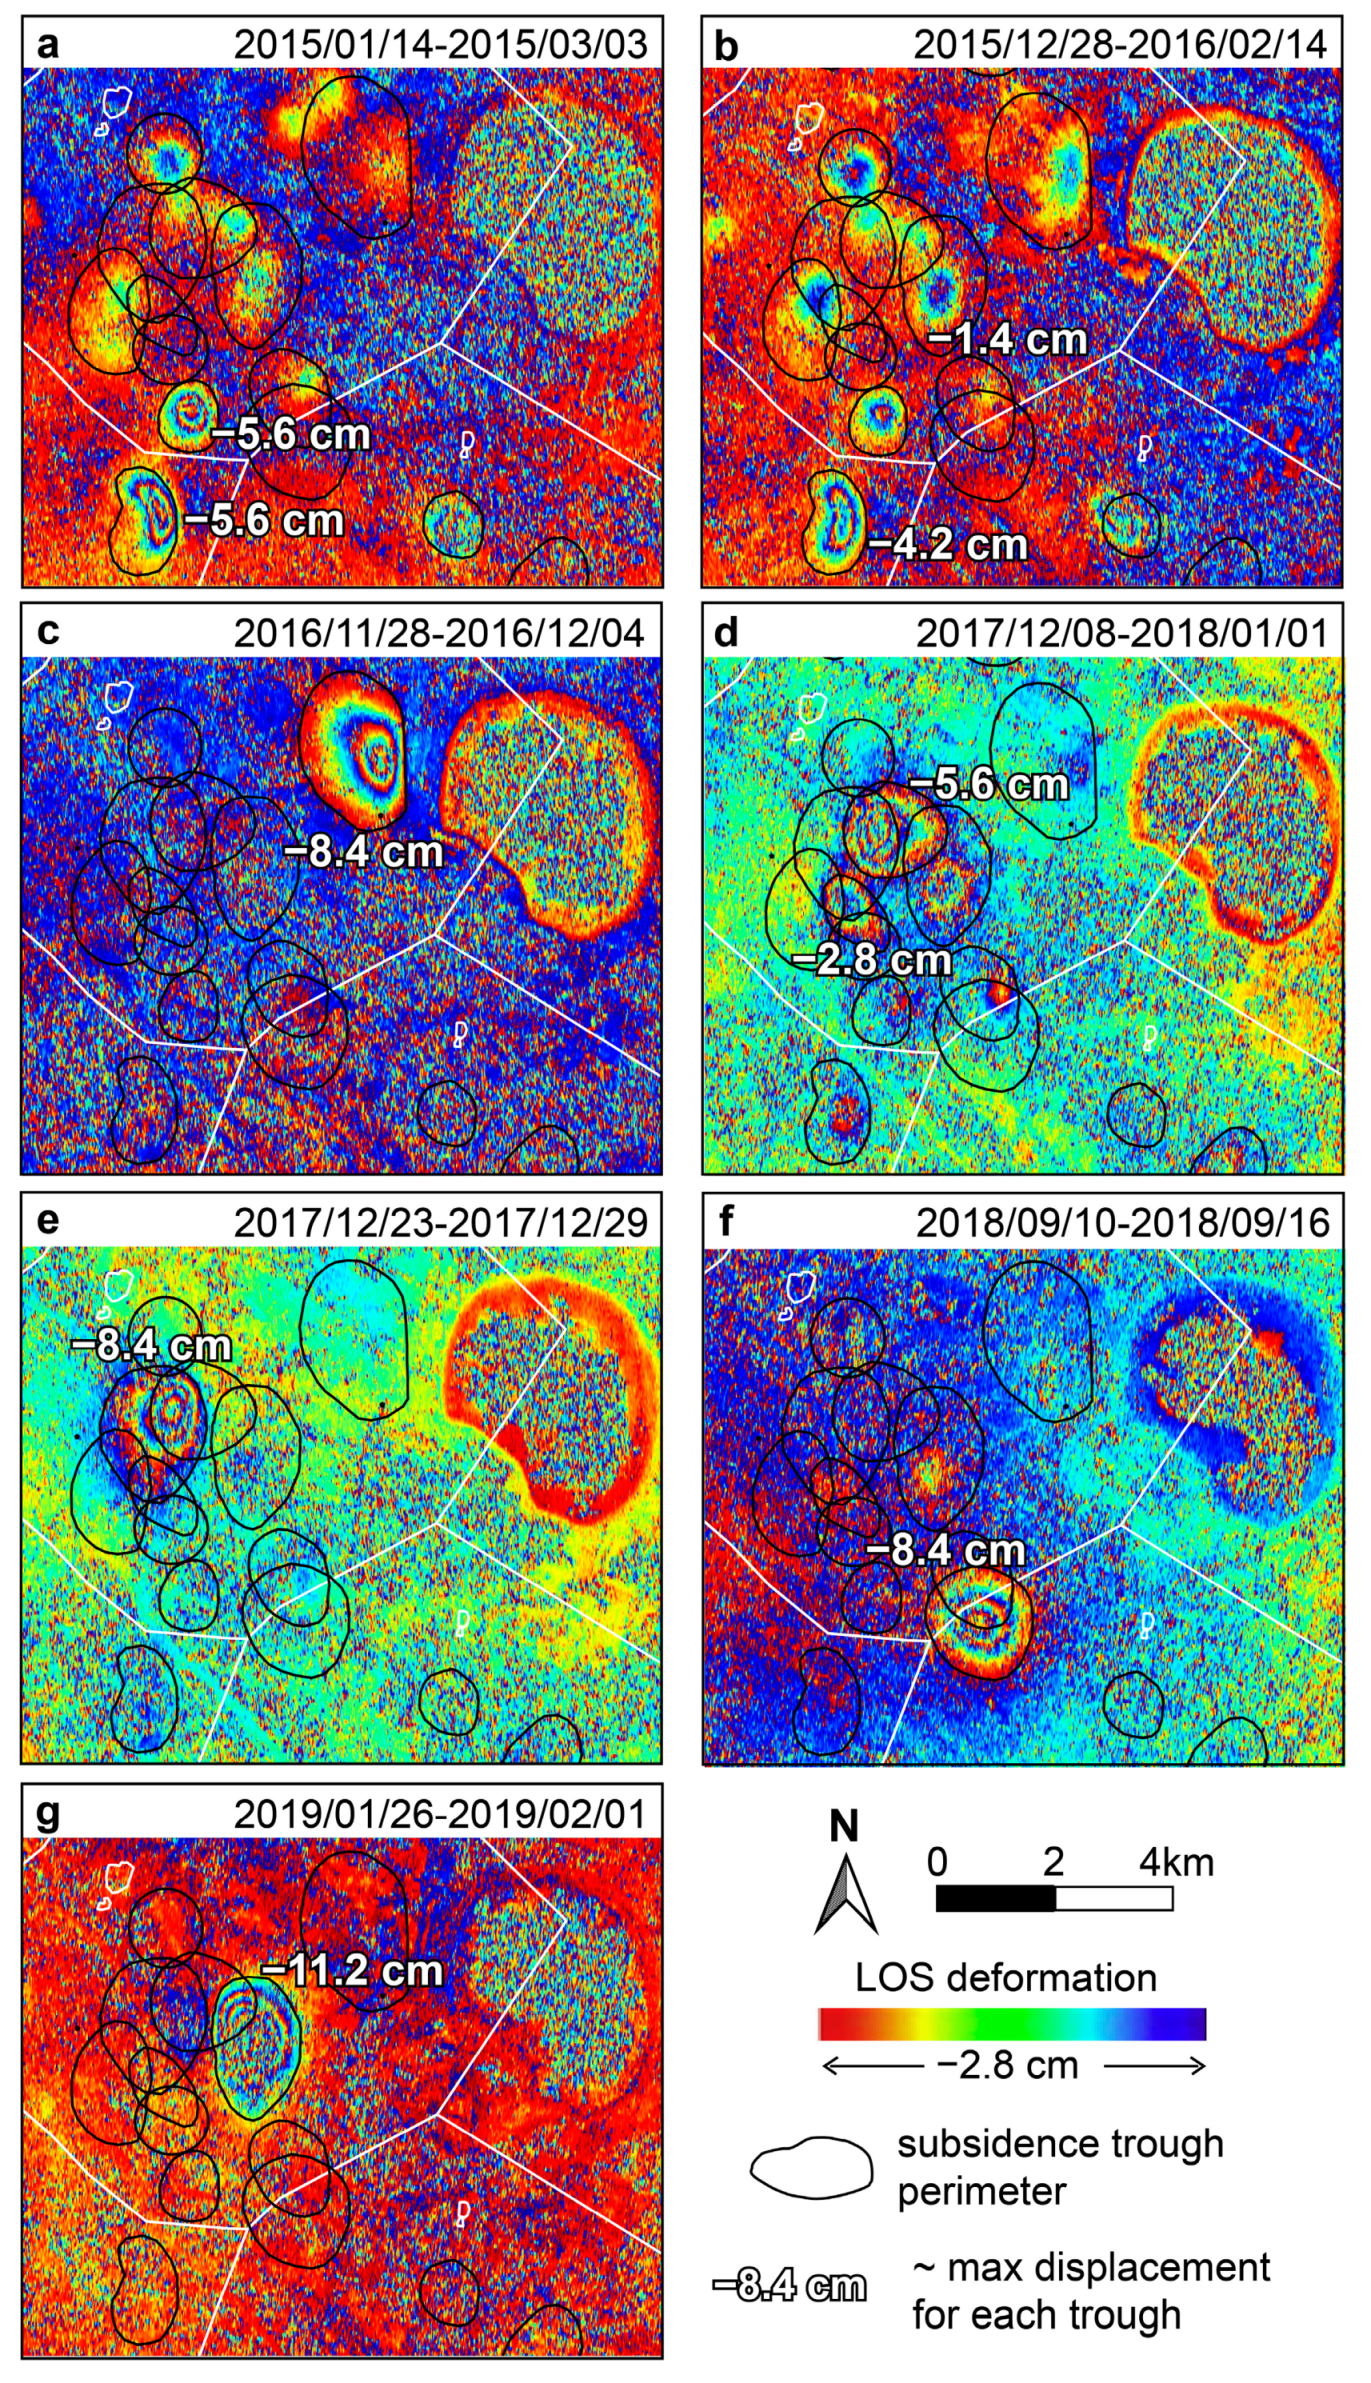
Figure 6 represents seven interferograms of a subset of the study area (rectangle in Figure 5) located west of Żelazny Most dam, near Polkowice town. In the interferograms, it is possible to count fringes and to estimate several centimeters of subsidence. It was observed that up to several fringes can be counted before the interferogram is decorrelated in the central part, probably due to the magnitude of the displacement beyond the detection threshold of the sensor. The fringes at some subsidence troughs occur on several subsequently analyzed interferograms, suggesting a continuous subsidence over time. For example, in both of the 48 days interferograms of Figure 6a,b, some of the subsidence troughs show similar deformation fringes during different time periods.
On the other hand, some deformation zones show a discontinuous pattern over time, and in several cases, they disappear suddenly in subsequent interferograms or do not maintain the same intensity of subsidence, showing relatively intermittent or impulsive behavior. For example, in Figure 6g, a subsidence trough shows four fringes in the interferogram that spans from 26 January 2019 to 2 February 2019, which roughly correspond to about 11.2 cm of displacement in 6 days, but fringes were totally lacking in several previous interferograms (Figure 6c,e,f).
The intensity of the subsidence could be quantitatively estimated by the analysis of unwrapped interferograms that represent deformation maps with centimetric accuracy and are effective for analyzing the displacement, as was recently demonstrated by Borg et al. [21], Dai et al. [49], and Sui et al. [59]. To quantitatively estimate the total displacement that occurred during the whole analyzed time interval of about 4 years and 7 months (October 2014–April 2019), the unwrapped interferograms (in ascending geometry) were cumulated in a map showing the cumulative displacement (Figure 7). Such a map shows that the deformation persists over time in the same areas (yellow to red colors in Figure 7), which coincide with the subsidence troughs. For 10 different zones, the maximum cumulative subsidence exceeds 70 cm in about 4 years and 7 months. Where some subsidence troughs are very close to each other, the surface affected by subsidence includes quite large areas, which were mapped in Figure 7 and Figure 8. These zones are localized mainly in the northern and central parts of LGCD, at Sieroszowice and Rudna mines, respectively.
Figure 8 shows six cross sections at three selected subsidence troughs (named A, B, C and located in Figure 8a) that represent the cumulative displacement profiles above the rock excavations. For each selected subsidence trough, the cross sections were traced in an orthogonal manner, and their variable lengths include the area affected by surface deformation.
The profiles allowed us to appreciate the intensity and the spatial pattern of the cumulated deformation during the analyzed time span. The profiles of subsidence trough A show a slightly asymmetrical shape, while the displacement curves in C have a symmetrical shape. On the other hand, the displacement curve of subsidence trough B in NS direction shows that subsidence pattern continues towards the south due to a larger area that is affected by moderate ground deformation.

4. Discussion

The deformation pattern shown by the A-DInSAR velocity maps (Figure 3a,b) indicates several localized deformation zones above the room and pillars mines of the LGCD. However, large areas are devoid of measurement points (PSs) despite including urbanized zones, where many PSs are normally detected by the PSI technique. Conversely, zones showing intense deformation, with a high density of PSs, surround these areas where PSs are lacking. Such a particular PSs distribution can be due to the occurrence of too rapid displacement in the areas devoid of PSs that cannot be properly investigated by the A-DInSAR technique, as was argued by some authors (e.g., [5,29]). Ambiguity in the unwrapping procedure results in the limitation of the maximum differential displacement rate between two neighboring points that can be measured by PSI. This value is limited to λ/4 over the revisiting time between two consecutive SAR images, where λ is the wavelength of the radar signal (λ = 5.6 cm for C-band satellites). With a revisit time of six days (minimum temporal baseline of the interferograms), the theoretical maximum displacement rate detectable by PSI avoiding ambiguity in the unwrapping is 85 cm/year. This value is reached only if (i) all SAR images every 6 days are available and (ii) if the observed deformation is constant and equal to 1.4 cm every 6 days. Higher values would result in decorrelation and would be lost in the total count. The theoretical maximum displacement rate detectable by PSI decreases when the temporal baseline of the interferogram increases, or when the deformation process is not constant. These are the reasons why it has not been possible to measure the displacement in the center of the subsidence through using PSs, despite the fact that the cumulative displacement (Figure 7) is lower than this theoretical maximum rate.
Despite this limitation, the sub-centimetric precision achieved by PSI analysis, allowed us to monitor the residual subsidence and to map the more moderate ground displacements surrounding several intense subsidence areas of limited sizes detected by the DInSAR classical approach. The latter therefore allowed us to identify the subsidence troughs that were previously recognized in the literature in LGCD and in other rooms and pillar mines [26,60]. In agreement with some authors (e.g., [28]), the results confirmed that the analysis of interferograms (Figure 5 and Figure 6) represents an appropriate tool for detecting intense and fast terrain motions where the advanced multitemporal technique is no longer efficient.
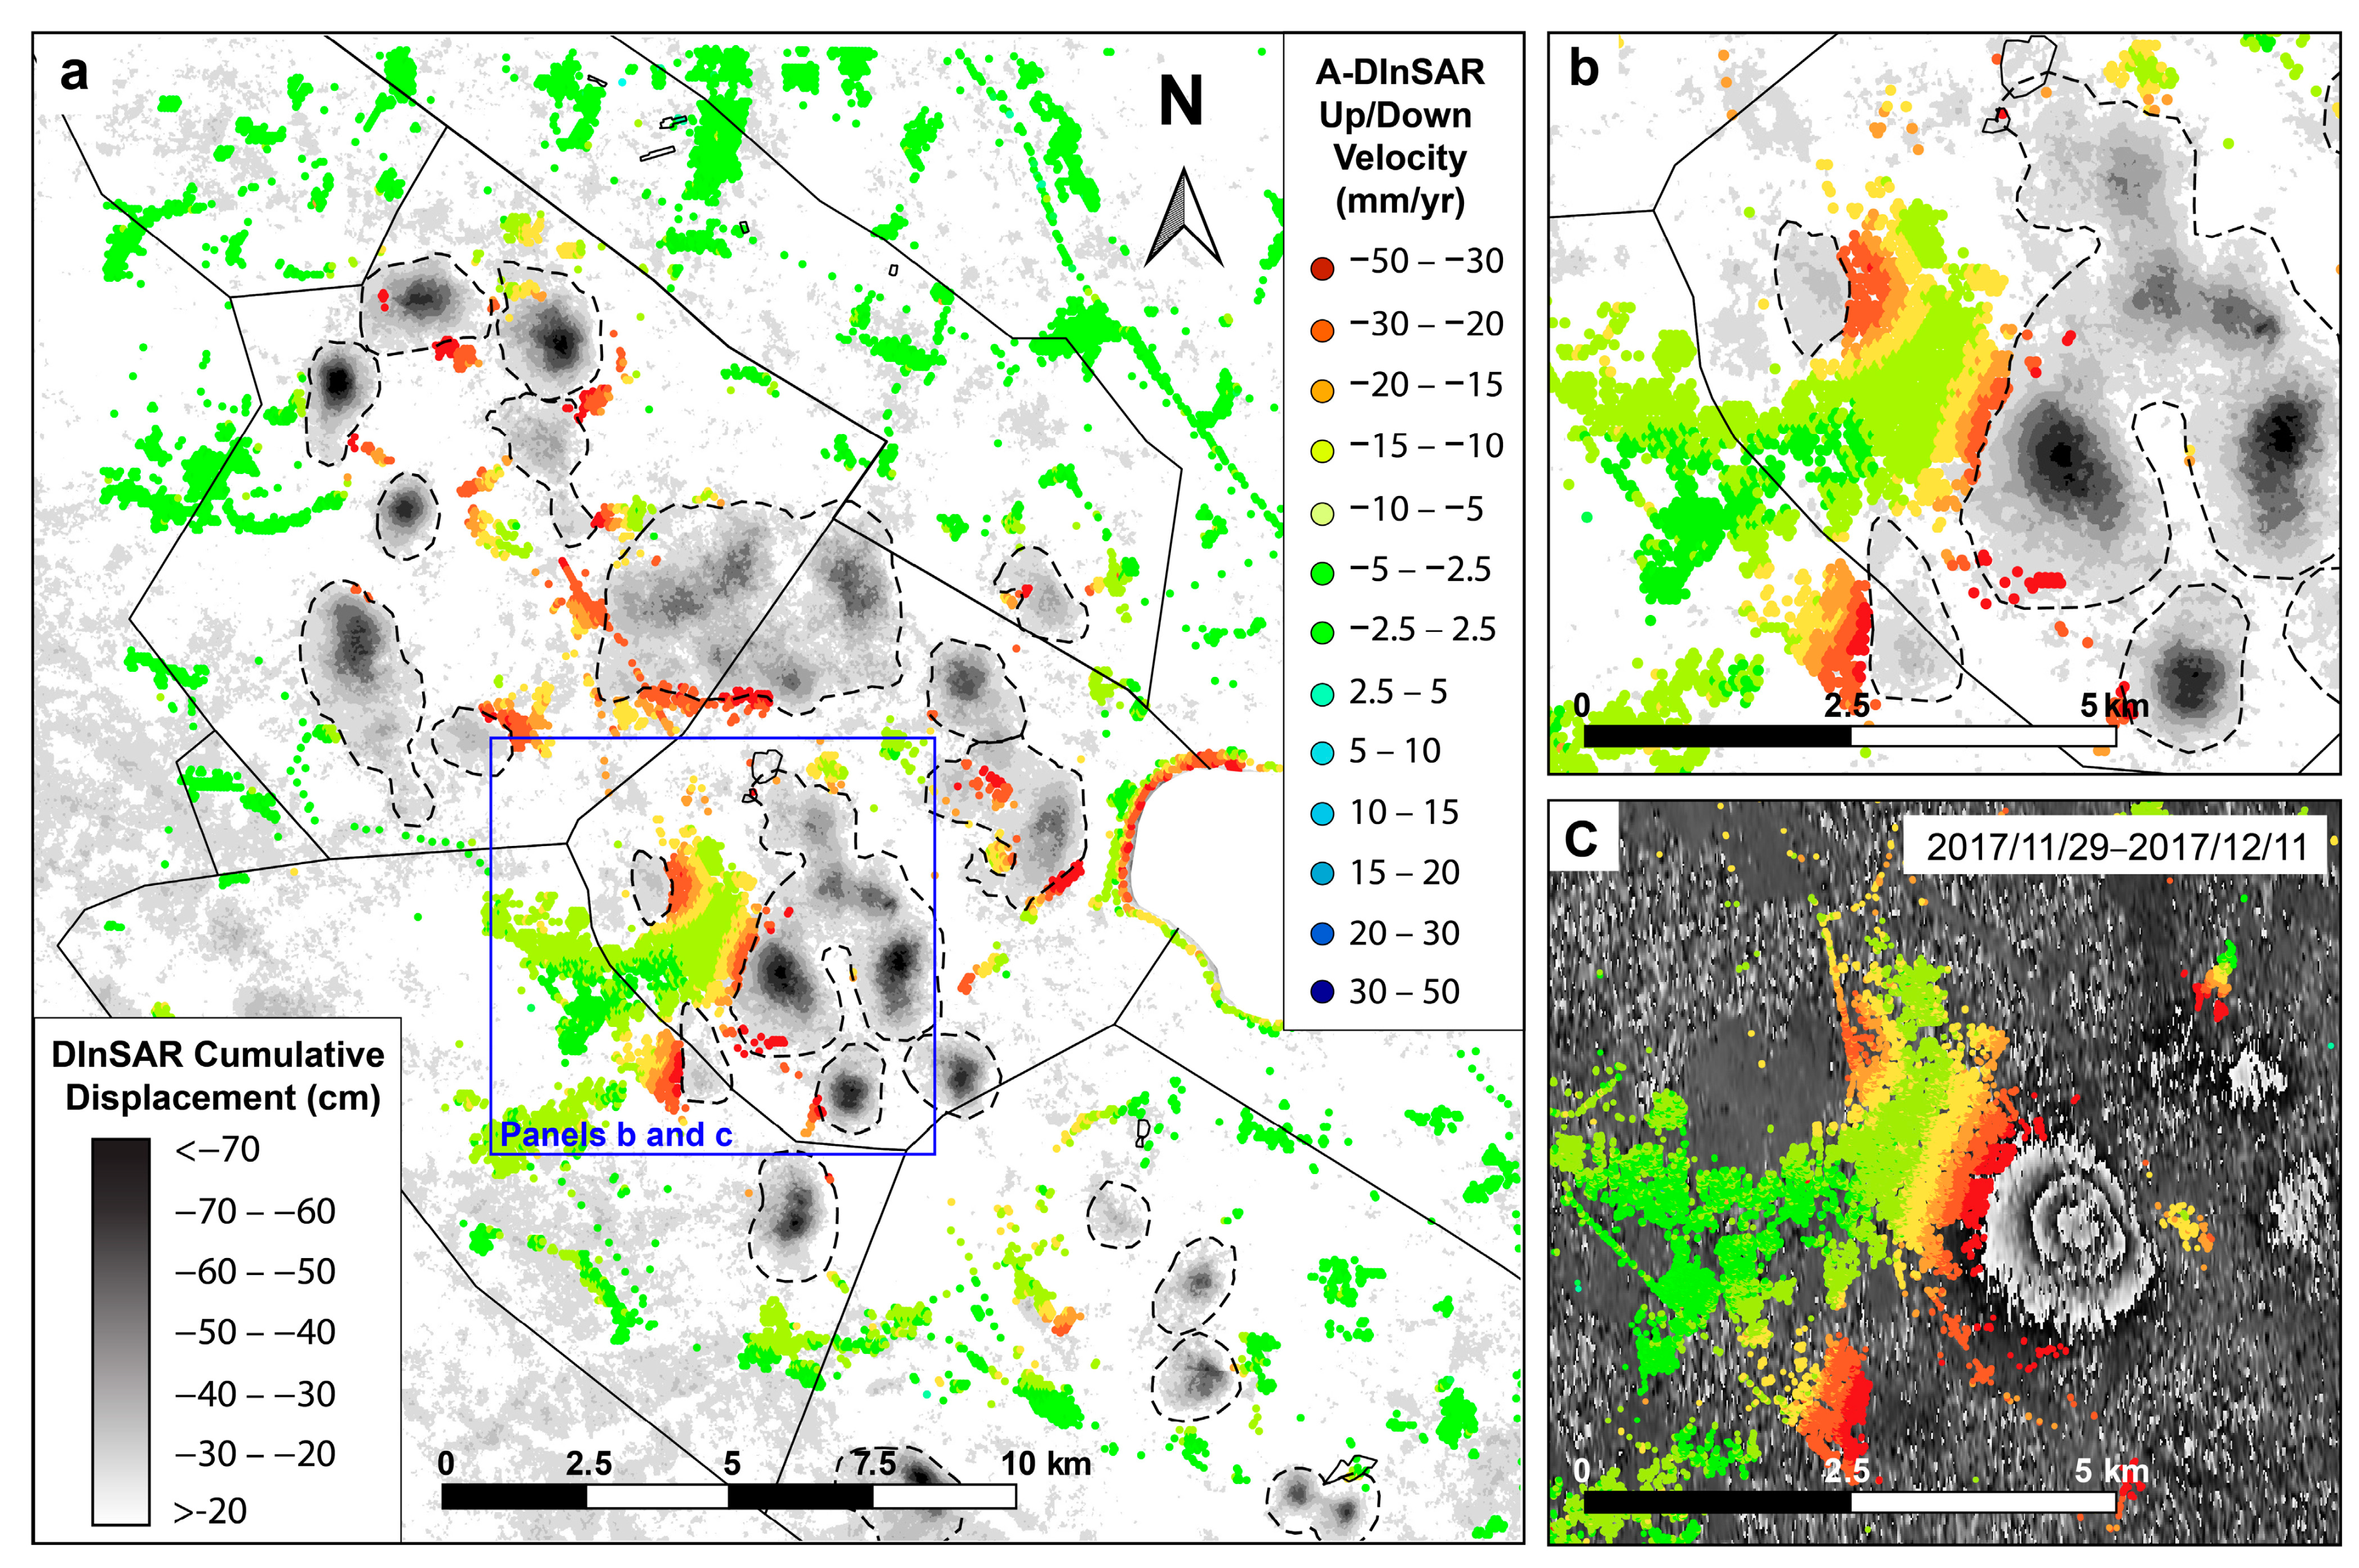
In Figure 9, the complementarity between the two different SAR interferometry techniques (A-DInSAR and DInSAR) is highlighted: colored points represent the PSs in an up-down direction and the black and white image represents the cumulative DInSAR displacement map of Figure 7 in shades of gray. In Figure 9c, it is worth noting that in the areas not covered by PSs, several sub-circular or ellipsoidal fringes occur. This is clear in Figure 9b where a subset of interferogram near Polkowice is shown: where the PSs are lacking, the interferogram shows ellipsoidal fringes, which correspond to the areas with the highest displacement rate. This residual subsidence located around the areas affected by intense deformation is well mapped by PSs distribution and decreases gradually by up to 1.5 mm/year (considered as a stability threshold) about 1.5 km away from the center of the subsidence troughs.
In the LGCD region, 30 different ellipsoidal fringes covering relatively small areas indicate troughs of subsidence, which in some cases took place several times in the same area during the analyzed time span. The location of these active subsidence areas within the perimeter of the mines suggests a direct connection between the mining activity and the superficial deformation phenomena (Figure 5 and Figure 7). This hypothesis is supported by a previous work of Popiolek et al. [61] that carried out a pioneering application of the InSAR technique for the monitoring of LGCD areas using a single interferogram processed from two ERS-1 images of January and March 1994. These authors argued that the origin of the 26 detected subsidence troughs was directly connected with the mine exploitation by comparing the analysis of the interferogram and the mining exploitation development for the analyzed time.
The behavior over time of the subsidence phenomena is rather complex to analyze: 13 troughs continue to undergo subsidence more or less constantly, while 17 areas are affected by deformation pulses that take place for short time intervals of the order of a few days, and that can be repeated several times during the analyzed years (Figure 5 and Figure 10).
In the LGCD, in which the room and pillar method with roof deflection and maintaining the central part of the mining field was used [62], the assessment of subsidence timing and impact was difficult to define, particularly when specific information on the excavation activity is not available, as in the case of this work. A criterion to assess the subsidence impact was based on empirical observation of ground movements and damage to the buildings above or near the mines [63].
To interpret the origin of the deformation phenomena that occur at the LGCD active room and pillar mining district, two possible causes were considered in this study: (i) subsidence above the underground excavation rooms related to both the advancing working face in the excavation direction (e.g., [20]), or pillar failures in abandoned areas which are usually accompanied by sudden roof subsidence (e.g., [20]) or (ii) mining-induced tremors (“coseismic” subsidence e.g., [21]). The mining-induced seismic events in this area show similar characteristics of weak earthquakes, but with a lower depth of the hypocenters (up to 1 km). As mining-induced earthquakes are frequent at LGCD (e.g., [24]), a possible direct relationship between these tremors and the subsidence troughs detected by DInSAR was investigated, relying on the existing literature and analyzing the obtained results in detail.
The mining-induced seismicity and related rock burst hazard may be the function of several parameters: in LGCD, the principal factors influencing the seismic hazard level (measured by the number of registered seismic events and the total seismic energy released) are the regional geological setting, i.e., the effective mining thickness and the thickness of burst–prone roof rock strata, and the possible variation of tectonic stress intensity [36]. Limestones and anhydrites that lie above the ore store elastic strain energy that can be released through fracturing and rock bursts [19]. Moreover, the depth of the excavations (that varies from 600 m up to 1200 m in LGCD) and the retreat mining method of excavation can provide favorable conditions for energy accumulation [64].
In the literature, there are some studies that focus on the use of the InSAR technique for analyzing the superficial deformation caused by mining-induced tremors in the study area [8,21,26,65,66] and in other sites [65,67]. Some of the major induced seismic events that struck the mining panels of LGCD district were analyzed by using SAR images: Malinowska et al. [21] and Milczarek [64] analyzed the surface deformation processes caused by the earthquakes of 29 November 2016 by DInSAR and by the Small Baseline Subset technique (SBAS), respectively. Within about 2 days after the earthquake, the ground surface rapidly subsided, forming an asymmetrical-shape trough, with a maximum post-earthquake subsidence of about 80 mm. Surface deformations vanished until about the 7th day after the earthquake [21]. Hejmanowski et al. [26] analyzed the spatio-temporal distribution of ground movements caused by the two tremors that occurred in 2017 with magnitude of 4.7 and 4.8 using the InSAR technique. The tremor was preceded by few millimeters per day of surface movements caused by on-going mining activity. A total of 24 h after the tremor, the main subsidence of about 70–80 mm took place. In the subsequent 4–5 days, the surface movements stopped.
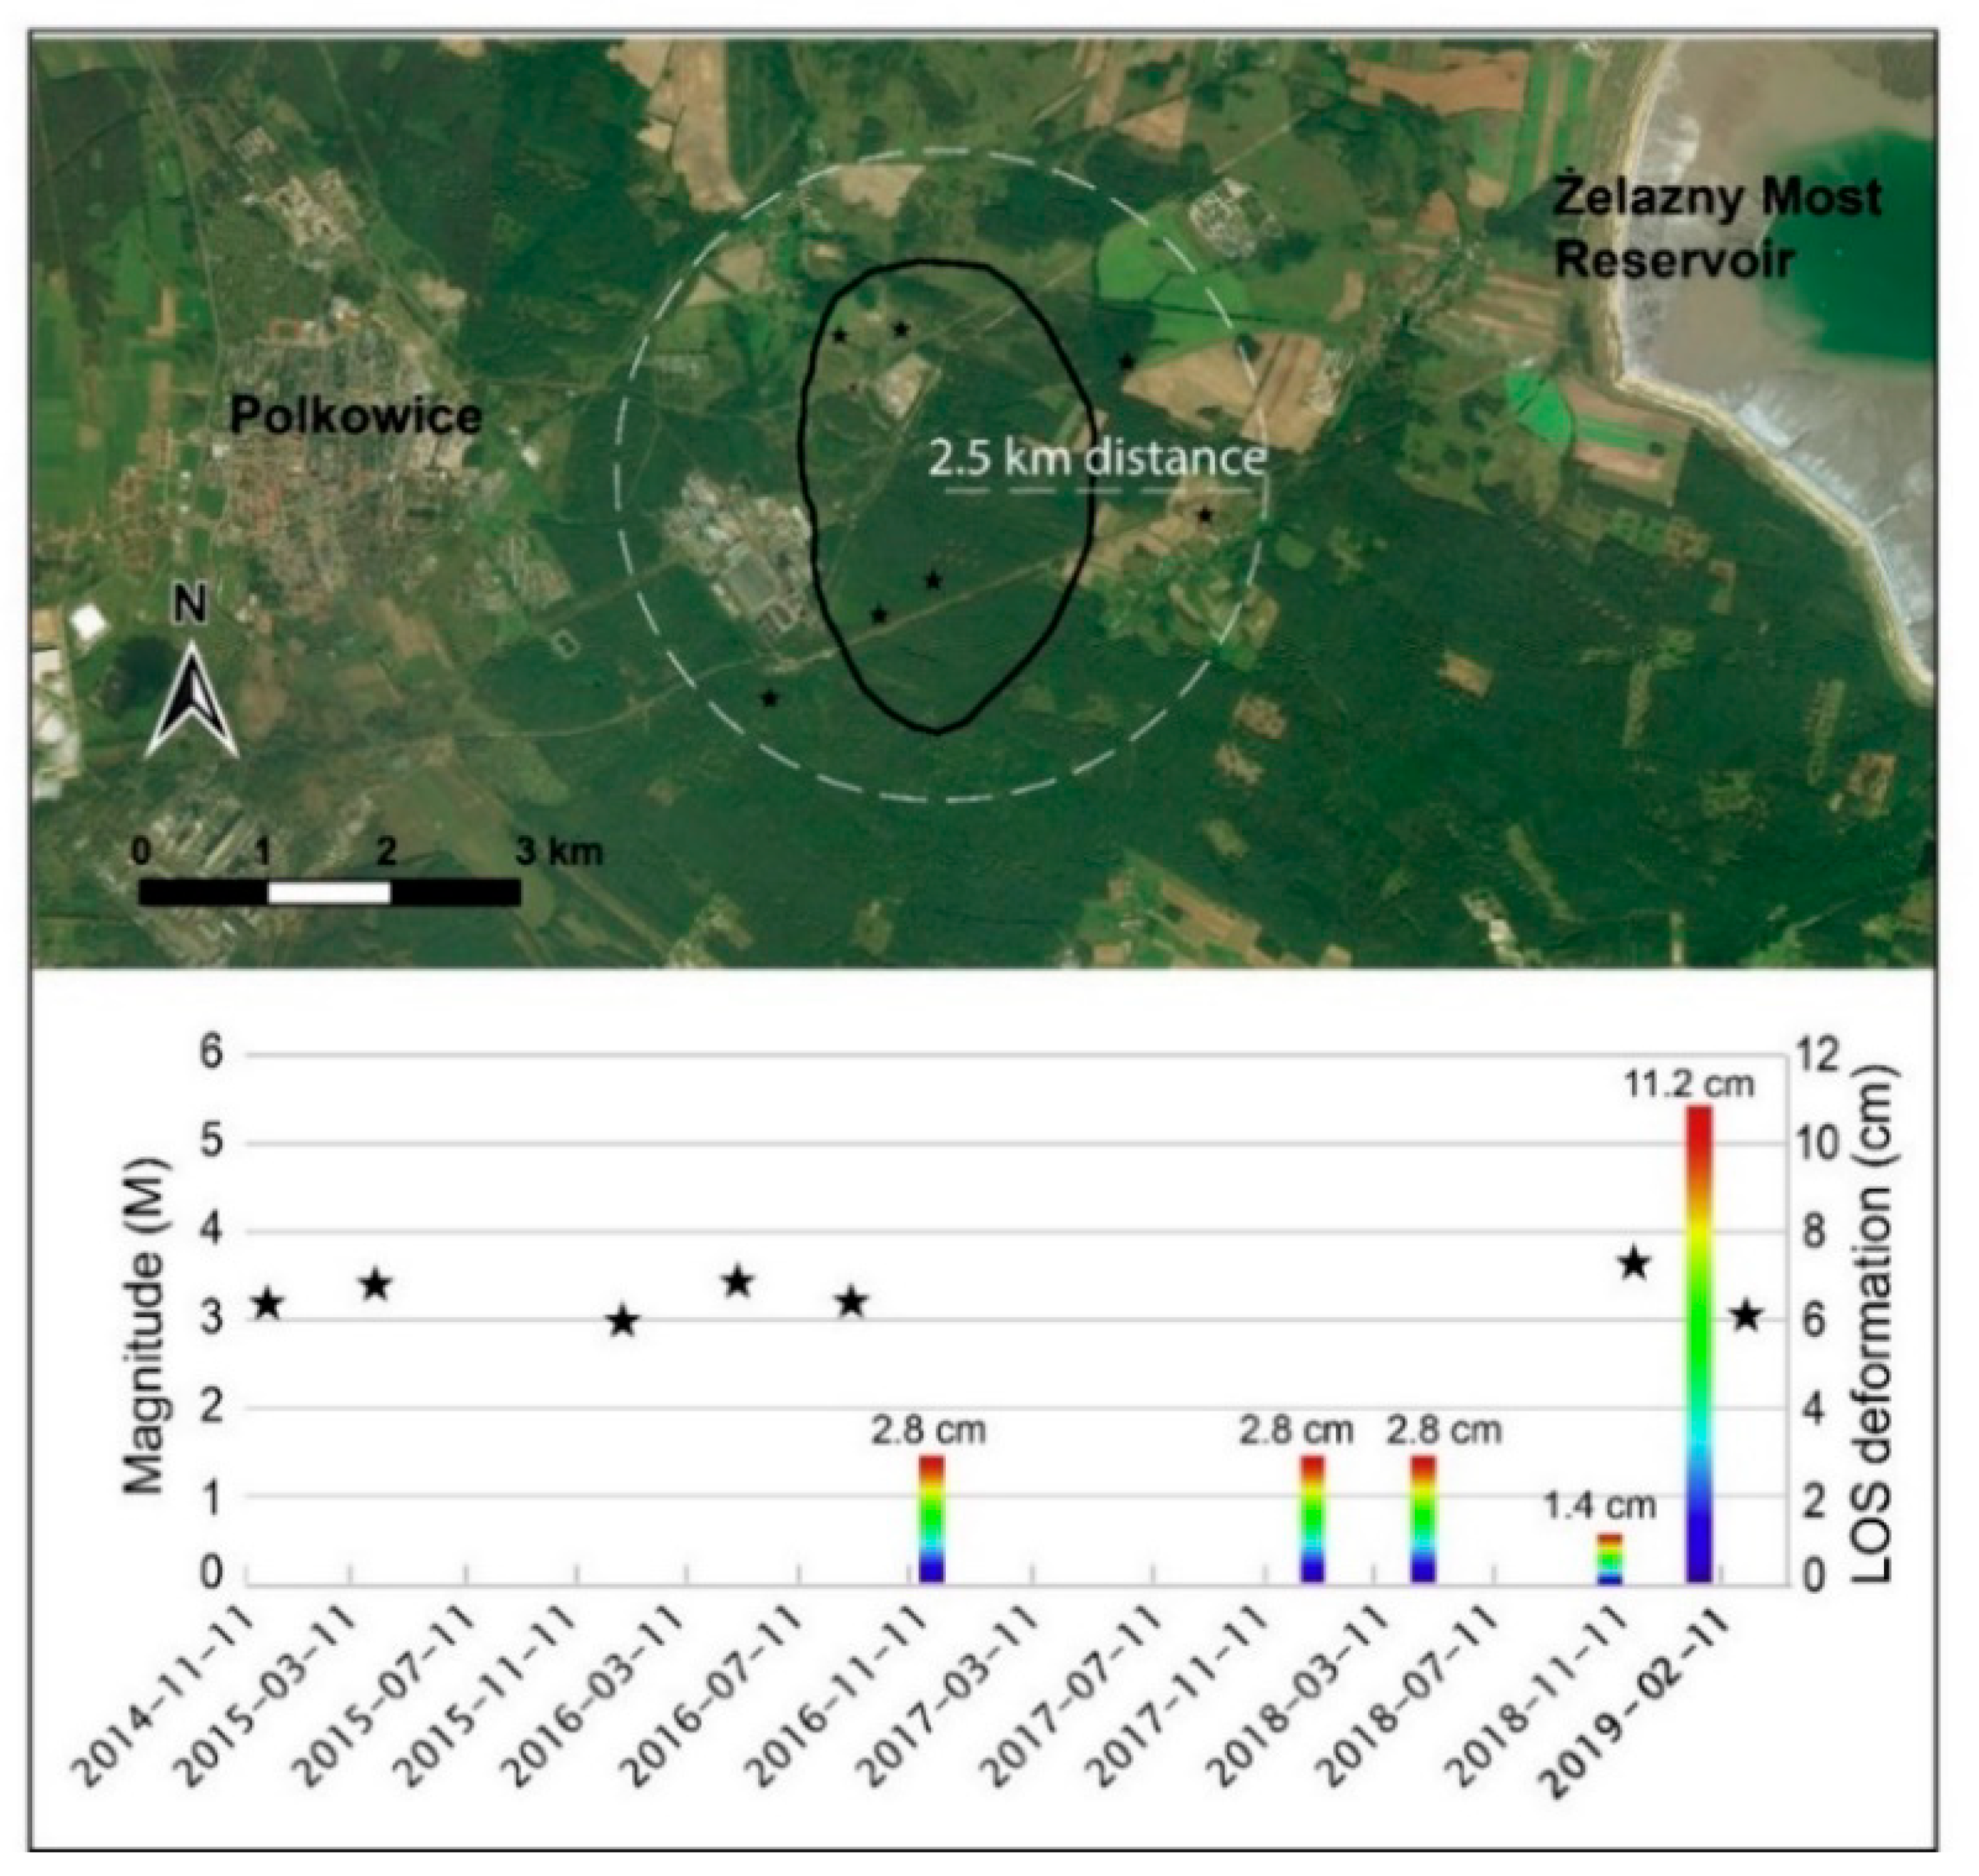
To examine a possible cause-effect relationship between tremors and subsidence pattern detected at LGCD, the space-time coincidence between earthquakes and subsidence events was investigated. As described by some authors (e.g., [26]), the onset of intense subsidence would occur immediately after the tremor, or after a maximum of one day. Figure 10 shows the distribution of epicenters of seismic events with M > 3 which occurred from October 2014 to April 2019, and the locations of the subsidence troughs detected by DInSAR that were classified according to their deformation behavior: impulsive or continuous over time. Although Figure 10 shows that several epicenters are located in correspondence with the subsidence troughs, in most cases the dates of tremors and subsidence events (fringes) did not match. The lack of time coincidence is highlighted in the example shown in Figure 11, which represents the location of a subsidence trough between Polkowice town and the Żelazny Most reservoir, where the cause-effect relationship between tremors and deformation pulses was not verified. The graph shows (i) the dates of 5 deformation pulses (quantified in LOS displacement in the histogram bars) which took place in this area and represented in 5 different interferograms and (ii) the dates of the major seismic events (black stars) that occurred within a radius of 2.5 km from this subsidence area. Deformations do not occur concurrently with earthquakes, and a proxy of the direct cause and effect relationship is lacking.
Furthermore, from the analysis of the cumulative displacement map (Figure 7), it was possible to argue that many areas reach a total subsidence of up to several tens of centimeters that can be achieved by a continuous subsidence over time, or by the sum of many subsidence pulses. Such kinds of deformation behavior cannot be easily described as direct consequences of tremors, but according to other authors, it can instead be related to excavation activities or to the abandonment of tunnels. For example, Przylucka et al. [5] used conventional DInSAR to measure a very fast mining-induced subsidence rate (up to 166 cm/year), showing that these deformations coincided with underground mining excavations. Other recent works [22,23,68] use conventional D-InSAR and other methods to retrieve a precise three-dimensional mining deformation field in the case of near-horizontal coal seam longwall mines in China. In this particular condition, they show that the surface movement basin has symmetrical morphological characteristics and expands along the advancing direction of the working face during excavation activities. Different geological conditions or the presence of large faults, folds, aquifers, and different topographic heights can strongly influence the surface movement, as does the mining and roof management methods [68].
Moreover, sudden roof subsidence, pillar spalling, or floor heave can be caused by pillar failures, that can appear more frequently when width-height ratios of pillars are smaller than 3 for coal mines, less than 2 for non-metal mines, and less than 1 for metal mines [20,69]. Studies on the long-term stability of mineral pillars showed that weathering and stress will eventually result in pillar size reduction and pillar strength degradation over time [70,71]. The dissolution of minerals indeed may reduce the size of the pillars [72]. Because of the possible combination of weathering and stress effects, the constant pillar scaling rate is empirical and site-specific, and it is difficult to obtain reliable results on pillar stability or pillar life [20].

5. Conclusions

Both A-DInSAR and DInSAR analyses performed on C-band Sentinel 1A SAR images shed light on a complex pattern of ground subsidence at an LGCD mine district, demonstrating that accurate monitoring is very important for preserving the safety of nearby urban centers. Even without information on mining activities, nor field data, this work highlights the capabilities of SAR satellite monitoring of superficial deformation resulting from mining.
A-DInSAR was exploited using the PSI technique to detect a maximum displacement velocity up to 50 mm/year and providing a dense measurement points distribution. Given the typical limitations of the technique, the standard PSI approach failed to detect fast ground movements, which occur within the subsidence troughs. Despite this limitation, the sub-centimetric precision achieved by PSI analysis, allowed us to monitor the real extent of the mining influence area, i.e., the more moderate but still dangerous ground deformation surrounding the detected subsidence troughs. This residual subsidence is located around the areas affected by intense deformation and decreases gradually (below 1.5 mm/year, considered as a stability threshold) about 1.5 km away from the center of the subsidence troughs.
The conventional DInSAR approach allowed us to detect deformation fringes of the order of several centimeters per months, and to define the location, the shape, and rough velocity values of subsidence in the mining area. To quantitatively estimate the total displacement that occurred during the whole analyzed time interval of April 2014–October 2019, the unwrapped interferograms were cumulated to develop a cumulative displacement map. For 10 different zones, the maximum cumulative subsidence exceeded 70 cm in about 5 years.
Two possible causes were investigated to explain the ground deformation detected at LGCD: mining-induced tremors or roof subsidence above the underground excavation rooms. Most of the observed subsidence phenomena could not be considered as direct consequences of tremors, but rather could be related to sudden or progressive roof subsidence of the excavation rooms, which directly follows the excavation activity. This hypothesis is supported by Popiolek et al. [61], who highlighted correspondence between the InSAR results and the LGCD exploitation development for the analyzed time. Another cause could lie in the progressive deterioration of abandoned mines. Because of the combination of weathering and stress effects, the stability of a room and pillar mine area is empirical and site-specific, making it very difficult to make assumptions about the precise causes and timing of the deformation processes, and the lack of information about the excavation program performed at LGCD mines and the location of active mining fronts prevented us from analyzing each single subsidence troughs in detail.
The new generations of satellites (“SmallSats”; [73]) with very high-resolution sensors (up to <1 m) onboard and very short revisiting times (up to multiple times a day), are expected to expand the capabilities of the InSAR performances [74,75] and improve the monitoring of very fast deformation phenomena, which can affect a heavily anthropized environment that changes continuously and quickly, such as active mining areas.

Author Contributions

Conceptualization, B.A., A.S., P.M. and F.B.; DInSAR and A-DInSAR processing, S.S.; methodology and data curation, S.S., B.A. and A.S.; formal analysis and investigation, B.A., A.S. and S.S.; writing—original draft preparation, B.A.; writing—review and editing, B.A., A.S., P.M. and F.B. All authors have read and agreed to the published version of the manuscript.

Funding

This research was funded by Sapienza Università di Roma, funding program: “Progetti di Ricerca Medi SAPIENZA 2018”, grant number RM118164367B3FF7, title of the project: “Analisi dei rischi geologici interferenti con le grandi dighe attraverso l’uso integrato di dati telerilevati e realtà virtuale”.

Institutional Review Board Statement

Not applicable.

Informed Consent Statement

Not applicable.

Data Availability Statement

Not applicable.

Conflicts of Interest

The authors declare no conflict of interest.

References

  1. Jung, H.C.; Kim, S.W.; Jung, H.S.; Min, K.D.; Won, J.S. Satellite observation of coal mining subsidence by persistent scatterer analysis. Eng. Geol. 2007, 92, 1–13. [Google Scholar] [CrossRef]
  2. Ge, L.; Chang, H.C.; Rizos, C. Mine subsidence monitoring using multi-source satellite SAR images. Photogramm. Eng. Remote Sens. 2007, 73, 259–266. [Google Scholar] [CrossRef]
  3. Pawluszek-Filipiak, K.; Borkowski, A. Integration of DInSAR and SBAS techniques to determine mining-related deformations using Sentinel-1 data: The case study of rydultowy mine in Poland. Remote Sens. 2020, 12, 242. [Google Scholar] [CrossRef] [Green Version]
  4. Liu, Z.G.; Bian, Z.F.; Lei, S.G.; Liu, D.L.; Sowter, A. Evaluation of PS-DInSAR technology for subsidence monitoring caused by repeated mining in mountainous area. Trans. Nonferrous Met. Soc. China 2014, 24, 3309–3315. [Google Scholar] [CrossRef]
  5. Przylucka, M.; Herrera, G.; Graniczny, M.; Colombo, D.; Béjar-Pizarro, M. Combination of conventional and advanced DInSAR to monitor very fast mining subsidence with TerraSAR-X data: Bytom City (Poland). Remote Sens. 2015, 7, 5300–5328. [Google Scholar] [CrossRef] [Green Version]
  6. Ng, A.H.-M.; Ge, L.; Du, Z.; Wang, S.; Ma, C. Satellite radar interferometry for monitoring subsidence induced by longwall mining activity using Radarsat-2, Sentinel-1 and ALOS-2 data. Int. J. Appl. Earth Obs. Geoinf. 2017, 61, 92–103. [Google Scholar] [CrossRef]
  7. Du, Z.; Ge, L.; Li, X.; Ng, A.H.M. Subsidence monitoring in the Ordos basin using integrated SAR differential and time-series interferometry techniques. Remote Sens. Lett. 2016, 7, 180–189. [Google Scholar] [CrossRef]
  8. Krawczyk, A.; Grzybek, R. An evaluation of processing InSAR Sentinel-1A/B data for correlation of mining subsidence with mining induced tremors in the Upper Silesian Coal Basin (Poland). E3S Web Conf. 2018, 26, 1–5. [Google Scholar] [CrossRef] [Green Version]
  9. Milillo, P.; Bürgmann, R.; Lundgren, P.; Salzer, J.; Perissin, D.; Fielding, E.; Biondi, F.; Milillo, G. Space geodetic monitoring of engineered structures: The ongoing destabilization of the Mosul dam, Iraq. Sci. Rep. 2016, 6, 1–7. [Google Scholar] [CrossRef] [PubMed] [Green Version]
  10. Lumbroso, D.; McElroy, C.; Goff, C.; Collell, M.R.; Petkovsek, G.; Wetton, M. The potential to reduce the risks posed by tailings dams using satellite-based information. Int. J. Disaster Risk Reduct. 2019, 38, 101209. [Google Scholar] [CrossRef]
  11. Du, Z.; Ge, L.; Ng, A.H.M.; Zhu, Q.; Horgan, F.G.; Zhang, Q. Risk assessment for tailings dams in Brumadinho of Brazil using InSAR time series approach. Sci. Total Environ. 2020, 717, 137125. [Google Scholar] [CrossRef]
  12. Moise, C.; Negula, I.D.; Mihalache, C.E.; Lazar, A.M.; Dedulescu, A.L.; Rustoiu, G.T.; Inel, I.C.; Badea, A. Remote sensing for cultural heritage assessment and monitoring: The case study of alba iulia. Sustainability 2021, 13, 1406. [Google Scholar] [CrossRef]
  13. Bozzano, F.; Esposito, C.; Mazzanti, P.; Patti, M.; Scancella, S. Imaging multi-age construction settlement behaviour by advanced SAR interferometry. Remote Sens. 2018, 10, 1137. [Google Scholar] [CrossRef] [Green Version]
  14. Di Lisa, M.; Ali, H.E.A.; Mazzanti, P.; Moretto, S. Inferring the creep settlement behavior of rockfill in reclaimed lands by advanced SAR interferometry and numerical modeling: An example from Arabian Gulf. Remote Sens. 2020, 12, 527. [Google Scholar] [CrossRef] [Green Version]
  15. Bozzano, F.; Mazzanti, P.; Perissin, D.; Rocca, A.; De Pari, P.; Discenza, M.E. Basin scale assessment of landslides geomorphological setting by advanced InSAR analysis. Remote Sens. 2017, 9, 267. [Google Scholar] [CrossRef] [Green Version]
  16. Moretto, S.; Bozzano, F.; Esposito, C.; Mazzanti, P.; Rocca, A. Assessment of landslide pre-failure monitoring and forecasting using satellite SAR interferometry. Geosciences 2017, 7, 36. [Google Scholar] [CrossRef] [Green Version]
  17. Urbini, S.; Bianchi-Fasani, G.; Mazzanti, P.; Rocca, A.; Vittuari, L.; Zanutta, A.; Girelli, V.A.; Serafini, M.; Zirizzotti, A.; Frezzotti, M. Multi-Temporal investigation of the Boulder Clay Glacier and Northern Foothills (Victoria Land, Antarctica) by integrated surveying techniques. Remote Sens. 2019, 11, 1501. [Google Scholar] [CrossRef] [Green Version]
  18. Rouyet, L.; Lauknes, T.R.; Christiansen, H.H.; Strand, S.M.; Larsen, Y. Seasonal dynamics of a permafrost landscape, Adventdalen, Svalbard, investigated by InSAR. Remote Sens. Environ. 2019, 231, 111236. [Google Scholar] [CrossRef]
  19. Gogolewska, A.B.; Strzeszynska, J. Factors Influencing Rock Burst Hazard in Deep Copper Ore Mine, SW Poland. IOP Conf. Ser. Earth Environ. Sci. 2019, 362. [Google Scholar] [CrossRef] [Green Version]
  20. Yu, Y.; Chen, S.E.; Deng, K.Z.; Fan, H.D. Long-term stability evaluation and pillar design criterion for room-and-pillar mines. Energies 2017, 10, 1644. [Google Scholar] [CrossRef] [Green Version]
  21. Malinowska, A.A.; Witkowski, W.T.; Guzy, A.; Hejmanowski, R. Mapping ground movements caused by mining-induced earthquakes applying satellite radar interferometry. Eng. Geol. 2018, 246, 402–411. [Google Scholar] [CrossRef]
  22. Wang, L.; Deng, K.; Zheng, M. Research on ground deformation monitoring method in mining areas using the probability integral model fusion D-InSAR, sub-band InSAR and offset-tracking. Int. J. Appl. Earth Obs. Geoinf. 2020, 85, 101981. [Google Scholar] [CrossRef]
  23. Fan, H.; Wang, L.; Wen, B.; Du, S. A New Model for three-dimensional Deformation Extraction with Single-track InSAR Based on Mining Subsidence Characteristics. Int. J. Appl. Earth Obs. Geoinf. 2021, 94, 102223. [Google Scholar] [CrossRef]
  24. Lizurek, G.; Lasocki, S. Clustering of mining-induced seismic events in equivalent dimension spaces. J. Seismol. 2014, 18, 543–563. [Google Scholar] [CrossRef]
  25. Rudzinski, Ł.; Cesca, S.; Lizurek, G. Complex rupture process of the 19 March 2013, Rudna mine (Poland) induced seismic event and collapse in the light of local and regional moment tensor inversion. Seismol. Res. Lett. 2016, 87, 274–284. [Google Scholar] [CrossRef] [Green Version]
  26. Hejmanowski, R.; Malinowska, A.A.; Witkowski, W.T.; Guzy, A. An analysis applying inSAR of subsidence caused by nearby mining-induced earthquakes. Geosciences 2019, 9, 490. [Google Scholar] [CrossRef] [Green Version]
  27. Crosetto, M.; Monserrat, O.; Devanthéry, N.; Cuevas-González, M.; Barra, A.; Crippa, B. Persistent scatterer interferometry using Sentinel-1 data. Int. Arch. Photogramm. Remote Sens. Spat. Inf. Sci. 2016, 41, 835–839. [Google Scholar] [CrossRef] [Green Version]
  28. Ng, A.H.M.; Ge, L.; Yan, Y.; Li, X.; Chang, H.C.; Zhang, K.; Rizos, C. Mapping accumulated mine subsidence using small stack of SAR differential interferograms in the Southern coalfield of New South Wales, Australia. Eng. Geol. 2010, 115, 1–15. [Google Scholar] [CrossRef]
  29. Ilieva, M.; Polanin, P.; Borkowski, A.; Gruchlik, P.; Smolak, K.; Kowalski, A.; Rohm, W. Mining deformation life cycle in the light of InSAR and deformation models. Remote Sens. 2019, 11, 745. [Google Scholar] [CrossRef] [Green Version]
  30. Berardino, P.; Fornaro, G.; Lanari, R.; Sansosti, E. A new algorithm for surface deformation monitoring based on small baseline differential SAR interferograms. IEEE Trans. Geosci. Remote Sens. 2002, 40, 2375–2383. [Google Scholar] [CrossRef] [Green Version]
  31. Perski, Z. The inerpretation of ERS-1 and ERS-2 INSAR data for the mining subsidence monitoring in upper silesian coal Basin, Poland. Int. Arch. Photogramm. Remote Sens. Spat. Inf. Sci. 2000, 33, 1137–1141. [Google Scholar]
  32. Szczerbowski, Z. High-energy seismic events in Legnica–Głogów Copper District in light of ASG-EUPOS data. Rep. Geod. Geoinformatics 2019, 107, 25–40. [Google Scholar] [CrossRef] [Green Version]
  33. Poszytek, A.; Rybak-Ostrowska, B.; Łukaszewski, P.; Włodarczyk, M. Gas trap stability in the Zechstein Limestone from the Rudna Copper Mine (SW Poland). Int. J. Earth Sci. 2020, 109, 439–463. [Google Scholar] [CrossRef] [Green Version]
  34. Borg, G.; Piestzynski, A.; Bachmann, G.H.; Puttman, W.; Walther, S.; Fiedler, M. Chapter 18 Digital Appendices An Overview of the European Kupferschiefer Deposits. Econ. Geol. Spec. Publ. 2012, 16, 1–8. [Google Scholar]
  35. Butra, J.; Kudełko, J. Rockburst hazard evaluation and prevention methods in Polish copper mines. Cuprum 2011, 61, 5–20. [Google Scholar]
  36. Burtan, Z. The influence of regional geological settings on the seismic hazard level in copper mines in the Legnica-Głogów Copper Belt Area (Poland). In E3S Web of Conferences, 2017; EDP Sciences: Les Ulis, France, 2017; Volume 24, p. 01004. [Google Scholar] [CrossRef] [Green Version]
  37. Massonnet, D.; Feigl, K.L. Radar interferometry and its application to changes in the earth’s surface. Rev. Geophys. 1998, 36, 441–500. [Google Scholar] [CrossRef] [Green Version]
  38. Bignami, C.; Burrato, P.; Cannelli, V.; Chini, M.; Falcucci, E.; Ferretti, A.; Gori, S.; Kyriakopoulos, C.; Melini, D.; Moro, M.; et al. Coseismic deformation pattern of the Emilia 2012 seismic sequence imaged by Radarsat-1 interferometry. Ann. Geophys. 2012, 55, 789–795. [Google Scholar] [CrossRef]
  39. Cheloni, D.; De Novellis, V.; Albano, M.; Antonioli, A.; Anzidei, M.; Atzori, S.; Avallone, A.; Bignami, C.; Bonano, M.; Calcaterra, S.; et al. Geodetic model of the 2016 Central Italy earthquake sequence inferred from InSAR and GPS data. Geophys. Res. Lett. 2017, 44, 6778–6787. [Google Scholar] [CrossRef]
  40. Valerio, E.; Tizzani, P.; Carminati, E.; Doglioni, C.; Pepe, S.; Petricca, P.; De Luca, C.; Bignami, C.; Solaro, G.; Castaldo, R.; et al. Ground deformation and source geometry of the 30 October 2016M w 6.5 norcia earthquake (Central Italy) investigated through seismological data, DInSAR measurements, and numerical modelling. Remote Sens. 2018, 10, 1901. [Google Scholar] [CrossRef] [Green Version]
  41. Antonielli, B.; Monserrat, O.; Bonini, M.; Righini, G.; Sani, F.; Luzi, G.; Feyzullayev, A.A.; Aliyev, C.S. Pre-eruptive ground deformation of Azerbaijan mud volcanoes detected through satellite radar interferometry (DInSAR). Tectonophysics 2014, 637, 163–177. [Google Scholar] [CrossRef]
  42. Euillades, L.D.; Euillades, P.A.; Riveros, N.C.; Masiokas, M.H.; Ruiz, L.; Pitte, P.; Elefante, S.; Casu, F.; Balbarani, S. Detection of glaciers displacement time-series using SAR. Remote Sens. Environ. 2016, 184, 188–198. [Google Scholar] [CrossRef]
  43. Samsonov, S. Three-dimensional deformation time series of glacier motion from multiple-aperture DInSAR observation. J. Geod. 2019, 93, 2651–2660. [Google Scholar] [CrossRef] [Green Version]
  44. Rocca, A.; Mazzanti, P.; Perissin, D.; Bozzano, F. Detection of past slope activity in a desert area using multi-temporal DInSAR with ALOS PALSAR data. Ital. J. Eng. Geol. Environ. 2014, 1, 35–50. [Google Scholar] [CrossRef]
  45. Barra, A.; Monserrat, O.; Mazzanti, P.; Esposito, C.; Crosetto, M.; Scarascia Mugnozza, G. First insights on the potential of Sentinel-1 for landslides detection. Geomat. Nat. Hazards Risk 2016, 7, 1874–1883. [Google Scholar] [CrossRef] [Green Version]
  46. Antonielli, B.; Mazzanti, P.; Rocca, A.; Bozzano, F.; Cas, L.D. A-DInSAR performance for updating landslide inventory in mountain areas: An example from lombardy region (Italy). Geosciences 2019, 9, 364. [Google Scholar] [CrossRef] [Green Version]
  47. Bozzano, F.; Esposito, C.; Franchi, S.; Mazzanti, P.; Perissin, D.; Rocca, A.; Romano, E. Understanding the subsidence process of a quaternary plain by combining geological and hydrogeological modelling with satellite InSAR data: The Acque Albule Plain case study. Remote Sens. Environ. 2015, 168, 219–238. [Google Scholar] [CrossRef]
  48. Stramondo, S.; Bozzano, F.; Marra, F.; Wegmuller, U.; Cinti, F.R.; Moro, M.; Saroli, M. Subsidence induced by urbanisation in the city of Rome detected by advanced InSAR technique and geotechnical investigations. Remote Sens. Environ. 2008, 112, 3160–3172. [Google Scholar] [CrossRef]
  49. Perissin, D.; Piantanida, R.; Piccagli, D.; Rocca, F. Landslide in Dossena (BG): Comparison between interferometric techniques. Biogeosar 2007, 9, 1–7. [Google Scholar]
  50. Costantini, M. Based on Network Programming. October 1998, 36, 813–821. [Google Scholar]
  51. Chen, C.W.; Zebker, H.A. Two-dimensional phase unwrapping with use of statistical models for cost functions in nonlinear optimization. J. Opt. Soc. Am. A 2001, 18, 338. [Google Scholar] [CrossRef] [PubMed] [Green Version]
  52. Goldstein, R.M.; Werner, C.L. Radar interferogram filtering for geophysical applications. Geophys. Res. Lett. 1998, 25, 4035–4038. [Google Scholar] [CrossRef] [Green Version]
  53. Ferretti, A.; Prati, C.; Rocca, F. Nonlinear subsidence rate estimation using permanent scatterers in differential SAR interferometry. IEEE Trans. Geosci. Remote Sens. 2000, 38, 2202–2212. [Google Scholar] [CrossRef] [Green Version]
  54. Ferretti, A.; Prati, C.; Rocca, F. Permanent scatterers in SAR interferometry. IEEE Trans. Geosci. Remote Sens. 2001, 39, 8–20. [Google Scholar] [CrossRef]
  55. Hanssen, R.F. Satellite radar interferometry for deformation monitoring: A priori assessment of feasibility and accuracy. Int. J. Appl. Earth Obs. Geoinf. 2005, 6, 253–260. [Google Scholar] [CrossRef]
  56. Kampes, B.M. Radar Interferometry: Persistent Scatterer Technique; Springer: Dordrecht, The Netherlands, 2006; Volume 12, ISBN 140204576X. [Google Scholar]
  57. Perissin, D.; Wang, Z.; Wang, T. The SARPROZ InSAR tool for urban subsidence/manmade structure stability monitoring in China. In Proceedings of the 34th International Symposium on Remote Sensing of Environment (ISRSE), Sidney, Australia, 10–15 April 2011. [Google Scholar]
  58. Samieie-Esfahany, S.; Hanssen, R.F.; Van Thienen-visser, K.; Muntendam-bos, A.; Samiei-Esfahany, S.; Hanssen, R.F.; Van Thienen-visser, K.; Muntendam-bos, A. On the effect of horizontal deformation on InSAR subsidence estimates. Proc. Fringe 2009 Workshop 2010, 2009, 1–7. [Google Scholar]
  59. Sui, L.; Ma, F.; Chen, N. Mining subsidence prediction by combining support vector machine regression and interferometric synthetic aperture radar data. ISPRS Int. J. Geo Inf. 2020, 9, 390. [Google Scholar] [CrossRef]
  60. Szczerbowski, Z.; Jura, J. Mining induced seismic events and surface deformations monitored by GPS permanent stations. Acta Geodyn. Geomater. 2015, 12, 237–248. [Google Scholar] [CrossRef] [Green Version]
  61. Popiolek, E.; Hejmannowski, R.; Krawczyk, A.; Perski, Z. Application of Satellite Radar Interferometry to the examination of the areas of mining exploitation. Surf. Min. Braunkhole Other Min. 2002, 54, 74–82. [Google Scholar]
  62. Skrzypkowski, K. Case studies of rock bolt support loads and rock mass monitoring for the room and pillar method in the legnica-głogów copper district in Poland. Energies 2020, 13, 2998. [Google Scholar] [CrossRef]
  63. Bell, F.G.; Stacey, T.R.; Genske, D.D. Mining subsidence and its effect in the environment: Some differing examples. Environ. Geol. 2000, 40, 135–152. [Google Scholar] [CrossRef]
  64. Milczarek, W. Investigation of post inducted seismic deformation of the 2016 Mw4.2 tarnowek Poland mining tremor based on Dinsar and SBAS methods. Acta Geodyn. Geomater. 2019, 16, 183–193. [Google Scholar] [CrossRef]
  65. Eneva, M. Detection of Surface Deformation at Mining and Geothermal Sites Using Satellite Radar Interferometry (InSAR). In Proceedings of the 44th U.S. Rock Mechanics Symposium and 5th U.S.-Canada Rock Mechanics Symposium, Salt Lake City, UT, USA, 27–30 June 2010. [Google Scholar]
  66. Owczarz, K.; Blachowski, J. Application of satellite radar interferometry in study of the relation between surface deformation and seismic event of the 15th September 2018 in the Rudna copper mine, Poland. Geokinematischer Tag TU Bergakademie Freiberg 2019, 20, 93–104. [Google Scholar]
  67. Gee, D.; Bateson, L.; Sowter, A.; Grebby, S.; Novellino, A.; Cigna, F.; Marsh, S.; Banton, C.; Wyatt, L. Ground motion in areas of abandoned mining: Application of the intermittent SBAS (ISBAS) to the Northumberland and Durham Coalfield, UK. Geosciences 2017, 7, 85. [Google Scholar] [CrossRef] [Green Version]
  68. Dong, L.; Wang, C.; Tang, Y.; Tang, F.; Zhang, H.; Wang, J.; Duan, W. Time Series InSAR Three-Dimensional Displacement Inversion Model of Coal Mining Areas Based on Symmetrical Features of Mining Subsidence. Remote Sens. 2021, 13, 2143. [Google Scholar] [CrossRef]
  69. Kendorski, F.S.; President, V.; Associates, A. 25th International Conference on Ground Control in Mining. In Proceedings of the 25th International Conference on Ground Control in Mining, Morgantown, WV, USA, 1–3 August 2006; pp. 325–334. [Google Scholar]
  70. Salmi, E.F.; Nazem, M.; Karakus, M. The effect of rock mass gradual deterioration on the mechanism of post-mining subsidence over shallow abandoned coal mines. Int. J. Rock Mech. Min. Sci. 2017, 91, 59–71. [Google Scholar] [CrossRef]
  71. Esterhuizen, G.S.; Dolinar, D.R.; Ellenberger, J.L. Pillar strength in underground stone mines in the United States. Int. J. Rock Mech. Min. Sci. 2011, 48, 42–50. [Google Scholar] [CrossRef]
  72. Castellanza, R.; Gerolymatou, E.; Nova, R. An attempt to predict the failure time of abandoned mine pillars. Rock Mech. Rock Eng. 2008, 41, 377–401. [Google Scholar] [CrossRef]
  73. De, E.; Blanco, R.; Behrens, J.R.; Corbin, B.A.; Green, E.K.; Picard, A.J. Global Trends in Small Satellites; Virginia Lal, B., Ed.; IDA Science and Technology Policy Institute: Alexandria, Egypt, 2017. [Google Scholar]
  74. Ignatenko, V.; Laurila, P.; Radius, A.; Lamentowski, L.; Antropov, O.; Muff, D. ICEYE Microsatellite SAR Constellation Status Update: Evaluation of First Commercial Imaging Modes. Int. Geosci. Remote Sens. Symp. 2020, 3581–3584. [Google Scholar] [CrossRef]
  75. Farquharson, G.; Space, C.; Francisco, S. Radar Description Radar System. In Proceedings of the EUSAR 2018-12th European Conference on Synthetic Aperture Radar, Aachen, Germany, 4–7 June 2018; pp. 1245–1249. [Google Scholar]
Figure 1. Satellite view of the Legnica Glogow Copper District (from Google Earth); mine district borders are shown in black lines (from http://dm.pgi.gov.pl/, accessed on 15 May 2021).
Land 10 00653 g001
Figure 2. Geological setting of the study area; (a) tectonic sketch (modified from [21]); Zechstein limestones belong to Lower and Upper Permian deposits in the legend; (b) schematic geological section of the Rudna Copper Mine (modified from [33]).
Land 10 00653 g002
Figure 3. A-DInSAR Displacement velocity maps of the Legnica Glogow Copper mining District (LGCD) for the time period October 2014–April 2019; (a) horizontal displacement velocity map, along the east-west direction; green color represents stable areas, cyan, and blue colors represent the displacement towards the east, while orange and red colors represent the displacement towards the west; (b) vertical displacement velocity map, along the up-down direction; green color represents stable areas, orange, and red colors represent subsidence.
Land 10 00653 g003
Figure 4. Time series of displacement for 3 areas selected as examples in the LGCD district; (a) location of the PSs selected for processing the time series; (bd) time series at Moskorzyn, Polkowice, and Tarnowek towns, respectively; the time series were retrieved averaging the time series for 3 neighboring PSs.
Land 10 00653 g004
Figure 5. Sentinel 1 C-band differential interferogram, dates: 14 January 2015–3 March 2015; white lines represent LGCD mine district borders. The perimeter of the subsidence troughs was mapped during the whole analyzed time span (October 2014–April 2019).
Land 10 00653 g005
Figure 6. Interferograms subsets of the central part of the study area. Each interferometric fringe (color scale from blue to red) corresponds to a displacement of −2.8 cm.
Land 10 00653 g006
Figure 7. DInSAR cumulative displacement at the LGCD mines, from October 2014 to April 2019; black lines represent LGCD mine district borders; dashed black lines represent the perimeters of the areas subject to a subsidence >30 cm.
Land 10 00653 g007
Figure 8. Cumulative displacement profiles at three subsidence troughs A, B, and C; (a) location of the cross sections; (b,c) EW and NS cross sections of subsidence trough A, respectively; (d,e) EW and NS cross sections of subsidence trough B, respectively; (f,g) EW and NS cross sections of subsidence trough C, respectively.
Land 10 00653 g008
Figure 9. Up/Down A-DInSAR vs. cumulative DInSAR results; (a) PSs in up-down direction (October 2014–April 2019) superimposed on the cumulative DInSAR displacement map; the blue box shows the location of the panels b and c; (b) zoom on the Polkowice zone; (c) PSs in LOS direction superimposed on the interferogram 29 November 2017–11 December 2017 in shades of gray, zoom on the Polkowice zone as in panel b.
Land 10 00653 g009
Figure 10. Epicenters distribution of seismic events with a magnitude > 3.0 that occurred between October 2014 and April 2019, and distribution of the subsidence troughs (epicenters from https://www.emsc.eu/, accessed on 10 February 2021).
Land 10 00653 g010
Figure 11. Epicenters time distribution vs. deformation pulses for a subsidence trough between Polkowice and the Żelazny Most reservoir. The seismic events were within 2.5 km from the center of the subsidence trough.
Land 10 00653 g011
Table 1. Description of the analyzed dataset.
Sentinel-1AscendingDescending
Nr of scenes206205
Start date15 November 20147 October 2014
End date5 May 201914 April 2019
Look angle (°)39.0538.96
Publisher’s Note: MDPI stays neutral with regard to jurisdictional claims in published maps and institutional affiliations.