4.1. Discussion and Limitation
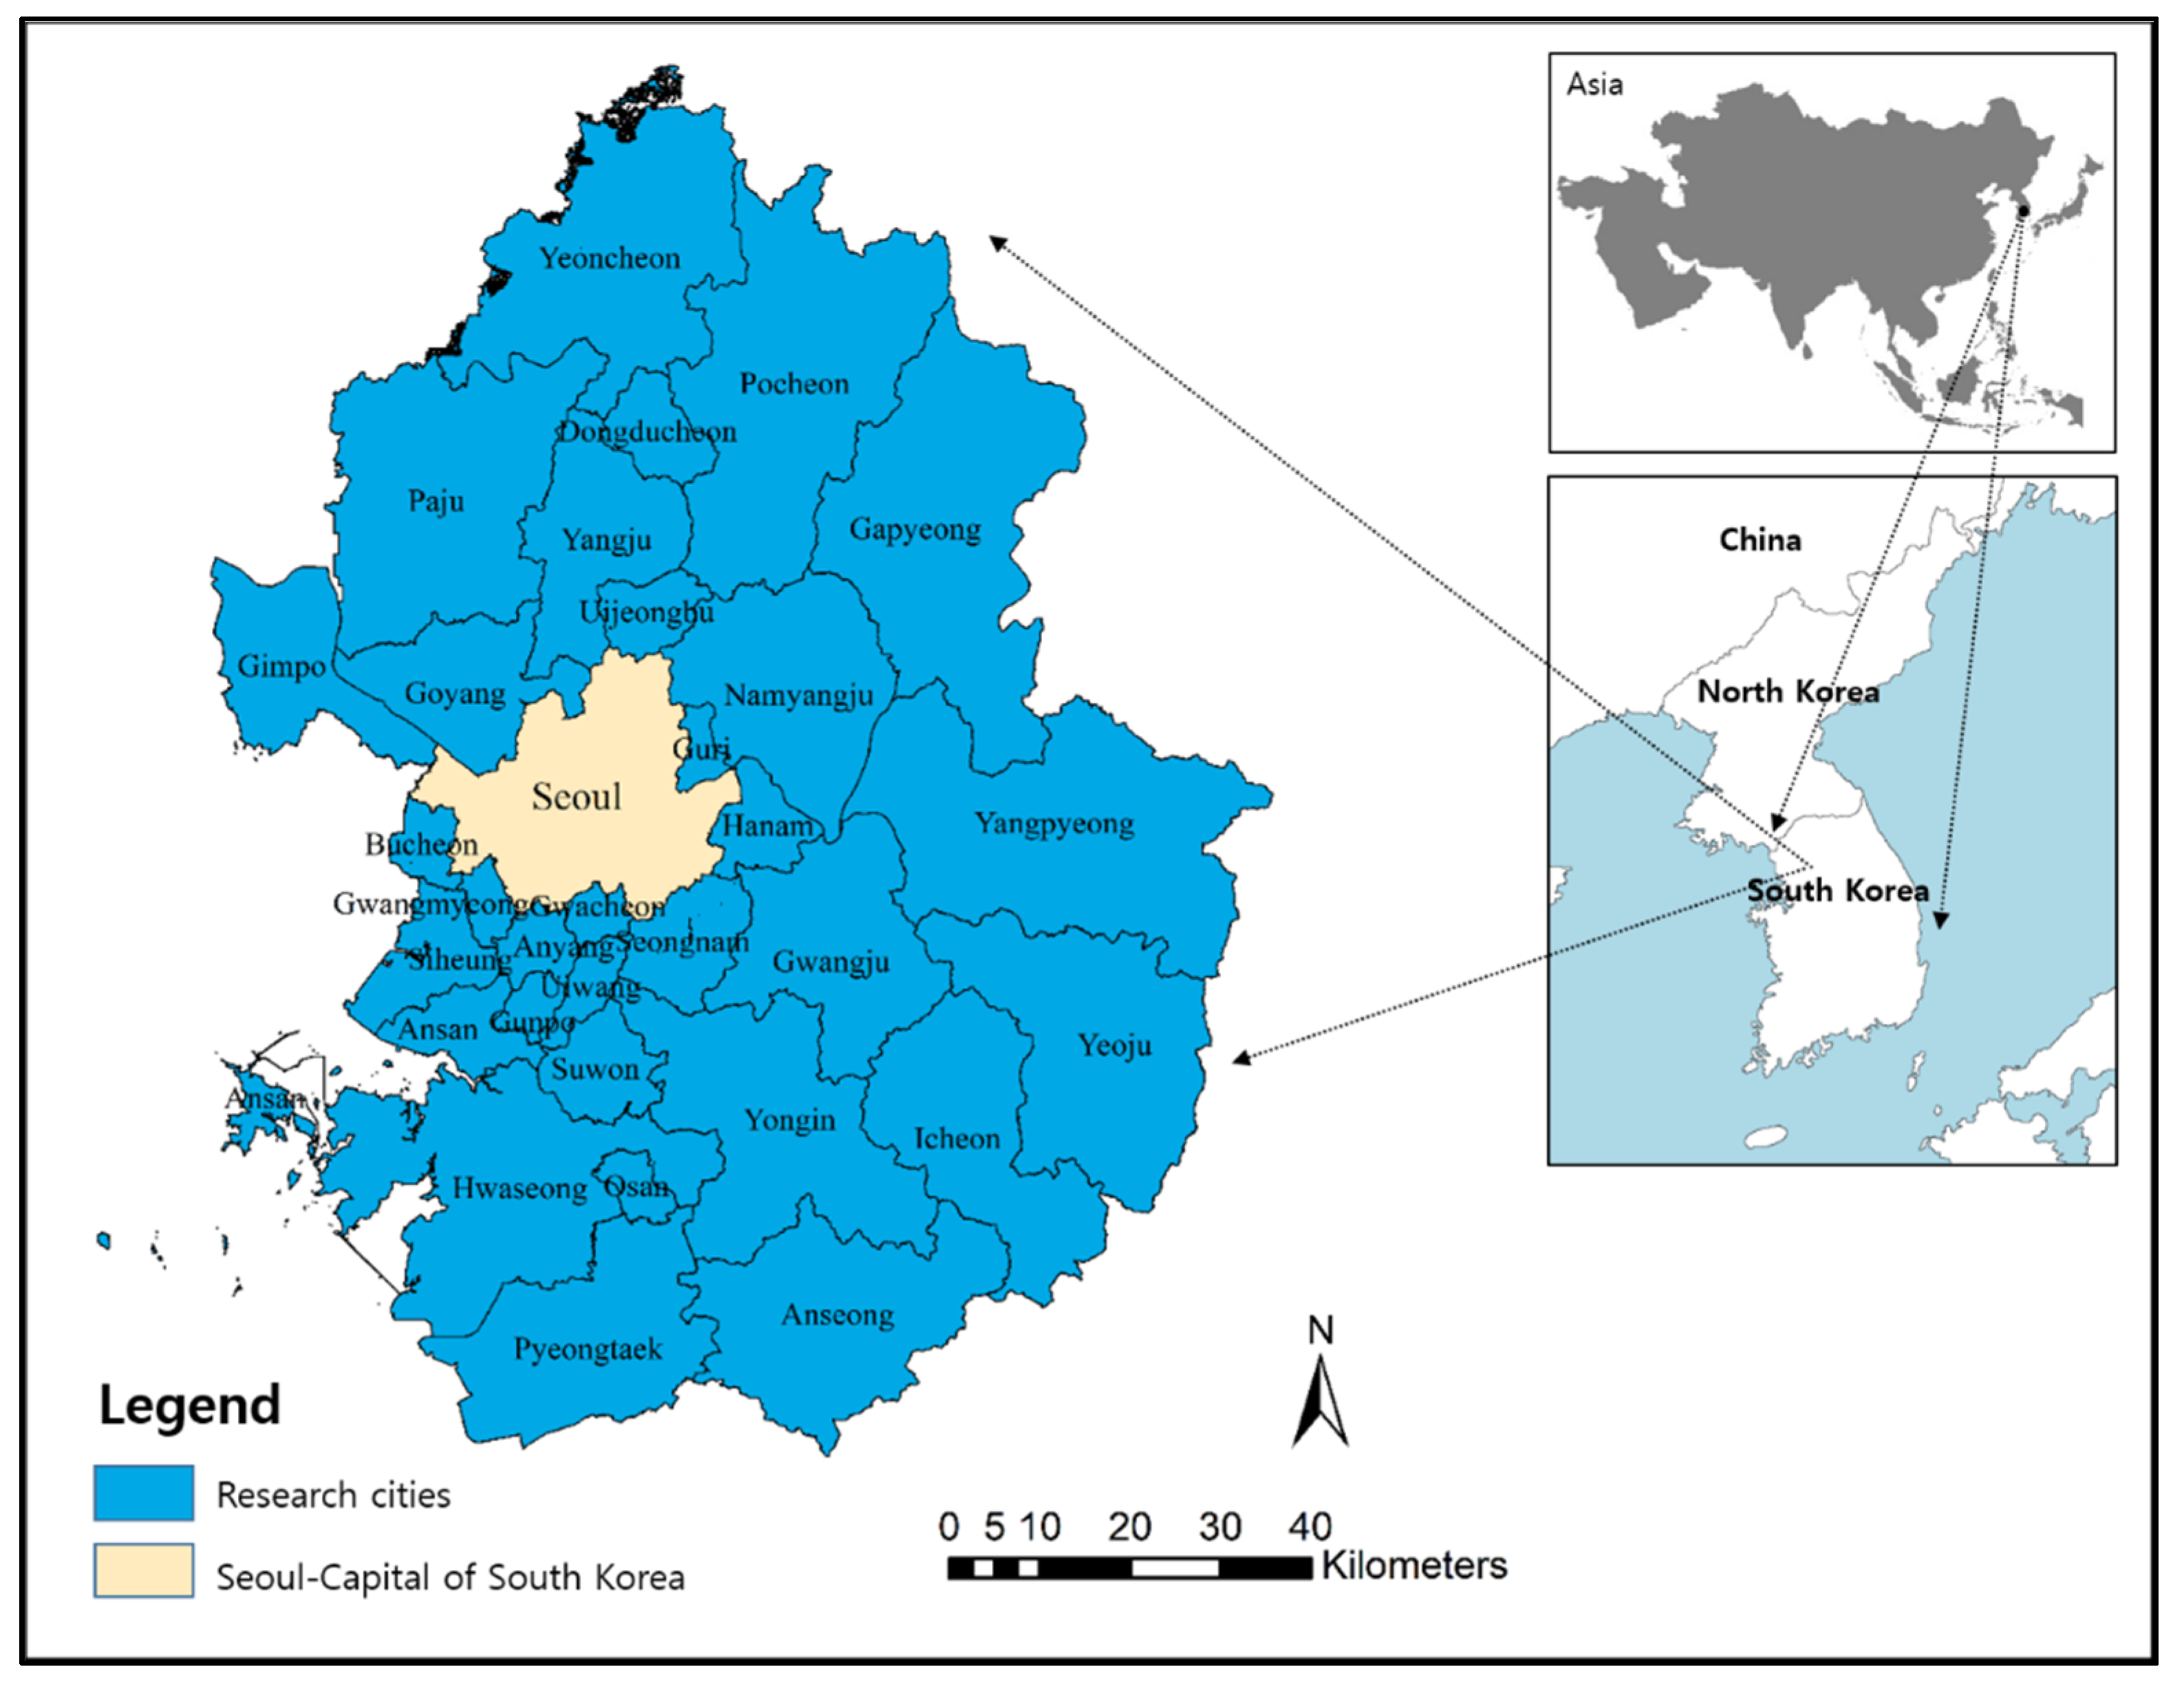
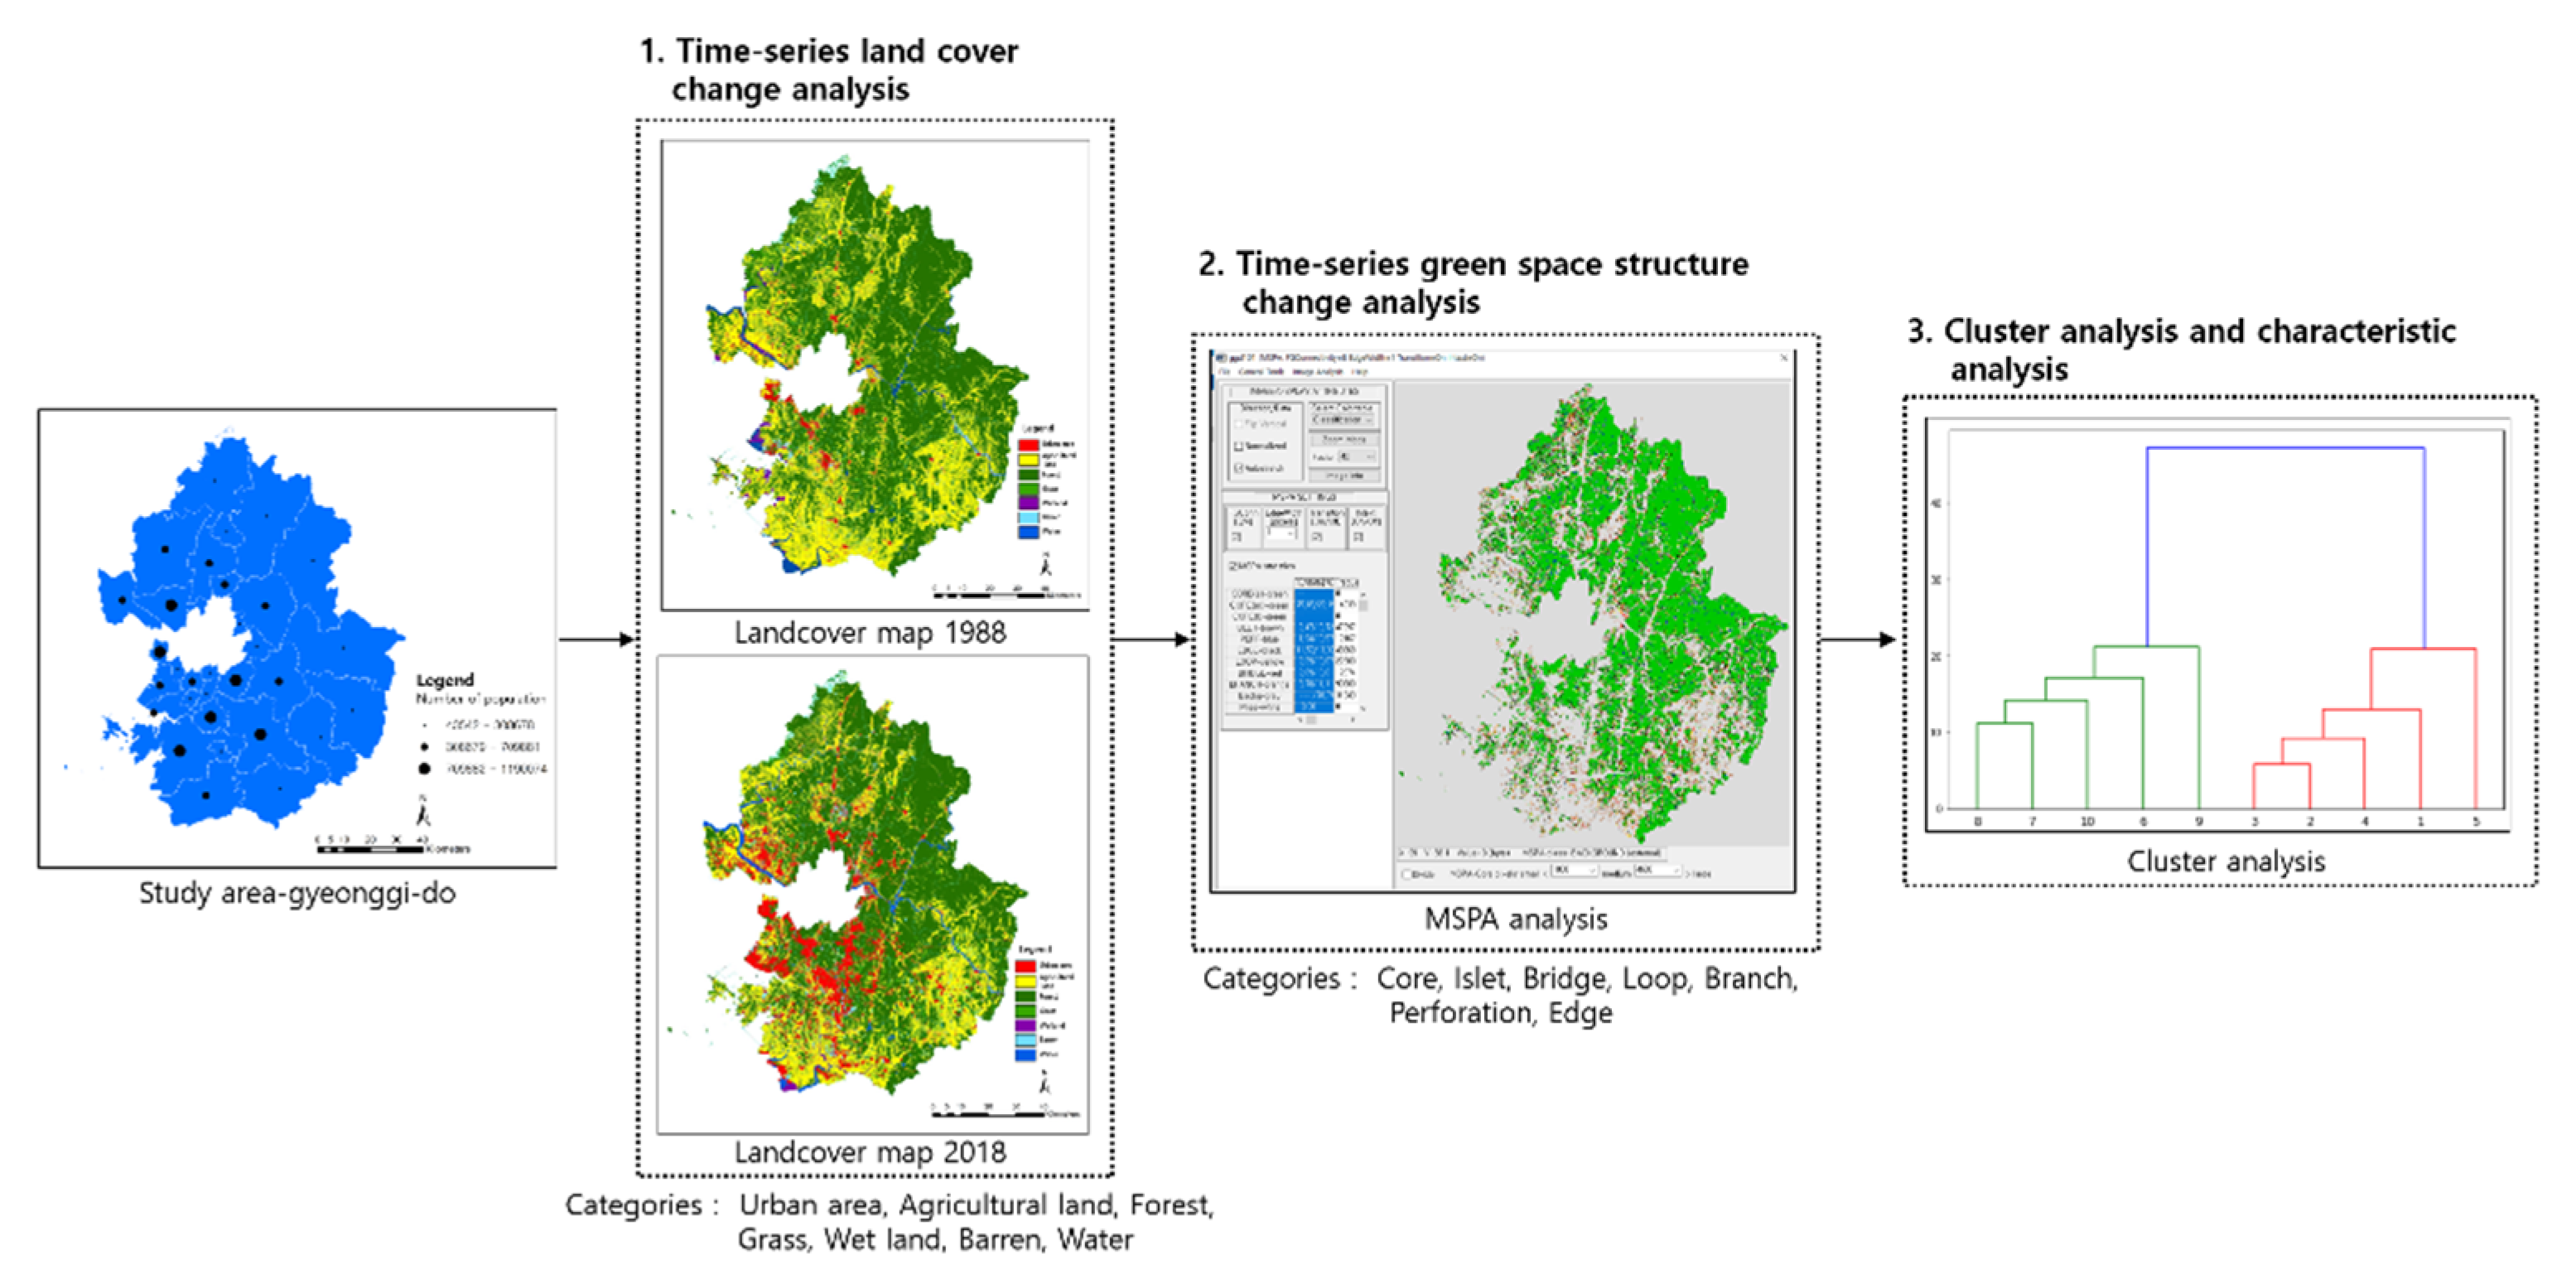
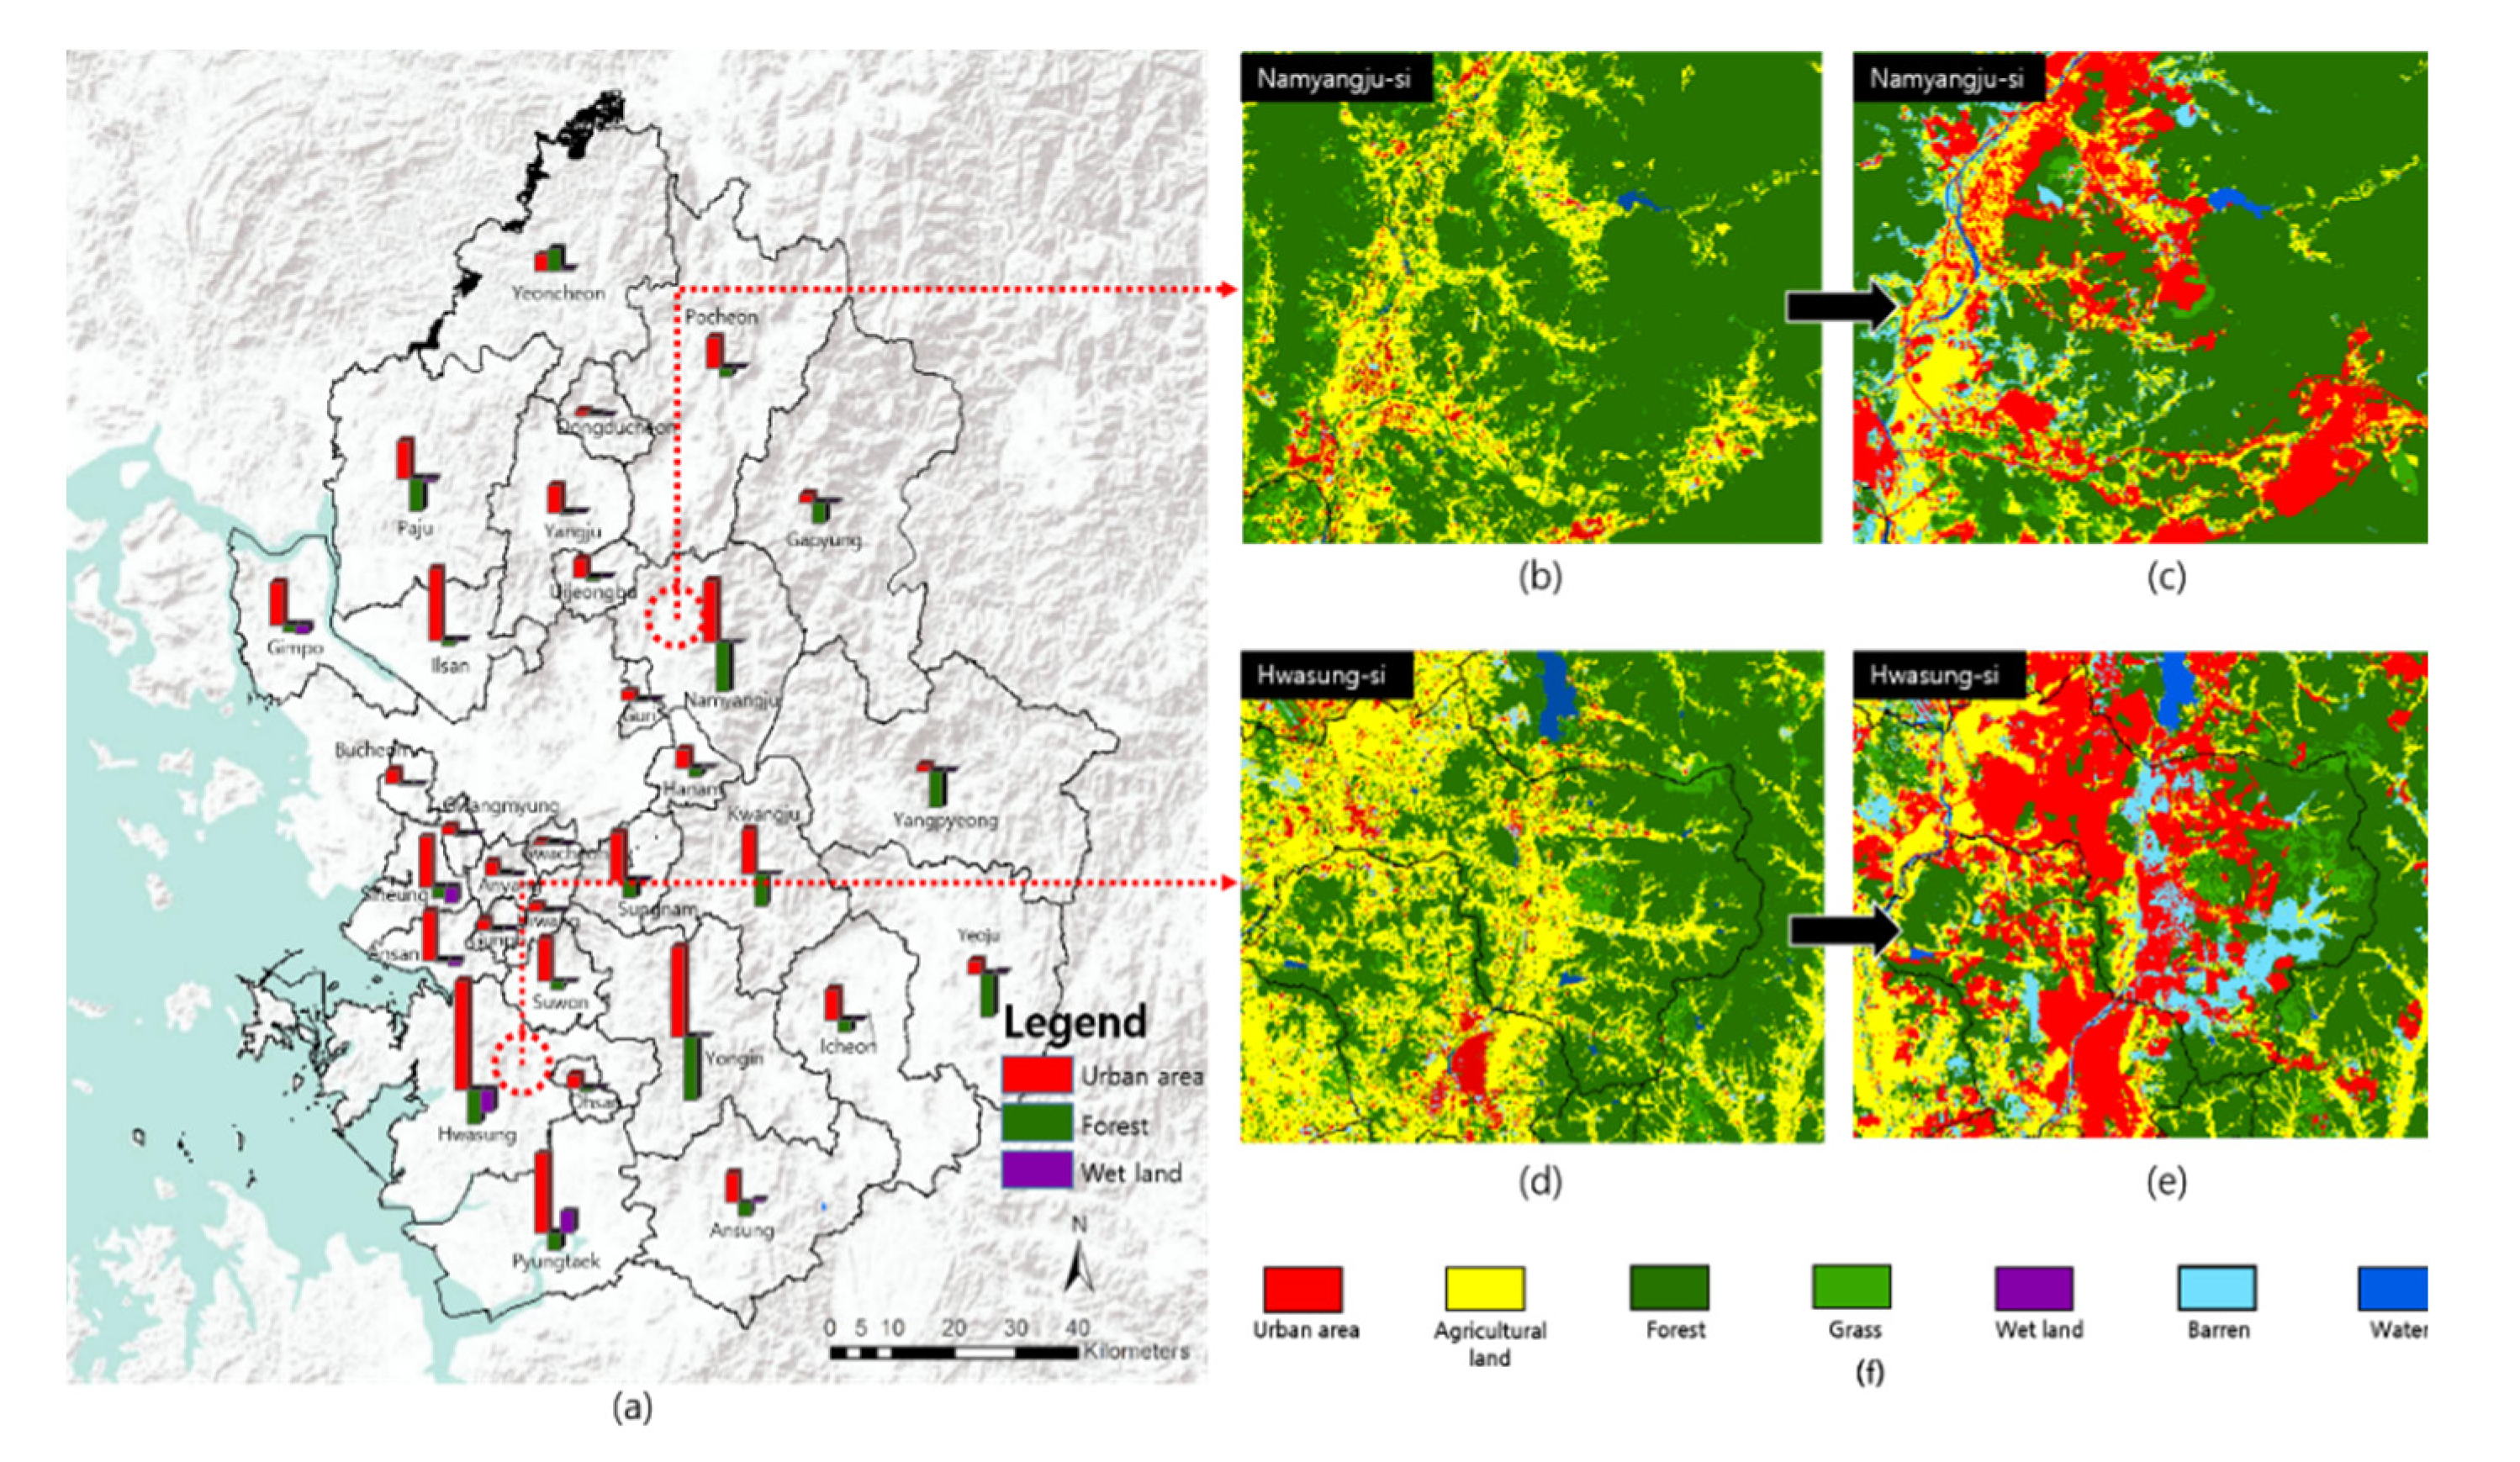
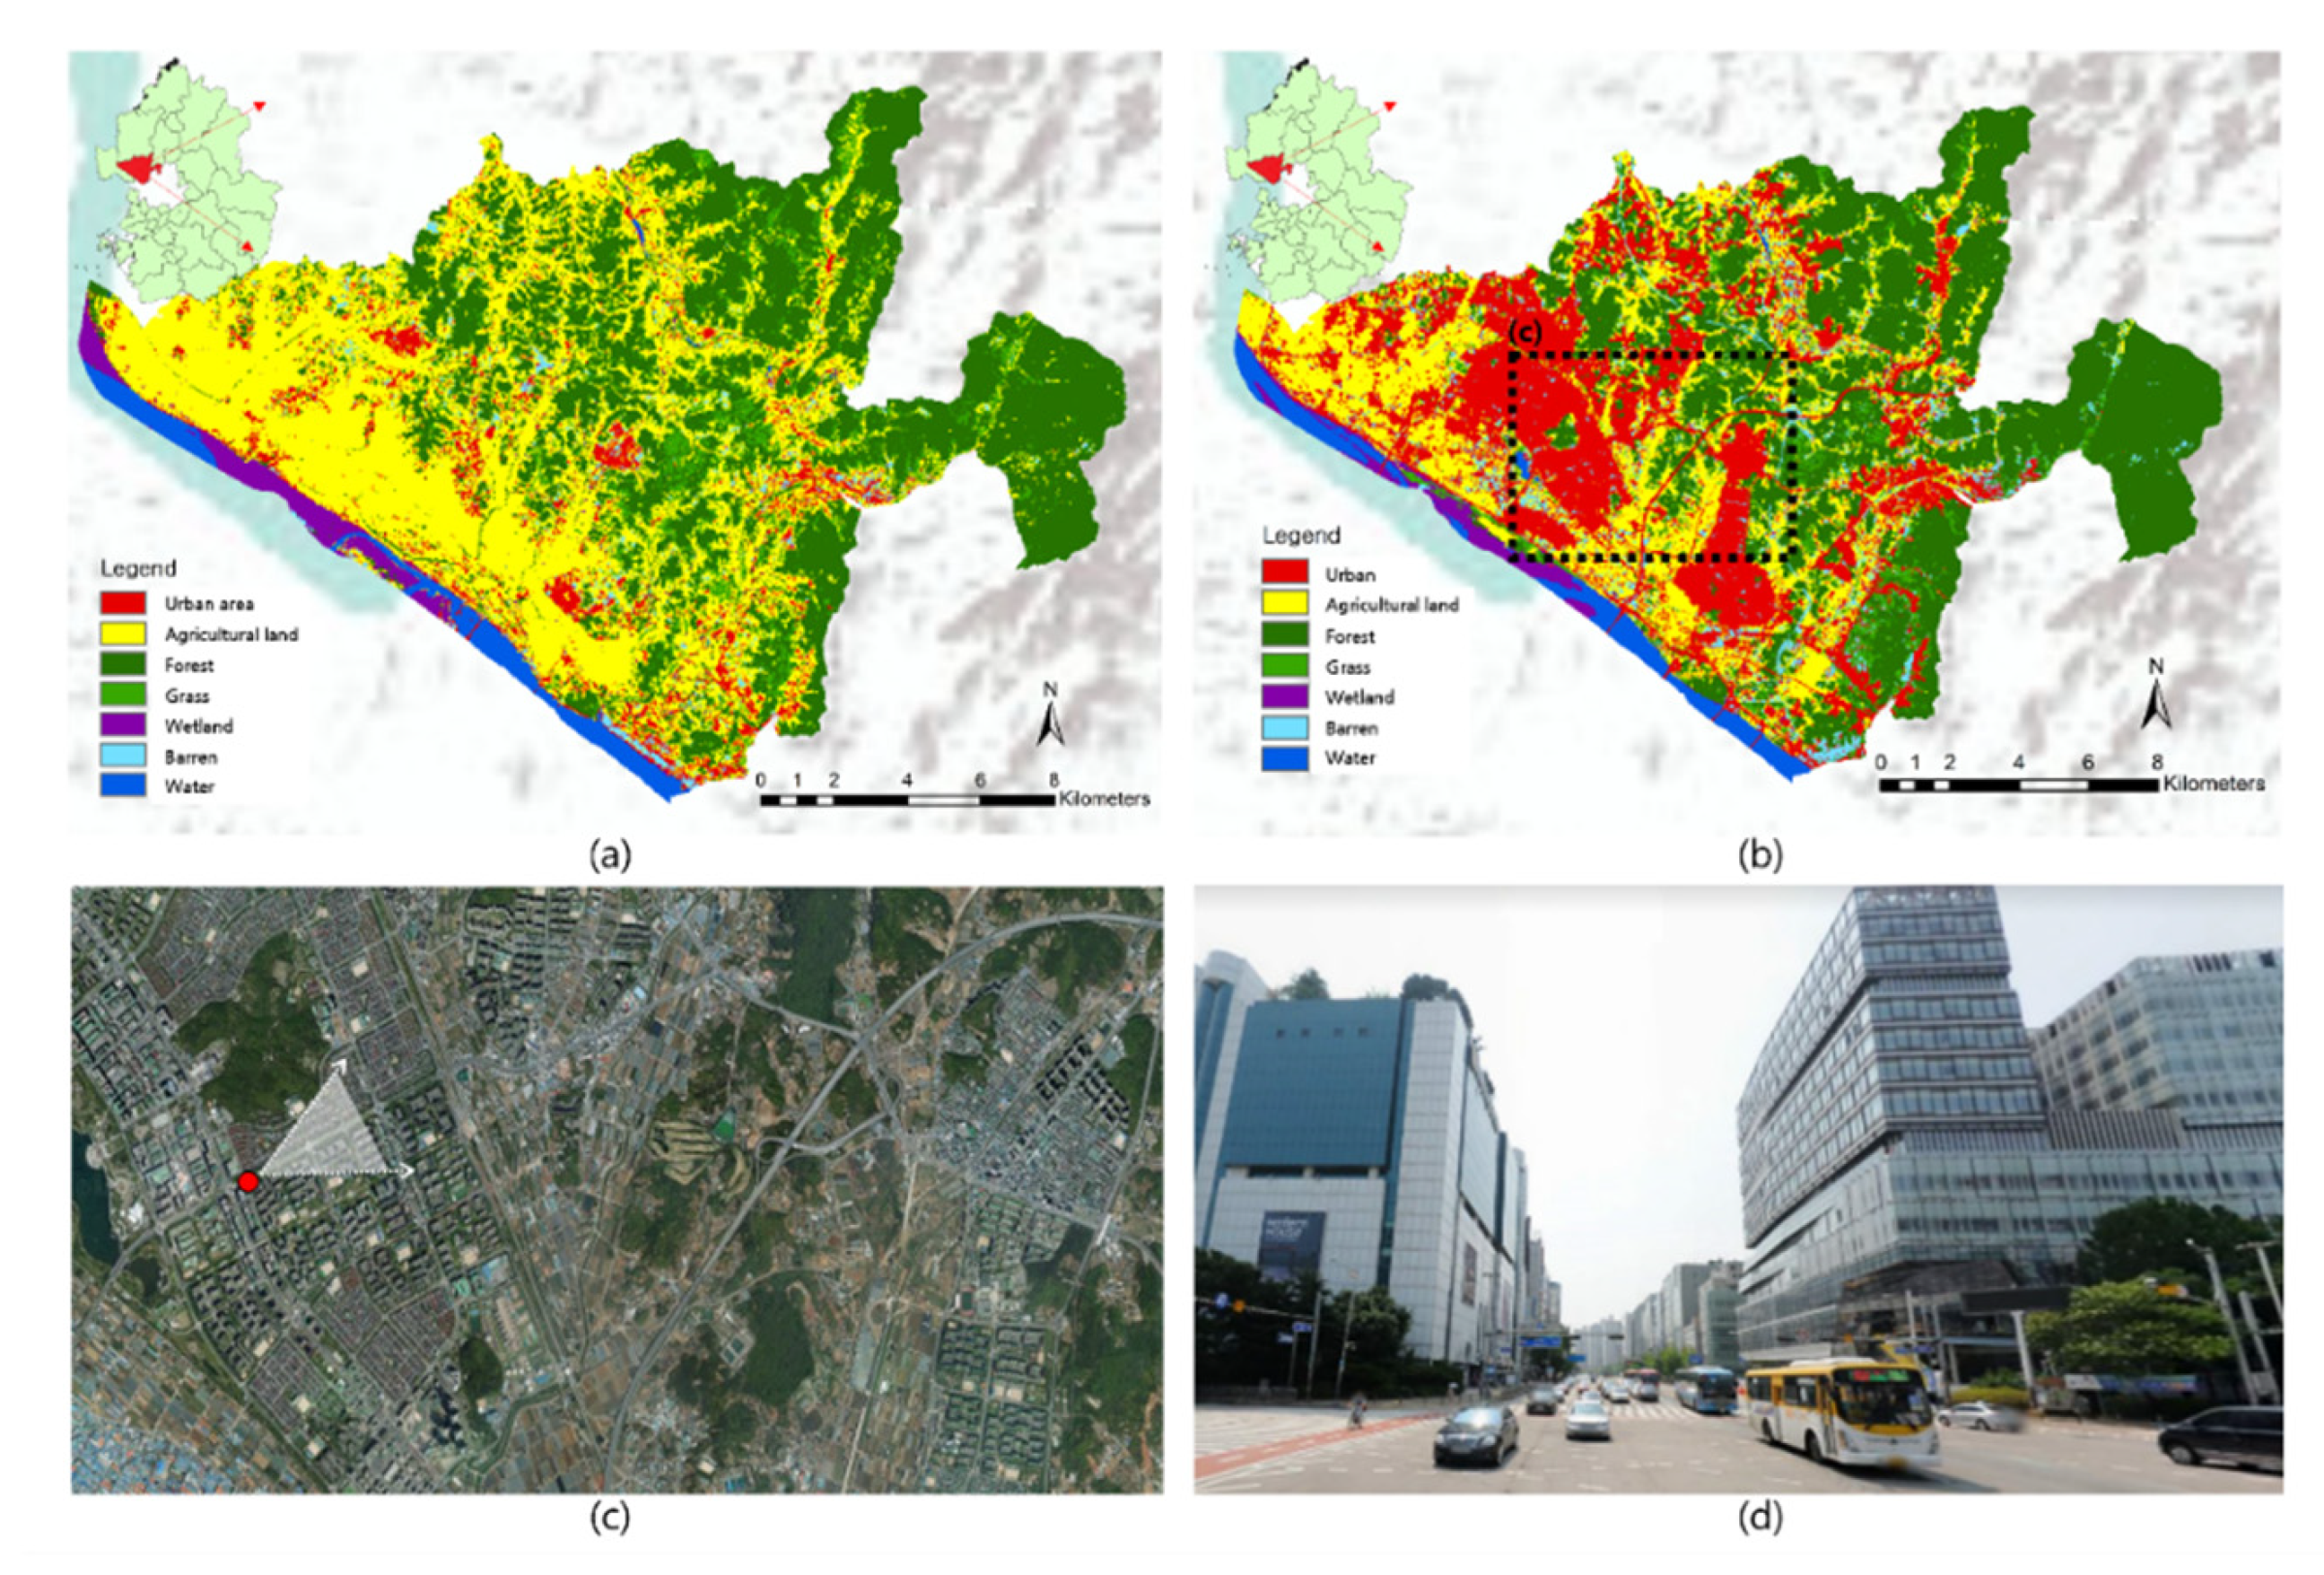
In the present study, we determined changes in land coverage and changes in MSPA values in each of the 31 satellite cities surrounding Seoul for about 30 years, from 1988 to 2018. Cities that showed similar environmental changes were grouped. First, for changes in land coverage, urbanized areas in all 31 cities were found to have increased. In particular, urbanization was concentrated in cities adjacent to Seoul, the capital. For example, in the case of Goyang (
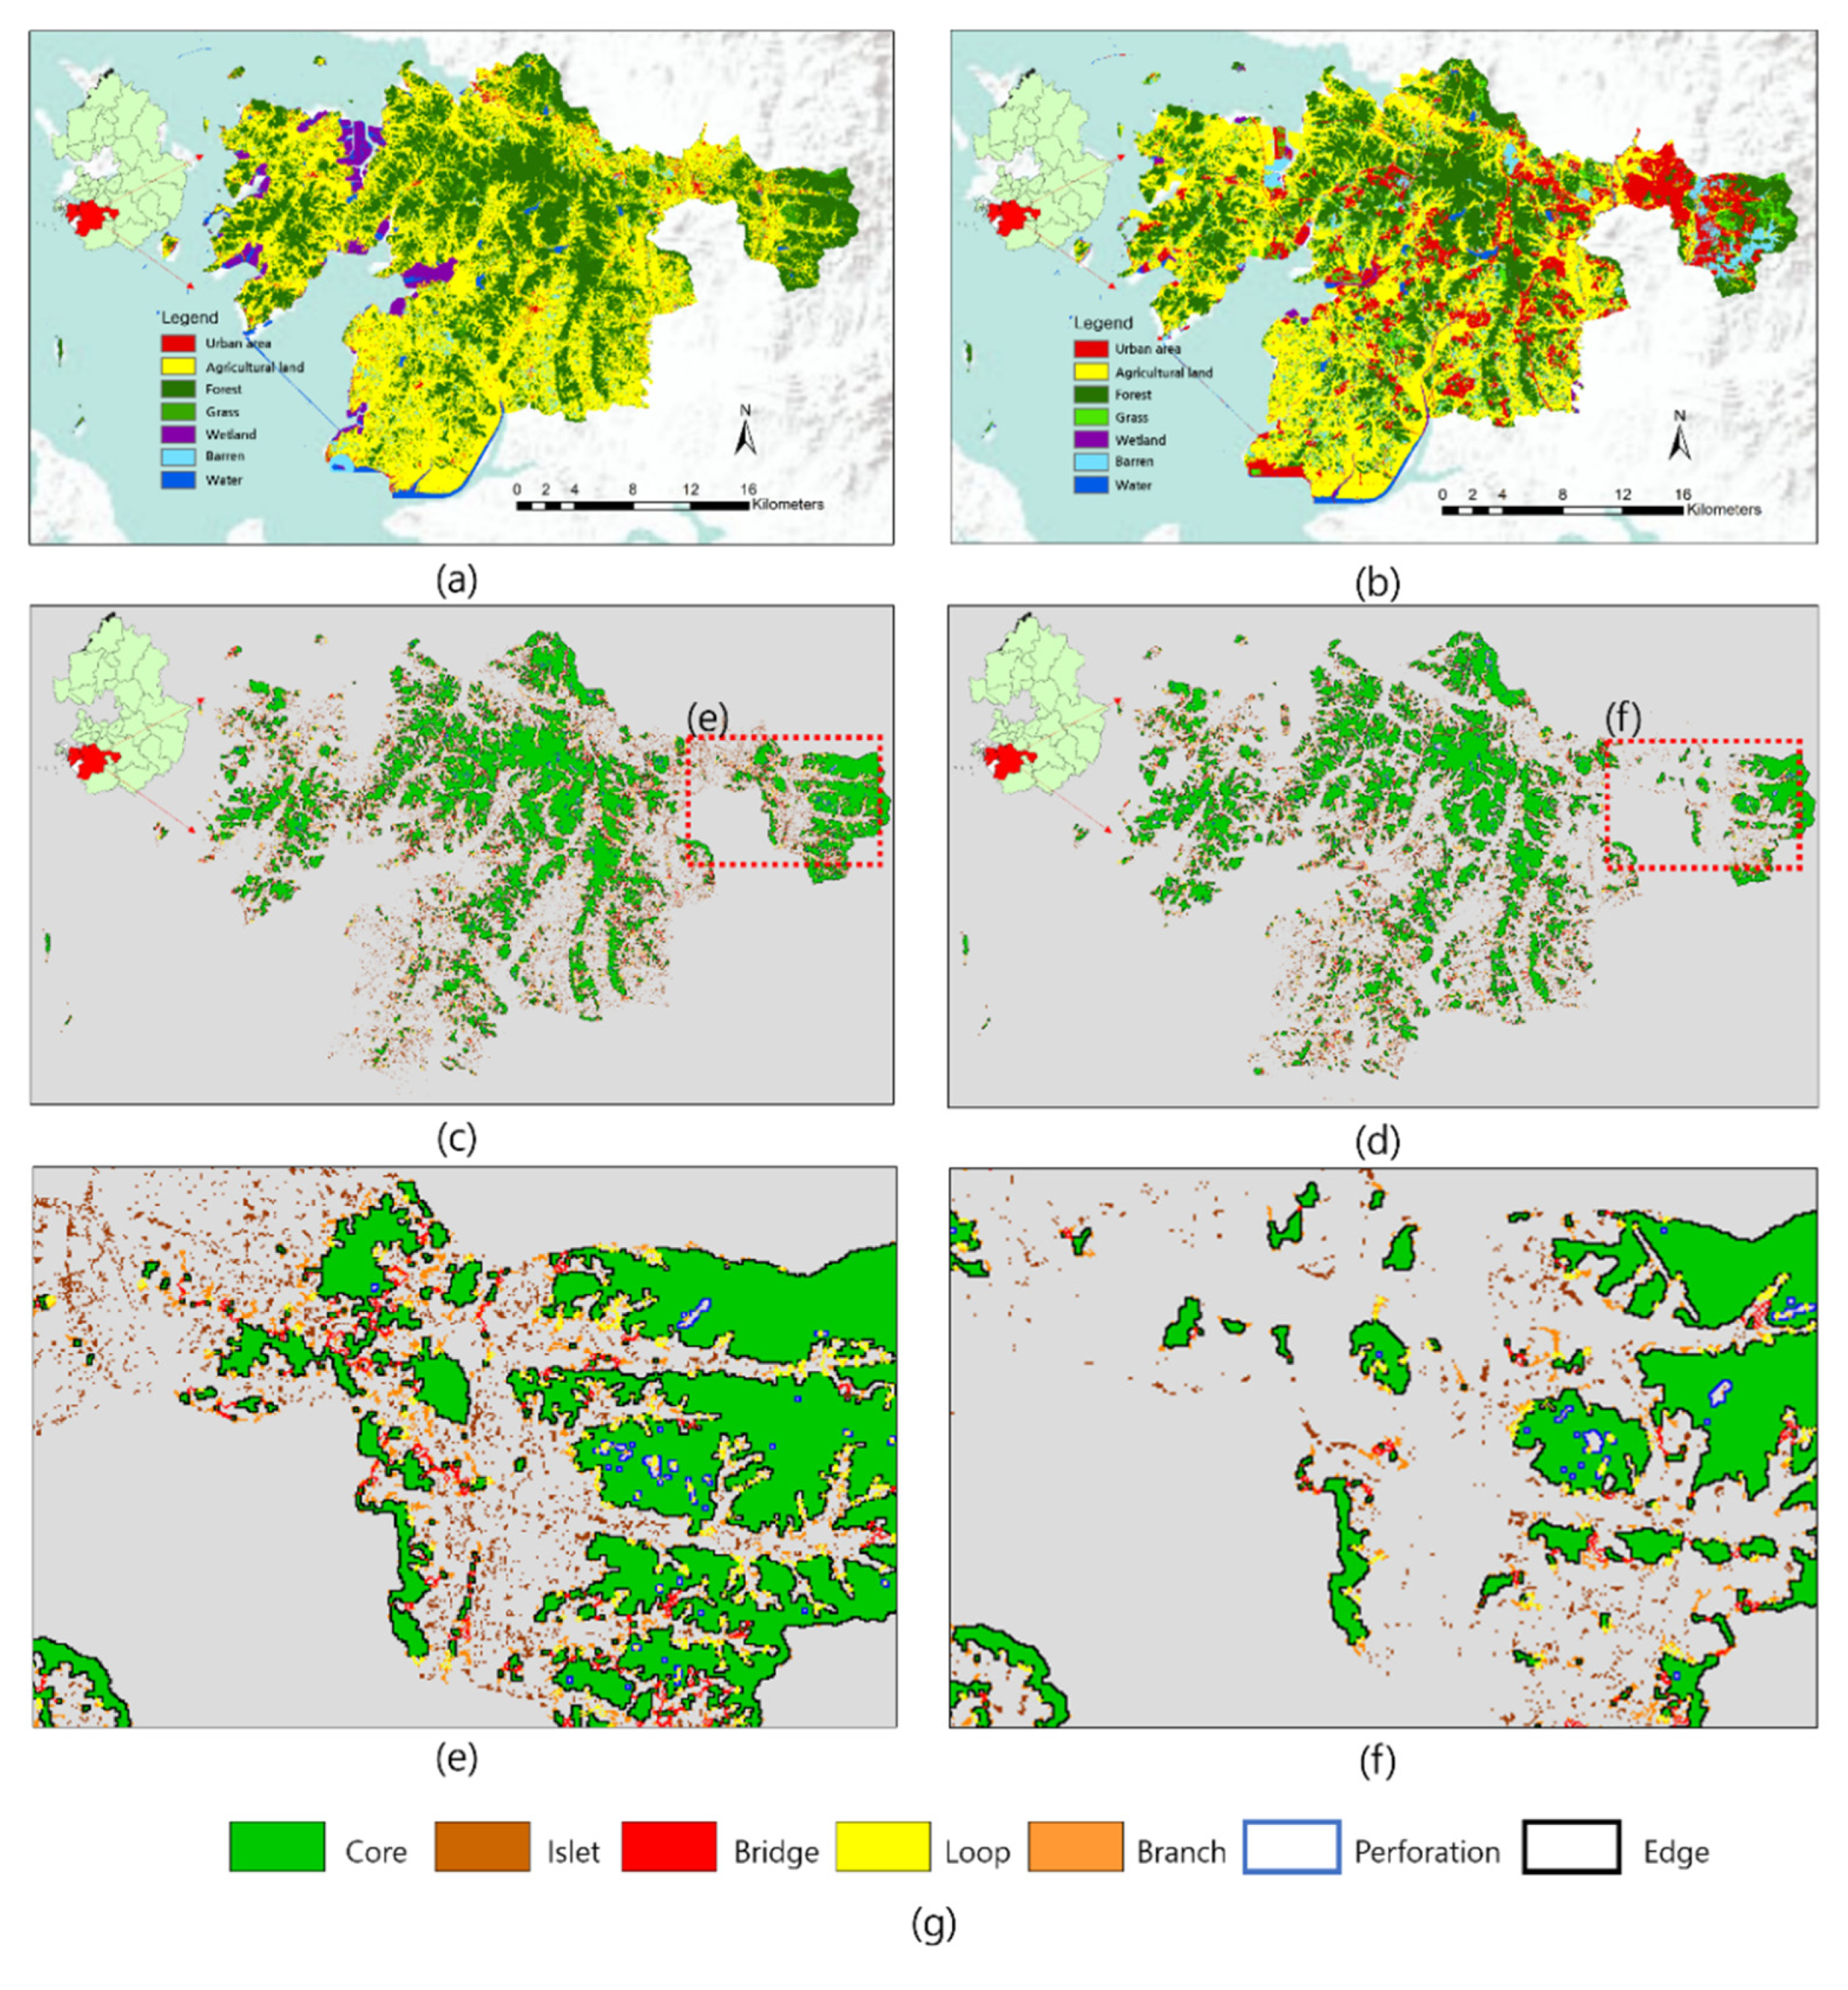
Figure 8), most spaces that were farmland in the past were converted into urban areas due to such geographic characteristics. As a result, forest, grassland and wetland with high ecological values greatly decreased in size. Accordingly, for large cities such as Suwon, Icheon, Gimpo and Siheung, which showed environmental changes similar to those of Goyang, it is particularly important to preferentially search for a plan to effectively preserve natural spaces with high values in advance when establishing development plans.
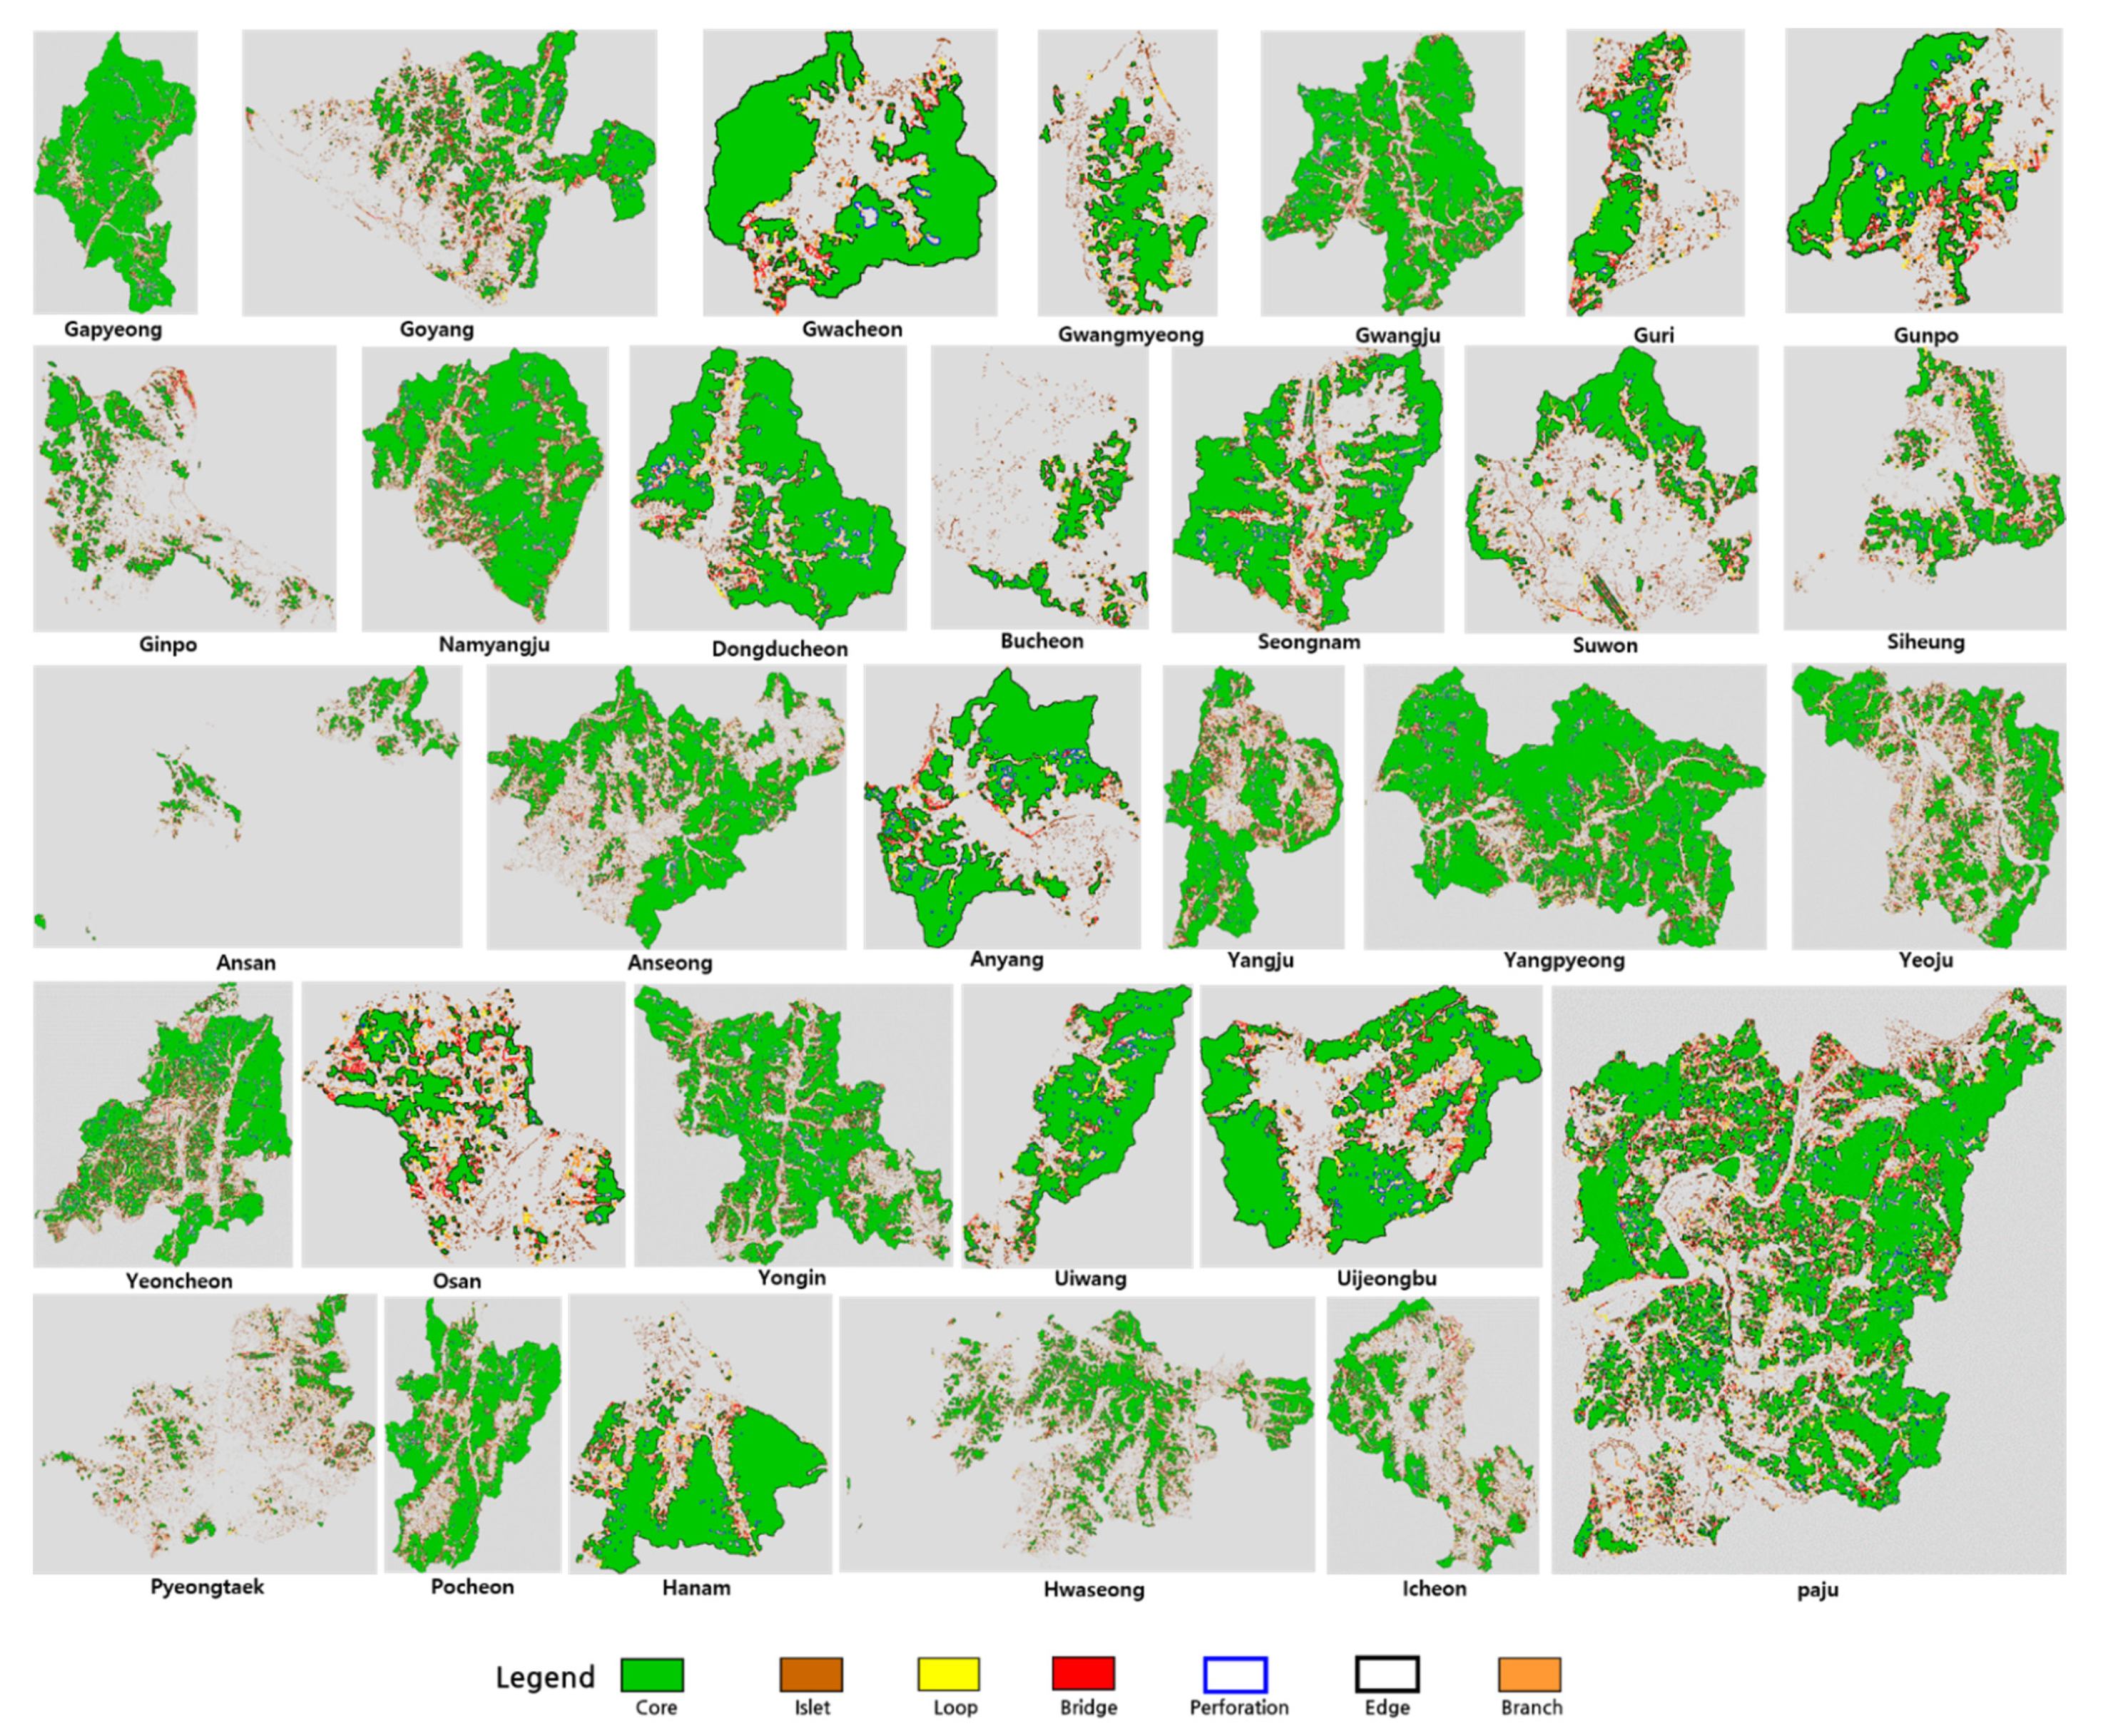
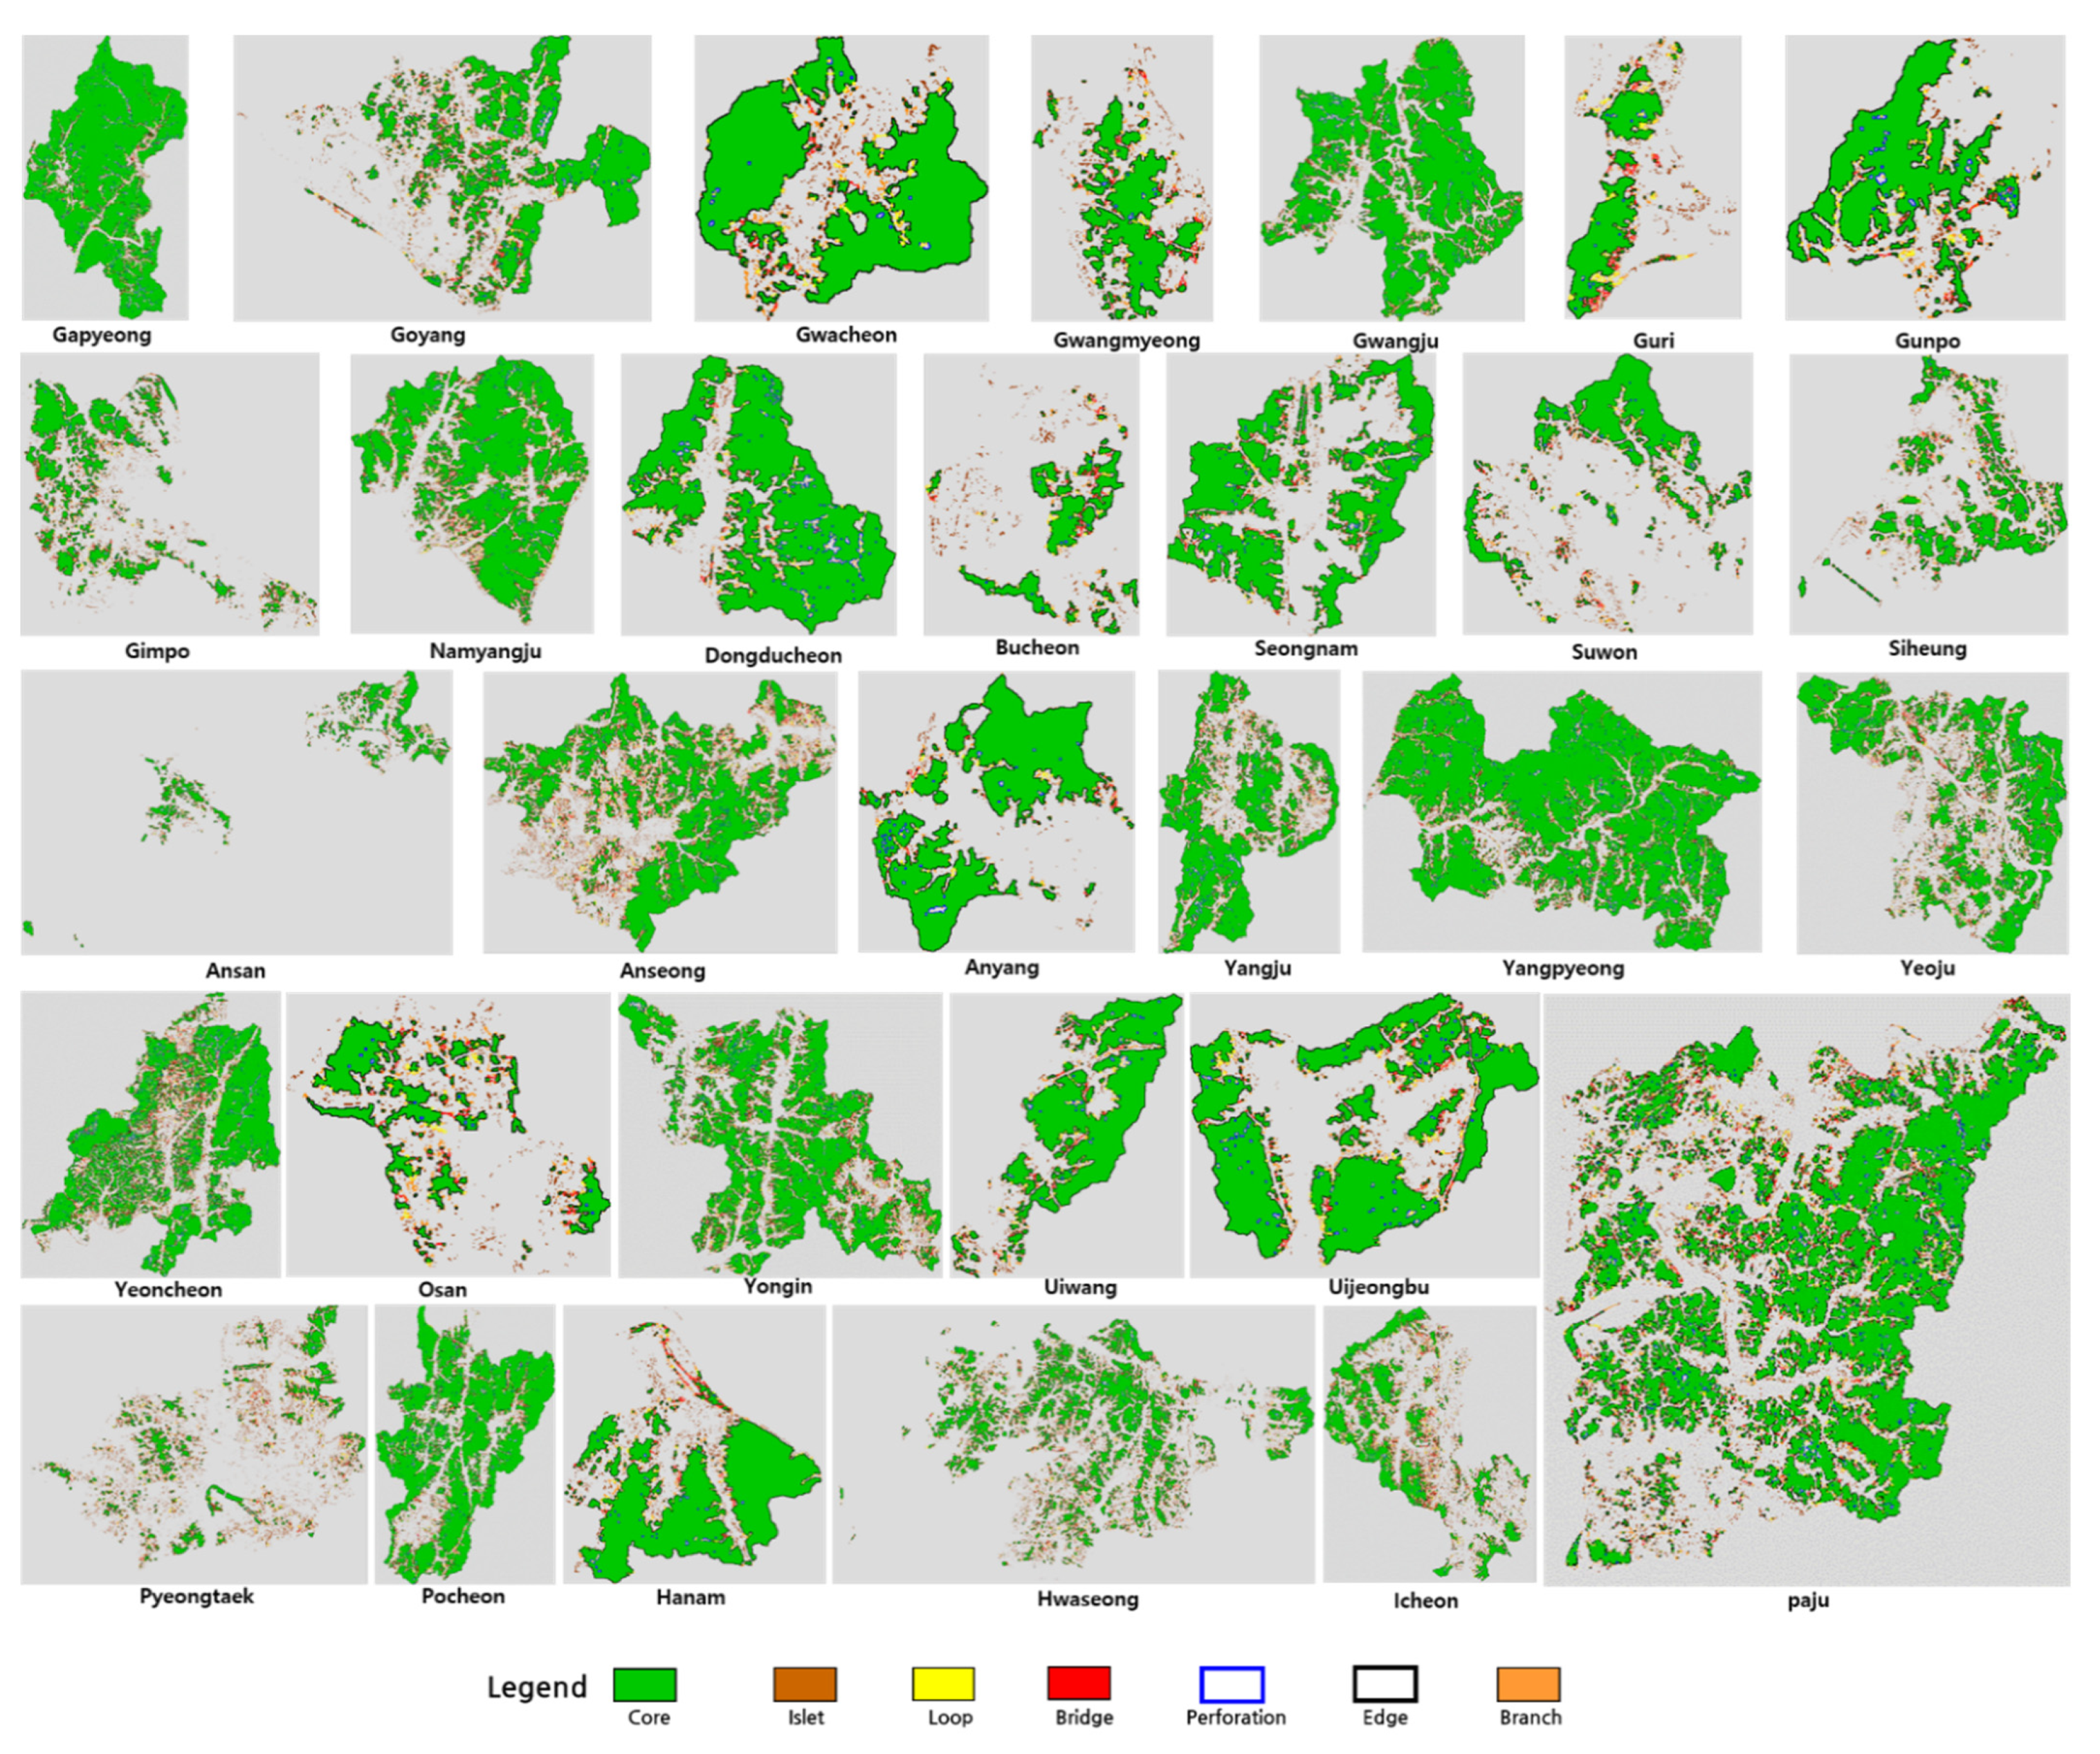
Next, when we look into the results after analyzing changes in MSPA category in each of the 31 cities, 103 Cores and 733 Islets were found to have decreased, on average, in these 31 cities. A total of 115 Perforations, 521 Edges, 83 Loops, 144 Bridges and 567 Branches decreased on average. As can be seen from such an analysis result, Cores that are key green lands and Islets that are stepping-stone green lands have ceased to exist in most cities due to the urbanization that has progressed for several decades, meaning that the green network function is greatly deteriorated at a whole city level. Accordingly, an environmental plan should be established with a focus on quantitatively/qualitatively securing green lands by creating additional green lands of diverse sizes and forms to recover the function of green networks.
To look into the characteristics of each of these six clusters in more detail, the average value of the factor of each cluster was calculated based on the characteristics examined (
Table 5). In particular, as factors with a positive value and a negative value appeared in a mixture in Factor-2, among the four factors, the Agricultural Lands and Islets with decreased sizes and numbers were classified as Detailed Factor 2-1, and Urban Areas and Barrens with increased sizes were classified as Detailed Factor 2-2.
First, Cluster-1 was found to be the cluster for which the score for Factor-1 was higher than that of any other cluster. That is, it is a cluster without a big environmental change. In reality, Cores, Branches, and Bridges were found to have decreased less in relevant cities than in cities of other clusters, although urbanization progressed. It was worth noting that the extinction of green lands was not high in Bucheon, Hanam, Guri, or Gwacheon, although these cities were very close to Seoul, the capital. Such a result is attributable to the restriction on development enforced by designating forests of relevant cities as Greenbelts to prevent the thoughtless expansion of Seoul. However, as Greenbelts are released gradually due to continuous development pressure, the emphasis should be put on maintaining the function of green networks by minimizing the extinction of small-scale green lands of diverse forms such as Branches, Bridges, Islets, etc., when development plans are established.
Cluster-2 was a cluster made up of five cities, including Suwon, Gimpo and Goyang, that were classified as relatively large cities. It showed the highest value for Factor-3 among the four Factors, meaning that its decrease in forest area was not high compared to the other clusters. However, it showed negative values for Factor-4 and Factor-2-1. Its spaces with high values such as wetland, stepping-stone green lands, etc., greatly decreased in number due to urbanization. In addition, as cities belonging to this cluster are still under high development pressure due to the continuous population increase and industrial development, emphasis should be put on the arrangement of a plan to preserve natural resources with high ecological values.
Cluster-3 was made up of Gwangju, Namyangju, Yangpyeong and Yongin. It was a cluster that showed a negative score for Factor-3. This cluster had a higher score for Factor -3 than the other clusters. Thus, it was a cluster with a large decrease in forest area. Further, as it had a big negative value for Factor-1, it was characterized by a big decrease in the number of linear connection green lands such as Branches, Bridges, etc. Accordingly, cities in the relevant cluster should put an emphasis on the minimization of additional damage to and the fragmentation of forests, while preserving small linear green lands at the same time.
Cluster-4 was a cluster made up of Yeoju, Paju, Yangju, Pocheon and Yeoncheon. It showed a higher negative value for Factor-1 than the other clusters. It was characterized by a big decrease in the actual number of large-scale green lands and linear green lands of diverse forms. As such a decrease in the number of green lands will lead to a decrease in the function of urban green networks, it is desirable to prioritize the creation of additional green lands to enhance green land connectivity when environmental plans are established.
Cluster-5 was an independent cluster formed by Pyeongtaek alone. It showed the highest positive value for Factor-4 among the four Factors. In fact, Pyeongtaek was the city with the largest increase in wetland areas. Accordingly, environmental plans should be established with an emphasis on the effective preservation of wetland and swamps that play an important role as habitats for biospecies.
Lastly, Cluster-6 was an independent cluster formed by Hwaseong alone, a city with the highest negative value for Factor-4. That is, this city had the biggest decrease in wetland areas. In addition, Cluster-6 showed larger changes for Factor 2-1 and 2-2 than the other clusters. As a whole, Cluster-6 showed a large environmental change due to urbanization. Accordingly, quantitative expansion of green spaces through the creation of additional green lands, and the establishment of a systematic preservation and management plan for wetland and swamps, should be preferentially considered for Hwaseong in order for it to function as an environmentally sustainable city.
From a small specific unit space to a large-scale city and even regional and territorial space, it is predicted that future land space will be more directly affected by numerous developments. Therefore, how will the various impacts caused by development change the future land space? By what means and methods will we be able to control the influencing factors and change processes in a natural environment and landscape-friendly way? In this respect, the results of this study are different from other related studies in that they involve clustered cities at the regional level and are based on the results of time-series environmental changes. The results thus present directions for establishing environmental policies for each cluster.
First, among studies examining environmental changes using landcover change [
45,
46,
47,
48], Kumar et al. [
49] used land cover types in 1976, 1989, 2000 and 2014 for Usri watershed. They looked at the changes in the landscape matrix, and based on these analysis results, clustered land cover types showing similar values for each year. However, a limitations is that the scope of the space was limited to a specific watershed and that the analysis result could not be visually confirmed.
In addition, in the case of Korea, the consideration of the physical environment and the human psychological behavior aspect rather than the natural environment factor is considered more important in figuring out the value of the city. Lee’s [
50] research emphasizes the need for qualitative growth such as the quality of life rather than quantitative growth focusing on economic aspects. For this purpose, the 31 cities in Gyeonggi-do were grouped based on the Physical Environment Satisfaction and Neighborhood Satisfaction indices. Of the total of 14 indicators used for grouping, it was found that one of the indicators related to the natural environment was satisfaction with the park.
As evidenced by numerous studies, urban land use and environmental changes are inevitable phenomena in the process of urban development. Therefore, the Fragstats program, using the land cover map, has been used importantly in diagnosing environmental changes due to urbanization, but the fact that the analysis results cannot be looked at in drawings is a big limitation. In this aspect, the MSPA analysis used in this study is different in that the analysis results are presented in drawings. In addition, the results of this study are environmentally friendly in that they suggest a direction for establishing differentiated environmental policies for each city, such as the quantitative expansion of green areas, conservation of small-scale linear green areas, wetland conservation, and minimization of forest fragmentation in connection with land cover change. However, since a city is a space where humans and nature coexist, it is judged that it is desirable to comprehensively consider factors such as the physical environment and human psychological behavior, not just the natural environment aspect.
However, in order to increase the effectiveness of the study, it is necessary to additionally consider the following aspects in future studies. First, environmental changes in cities need to be determined using more detailed basic data. In Korea, a City Biotope Map was recently prepared with a high spatial resolution of a 5 m level on a national scale pursuant to Article 34-2 (Preparation/Utilization of City Biotope Map) of the Natural Environment Conservation Act. Accordingly, it is required to determine environmental changes by actively utilizing a more detailed basic map such as a City Biotope Map and to establish environmental plans based on it. Moreover, the present study had another limitation: the cities were clustered based on results of changes in land coverage and spatial structures of green lands. Accordingly, it is desirable to determine environmental changes in cities comprehensively by taking into account the values of diverse aspects such as soil, air, surface temperature and water quality and supply, as well as endangered species, etc., to find the appropriate direction to take when coping with such environmental changes based on the results of such determinations.
4.2. Policy Proposal
Although spatial plans for national land are established in Korea for each of the diverse spatial scales, such as Comprehensive National Territorial Plans, Metropolitan City Plans, Si/Gun Master Plans, etc., when we take into account the fact that concrete and detailed physical plans established under the premise of implementation are realized at a city level, we can see that establishing differentiated environmental plans for sustainable land use management based on time-sequential environmental changes at a city space level is very important.
However, most environmental policies established for many cities that belong to the same area (Gyeonggi-do, Gyeongsangbuk-do, etc.) put emphasis on the quantitative expansion of green lands. Accordingly, it is important to grasp time-sequential environmental changes and secure environmental drawings that can be connected to development plan drawings at the same time to establish differentiated environmental policies. In Korea, although a Biotope Map is built and renewed at five-year intervals based on Article 34-2 (Preparation/Utilization of Biotope Map) of the Natural Environment Conservation Act, there is no mandatory provision that forces its utilization when establishing development plans. Accordingly, the law/system is required to be reinforced to obtain basic data so that a Biotope Map or Ecosystem Service Map is mandatorily taken into account when establishing development plans.
Moreover, when we look into the budget of each ministry of the Korean government as of 2020, the budget of the Ministry of Environment was much smaller than that of the other ministries. It was about KRW 9 trillion, while that of the Ministry of Land, Infrastructure, and Transport was about KRW 50 trillion, that of the Ministry of National Defense was about KRW 50 trillion, and that of the Ministry of Employment and Labor was about KRW 30 trillion. Accordingly, to build diverse basic data and diagnose environmental changes in cities, the expansion of the budget is required. Each city is also required to use more of their budget for the preservation and management of the environment.
In addition, for sustainable urban development, the connection between disciplines that are being pursued in different perspectives, laws, and administrative organizations will be of utmost importance. For example, the natural environment conservation plan is mainly researched in the field of biology, the park and green space plan in the landscape field, and the artificial landscape plan in the field of architecture and civil engineering. However, as mentioned earlier, transdisciplinary cooperation to diagnose and solve environmental problems by integrating and synthesizing problems themselves for environmentally sustainable city development is more important than dealing with each environmental problem as a separate entity [
51,
52].


