Article

Spatio-Temporal Evolution Characteristics and Influencing Factors of Urban Service-Industry Land in China

1
School of Architecture, Southeast University, Nanjing 210096, China
2
College of Urban and Environmental Science, Northwest University, Xi’an 710127, China
3
School of Design and Architecture, Zhejiang University of Technology, Hangzhou 310023, China
4
School of Economics & Management, Southeast University, Nanjing 210096, China
*
Author to whom correspondence should be addressed.
Land 2022, 11(1), 13; https://doi.org/10.3390/land11010013
Submission received: 15 November 2021 / Revised: 19 December 2021 / Accepted: 20 December 2021 / Published: 22 December 2021
(This article belongs to the Special Issue New Approaches to Land Use/Land Cover Change Modeling)

Abstract

:
The level of service-industry development has become an important symbol of the competitiveness and influence of cities. The study of the dynamic evolution characteristics and patterns of urban service-industry land use, the driving factors and their interactions is helpful to provide a basis for decision making in policy design and land use planning for the development of service economies. In this study we have conducted an empirical study of China, based on the methods of spatial cold- and hot-spot analysis, Tapio’s decoupling model, and GeoDetector. We found that: (1) the scales of land use, output efficiencies and development intensities of service-industries are increasing with a trend that takes the form of a “J”, “U” and “inverted U”, respectively; (2) Spatial variabilities and agglomerations are significant, with a stable spatial pattern of the scale of service-industry land use, and a gradient in the distribution of cold- and hot-spots. The dominant spatial units of output efficiency and development intensity have changed from low and lower to high and higher, and the cold- and hot-spots gather in clusters; (3) The development of service-industries is highly dependent on the input of land-resources, and only a few provinces are in a state of strong decoupling, while most are in a state of weak decoupling, with quite a few still in a state of expansive coupling, expansive negative decoupling, or even strong negative decoupling; (4) There are many driving factors for land use changes in the service-industry, with increasingly complicated and diversified relationships between each other, ranked in intensity as the scale effect > informatization > globalization > industrialization > urbanization.

1. Introduction

The history of world economic development shows that the transformation from an agricultural economy, to an industrial economy, to a service economy is the general trend of economic development. After World War II, the United States became the first service economy, followed by the major developed countries in the 1960s, which completed the transition from industrial to service economies, and by developing countries in the 1990s to begin their transition [1,2]. According to the WDI (World Development Indicators) database of the World Bank, the service-industry accounts for more than 65% of GDP in developed countries such as the United States, Britain, France, Singapore, the Netherlands, Japan, Spain, Canada, Italy, Australia and New Zealand, and the service-industry also accounts for more than 50% of GDP in developing countries such as Brazil, the Philippines, South Africa, Mexico, Thailand, Iran, Russia, Turkey, China and Egypt [3]. Along with the new round of revolution in information technology, the service-industry has become an important force for global industrial change, and global economic development has shown a new trend of transformation from “industrial economies” to “service economies” [4,5]. The service-industry has in general become an important source of promoting national economic growth and social development, and is gradually replacing industry as the prime-mover driving national and regional economic development. The rapid development of the service-industry has attracted widespread attention from the government and scholars [6].
Since the reform and opening-up, China has made a qualitative leap in economic development and is now a major service economy, typical of the world [7]. The World Bank’s WDIs (World Development Indicators) show that China’s GDP reached $14.72 trillion in 2020, accounting for more than 17% of the world’s share, and its economic growth contributed more than 30% to global economic growth, making it the main engine driving the world’s economic development. According to the Research Report on the Development of China’s Service Trade Industry in 2020 and the China Statistical Yearbook 2021, in 2020, the added value of China’s service-industry accounted for 54.5% of GDP, its contribution to economic growth was close to 60%, and the export added value it created was also higher than that created by the manufacturing industry, indicating that China has entered a new era dominated by the service economy. Compared with that of the developed countries, China’s service-industry accounts for a significantly lower percentage of economic development, and there is still more room for improvement [8]. With the development of economic globalization, especially service-trade, China’s service-industry is bound to usher in rapid growth, promote China’s economic transformation and industrial upgrading, and play an increasingly important role in the global economic system, especially in the development of the service-industry and service-trade [9].
Land-resources are the spatial carrier of all human activities, and the adjustment of industrial structure will be directly or indirectly reflected in the land use structure and conditions. The land supply policies for different industrial uses also directly affect the direction of urban and regional economic development [10]. The large-scale investment in land-resources has provided great support for China’s economic growth, but the high consumption has also constrained high-quality economic development [11]. The service-industry is highly concentrated in cities, and its development is not only a major symbol of the progress of urban civilization, but also a representation of the influence and control of large cities, especially the international cities. Service-land is an important part of land for urban construction, with the construction of commercial facilities and the laying out of service functions (especially as urban and regional economies become service-oriented), it plays an increasingly important role in urban transformation and development. Therefore, it is of great theoretical significance and practical value to study the dynamic change characteristics and patterns of service-industry land, as well as the driving factors and their coupled relationships, and the tools for service-industry development management and land use control, for promoting the sustainable economic and social development of cities and regions, and even the country [12,13].
The study of service-industry development has now become an important research topic in economics, geography and planning. Despite the abundance of relevant research results, there are still few academic studies on the scale, structure, benefits and influencing mechanism of service-land use [14,15]. This paper analyzes the scale, benefits and driving forces of service-land use in China from 2012 to 2020 in detail, based on the methods of the decoupling model and GeoDetector, trying to find out the spatio-temporal evolution law and development trend of service-land use in the country. This paper focuses on the following questions: What are the characteristics of land-use scale and benefit changes in China’s service-industry? Does the development of the service-industry depend on the massive investment and extensive use of land-resources? What are the primary driving factors for the spatio-temporal evolution of the scale of service-land use? The study of the above issues will help to reveal the characteristics and mechanisms of service-industry land use changes in different times and regions, and thus provide references for service-industry land supply and optimal policy design.

2. Literature Review

2.1. Abundance of Relevant Research Results, but Lack of Specialized Papers

The existing results are mainly focused on the study of spatial agglomeration, and the layout and pattern of the service-industry. For example, Cao [16] made a case study of the Yangtze River Delta from 2002 to 2016 and concluded that the port and shipping service-industry is distributed with a trend of coastal and riverine agglomeration with obvious regional differences in industrial structure. Wang [17] studied the location dynamics of knowledge-intensive service-industries in the Pearl River Delta from 2004 to 2008 and concluded that service-industries are characterized by significant spatial agglomeration and proximity, knowledge-intensive business services firms tend to locate proximally to multinational enterprises and already established knowledge-intensive business services. De Dominicis [18] conducted exploratory spatial data analysis to identify patterns in the geographic distribution of service firms in Italy, noting that service activities demonstrate significant spatial agglomeration and dependence. Liu [19] argued that the service-industry is at a high degree of agglomeration, but that the efficiency loss is grave, based on an empirical study of 11 cities in Hebei province for the period of 2008–2017, and that with the passage of time, the self-influence of efficiency decreases and the influence of service sector agglomeration on efficiency increases. Fu [20] concluded that Nanjing’s financial service-industry is obviously agglomerative, and that factors such as market demand, the agglomeration effect, location conditions, transportation facilities and population size have a large impact on the evolution of spatial patterns.
However, the specialized research on the evolution of land use in the service-industry and its driving factors is neglected in the existing papers. The current specialized research on service-land focuses on the characteristics and driving mechanisms of spatial and temporal changes in commercial-land prices, the demand and drivers of commercial-land usage, and factors influencing commercial-land development and leasing. For example, Sun [21] and Cheng [22] analyzed the factors influencing commercial-land development and leasing in Beijing, and Murakami [23] conducted a spatial analysis of commercial-land tenure in a large polycentric city. Nichols [24] analyzed the fluctuation of commercial-land prices in the United States, and Garang [25] analyzed the spatio-temporal evolution mechanism of commercial-land prices in Hangzhou by multiple regression, concluding that the prices of different types of commercial-land exhibited different spatio-temporal changes from 2006 to 2015, and were influenced by a combination of factors including residential land price level, maturity of living services, and plot ratio in the district. Ustaoglu [26] and Silva [27] analyzed the driving factors of service-land demand changes and developed a quantitative model of commercial-land demand by regression analysis. Zhou [28] and Chen [29] analyzed the participants and networks, manifestations, governance modes, and driving mechanisms of the marketization of rural collective commercial-land in China.

2.2. Research on Influencing Factors Is on the Increase, but Lacks Systematicness and Comprehensiveness

The first category deals with the analysis of service-land uses and the impact of its change on the community environment, adjacent sites, and economic and social development. For example, Sohn and Browning [30,31] analyzed the connection between commercial-land use and neighborhood safety, and concluded that grocery stores, restaurants, and offices play a positive role in improving neighborhood safety, and that the number of shopping centers, commercial density, and residential concentration are positively correlated with crimes such as burglary and homicide. Also, the impact of the mixture of commercial-land use on residential burglary varies with the type of commercial facility, suggesting that not all commercial uses lead to an increase in crime. Izanloo [32] conducted a case study of Bojnourd and found that the level of commercial-land use is positively correlated with traffic flow and trip frequency, and affects the urban spatial accessibility. Yang [33] analyzed the positive and negative effects of commercial-land use on residential land use in Seoul and concluded that as the concentration of commercial-land grows, the increase in the value of residential land rises first and then falls. Langer [34] conducted a case study of Bavaria and concluded that an increase in the area of commercial-land in built-up areas can significantly boost urban tax revenues, but that the tax effect varies significantly between cities. Zhang [35] conducted an analysis using a double difference method and concluded that the impact of marketization of rural collective commercial-land in China on the distribution of government benefits is not significant due to the low efficiency of land transfer, the shift of land transaction costs, and deviations in policy implementation. De Fuentes [36] analyzed the determinants of service-industry innovation and productivity in Mexico. Tang [37] argued that the agglomeration of the modern service-industry improves tourism efficiency, but that there are great differences among regions.
The second category deals with the impact of related factors on service-land, including the scale of supply, use patterns, and social and economic benefits. For example, Wen [38] and Kim [39] analyzed the impact of urban-rail transit on commercial-land values and concluded that the number of nodes, and the average clustering coefficient, are significantly positively correlated with land prices, while there is a significant negative correlation between the average path length and land prices. Wang [40], Shao [41], and Tian [42] et al. conducted a case study on Jiangsu Province, the Yangtze River Delta, and the regions along the Wuhan–Guangzhou HSR line, respectively, and concluded that the impact of HSR on the change of service-land varies widely in different cities, and that both the construction of HSR nodes, and the increase of train-service frequency does not necessarily promote the development of an urban service-economy. Based on the Chinese urban-panel data, taken over many years, Tian [43] and Yang [44] found that the impact of HSR on urban-service-agglomeration is closely related to the location of the node in the HSR network, by complex network analysis, panel regression, the propensity score matching method, and the spatial difference-in-difference method. Sheng [45] evaluated the commercial value of the grey space under overpasses in Wuhan. Wang [46] analyzed the impact of railroads, inland waterways, and highways on service sector employment based on the panel data for the 31 Chinese provinces from 2003 to 2017, and concluded that every 1% increase in the level of transportation infrastructure increases the service sector employment density in the region by 0.13%.
In conclusion, the research on service-land has attracted the attention of the government and scholars. Although the number of case studies and empirical studies are increasing, there are still big deficiencies in the current research. First of all, most papers integrate service-land use research into urban construction-land studies, while there are few that take service-land as an independent object to explore its dynamic changes and driving mechanisms. Secondly, as China is in the process of industrialization and urbanization transformation, land-resource protection and its economical and intensive utilization have become policy keynotes, leading to an increasingly prominent contradiction between service-land supply and the demand for urban economic development. However, research on the relationship between service-land benefit, land supply and service economy development has been neglected. Finally, the changing of service-land involves complex economic, social, and spatial interest games, but the fragmented existing studies and the lack of diversity in measurement indicators leads to a one-sided and limited reflection of the real level of development. There is no comprehensive study integrating multiple indicators.

3. Research Design

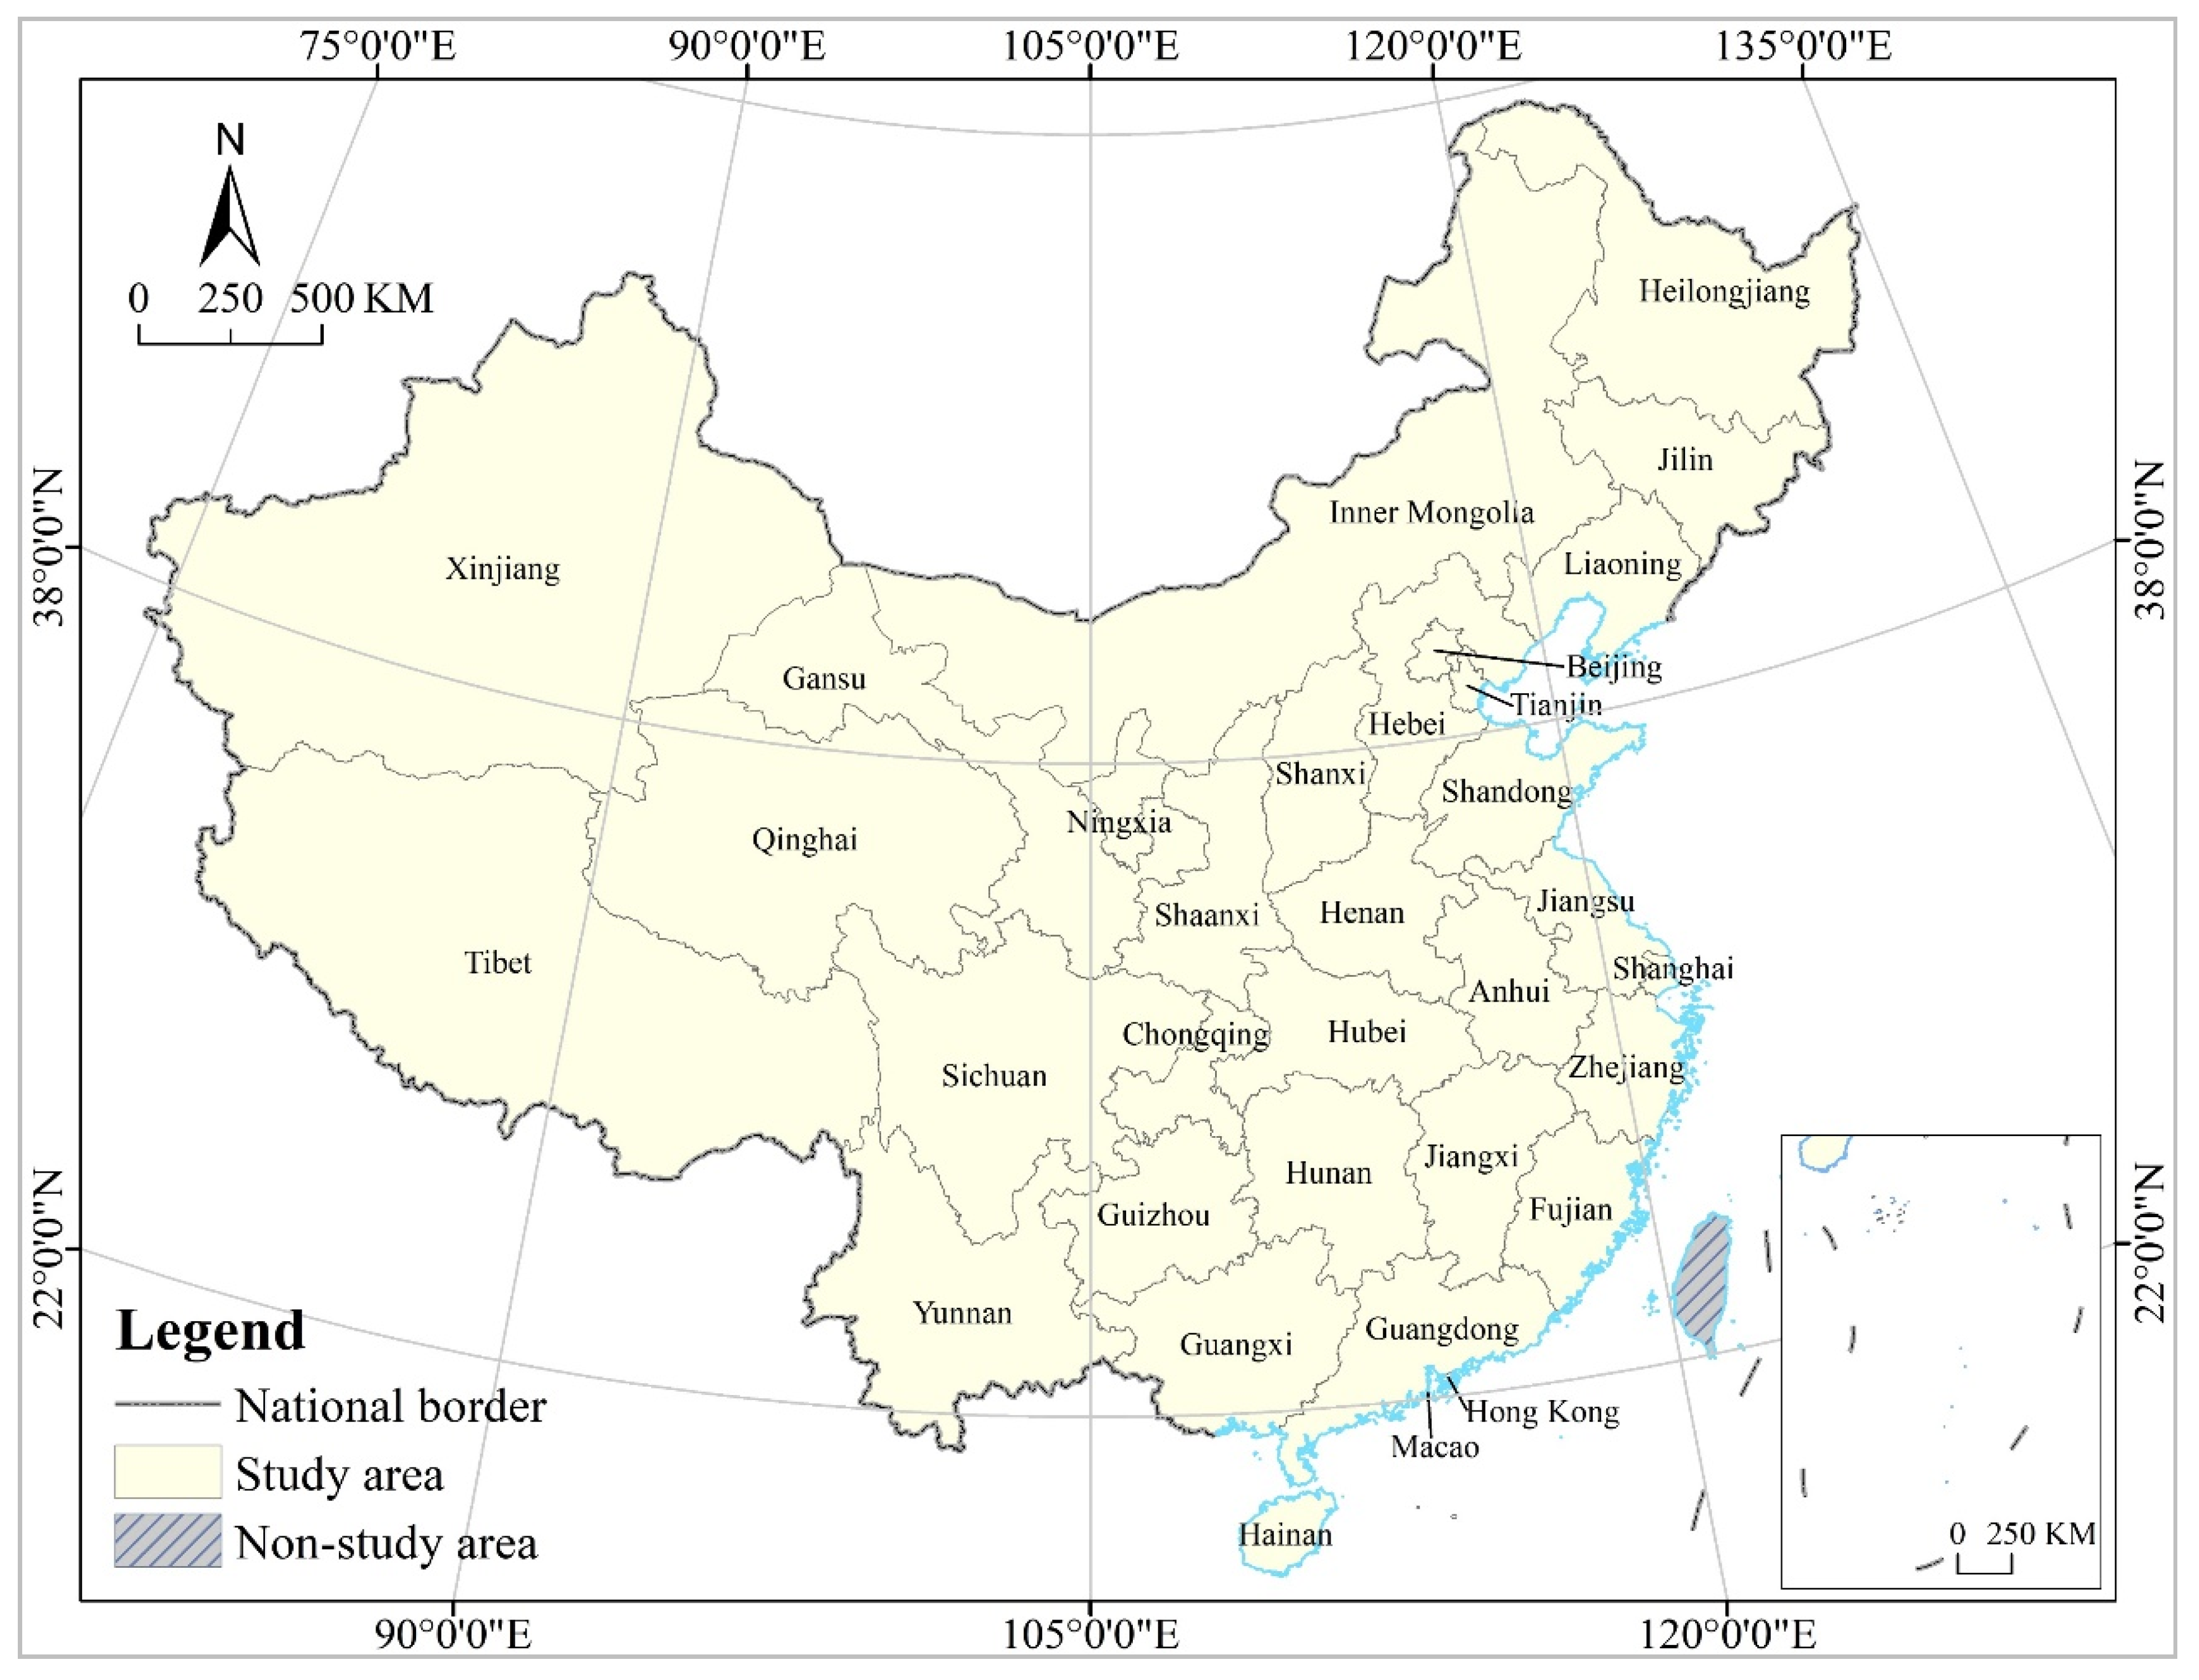
3.1. Study Area: China

The study area covers the 31 provinces, autonomous regions and municipalities in mainland China, excluding Hong Kong, Macao and Taiwan (Figure 1). To promote industrial upgrading and economic transformation, the central government has increased policy support and investment in the development of the service-industry. For example, the State Council issued Several Opinions on Accelerating the Development of Service Industry in 2007, followed by the establishment of a special leading group for service-industry development, and the successive promulgation and implementation of a series of targeted development policies, including Opinions on the Implementation of Several Policies and Measures for Accelerating the Development of Service Industry, Guidance on Accelerating the Development of Hi-Tech Service Industry, Notice on Printing and Distributing the 12th Five-Year Plan for the Development of Service Industry, Guidance on Accelerating the Development of Productive Service Industry to Promote the Adjustment and Upgrading of Industrial Structure, Guidance on Accelerating the Development of Living Service Industry to Promote the Upgrading of Consumption Structure, Outline of Innovative Development of Service Industry (2017–2025), Implementation Opinions on Promoting the Deep Integration of Advanced Manufacturing Industry and Modern Service Industry, Guidance on High Quality Development of Service Industry in the New Era, and Development Plan for Service Trade During the 14th Five-Year Plan Period. To optimize the development environment of the service-industry, the provinces have formulated local service-industry development plans, and special policies, based on their own current conditions and needs. With the support of central and local policies, China’s service-industry has seen rapid and sustained development and became China’s top industry in 2012 (Figure 2, Data from China Statistical Yearbook). With the growing scale of the service-industry, the role it is playing in economic and social development is growing, making China gradually move from a “big service country” to a “powerful service country”.
The scale of service-land in China is huge and varies significantly by province. According to the China Urban Construction Statistical Yearbook 2020, the total area of service-industry land in China is currently 4211.33 km2, accounting for 7.06% of the urban construction-land area. From the perspective of service-land scale, the average value in 2020 was 135.85 km2, with the maximum existing in Guangdong (399.36 km2), and the minimum in Qinghai (13.70 km2). From the perspective of the proportion of service-land area to urban construction-land area, Hainan has the largest value (11.44%), and Henan has the smallest (5.10%) (Figure 3). From the perspective of the average annual rate of change of service-land area, the average annual growth from 2012 to 2020 was 3.47%. We should note that the average annual growth of Tianjin, Hainan, Guizhou, Qinghai and Ningxia is high, especially for Hainan, which grew by more than 30%. But Heilongjiang, Shanghai and Yunnan have seen negative growth. From the perspective of the average annual change in amount of service-land area, the average annual increase in service-land area nationwide from 2012 to 2020 was more than 125 km2, with the largest increase seen in Shandong (14.08 km2) and the largest decrease in Heilongjiang (−5.57 km2) (Figure 4). In general, the scale and changes of land use for service-industries in China were large, and the changes and trends varied by province, which is quite typical and representative.

3.2. Research Methods

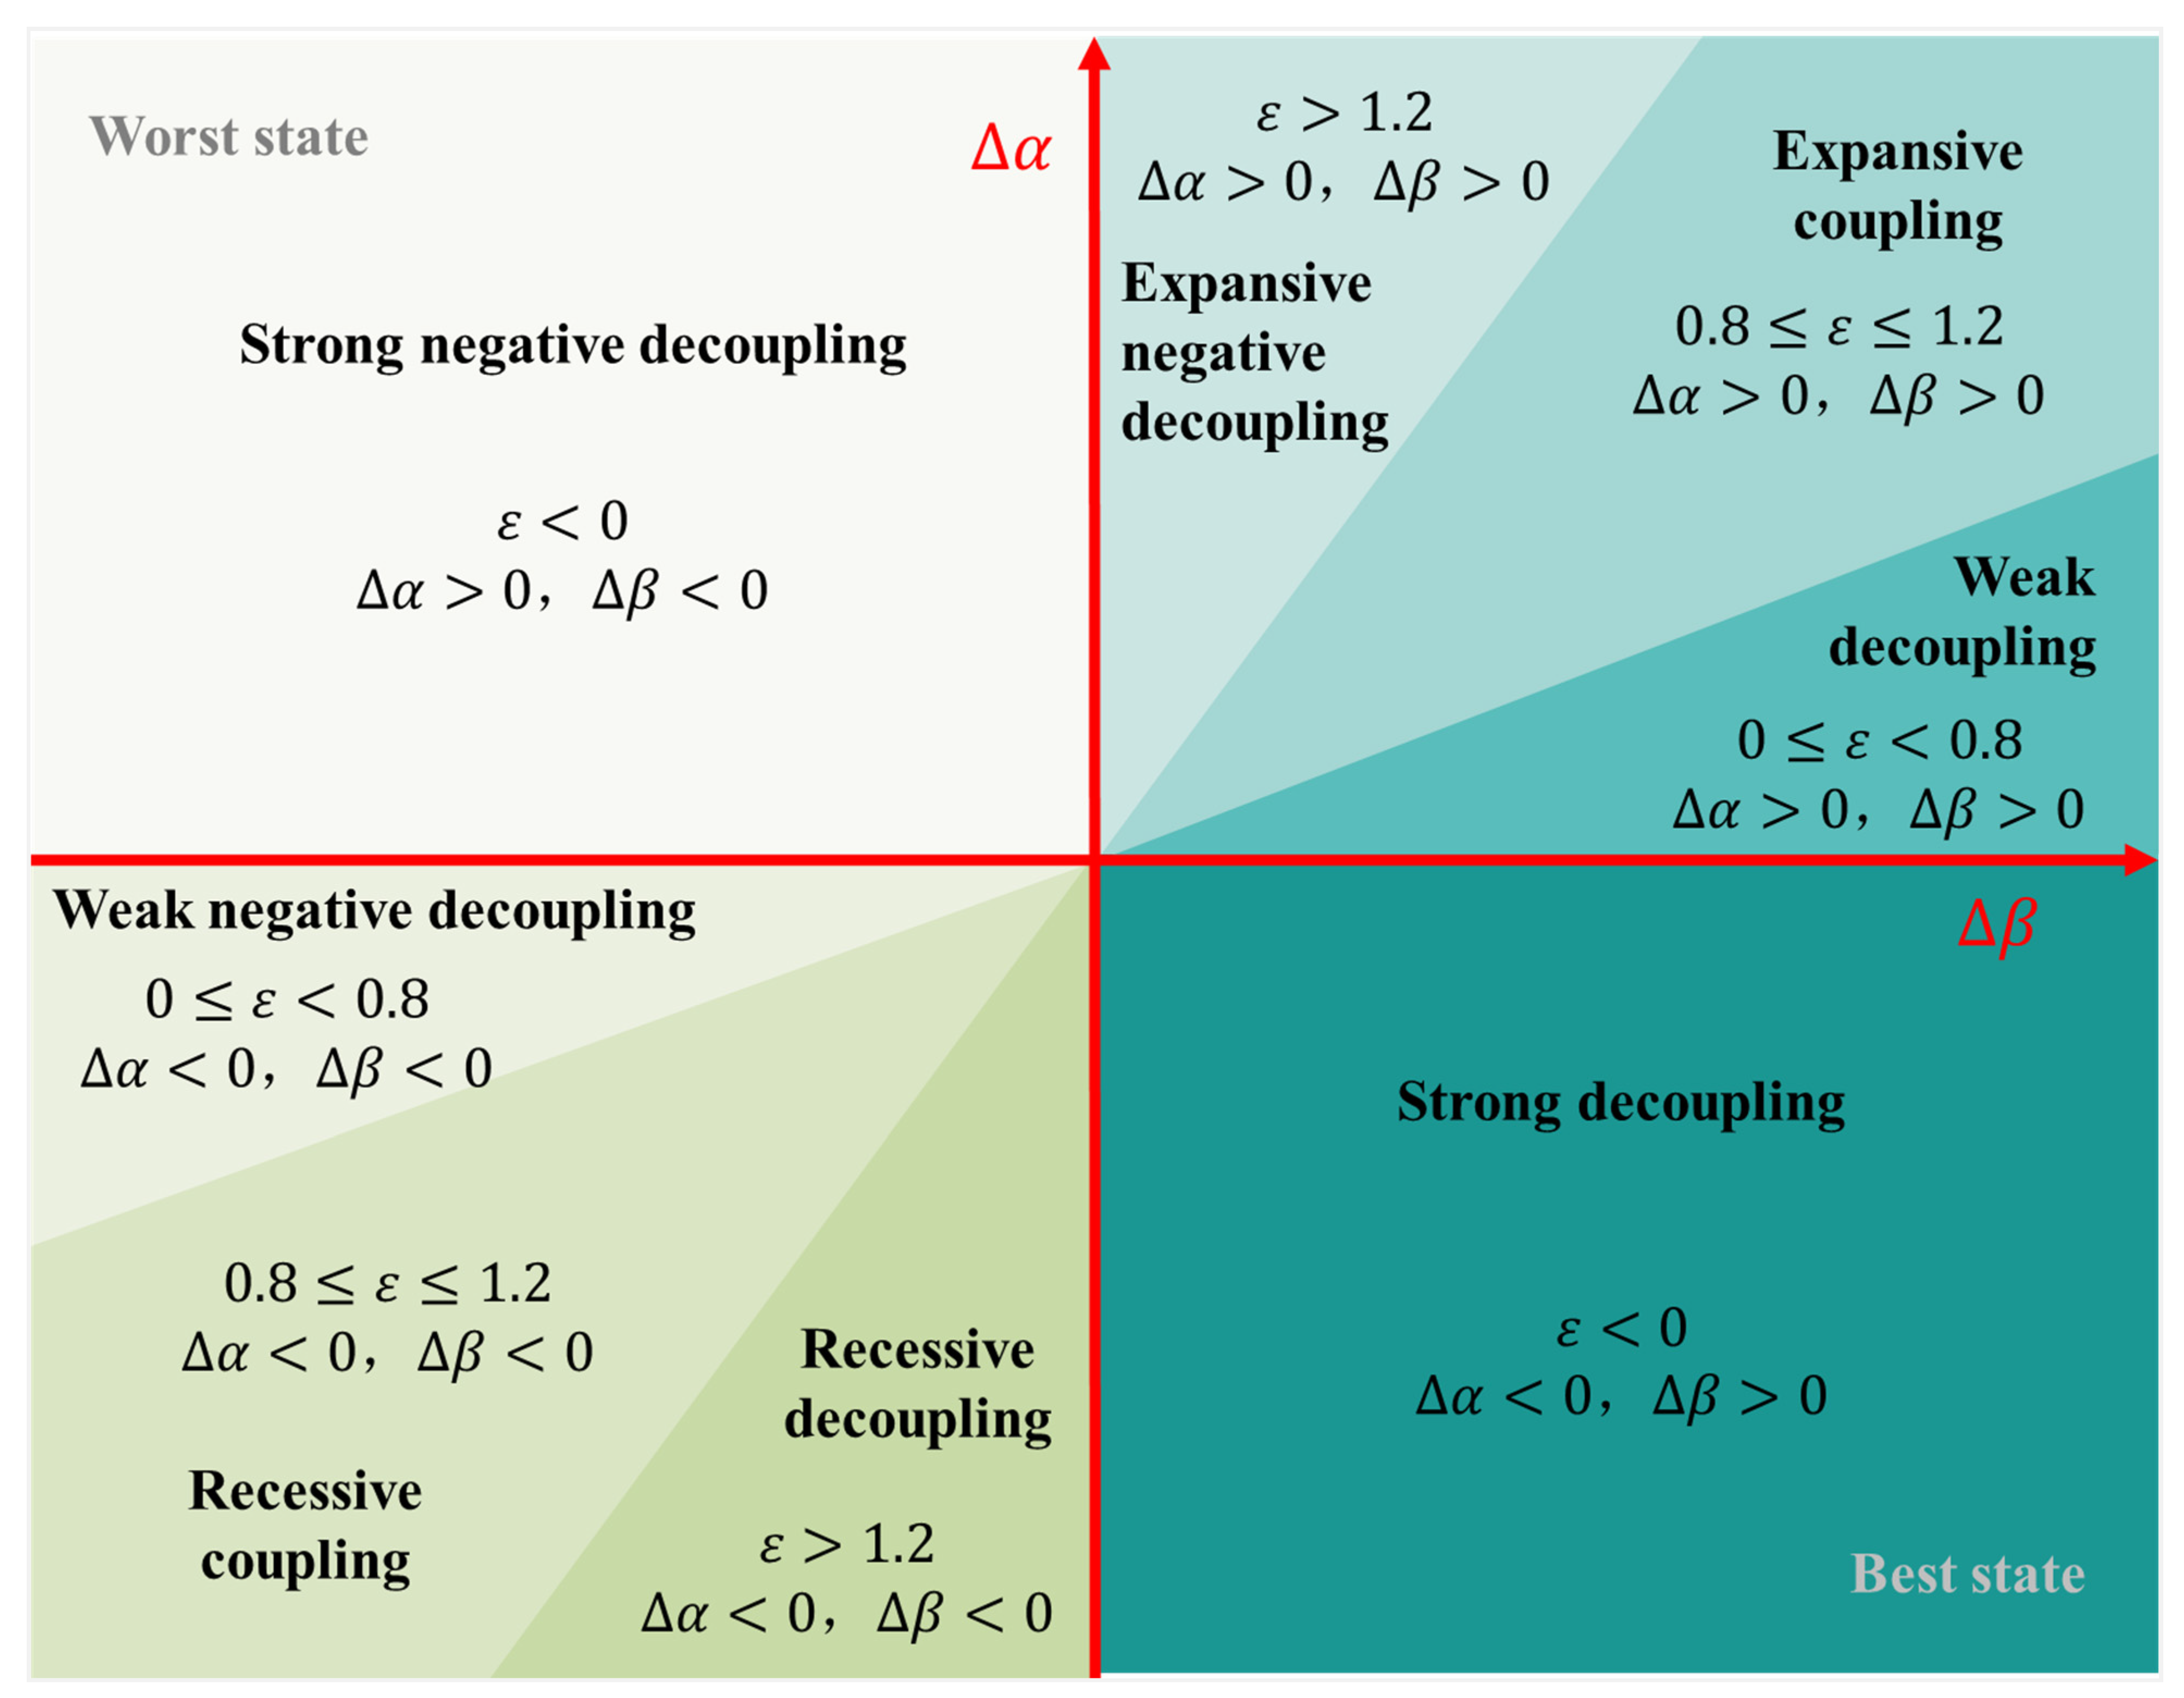
3.2.1. Decoupling Model

Decoupling originally refers to the reduction of the interrelationship between two or more physical quantities, and was introduced into economic and environmental relationship research by the Organization for Economic Cooperation and Development (OECD) in 2002, to study the linkage between economic development and environmental pollution in member countries [47,48]. The commonly used methods for performing decoupling analyses include the exponential method, the quantitative analysis method, and the differential regression coefficient method, and the methods for the classification of decoupling types include the dichotomy, trichotomy, six-item screener and eight-item screener methods [49]. In this paper, we resort to using the Tapio’s decoupling model, which was proposed by Tapio in 2005 and is the most common method used today [50]. Tapio’s decoupling model, originally used to study the decoupling of traffic capacity and GDP, has been widely used in the fields of economic growth and resource consumption [51,52], and environmental pollution [53,54]. Land is an important spatial resource to carry the service economy and its activities, and we can analyze the decoupling of service-land supply from service-value added and GDP in detail by use of Tapio’s model in this paper:
ε = Δ α Δ β ,   Δ α = S L i + n S L i n ,   Δ β = O P i + n O P i n
where ε represents the decoupling index, Δ α represents the average annual growth of service-land, S L i and S L i + n represent the values of service-land area in year i and year i + n , respectively, Δ β represents the average annual growth rates of service-value added, GDP, O P i and O P i + n represent the values of service-value added and GDP in year i and year i + n , respectively, and n represents the study period. As decoupling conceptually emphasizes the trend of the decoupling process, i.e., decoupling focuses on the fact that decoupling between land-resource consumption, the service economy, and GDP development is not a short-term process, but a process of adjustment requiring a certain cycle and cost. Therefore, the value of n is an integer greater than 1. In this paper, it is set to 4. According to the experience of related studies [55,56] and based on the positive and negative nature Δ α and Δ β , the decoupling types are classified into 8 categories with 0.8 and 1.2 as the classification thresholds for ε (Figure 5).
Strong decoupling is the best state, characterized by a growing rate of service-value added and GDP, but a decreasing scale of service-land. Strong negative decoupling is the worst state, characterized by a declining rate of service-value added and GDP, but a growing service-land area. Weak decoupling is characterized by growth in the rate of service-value added, GDP and service-land, with the economic growth being faster than the land consumption growth. Weak negative decoupling is characterized by a decrease in the rate of service-value added, GDP and service-land, with the decline in economic development being slower than that in land consumption. Expansive coupling is characterized by a relatively simultaneous growth in the rate of service-value added, GDP and service-land, while recessive coupling demonstrates the opposite, and is characterized by a relatively simultaneous decline. Expansive negative decoupling is characterized by growth in the rate of service-value added, GDP and service-land, with economic growth being faster than the land consumption. Recessive decoupling is characterized by a decrease in the rate of service-value added, GDP and service-land, with the decrease in economic development being greater than that in land consumption.

3.2.2. GeoDetector

Many geographic phenomena are the result of multi-factor interactions, and GeoDetector is an important tool for analyzing factor forces and their interactions. Immune to covariance, it can be applied in qualitative and quantitative data analyses and is widely used in the study of natural, economic, and social influencing factors [57,58]. With the study area assumed to be divided into some sub-regions, there is spatial heterogeneity if the sum of the variance of the sub-regions is less than the total variance of the regions. There is statistical correlation between two variables if their spatial distribution tends to be identical. That is, if an independent variable has a significant effect on the dependent variable, the spatial distribution characteristics or patterns of the two should be similar [59]. As stated in Section 3.1, service-land varies widely across provinces in China, lending itself to the application of the GeoDetector method to analyze its driving mechanisms.
Let us say that Y i serves as the dependent variable and X i serves as an independent variable, and we use them to represent the scale of service-land and its influencing factors. To detect factors, GeoDetector quantitatively evaluates the association (similarity) between each independent variable and the dependent variable by calculating the q-value of both. To detect interactions, GeoDetector calculates and compares the q value of the dependent variable after superposition of the two independent variables, and determines whether there is an interaction between the two independent variables, as well as the strength, direction, linearity or nonlinearity of the interaction (Table 1) [60,61]. The range of q values is [0, 1], and when the significance test is passed, the spatial heterogeneity of Y i is more significant and the explanatory power of X i , as it is stronger at larger values. With h as the number of classifications of the independent variable, N h and N as the number of provinces and cities in stratum h and the study area, respectively, σ h 2 and σ 2 as the variances of the dependent variable in stratum h and the study area, respectively, SSW as the “within” sum of squares, and SST as the total sum of squares, the equation to calculate q is as follows:
q = 1 h = 1 l N h σ h 2 N σ 2 = 1 S S W S S T ,   S S W = h = 1 l N h σ h 2 ,   S S T = N σ 2

3.2.3. Spatial Cold- and Hot-Spot Analysis

To explore whether a provincial unit is significantly correlated with the development of service-industries in its adjacent space, and to identify the hot and cold areas of concentration of service-land in China, in this paper we introduced the G e t i s O r d   G i * index to analyze the location of clustering in space for provinces with high or low values. The analysis of cold- and hot-spots helps to observe the spatial clustering characteristics of the cold- and hot-spots of service-land and their expansion trend more intuitively. It is calculated by the following equation:
G i * ( d ) = i = 1 n W i j ( d ) y i i = 1 n y i
where, y i represents the index of service-land in province i (such as land area, average land output, and average land investment), W i j represents the spatial weight matrix, 1 represents spatial contiguity, and 0 represents no spatial contiguity. When the significance condition is satisfied, a positive value of G i * indicates that the service-land in province i has the same development trend with its neighboring provinces and is a hot-spot area; otherwise, it is a cold-spot area, indicating that the province i and the neighboring provinces are different in terms of the service-land development trend. In this paper, we use ArcGIS software to analyze cold- and hot-spots, and the software outputs the GiZScore during the calculation. By cluster analysis of the GiZScore’s numerical value, which is based on natural breaks, we further subdivided the provinces into four types: hot-spot, cold-spot, sub-hot-spot, and sub-cold-spot regions.

3.3. Index Selection
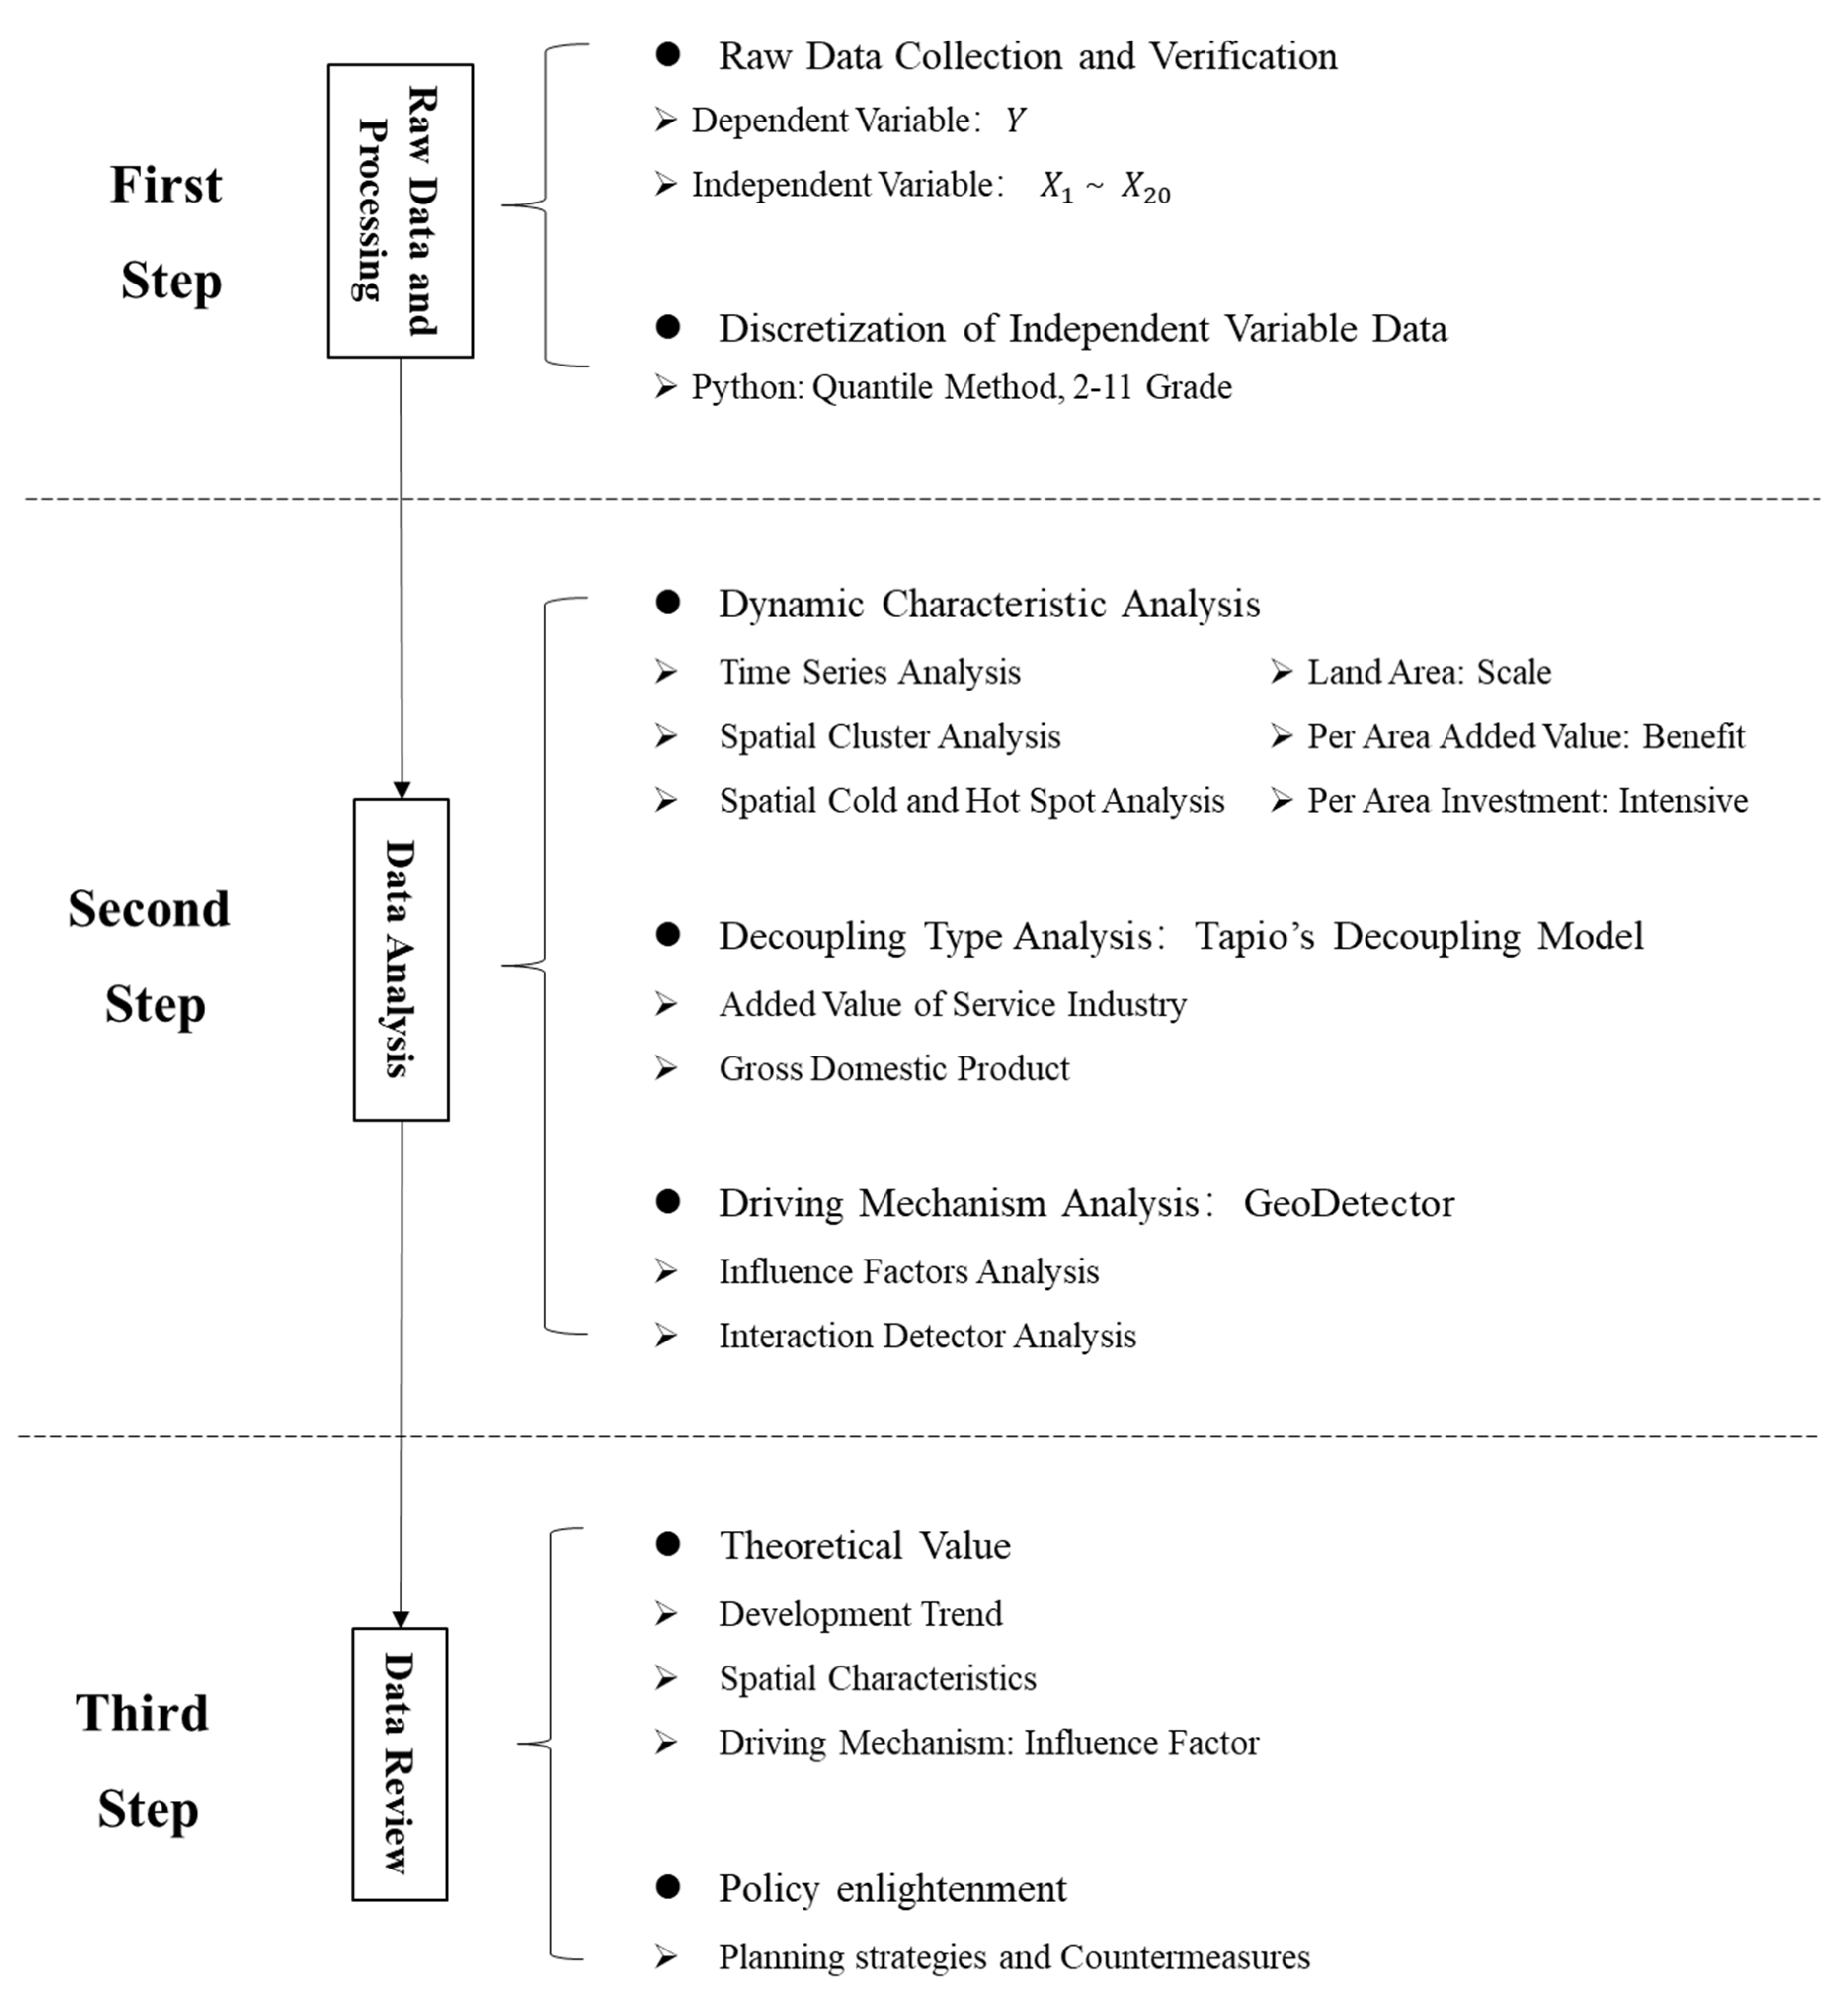
This paper takes the area of service-land in each province in China as the dependent variable of GeoDetector, and uses 20 indexes from five dimensions of urbanization; industrialization, globalization, informatization, and the scale-effect as independent variables (Table 2). Urbanization is a multidimensional and complex concept, this paper measures the urbanization rate of a population from the ratio of urban residents to total population, and the economic urbanization rate by “per capita disposable income of residents” and “per capita consumption expenditure of residents”. According to the 7th census of China, the 65-year-old population will reach 13.5% in 2020, and the figure will reach 14% during the “14th Five-Year Plan” period, making China a deeply aging society. The population structure has become a global, long-term and strategic issue affecting China’s urbanization and industrial transformation. Due to consumer demand, the impact of aging on the service-industry and urbanization will become more prominent, and thus “number of people over 65” is included in the index system in this paper.
Industrialization is the basic condition necessary for the high-quality development of service-industries, and the development of a productive service-industry plays an especially decisive role in supporting the innovation and upgrading of manufacturing industry. The policies issued by the central government such as Guidance on Accelerating the Development of Hi-Tech Service Industry, Guidance on Accelerating the Development of Productive Service Industry to Promote the Adjustment and Upgrading of Industrial Structure, Special Plan for Scientific and Technological Innovation of Modern Service Industry in the “13th Five-Year Plan”, Opinions on Accelerating the High-quality Development of Manufacturing Service Industry, and Implementation Opinions on Promoting the Deep Integration of Advanced Manufacturing Industry and Modern Service Industry clearly require the industrial transformation and upgrading needs to be used as a guide, further accelerating the development of productive service-industries to guide service-industry enterprises to the high-end extension of the value chain, and to promote the transformation of Chinese industries from manufacturing to production services. Industrialization is a development process where industrial production activities gain a dominant position in the economic system, involving industrial transformation, land use structure, technological progress and other fields. In this paper, the added value of secondary industry, per capita GDP, urban industry land area, and number of patents authorized factors are used to represent the level of industrialization.
After the globalization of goods and the globalization of manufacturing, service globalization is now in a period of vigorous development and has become a critical factor in determining the competitiveness of countries in a new round of globalization. China is a beneficiary of economic globalization and more importantly, a contributor. Service-trade is a new engine of international trade and transnational investment. As the fastest growing large economy in global service-trade, China has in recent years enjoyed an average annual growth of nearly 5% in service-trade, ranking second in the world for 6 consecutive years. To promote the globalization of services, the central government has promulgated and implemented policies such as Several Opinions on Accelerating the Development of Service Trade, Guidance on Accelerating the Transformation and Upgrading of Service Outsourcing and “14th Five-Year Plan” for the Development of Service Trade, and designated Beijing, Tianjin, Shanghai, Hainan and Chongqing as comprehensive pilot areas for a further opening-up of the service-industry. Therefore, the level of economic globalization is an important factor affecting the development of service-industries. In this paper, we use the foreign direct investment, export international trade, and import international trade factors to measure the impact of economic internationalization and openness on the evolution of service-land.
Informatization is the process of transforming and upgrading the economic and social structure with information technology, communication technology and network technology as the drivers, and the development and utilization of information resources at the core. The advancement of a new round of revolution in information technology has bred and spawned a large number of new business forms, and new models of service-industry. Furthermore, the informatization of service-industries has become the key to improving the competitiveness of the service economy. The General Office of the State Council of China’s Guidance on Promoting the Standardized and Healthy Development of the Platform Economy requires the active development of the “Internet + Service Industry”. The Opinions on Accelerating the High-quality Development of Service-Industry issued by the National Development and Reform Commission requires promoting the development of close integration between the Internet and all types of consumer business patterns. In this paper, we choose the number of mobile Internet users and mobile internet data traffic factors to measure the social environment of service-industry informatization, and the number of enterprises with e-business transactions, e-commerce sales amount, and e-commerce purchase amount factors to measure the development level of service-industry informatization.
In addition, due to the huge differences in the development stages and levels among Chinese provinces, the impact of scale-effects on changes in service-land should not be ignored. Development-scale includes economic-scale, consumption-scale, land-scale and population-scale, and they are represented by gross domestic product, total retail sales of social consumer goods, urban construction-land area and resident population, respectively.

3.4. Research Steps

The first step deals with raw data and its processing, using the data published on the involved statistical websites to prepare a complete table of raw data. Some missing data, such as the commercial-land area data of Beijing in 2020, was estimated according to the data of other years by the trend extrapolation method. Since the independent variables must be in the form of discrete data when using GeoDetector, in order to eliminate the artificial influence, this paper adopts the quantile method and uses Python to discretize the continuous data of the independent variables, i.e., to divide the independent variable data of the 31 provinces into 10 categories (2–11). The second step deals with data analysis, including decoupling-type analyses, dynamic-characteristic analysis and driving mechanism analysis. This section analyzes the service-land change and its influencing factors in China from two dimensions of spatio-temporal change using ArcGIS and GeoDetector, based on a combination of time-series analysis, spatial-cluster analysis, spatial cold- and hot-spot analysis, and Tapio’s decoupling model. It is worth noting that to calculate the ten types of discretized data using GeoDetector, the classification scheme with the largest q value is the optimal solution if the significance condition is satisfied. The third step deals with Data Review. This section discusses the changing trends, spatial characteristics, and driving mechanisms of service-land in China, and proposes further optimization strategies or policy stimuli for service-land management (Figure 6).

3.5. Data Sources

In this paper, “service-industry” is equivalent to the tertiary industry, with a difference only in the usage of the two. From a statistical point of view, “tertiary industry” is used when “service-industry” is juxtaposed with primary and secondary industries, and “service-industry” is often used when it is juxtaposed with the agriculture, forestry, animal husbandry, fishery, and construction industries. The urban service-land in this paper, or “Class B land” in the Code for Classification of Urban Land Use and Planning Standards of Development Land, includes commercial-land, retail-approval-land, catering- and accommodation-land, financial- and insurance-land, cultural- and creative-land, entertainment- and leisure-land, health-, science- and technology-service-land, engineering-consultation- and technical-service-land. The data in this paper are mainly from China Urban Construction Statistical Yearbook, China Statistical Yearbook, and China Statistical Yearbook of the Tertiary Industry, with some missing data being collected from provincial and city statistical yearbooks and statistical bulletins.
The study period is from 2012 to 2020 for 2 main reasons. First, in 2012 service in China became the largest industry of the country, making China a service economy. Second, in 2011 the General Office of the State Council and the National Bureau of Statistics of China issued the Notice on Strengthening and Perfecting the Statistics of Service Industry, leading to changes in the scope, objects, indexes and contents of China’s service-industry statistics, which were applied to the statistical work and data results in 2012. Therefore, to maintain consistency in the caliber of the study data, it is proper to take 2012 as the base period of the study. In 2012, the China Urban Construction Statistical Yearbook released the data on urban service-land area. The service-land area data of 2020 in Beijing are estimated by the trend-extrapolation method based on the data of other years.

4. Results

4.1. Dynamic Characteristic Analysis
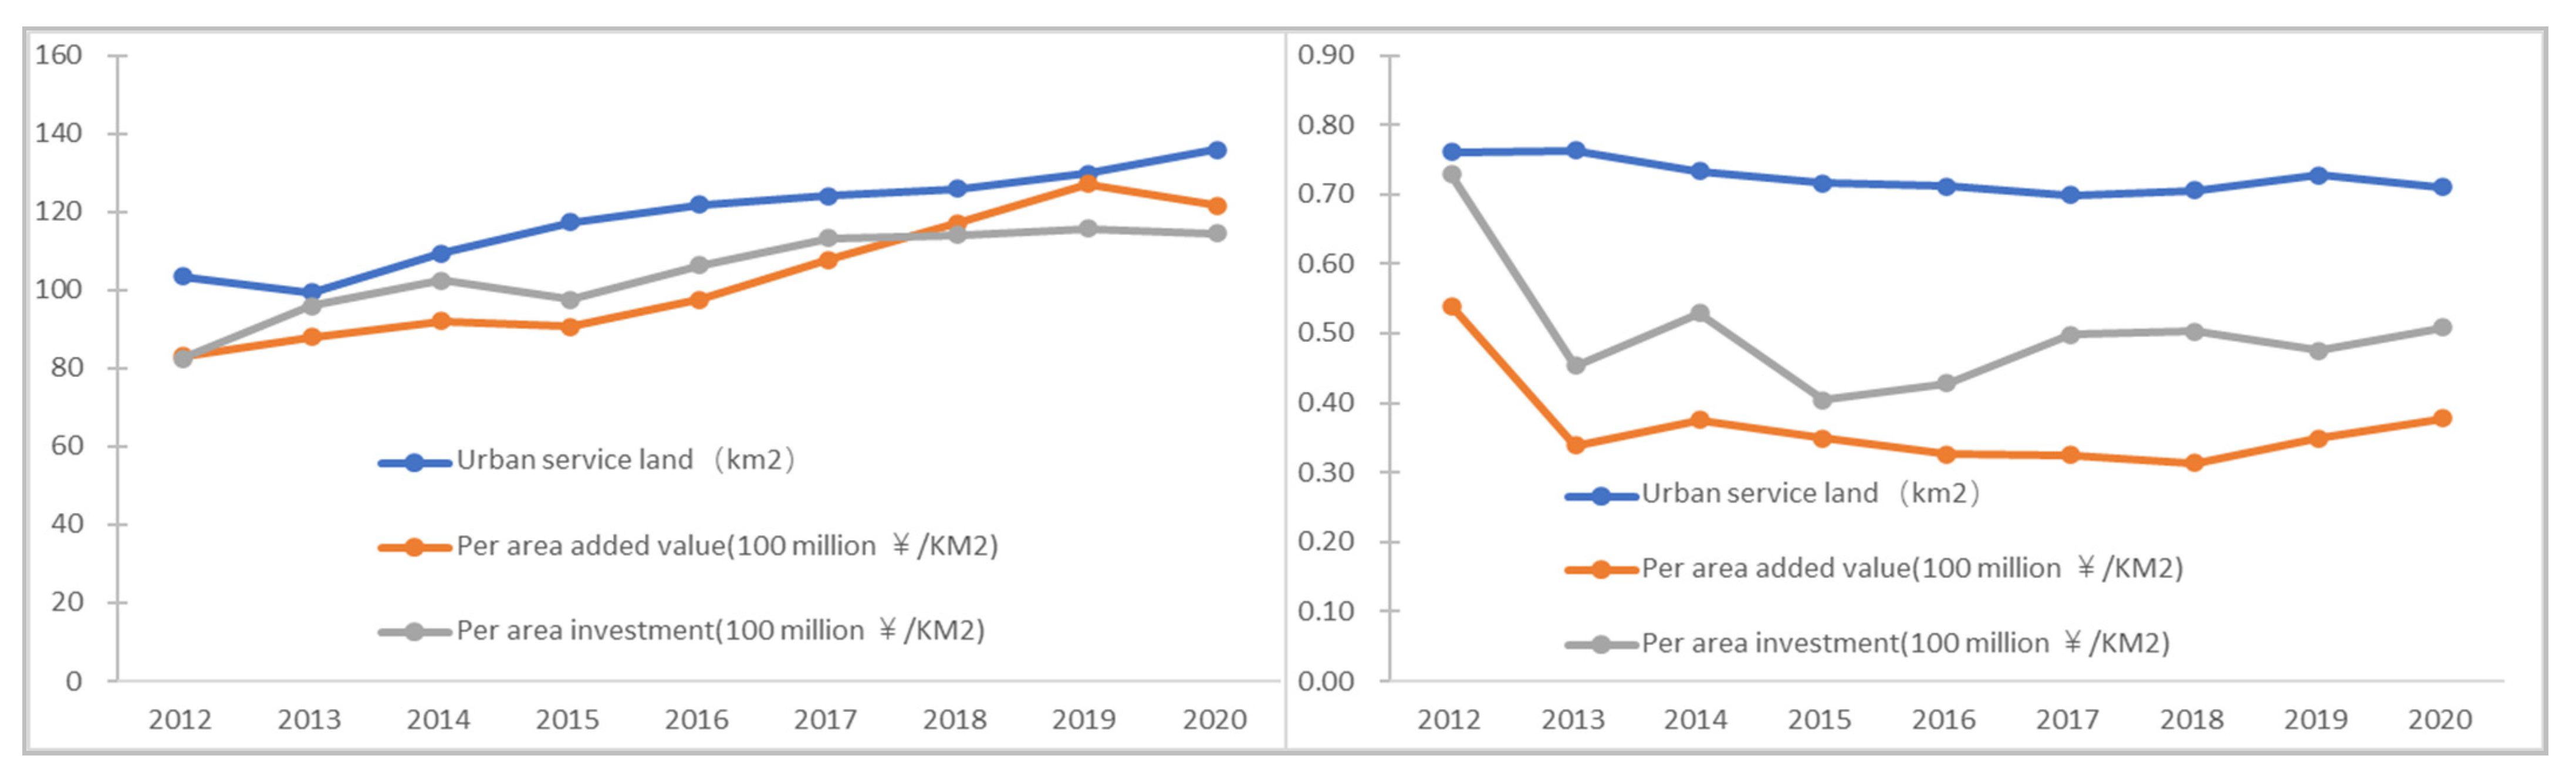
4.1.1. Land Area

The scale of service-land in China continues to grow with very significant spatial differences, but the level of spatial heterogeneity is slowly decreasing. The area of service-land in the 31 provinces in China gradually increased from 103.42 km2 to 135.85 km2 from 2012 to 2020, with an average annual growth of 3.47%, indicating a steady and sustained growth in the supply of service-land in China. According to Guan [62], Liu [63], Miyamoto [64], and She [65], a coefficient of variation greater than 0.36 indicates a high degree of dispersion and disequilibrium between variables. The coefficient of variation of service-land area in the 31 provinces of China from 2012 to 2020 remains greater than 0.70, much higher than 0.36, indicating significant spatial heterogeneity (Figure 7). According to the trend of change in service-land from 2012 to 2020, the 31 provinces are divided into 3 categories. The first category includes the regions with a trend that takes the form of “J”, including Tianjin, Shanxi, Shandong, Henan, Hubei, Hunan, Guangdong, Guangxi, Chongqing, Sichuan, Guizhou, and Xinjiang, where there is a sustained and rapid growth in the service-land area. The second category contains the regions with a trend of change in the form of “inverted U”, including Inner Mongolia, Zhejiang, Anhui, and Tibet, where the service-land area first increases and then decreases. The third category contains stable regions, including Beijing, Jilin, Heilongjiang, Jiangxi, and Ningxia, where the service-land area only fluctuates slightly and remains stable in general (Figure 8).
According to the relative share of service-land in each province (the value of each province/the maximum value of the current year), the 31 provinces are divided into 5 categories of higher-, high-, mean-, low- and lower-levels with a step distance of 0.2. The results of a spatial cluster analysis show that in 2012, the regions belonging to the higher-level category included Guangdong, Shandong, and Jiangsu; there were no regions of high-level; the regions in the mean-level category included Henan, Shanghai, Zhejiang, Anhui, Sichuan, Heilongjiang, and Liaoning; the regions in the low-level category included Beijing, Yunnan, Hubei, Shanxi, and Inner Mongolia; and the regions belonging to the lower-level category included Guangxi, Chongqing, Gansu, Shanxi, Tianjin, Guizhou, Ningxia, Tibet, and Qinghai. In 2016, the regions of the higher-level category remained unchanged, with Zhejiang of a high-level, the regions of mean- and lower-levels shrank, and the regions of low-level expanded. In 2020, the regions of the higher-level category also remained unchanged, and there was no region of a high-level, the regions of the mean-level category were similar to those in 2016, the regions of the low-level category further expanded, and the regions of the lower-level category shrank further (concentrated in Tibet, Qinghai, Gansu and Ningxia). The spatial pattern of service-land in China is generally stable, with relatively few regions in the higher- and mean-level categories, which are concentrated in the coastal and Yangtze River areas, respectively. The regions of low- and lower-levels cover a large area with prominent spatial agglomeration, with the former continuing to expand while the latter shrinks day by day (Figure 9).
From the results of the spatial cold- and hot-spot analysis, the spatial pattern of cold- and hot-spots of service-land in China was quite stable in 2012, 2016 and 2020, and the spatial distribution of different types of areas showed a significant gradient. Hot-spots are concentrated in the Yangtze River Delta region, including in Shanghai, Zhejiang, Jiangsu, Anhui, Fujian, Jiangxi and Hunan. Most of the sub-hot-spots are concentrated in central and north China, including in Hunan, Henan, Shanxi, Shandong, Hebei, Tianjin, Beijing, Liaoning and Jilin. Cold-spots are concentrated in west China, including in Xinjiang, Gansu, Qinghai, Tibet and Sichuan. Sub-cold-spots are concentrated in southwest and northeast China, including in Hainan, Guangdong, Guangxi, Yunnan, Guizhou, Chongqing, Shaanxi, Ningxia, Inner Mongolia and Heilongjiang (Figure 10).

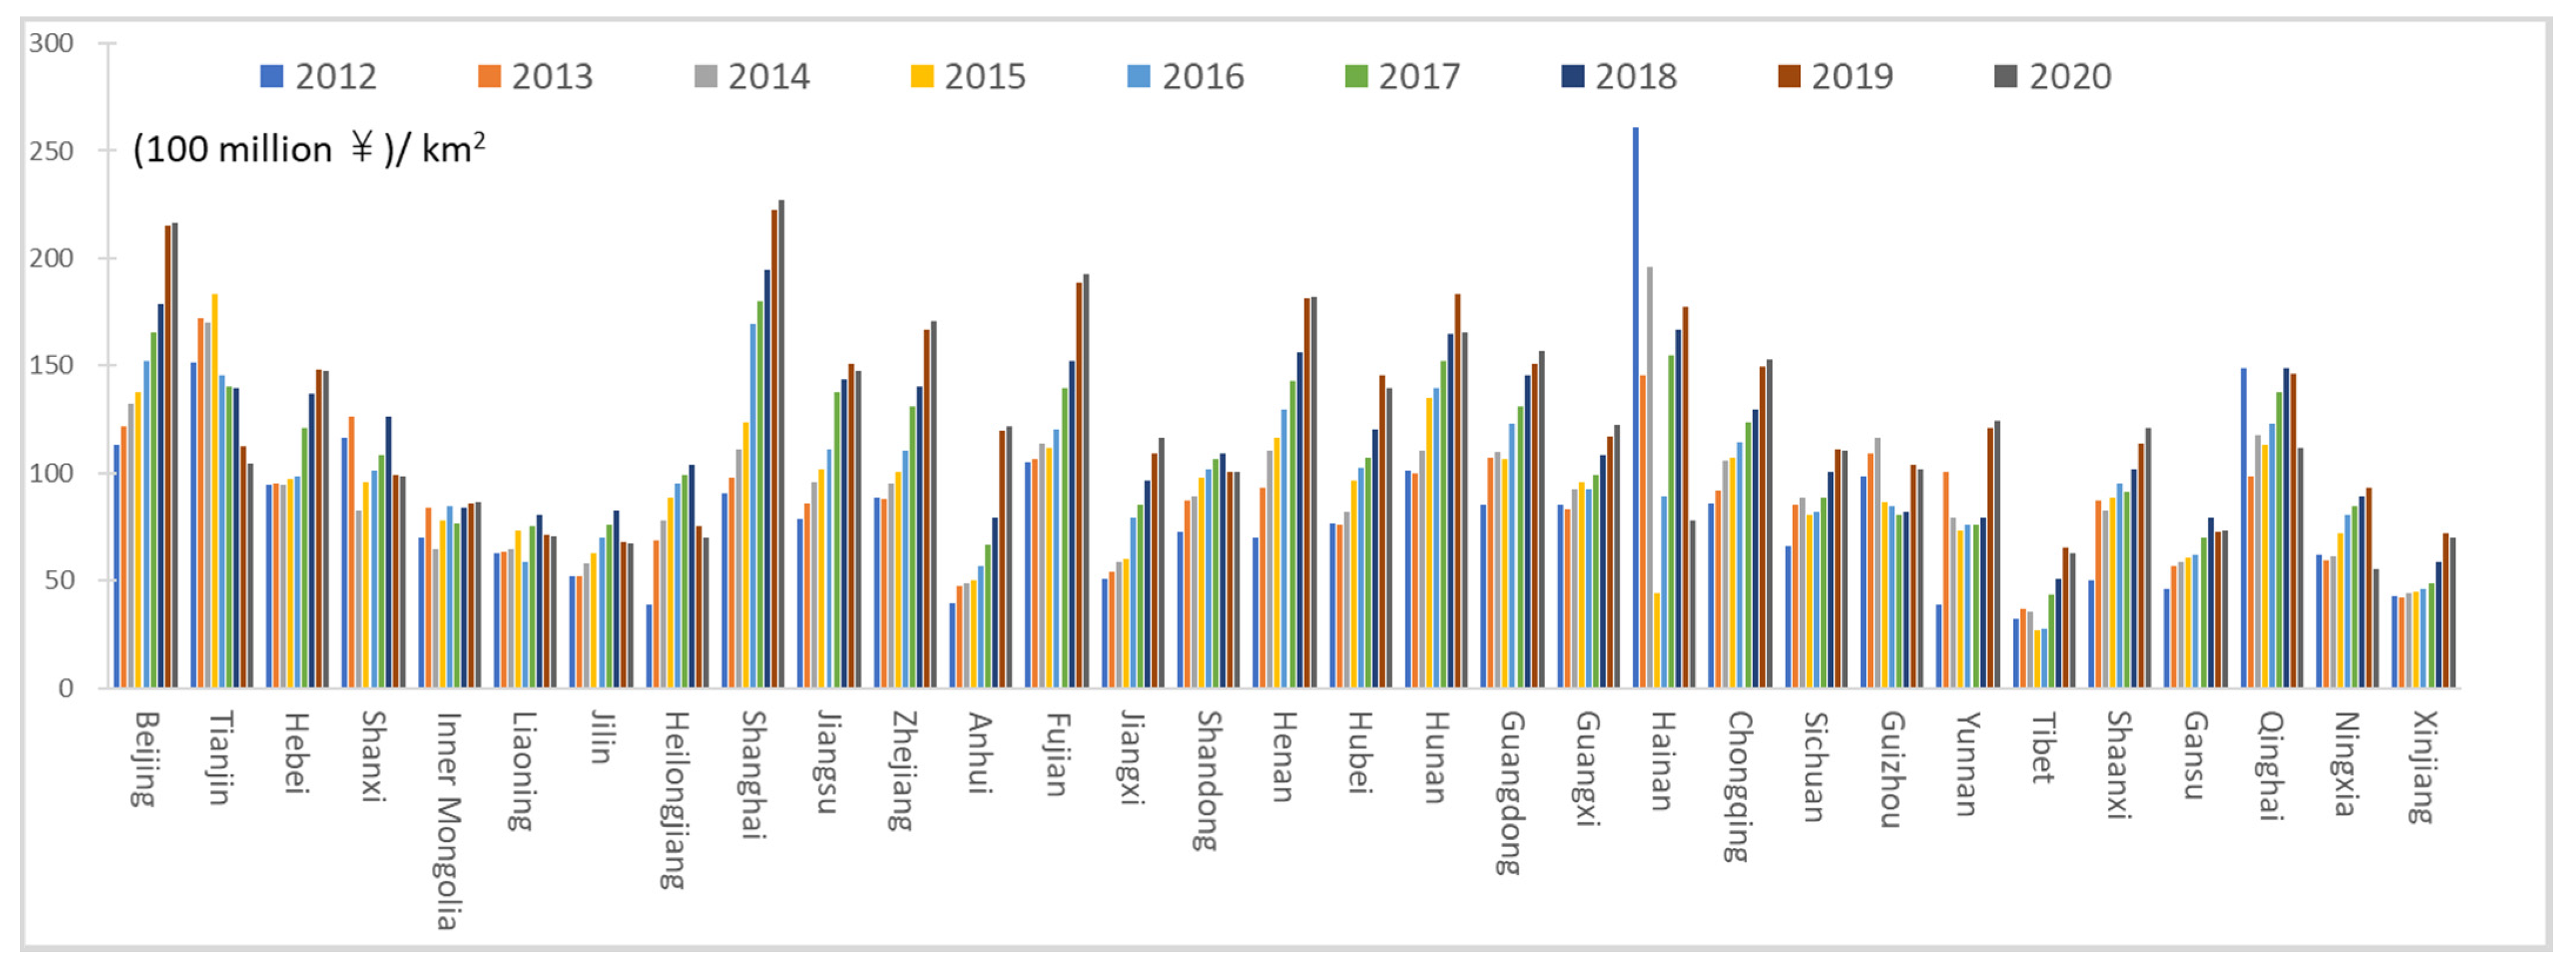
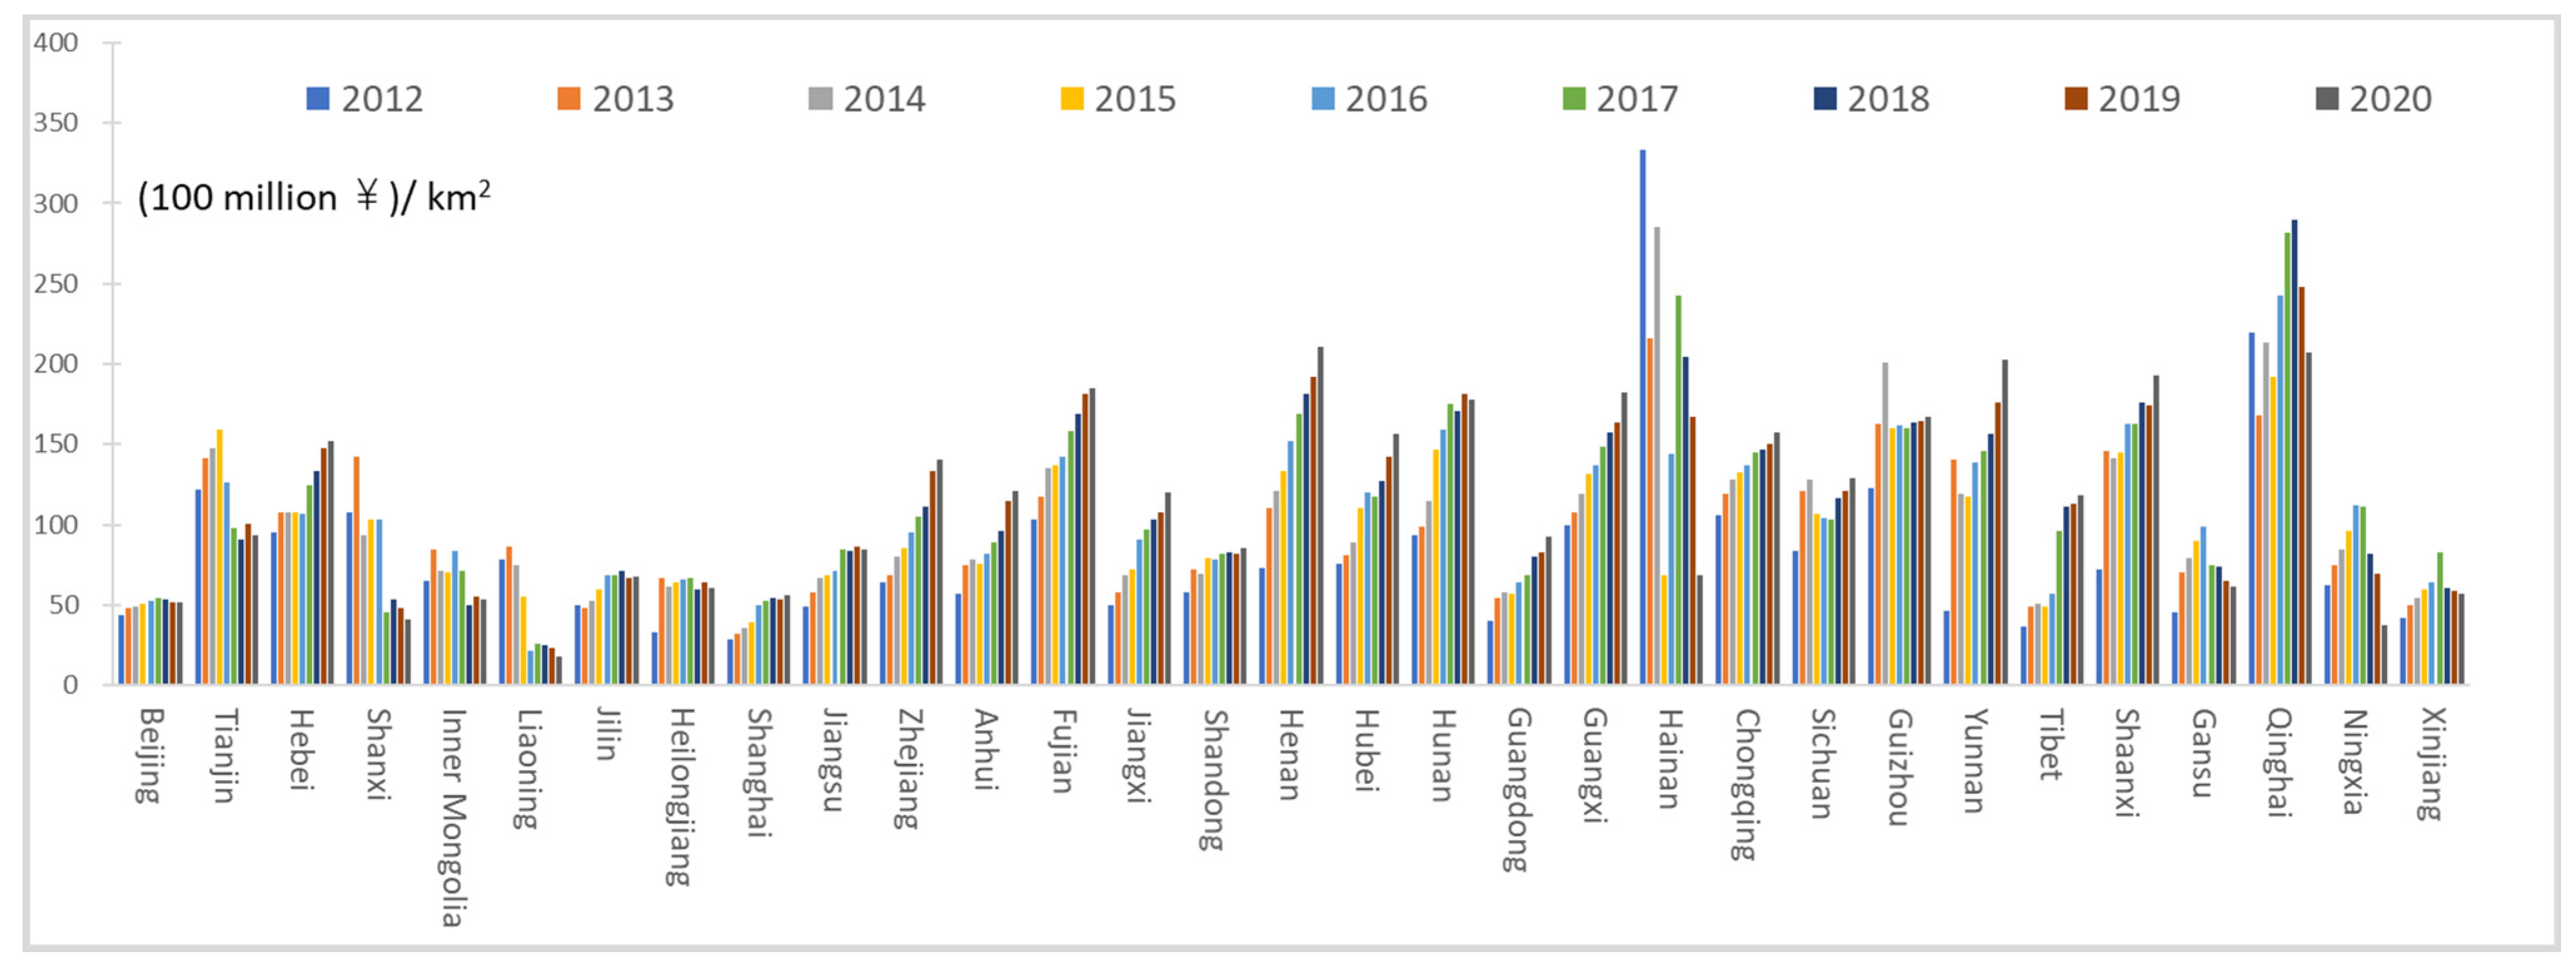
4.1.2. Per Area Added Value

The average output per unit area of China’s service-industry is constantly increasing, and the level of spatial difference first decreases and then increases. The average output per unit area of China’s service-industry in the 31 provinces from 2012 to 2020 gradually increased from 8.303 to 12.148 billion yuan/km2, with an average annual growth of 4.87%, indicating that the output efficiency of service-land per unit area in China is increasing gradually. The coefficient of variation always remained in the range of 0.16–0.36 except for the years of 2012, 2014 and 2020, indicating there is some spatial heterogeneity, but it is not significant (Figure 7). According to the trend of change in output efficiency of service-land from 2012 to 2020, the 31 provinces are divided into 4 categories. The first category consists of regions with a trend of change in the form of “J”, including Beijing, Hebei, Shanghai, Jiangsu, Zhejiang, Anhui, Fujian, Jiangxi, Henan, Hubei, Hunan, Guangdong, Guangxi, Chongqing, and Shaanxi. The second category consists of regions with a trend of change in the form of “U”, including Hainan, Guizhou and Tibet. The third category consists of regions with change in the form of “inverted U”, including Tianjin, Jilin, Heilongjiang, and Qinghai. The fourth category consists of stable regions, including Inner Mongolia and Liaoning (Figure 11).
The results of the spatial cluster analysis show that in 2012, Hainan was the only province belonging to the higher-level category; there was no region in the high-level category; the regions in the mean-level category included Fujian, Beijing, Tianjin, Shanxi and Qinghai. The regions in the low-level category included Guangdong, Guangxi, Sichuan, Hunan, Henan, Shandong, Hebei, Inner Mongolia, and Liaoning, which cover most of the geographical area and are concentrated in a continuous distribution. The regions of the lower-level category included Heilongjiang, Jilin, Anhui, Jiangxi, Shaanxi, Gansu, Xinjiang, Tibet, and Yunnan, which are mainly distributed in border areas. In 2016, the coverage of regions in the higher-level category expanded greatly, including Hunan, Shanghai, Beijing and Tianjin. The regions of the high-level category were distributed in coastal and central regions, including in Jiangsu, Zhejiang, Fujian, Guangdong, Henan, Hubei, Chongqing and Qinghai. The coverage of the mean-level regions expanded greatly, being concentrated in southwest and north China, including in Heilongjiang, Jilin, Inner Mongolia, Hebei, Shandong, Shanxi, Shaanxi, Ningxia, Sichuan, Yunnan, Guizhou, Guangxi, and Hainan. The regions of the low and lower-level categories shrank significantly in coverage and were scattered in terms of their spatial distribution. The former category included Liaoning, Anhui, Gansu and Xinjiang, while the latter only included Tibet. In 2020, there was no region in the lower-level category; the regions of a higher-level were Fujian, Shanghai, Henan, and Beijing; the regions of a high-level were concentrated in Yangtze River Delta and Pearl River Delta, which included Guangdong, Hunan, Hubei, Chongqing, Jiangsu, and Zhejiang. The regions of the mean-level category shrank relatively in coverage, were mainly concentrated in southwest China, and included Yunnan, Guangxi, Guizhou, Sichuan, Qinghai, Shaanxi, Shanxi, Shandong, Tianjin, Anhui and Jiangxi. The coverage of the low-level regions expanded greatly again, was concentrated in northwest and northeast China, and included Xinjiang, Gansu, Inner Mongolia, and Heilongjiang. In general, the spatial pattern in the output efficiency of service-land in China has changed greatly, with low- and lower-levels dominating in the early stage, compared to higher- and high-levels covering an increasing geographical area at present. The regions of the higher-level category are highly variable and scattered, the regions of a high-level are clustered in city clusters in the Yangtze River Delta and Pearl River Delta, the regions of the mean-level category are distributed in southwest and central China, the regions of the low-level category are clustered in northwest and northeast China, and there are no regions of a lower-level (Figure 12).
The output of service-industries per unit area in China is characterized by a large variation in the spatial pattern of cold- and hot-spots, and significant spatial agglomeration. From the perspective of hot-spots, they were concentrated in the Pearl River Delta in 2012, in the Yangtze River Delta in 2016, and still in the Yangtze River Delta in 2020 but with the geographical coverage further expanded. From the perspective of sub-hot-spots, they were concentrated in central and north China (Inner Mongolia, Ningxia and Liaoning) in 2012, then mainly in north China in 2016 with a few scattered in the central region (Hunan) and the southern region (Hainan), and in 2020 they were mainly in the Pearl River Delta, with a few scattered in the northern region (Shanxi) and the eastern region (Shandong). From the perspective of cold-spots, they were scattered in 2012, including in Chongqing, Heilongjiang and Xinjiang, then mainly concentrated in west China in 2016, and concentrated in western and north China in 2020, with a significant expansion of geographical coverage. From the perspective of sub-cold-spots, in 2012, they covered a large area with the concentration zone expanding from southwest to north China, in 2016 the concentration zone expanded from southwest to north, and in 2020 the coverage shrank greatly and was concentrated in the Yunnan–Guizhou Plateau and the Beijing–Tianjin–Hebei region, including in Hainan, Yunnan, Sichuan, Chongqing, Shaanxi, Ningxia, Beijing, Tianjin, and Hebei (Figure 13).

4.1.3. Per Unit Area Investment

Investment in China’s service-industry per unit area continues to grow, with significant spatial differences. The level of spatial heterogeneity is higher than the land output per unit area but lower than the scale of service-land. The per unit area investment in the service-industry in the 31 provinces of China gradually increased from 8.238 to 11.448 billion yuan/km2 from 2012 to 2020, with an average annual growth of 4.20%. It should be noted that it grew steadily and continuously from 2012 to 2016, with a stable fluctuation from 2017 to 2020, indicating a high and stable level of intensification of land development in China’s service-industry. The coefficient of variation of per unit area investment in the service-industry in the 31 provinces of China from 2012 to 2020 remained greater than 0.36, indicating significant spatial heterogeneity (Figure 7). According to the service-land change from 2012 to 2020, the 31 provinces can be classified into 3 categories. Regions with change in the form of “J” constitute the first category, including Hebei, Shanghai, Jiangsu, Zhejiang, Anhui, Fujian, Jiangxi, Henan, Hubei, Hunan, Guangdong, Guangxi, and Yunnan. Regions with change in the form of “inverted U” constitute the second category, including Tianjin, Shanxi, Inner Mongolia, Liaoning, Hainan, Gansu, Qinghai, Ningxia, and Xinjiang. Stable regions constitute the third category, including Beijing, Jilin, Heilongjiang, Sichuan, and Guizhou (Figure 14).
The results of the spatial cluster analysis show that in 2012, the regions of the higher- and high-level categories only included Hainan and Qinghai, respectively, and there was no region belonging to the mean-level category. The regions of a low-level were mainly distributed in central, southwest, and northern China, including Shaanxi, Shanxi, Henan, Hunan, Hubei, Chongqing, Guizhou, Sichuan, Hebei, Tianjin, and Liaoning. The regions of the lower-level category were concentrated and contiguous in coastal and border areas, which included Guangdong, Jiangxi, Zhejiang, Anhui, Jiangsu, Shandong, Beijing, Jilin, Heilongjiang, Inner Mongolia, Gansu, Xinjiang, Tibet, and Yunnan. In 2016, the only region of a higher-level was Qinghai, and the high-level regions expanded rapidly to include Hunan, Guizhou, Shaanxi and Henan. The regions of a mean-level were mainly concentrated in southwest and northern China, and included Yunnan, Guangxi, Sichuan, Chongqing, Hunan, Hainan, Gansu, Ningxia, Fujian, Shanxi, Hebei, Beijing and Tianjin. The regions of a low-level were mainly distributed in coastal and border areas, including Shanghai, Jiangsu, Zhejiang, Anhui, Jiangxi, Guangdong, Tibet, Xinjiang, Inner Mongolia, Heilongjiang and Liaoning. The lower-level coverage shrank rapidly, leaving only Liaoning. In 2020, the coverage of higher-level regions expanded greatly, to include Fujian, Hunan, Guangxi, Yunnan, Qinghai, Shaanxi and Henan. The regions of a higher-level further expanded and clustered, and included Zhejiang, Hebei, Henan, Chongqing, Guizhou and Sichuan. The regions of a mean-level shrank relatively, including Guangdong, Jiangxi, Anhui, Shandong and Tibet. The regions of a low-level were mainly located in the border areas, and included Xinjiang, Gansu, Inner Mongolia, Heilongjiang, Jilin, Beijing, Tianjin, Hainan, and Jiangsu. The regions of a lower-level covered a small area, only including Liaoning, Ningxia and Shanxi. In general, the spatial pattern of service-land development-intensity in China is highly variable, with the low- and lower-level categories dominating in the early stage, compared to high- and higher-level regions covering a larger geographical area in the later stage (Figure 15).
The spatial pattern of per unit area investment for cold- and hot-spots in the service-industry in China is also highly variable, and the level of spatial agglomeration is also significant. From the perspective of hot-spots, they were concentrated in the Pearl River Delta in 2012, expanded northward to Sichuan, Chongqing, Gansu and Ningxia in 2016, then shrank in the north and expanded from east to west in 2020, covering most of the area of the Pan-Pearl River Delta. From the perspective of sub-hot-spots, they were concentrated in the southwest plateau in 2012, shrank sharply in the southwest in 2016 being concentrated in central China, and further contracted in 2020 mainly concentrating in Fujian, Zhejiang, Anhui, Henan and Hubei. From the perspective of cold-spots, they were mainly concentrated on the west coast of the Straits and Beijing–Tianjin–Hebei region in 2012, then in the northern region in 2016, and in northeast and northern China in 2020. From the perspective of sub-cold-spots, they covered a wide geographical area in 2012 being concentrated in the northeast and central China, shrank significantly in space in 2016 concentrating in the Yangtze River Delta, then in 2020 their geographical coverage had a significant expansion, which was mainly concentrated in the northwest (Figure 16).

4.2. Decoupling-Type Analysis

4.2.1. Added Value of Service-Industry

Analyzing the type of decoupling between service-land and service-value added helps to show the connection between land-resource inputs and direct economic output efficiency. From 2012 to 2020, there were 5 decoupling types seen: strong decoupling, weak decoupling, expansive coupling, expansive negative decoupling and strong negative decoupling. Most provinces and cities were in a mode of weak decoupling. Heilongjiang, Yunnan, Shanghai, Shaanxi and Henan were in a mode of strong decoupling from 2012 to 2016, which is the best state. Tianjin, Xinjiang, Guangxi and Hebei were in an expansive coupling mode. Whereas Qinghai, Tibet, Shanxi, Liaoning and Hainan were experiencing expansive negative decoupling, and the development of their service economies still depended on the input of land-resources. The geographical coverage of the regions of these three categories was small, and had a scattered spatial distribution. Most provinces and cities including Sichuan, Chongqing, Hubei, Hunan, Jiangsu, Jiangxi, and Guangdong were in a state of weak decoupling, which was concentrated in the coastal and central regions. Liaoning, Zhejiang, Hebei and Anhui were in a state of strong decoupling from 2016 to 2020, which is the best state. Shanxi and Shandong were in a state of expansive coupling; Ningxia, Hainan, Qinghai and Jilin were in expansive negative decoupling mode; and Tianjin and Heilongjiang were experiencing strong negative decoupling. The development of all of their service economies still depended on the supply of land-resources, especially in Tianjin and Heilongjiang, which were in the worst state. The regions of these four categories covered a small geographical area and were spatially dispersed. Most provinces and cities such as Guangdong, Shanghai, Jiangsu, Beijing, Guangxi, Xinjiang, Gansu and Inner Mongolia were in a state of weak decoupling, which was mainly concentrated in coastal and border areas (Figure 17).

4.2.2. Gross Domestic Product

The service-industry has a strong correlative effect, and analyzing the type of decoupling between service-land and GDP will help to reveal the relationship between land-resource inputs and overall economic output efficiency (both direct and indirect). There were also 5 decoupling types found from 2012 to 2020: strong decoupling, weak decoupling, expansive coupling, expansive negative decoupling and strong negative decoupling. Most provinces and cities were in a state of weak decoupling. From 2012 to 2016, Shaanxi, Shanghai, Yunnan, Henan and Heilongjiang were in a state of strong decoupling. Guizhou, Chongqing, Fujian, Guangxi, Gansu and Inner Mongolia were experiencing expansive coupling. Tibet, Hainan, Qinghai, Tianjin, Sichuan, Xinjiang, Hebei and Shanxi were in a mode of expansive negative decoupling, and Liaoning was in a state of strong negative decoupling. Most provinces and cities including Hubei, Zhejiang, Anhui, Jiangsu, Beijing, Hunan, Jiangxi, Guangdong, Shandong, Ningxia, and Jilin were in weak decoupling mode. From 2016 to 2020, Anhui, Zhejiang, Hebei and Liaoning were in a state of strong decoupling, Guizhou, Shanxi and Guangxi were in expansive coupling mode, Ningxia, Hainan, Qinghai and Shandong were in expansive negative decoupling mode, and Inner Mongolia, Tianjin, Jilin and Heilongjiang were experienceing strong negative decoupling. Most provinces and cities including Sichuan, Guangdong, Shaanxi, Chongqing, Jiangxi, Yunnan, Xinjiang, Beijing, Fujian, Hubei, Gansu, Jiangsu, and Shanghai were in a state of weak decoupling (Figure 18).

4.3. Driving Mechanism Analysis

4.3.1. Influence Factors Analysis

Except for “population urbanization rate” that could only pass the significance test with a confidence level of 0.1, all other factors could pass the significance test with a level of 0.05 or higher. Factor-forces varied widely, and their trends of change were also different. In 2012, the order of factor-forces was X 5 > X 15 > X 7 > X 16 > X 19 > X 14 > X 18 > X 10 > X 9 > X 17 > X 6 > X 11 > X 20 > X 13 > X 12 > X 2 > X 3 > X 8 > X 4 > X 1 , in 2016 it was X 17 > X 18 > X 19 > X 5 > X 14 > X 7 > X 12 > X 13 > X 20 > X 8 > X 10 > X 2 > X 11 > X 16 > X 9 > X 15 > X 1 > X 3 > X 4 > X 6 , and in 2020 it was X 19 > X 7 > X 8 > X 17 > X 18 > X 5 > X 14 > X 12 > X 20 > X 2 > X 13 > X 10 > X 16 > X 15 > X 3 > X 11 > X 9 > X 6 > X 4 > X 1 . By trying to average the factor-forces, we can calculate the intensity of the forces that were driving the change in the 5 categories of service-land. In 2012, 2016 and 2020, the driving forces of change in service-land were relatively stable, i.e., the scale-effect > informatization > globalization > industrialization > urbanization (Table 3 and Table 4).
From the trend of change of factor-forces, the forces of the number of people over 65, per capita disposable income of residents, per capita consumption expenditure of residents and number of patents authorized factors are gradually increasing. While the force of the added value of secondary industry, per capita GDP, foreign direct investment, export international trade, import international trade, e-commerce sales amount and e-commerce purchase amount factors are declining day by day. The force of the population urbanization rate, number of mobile internet users, mobile internet data traffic, gross domestic product, and total retail sales of social consumer goods factors increased first and then decreased. The forces of the urban industry land area, number of enterprises with e-business transactions, urban construction-land area, and resident population factors remained unchanged. In terms of the trend of driving forces, the role of the scale-effect increased at first and then decreased, the role of informatization and globalization decreased continuously, the role of industrialization decreased at first and then increased, and the role of urbanization continues to increase, but it is still small and mainly plays an indirect supporting role (Table 3 and Table 4).

4.3.2. Interaction-Detector Analysis

The results of the analysis on the interaction-effects of service-land use change impact-factors in 2012, 2016 and 2020 are shown in Table A1, Table A2 and Table A3. The interaction between the two influencing factors was dominated by bifactor enhancement, and supplemented by non-linear enhancement. In 2012, only X 1 X 2 and X 4 X 2 were nonlinearly enhanced, while the rest were all bifactor enhanced. The interaction between all factor pairs in 2016 was a bifactor enhancement. In 2020, the nonlinear enhancement factor pairs were increased to 6, including X 1 X 2 , X 1 X 9 , X 1 X 12 , X 1 X 20 , X 4 X 9 and X 6 X 9 . Factors varied widely in terms of their interaction forces, with a minimum value of 0.3044 and a maximum value of more than 0.9994, and mean values of 0.9024, 0.9011, and 0.9076 in 2012, 2016, and 2020, respectively. To maintain classification objectivity and balance, the factor interaction forces were classified into high-, medium- and low-level groups by the quantile method. It is worth noting that the factors such as number of people over 65, resident population, foreign direct investment, per capita disposable income of residents, and number of mobile internet users have strong interaction forces and can be regarded as super-interaction factors.

5. Discussion

5.1. Theoretical Value

In summary, we find that the scale, output efficiency, and development intensity of service-land in China is in rapid growth, with significant levels of spatial heterogeneity and agglomeration, which supports some findings in the existing papers [66]. For example, the studies of Shen [67] and Wang [68], which were based on the use of Thiel’s coefficient, clustering and regression analysis, found that the spatial differences in China’s service-industry are significant, and that the level of economic development, the scale of urban development, and market capacity are the most important influencing factors. Seo [69] also confirmed that the development of the service-industry in OECD countries is highly heterogeneous, and is influenced by economies of scale and R&D expenditures. Besides this, this paper finds that urban construction-land area, added value of secondary industry, urban industry land area, number of enterprises with e-business transactions, total retail sales of social consumer goods are the critical factors influencing the change of service-land, followed by gross domestic product, total retail sales of social consumer goods, number of people over 65, resident population, foreign direct investment, per capita disposable income of residents, and number of mobile internet users, which should not be ignored. Yin [70], Lu [71], Griffith [72], Etchebarne [73], and Tsai [74] et al. stated that foreign capital utilization, international trade, and service outsourcing are important factors affecting the development of service-industries; Ilmakunnas [75] believed that there is a hump-shaped relationship between aging and service-industry productivity; Eswaran [76], Rahman [77], Yang [78], and Takahashi [79] argued that there is a mutually reinforcing relationship between service and industrial development; Gonzalez-Blanco [80] concluded that technological innovation is a determining factor in the development of services; and Micucci [81] held that the force of urbanization externalities in the growth of productive services in Italy is small. These viewpoints are largely in agreement with the finding of this paper, but unlike their fragmented research, our study is systematic and comprehensive.
This paper finds that most provinces and cities in China are in a state of weak decoupling, with a small number experiencing expansive coupling, expansive negative decoupling, and strong negative decoupling, and only a few in strong decoupling mode. Hu [82] analyzed the total-factor productivity of China’s service-industry based on the Chenery–Syrquin model, and pointed out that the development of China’s service-industry is still at the stage of relying on factor inputs, and that there is a certain “resource mismatch”. This finding is generally consistent with the results this study, but this paper provides a more detailed and precise analysis, which provides a direction for future optimization of service-land supply and for the improvement of land use efficiency. In addition, this paper finds that the trends of changes in the scale, output efficiency and development intensity of service-land in China are in a variety of forms such as J-shaped, U-shaped and inverted U-shaped, with significant levels of spatial heterogeneity and agglomeration, and that the driving mechanisms are becoming increasingly diversified and complex. This paper also finds that the spatial distribution of cold- and hot-spots in the service-industry show a gradient pattern in the east, middle and west, and a significant spatial agglomeration of cold- and hot-spots of per unit area outputs and inputs. These empirical results are new and are not mentioned in other papers, and they can be regarded as an important addition to the theory of service-land management and planning. Of course, they also need to be compared and corroborated by empirical studies in countries other than China for further optimization and refinement.

5.2. Policy Enlightenment

From the perspective of urbanization and scale effects, the construction project of the “modern service industry agglomeration area” was implemented to make it a major spatial carrier for the agglomeration and scale-development of the service-industry, and to support the provinces to build a modern service-industry system with local characteristics, sustainable development competitiveness, support and driving forces. Wu [83] argued that establishing service-industry clusters through the efforts of the government is an important means to optimize the use of space and efficiency of service-industry development, and this paper also finds that urbanization and scale effects have a huge impact on service-land changes. It is recommended to plan and build a number of modern service-industry clusters with a large-scale, distinctive characteristics and perfect functions, starting with key industries and major projects flexibly in the form of a “park within a park”, a “park by a park” or an independent clustering, with the goal of expanding its scale, improving quality and optimizing structure. It would be oriented towards high-end factor agglomeration, industrial integration and development, international cooperation and co-construction, and service function upgrading, so as to promote the rational agglomeration of production factors such as talents, capital and technology, and to give full-play to the effects of agglomeration and scale.
From the perspective of industrialization, we should seize the opportunity of the “Made in China 2025” and “intellectualization–digitization convergence” strategies; strengthen demand-side management; upgrade the service-industry chain and value chain; promote the synergistic development, cross-border integration and linkage innovation of service and industry; and make special efforts to cultivate a new pattern of business with the two-way deep integration of manufacturing and service-industries, to improve the technological level and efficiency of the service-industry, and to establish a new competitive advantage in service-industry development by making use of the technology-spillover effect in manufacturing transformation. From the perspective of globalization, it is necessary to expand the opening of the service-industry, relax market access, and implement the “service trade doubling plan” in the future. On the one hand, it is necessary to expand the field and depth of service-industry opening, to further expand the introduction of foreign investment in the service-industry by the platform carriers such as free trade zones, economic development zones and high-tech zones; on the other hand, efforts should be made to innovate service-trade development collaboration, and to plan and build service-trade functional areas or special service export-bases, relying on the existing development zones to cultivate service-trade market subjects, expand the scale of service-trade, optimize service-trade structure, enhance service outsourcing and export capacity, and promote service-trade and investment liberalization. From the perspective of information technology, grasping the new generation of information technology revolution is a requirement, especially the “Internet +”, smart cities, and new infrastructure strategies, to promote the application of big data, the Internet of things, cloud computing and other modern information technologies in the service-industry, in order to transform the traditional service-industry, amplify the demand for services through information consumption, and innovate new services and new models by means of information technology.

6. Conclusions

In the era of the service-oriented economy and knowledge-oriented service, the service-industry has been increasing its share of regional GDP and employment, and the service economy has become a new driving force for economic growth, social progress and technological innovation. With the planning and construction of the modern service-industry cluster area and the layout of commercial facilities, the scale of urban service-land is growing rapidly and the land structure is becoming more optimized. It is of great significance to analyze the urban service-land change and its driving mechanisms for the construction of resource-saving and environment-friendly cities. Based on the panel data of service-land in the 31 provinces and cities in China from 2012 to 2020, we have conducted an empirical study on the dynamic change of service-land in China, and its driving mechanisms, with the help of ArcGIS and GeoDetector by a combination of methods including time series analysis, spatial cluster analysis, spatial cold- and hot-spot analysis, and Tapio’s decoupling model, finding that:
(1)
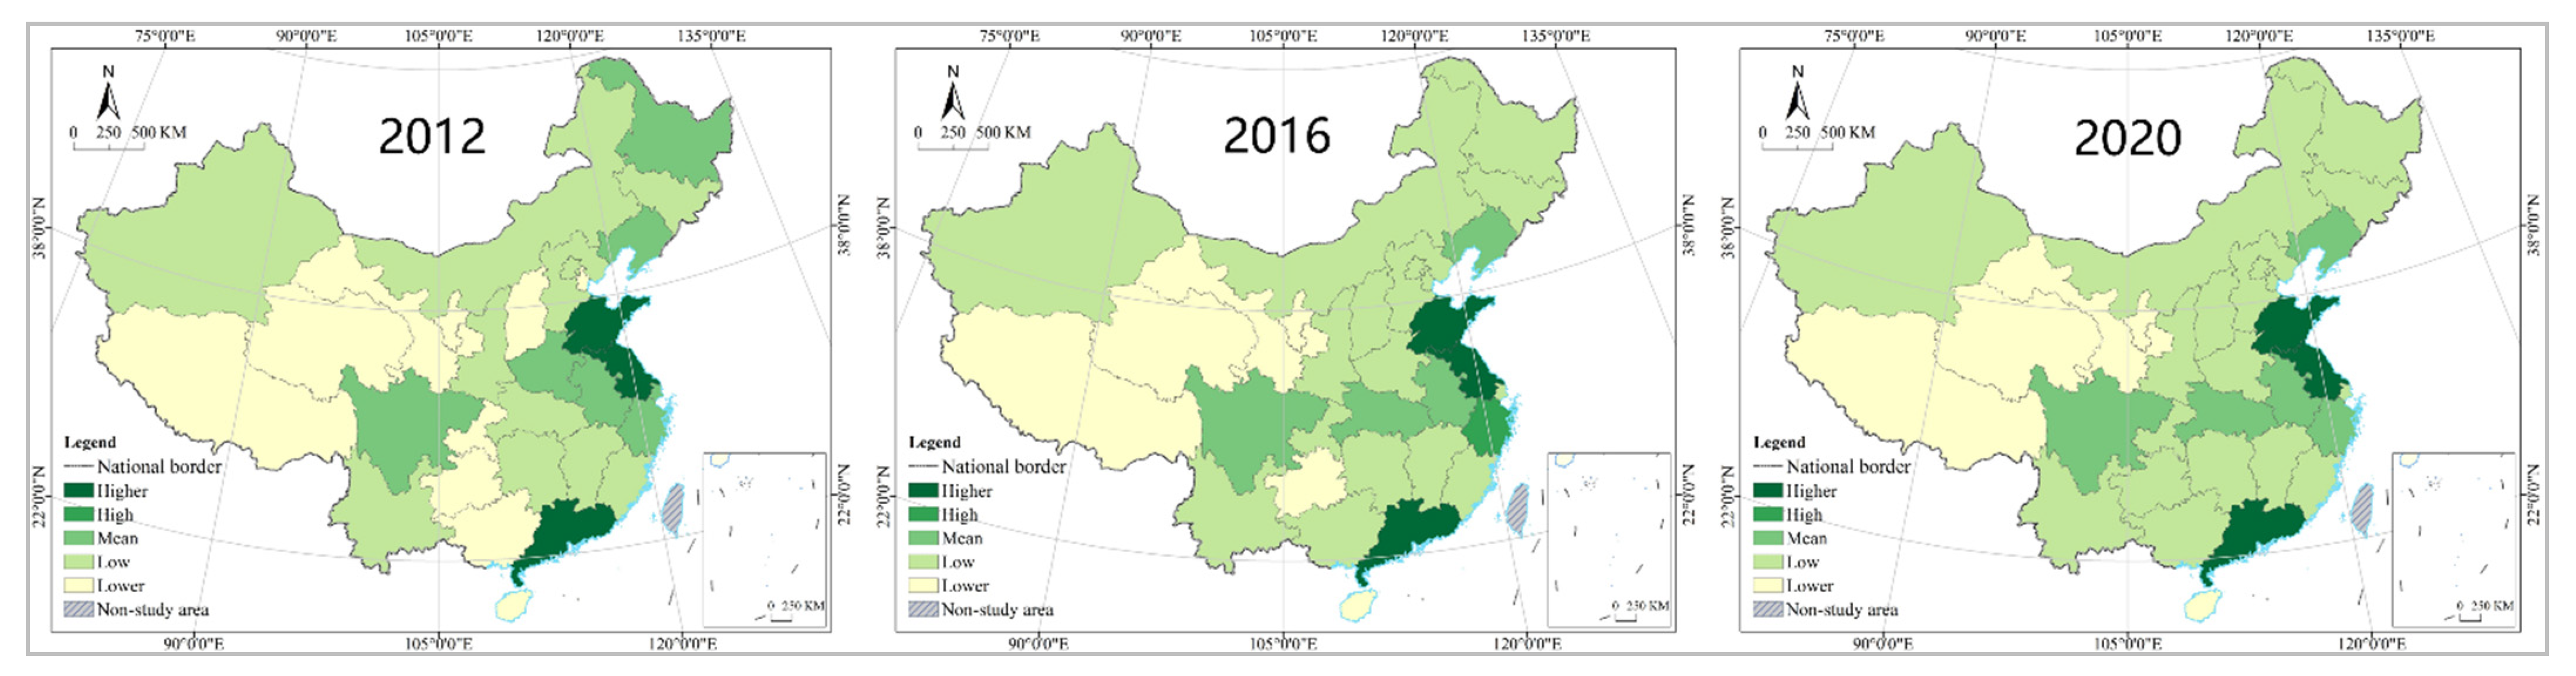
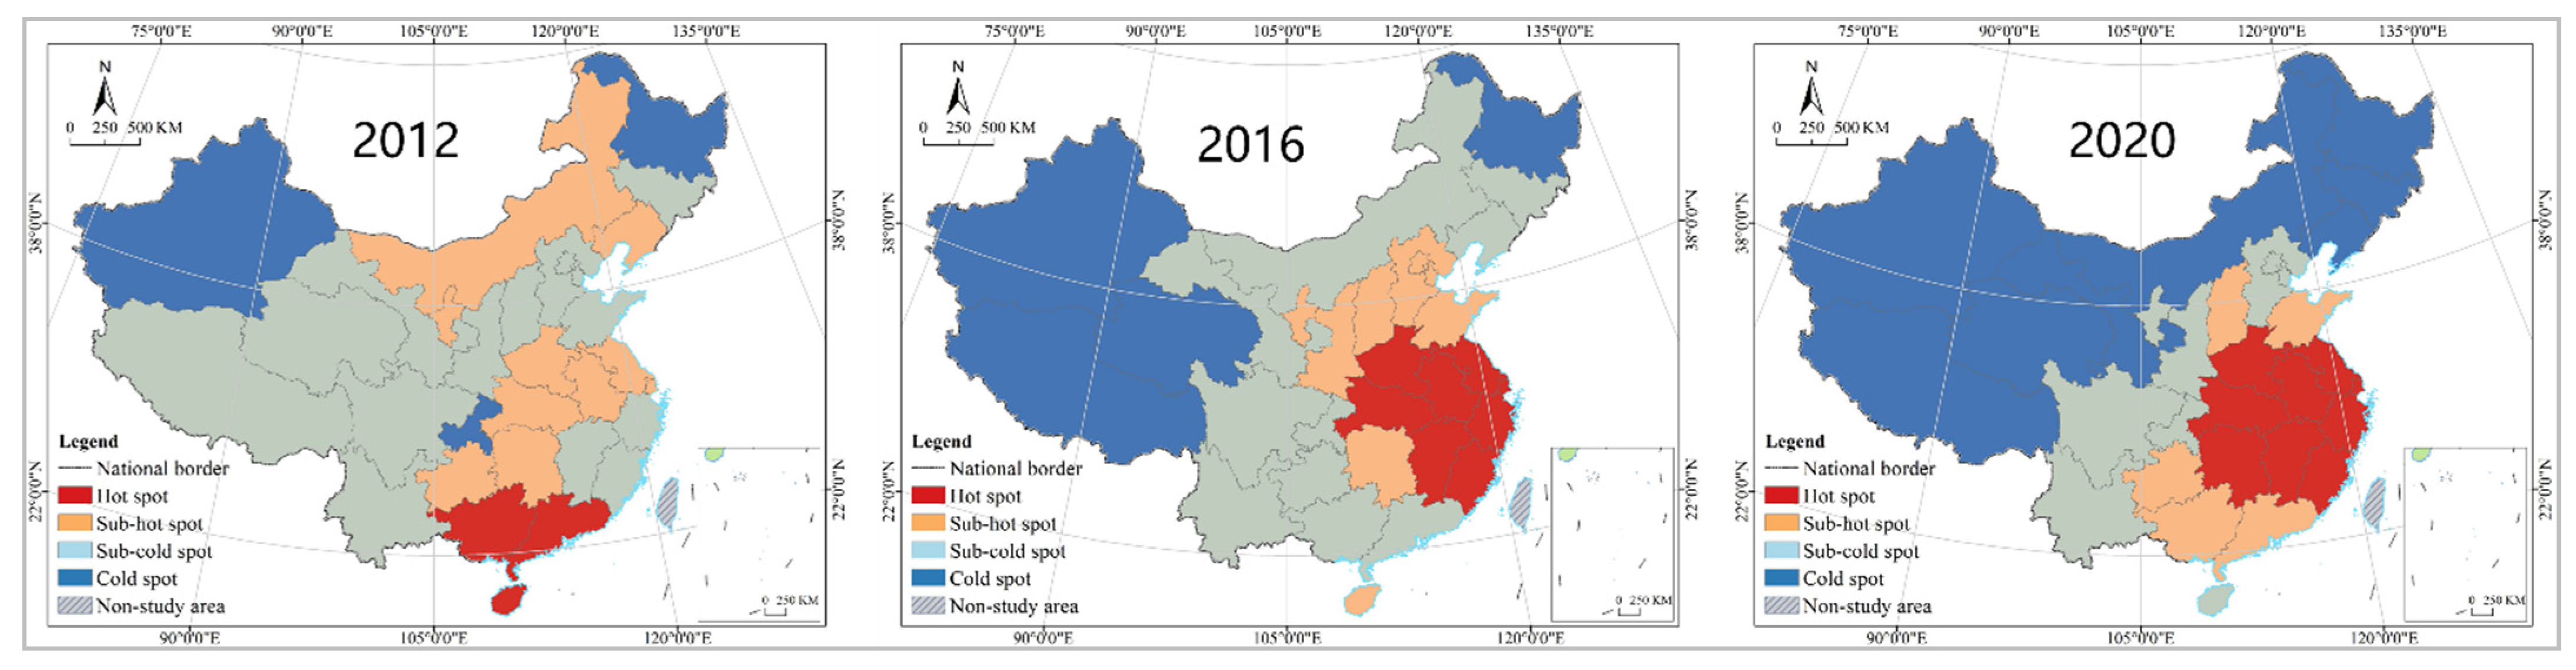
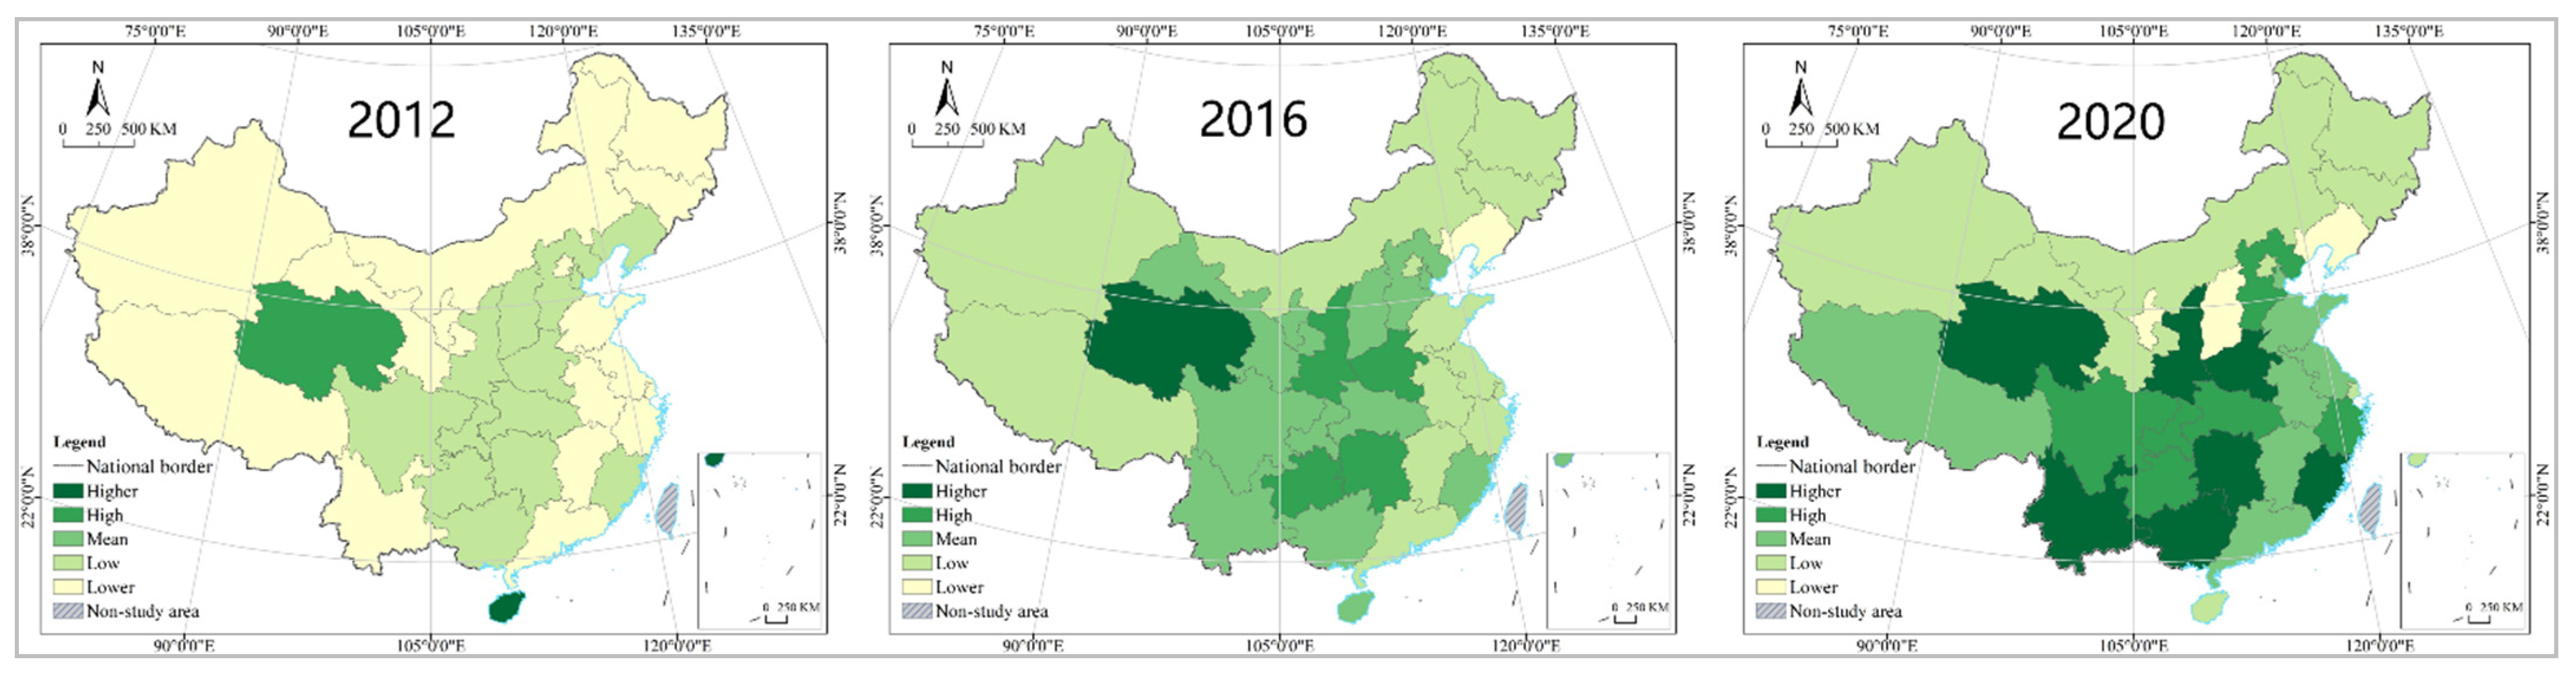
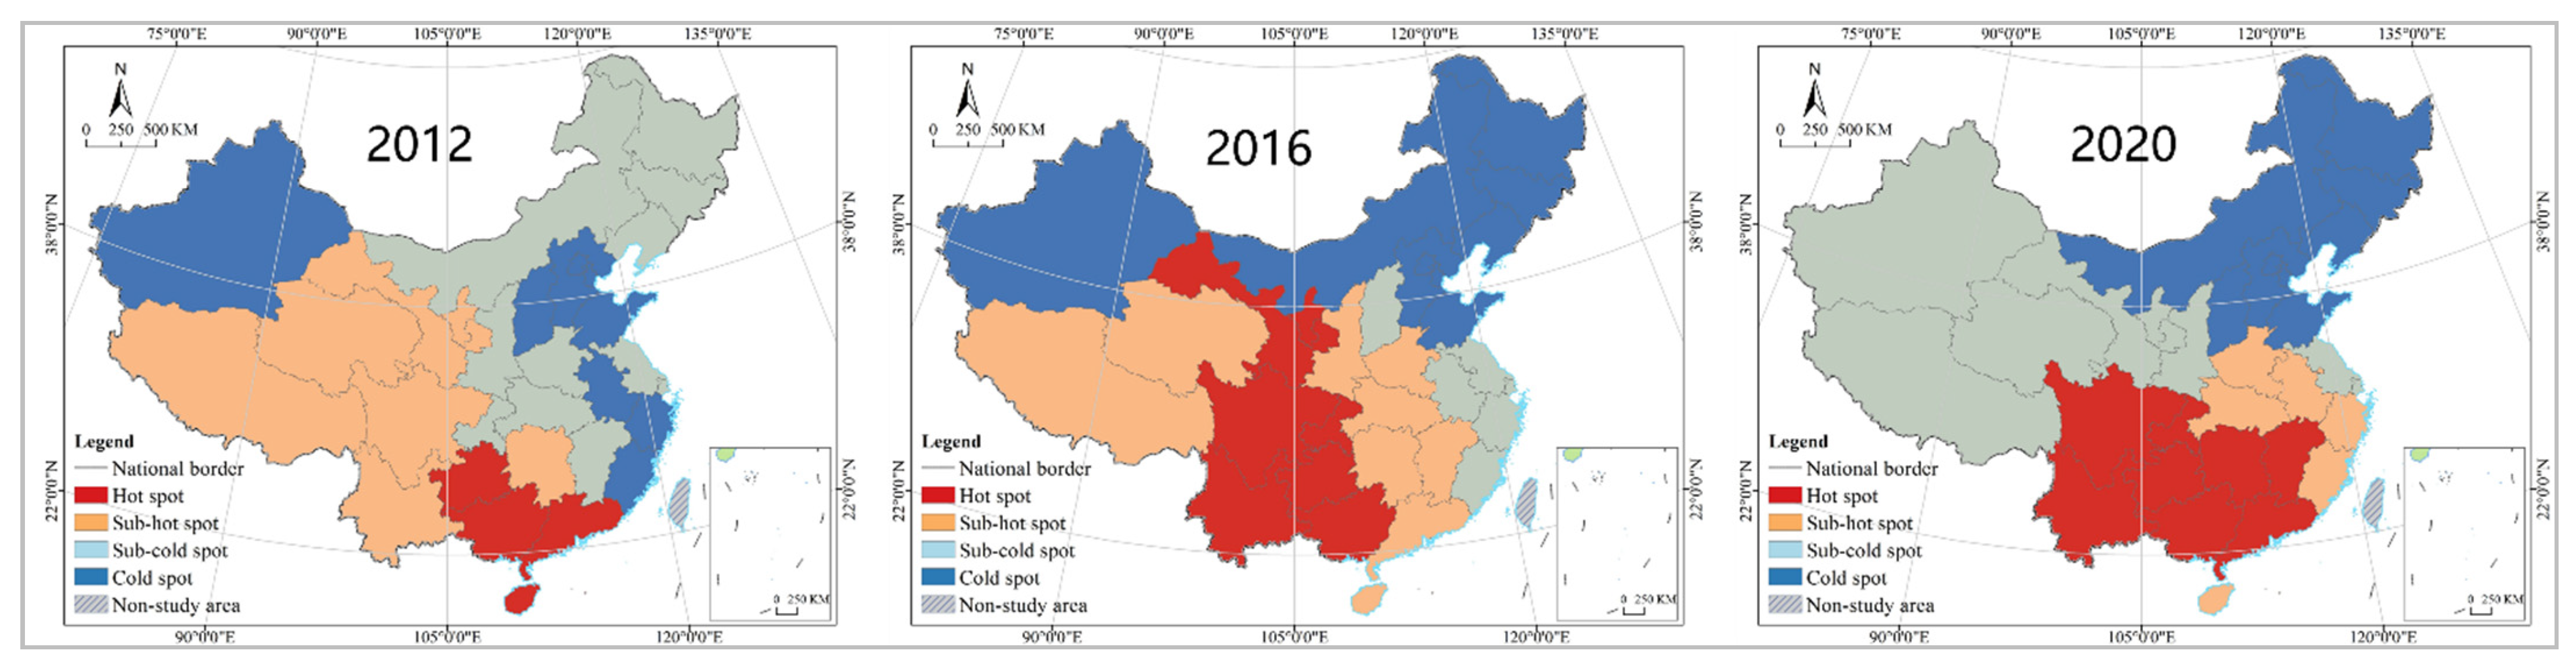
The scale, output efficiencies and development intensities of service-land in China are increasing, with significant inter-provincial differences and levels of agglomeration. From the perspective of time series analysis, trends in the change of service-land includes regions with trends in forms of a “J”, “U”, and “inverted U”, alongside stable regions, and the development trend is increasingly differentiated. From the perspective of spatial cluster analysis, with 0.2 as the step distance, the 31 provinces are divided into 5 categories of higher-, high-, mean-, low- and lower-levels according to the share of service-land. The service-land scale was always dominated by the low-level, and the output efficiency and development intensity of service-land have been gradually transformed from being low- and lower-level oriented to high- and higher-level oriented. In addition, the spatial pattern of service-land scale, output efficiency and development intensity are changing greatly, and the 5 types of regions have prominent levels of spatial agglomeration and regularity characteristics. From the cluster analysis of cold- and hot-spots, the spatial pattern of service-land scale is stable, with a gradual change from east to middle to west; the service-land output efficiencies and development intensities have prominent spatial agglomeration characteristics, but the agglomeration areas of cold- and hot-spots change greatly in different periods.
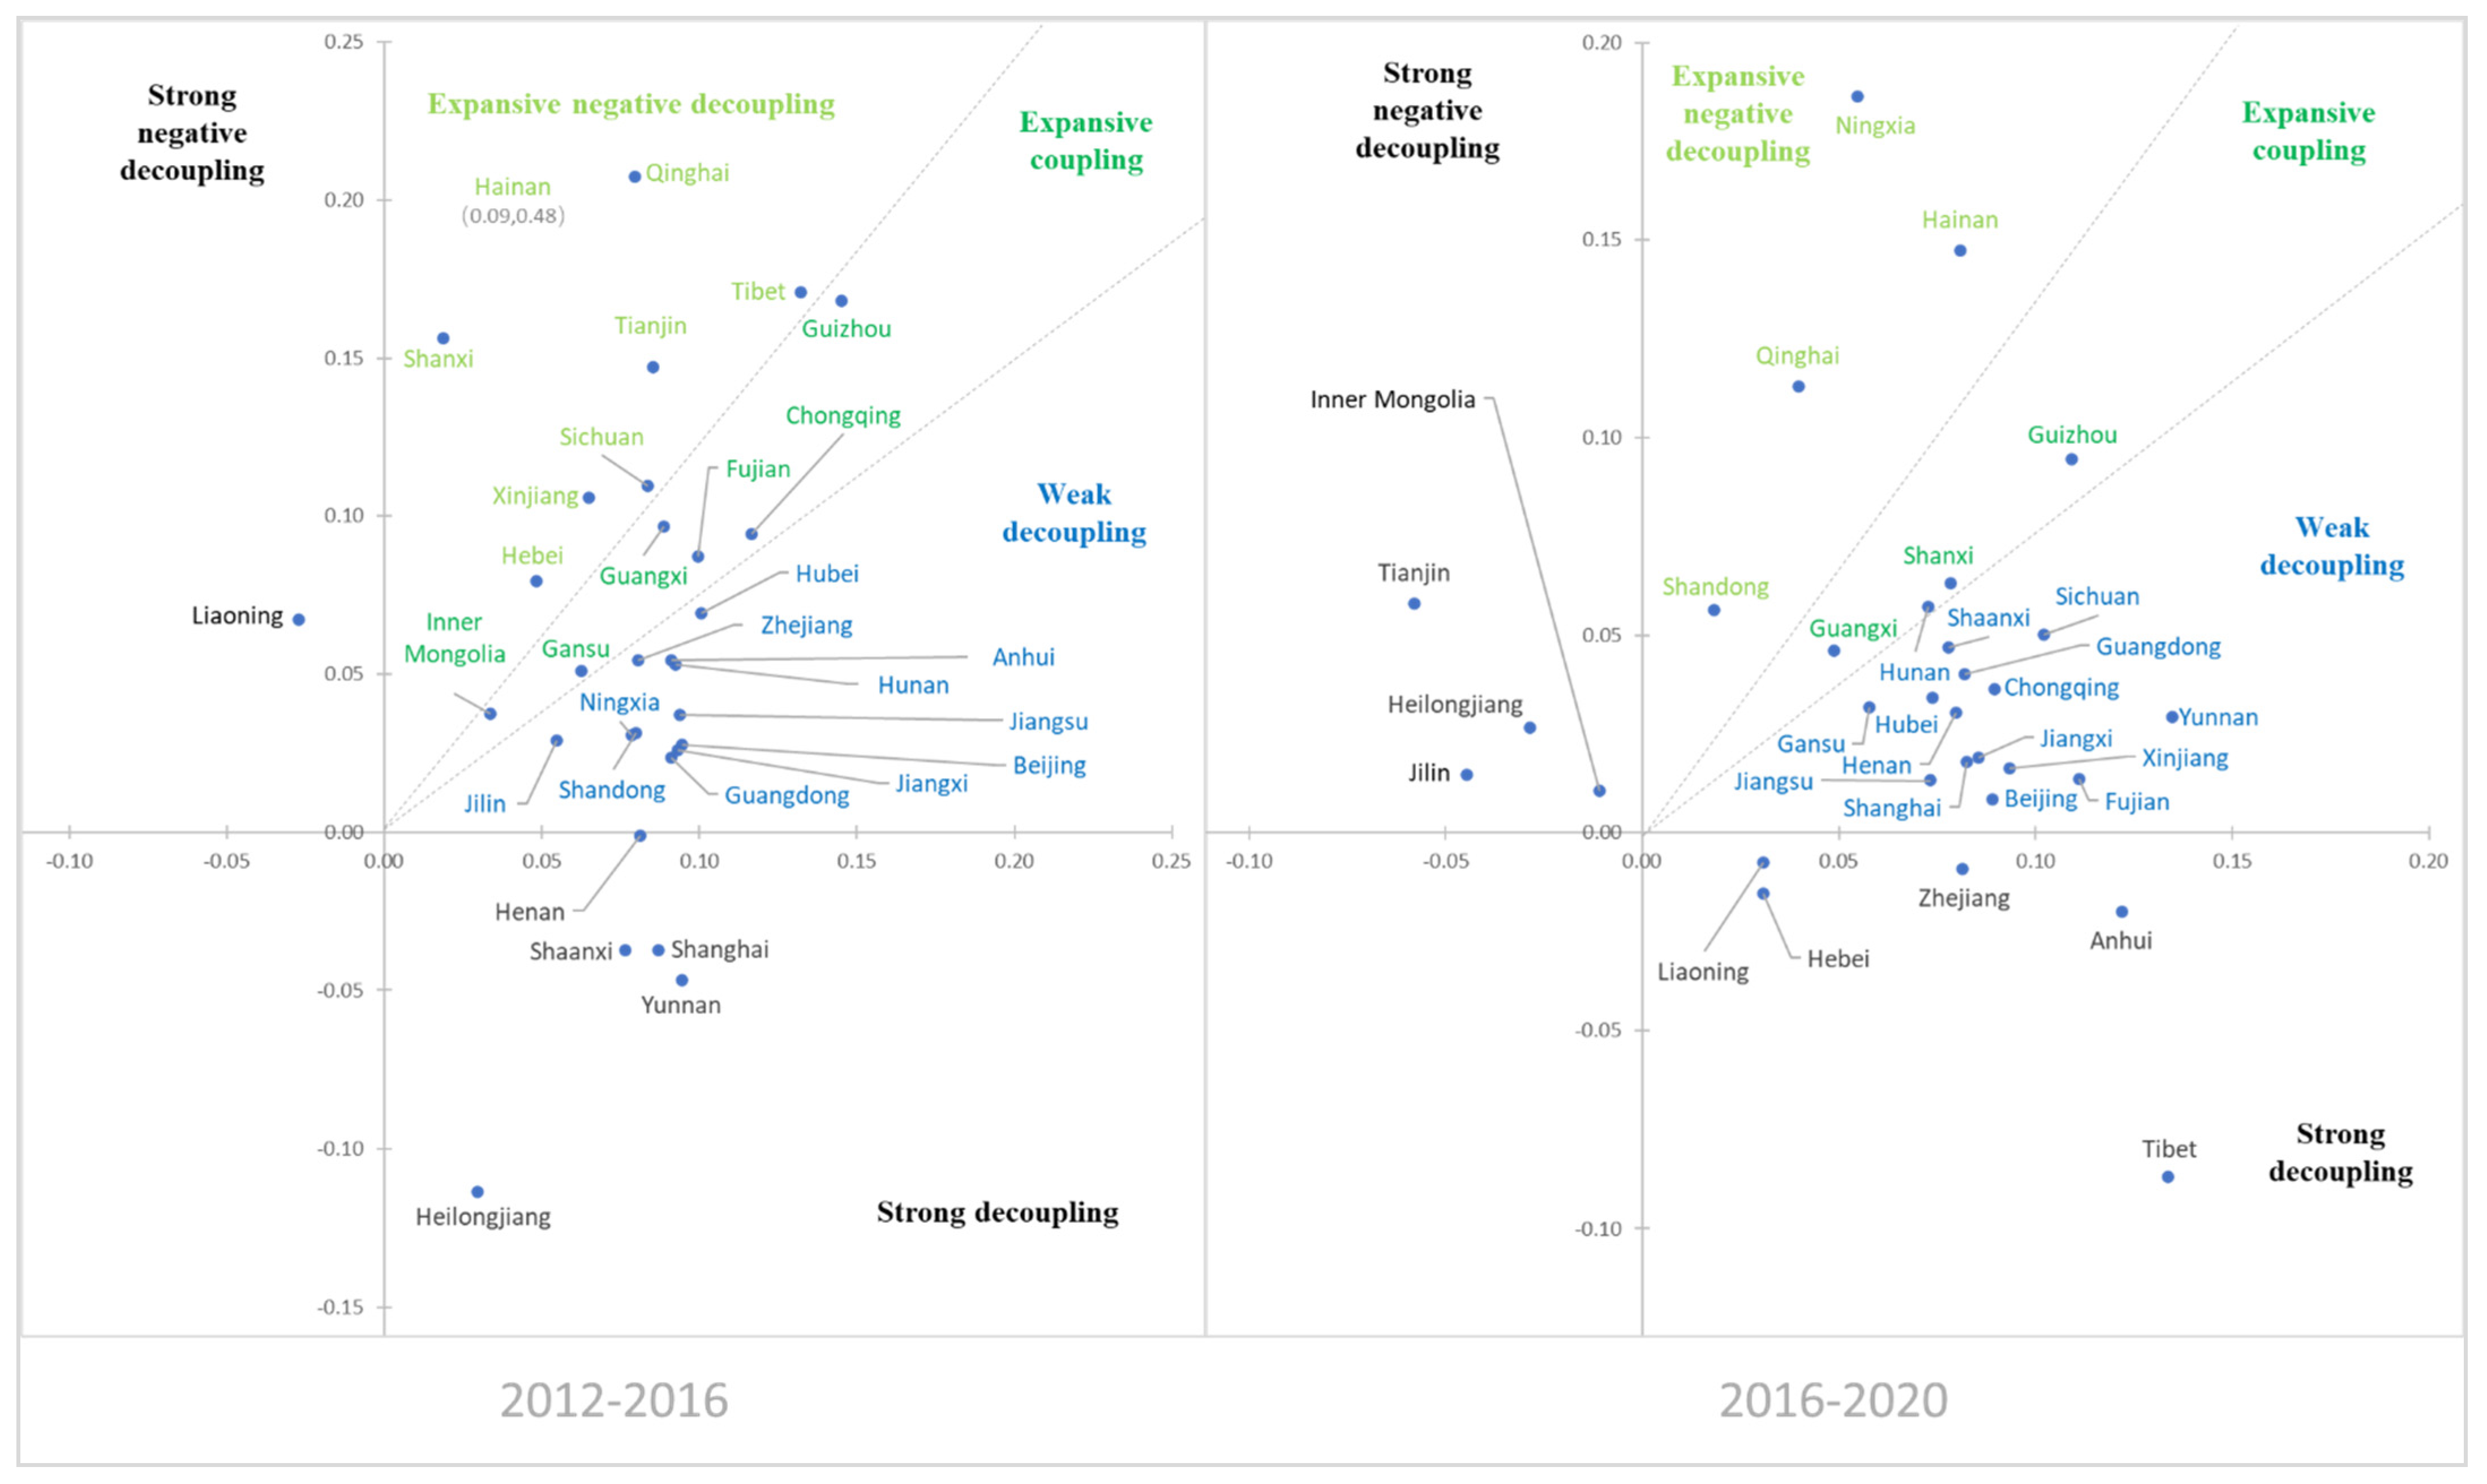
(2)
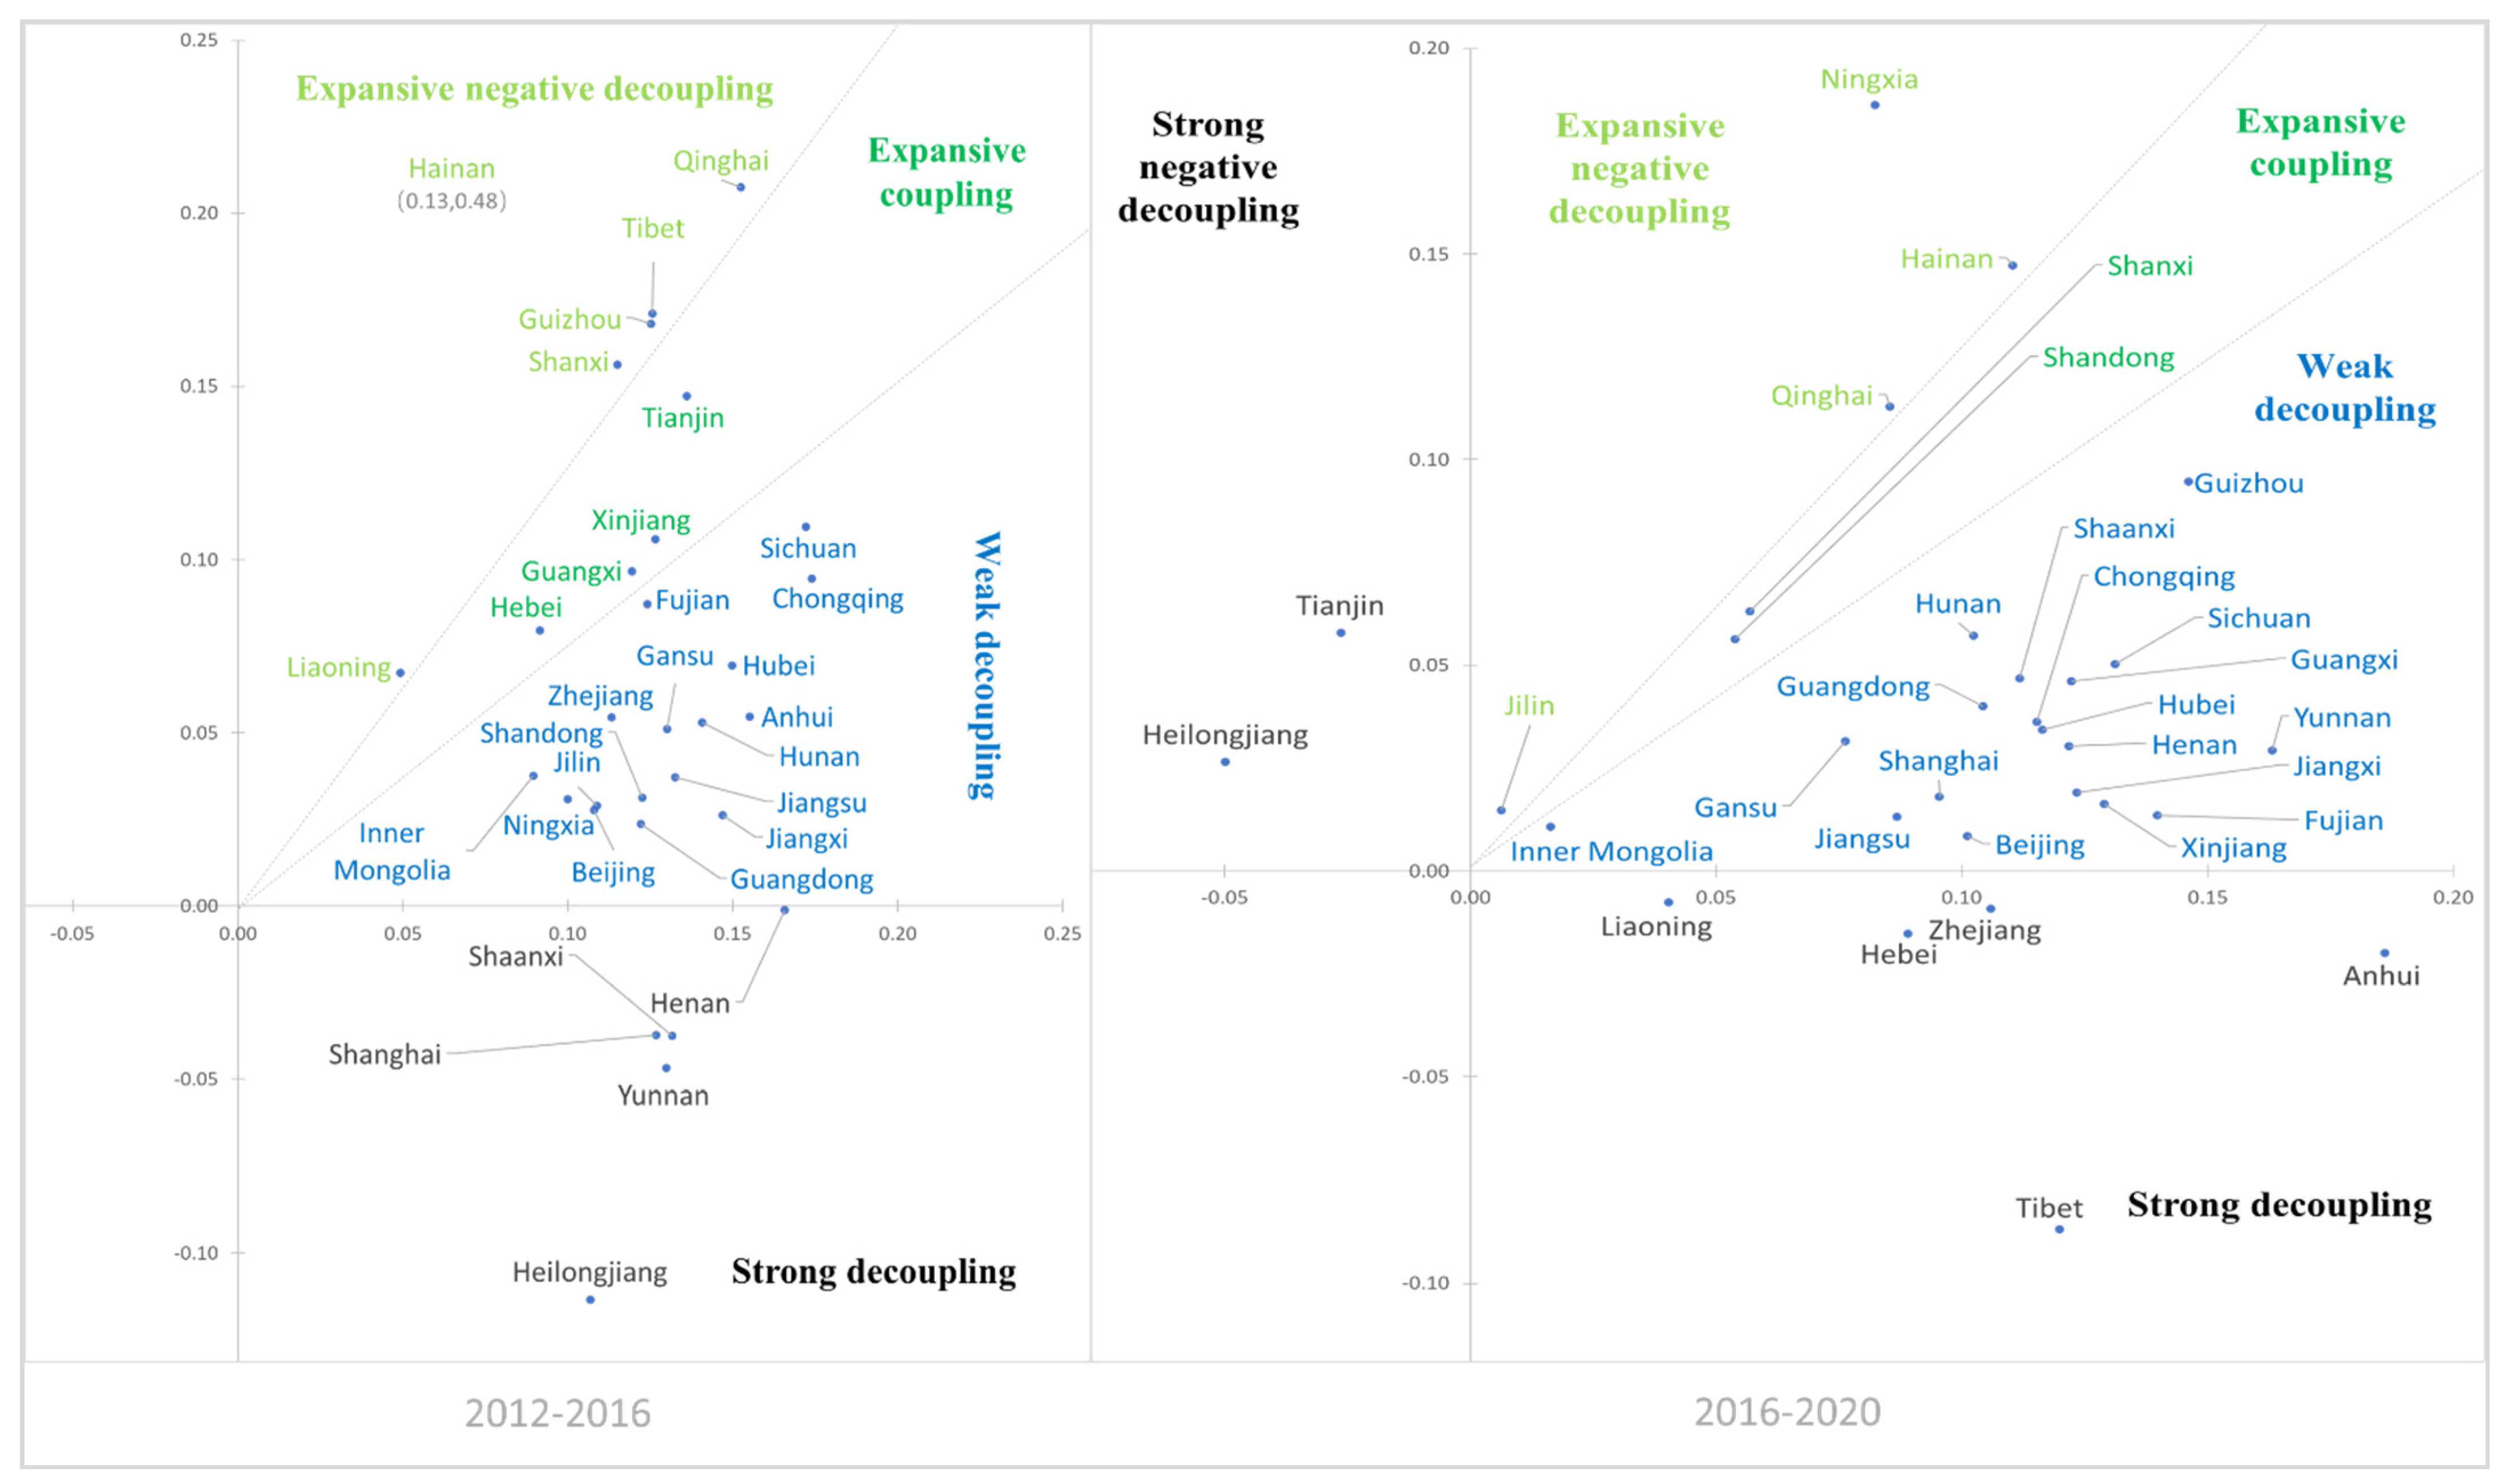
Among Tapio’s 8 types of decoupling, 5 are shown in the results of our analysis that used the decoupling model of service-land and economic development for 2012–2020, these included strong decoupling, weak decoupling, expansive coupling, expansive negative decoupling, and strong negative decoupling. Most provinces and cities are in a state of weak decoupling, with only a few in the best state (strong decoupling), and some in the worst state of strong negative decoupling. This indicates that the development of China’s service-industry still depends on the input of land-resources, and that promoting early decoupling between the two is an important task for achieving high-quality development.
(3)
There are many factors driving the changes in service-land, and the relationship between factors is becoming more complicated and diversified. Urban construction-land area, added value of secondary industry, urban industry-land area, number of enterprises with e-business transactions, total retail sales of social consumer goods are critical factors, and their direct forcing is prominent. Gross domestic product, total retail sales of social consumer goods and number of people over 65 are important factors, and they are driven synergistically by direct and indirect forces. Number of people over 65, resident population, foreign direct investment, per capita disposable income of residents, and number of mobile internet users are super-interaction factors, and they mainly exert their influence by indirect forces. The direct and indirect forces of factors such as population urbanization rate and per capita consumption expansion of residents are weak, and they mainly play an auxiliary driving role.
From the perspective of theoretical research, this paper provides a new approach for researchers in economics, geography and planning to study the evolutionary trends of service-land, and helps to reveal the patterns of service-land change and its driving mechanisms. From a practical perspective, India, Iran, Kazakhstan, South Korea, Malaysia, Egypt, Russia, Argentina, Turkey, Ukraine and other countries are at the same stage of service-industry development as China. The methods and conclusions of this study are not only applicable to China, but also to them, providing valuable references for their decisions in carrying out land use planning and policy design for service-industries. However, there are some shortcomings in our research. First, our study is based on regions (provinces), and there is no comparative analysis on the scale of countries and cities. Second, this paper is limited to China, and lacks the comparative analysis of countries in different stages of service-industry development, such as the United States, Britain and France that are highly developed, and Vietnam, Indonesia and Nigeria that are relatively undeveloped. These shortcomings will have a negative impact on the overall relevance of the conclusions of this paper, but they also point out the direction for our future research efforts to take. We will gradually address them in follow-up papers.

Author Contributions

Conceptualization, S.Z. and C.G.; methodology, S.Z. and K.Z. (Kaixu Zhao); software, S.Z. and K.Z. (Kaixu Zhao); validation, S.Z. and Y.Y.; formal analysis, S.Z., Y.Y. and K.Z. (Kai Zhu); investigation, S.Z. and Y.Y.; resources, S.Z., Kai Zhu and C.G.; data curation, S.Z. and K.Z. (Kaixu Zhao); writing—original draft preparation, S.Z. and Y.Y.; writing—review and editing, C.G. and K.Z. (Kai Zhu); visualization, S.Z. and K.Z. (Kaixu Zhao); supervision, C.G. and K.Z. (Kai Zhu); project administration, C.G. and K.Z. (Kai Zhu); funding, C.G. and K.Z. (Kai Zhu). All authors have read and agreed to the published version of the manuscript.

Funding

The research is funded by the National Natural Science Fund of China (No. 41971165), and Zhejiang Provincial Natural Science Foundation of China (No. LQ19E080017).

Institutional Review Board Statement

Not applicable.

Informed Consent Statement

Not applicable.

Data Availability Statement

The data used in this paper mainly come from the China Statistical Yearbook published national bureau of statistics. and China Urban Construction Statistical Yearbook issued by the Ministry of Housing and Urban-Rural Development of the People’s Republic of China. Most of the data can be obtained by visiting the following links: http://www.mohurd.gov.cn/xytj/tjzljsxytjgb/jstjnj/ (accessed on 18 December 2021) and http://www.stats.gov.cn/tjsj/ndsj/ (accessed on 18 December 2021).

Conflicts of Interest

The authors declare no conflict of interest.

Appendix A

Table A1. Analysis of interaction effects of urban service-land area in 2012.
X 1 X 2 X 3 X 4 X 5 X 6 X 7 X 8 X 9 X 10 X 11 X 12 X 13 X 14 X 15 X 16 X 17 X 18 X 19 X 20
X 1 0.1396
X 2 0.89730.6721
X 3 0.33390.97270.3073
X 4 0.30480.9222 0.36090.1612
X 5 0.90920.99000.92240.90540.8802
X 6 0.86450.98010.85890.85560.98720.8292
X 7 0.89950.99390.90730.89410.90460.98160.8714
X 8 0.30440.98110.35040.30700.92560.86260.91800.2812
X 9 0.86220.98010.86110.85630.98940.88490.97920.87750.8399
X 10 0.85820.98990.85160.85120.98750.89220.98090.87270.86990.8420
X 11 0.81130.98570.81210.80210.99410.89400.98460.83020.87300.86670.7860
X 12 0.74950.99120.77870.75160.93210.88200.92900.78680.89270.89410.89840.7310
X 13 0.75150.98310.77160.77410.92570.85380.93040.77530.89220.87830.87760.85770.7314
X 14 0.86930.99030.89760.86740.91770.98830.92530.88580.98040.98180.99300.93650.93540.8532
X 15 0.91820.98270.90850.92060.93440.96170.93810.93120.98870.99570.99640.93460.91460.93650.8788
X 16 0.89270.99430.91260.89740.91950.97870.91140.92890.99540.99050.99500.92290.92650.92280.93340.8681
X 17 0.85100.98550.85580.86300.93380.98500.91840.85860.99660.97770.97480.93150.88520.92450.93530.92670.8311
X 18 0.86210.99540.85670.85500.92950.97960.93820.85790.99010.97420.99430.93460.89140.91110.93770.93840.88400.8462
X 19 0.86260.96860.86870.87200.93720.98770.93820.87500.98930.99460.98040.94070.89950.91690.93790.92870.90020.87630.8542
X 20 0.91660.80530.95370.92130.98560.98610.99050.94470.98210.98310.97720.99940.98290.97020.99030.98950.98920.98790.98700.7680
Remarks: ※ represents Enhance, nonlinear, and the others are Enhance, bi-.
Table A2. Analysis of interaction effects of urban service-land area in 2016.
X 1 X 2 X 3 X 4 X 5 X 6 X 7 X 8 X 9 X 10 X 11 X 12 X 13 X 14 X 15 X 16 X 17 X 18 X 19 X 20
X 1 0.3314
X 2 0.96050.7014
X 3 0.39810.94480.2930
X 4 0.37840.96120.32060.2852
X 5 0.93590.98440.93890.93160.8704
X 6 0.47430.96330.33190.39440.92500.2343
X 7 0.90660.99150.88010.87520.99590.94190.8686
X 8 0.82010.99320.80590.80930.91190.82000.98190.7450
X 9 0.71480.96290.65410.67440.92410.67080.96100.79030.6146
X 10 0.83200.99180.79940.80480.95290.81350.96970.93650.77220.7302
X 11 0.78900.98680.74840.74550.99510.79510.99590.96460.81060.78500.6941
X 12 0.97450.83740.97340.96760.98550.98080.99230.99300.97630.99480.99640.8007
X 13 0.90770.90920.88170.88440.95110.92580.92450.94390.94530.94630.97180.92130.7682
X 14 0.91680.95990.91110.90950.91700.94540.98740.88810.89410.95370.99620.99410.93990.8689
X 15 0.76710.97480.70230.68860.90400.67120.96730.81940.71330.79100.80720.99050.94690.92830.6063
X 16 0.82300.98730.76970.76050.95930.73220.99670.83570.76770.82380.87080.98110.96080.96010.73870.6676
X 17 0.94370.98460.93060.93200.95050.94840.99100.94780.94570.95020.99630.98870.94930.95070.94730.95800.9249
X 18 0.95100.98570.92110.92160.94940.93240.98980.92500.92560.93400.97820.99540.95000.94300.94730.94950.93290.9036
X 19 0.93090.98310.92100.92800.99630.99370.92540.98870.99500.99360.99600.99230.93050.98850.99330.99740.98650.97900.8970
X 20 0.97360.85130.96470.95130.94880.95730.99610.97090.97680.97620.96790.84840.92630.97450.95560.98760.99430.97630.99660.7632
Table A3. Analysis of interaction effects of urban service-land area in 2020.
X 1 X 2 X 3 X 4 X 5 X 6 X 7 X 8 X 9 X 10 X 11 X 12 X 13 X 14 X 15 X 16 X 17 X 18 X 19 X 20
X 1 0.1234
X 2 0.9391 0.7452
X 3 0.64970.96150.6153
X 4 0.32530.94700.66680.2802
X 5 0.87840.95770.97480.88970.8518
X 6 0.33910.93230.71730.38390.91930.3069
X 7 0.88510.99460.99460.88180.91730.90130.8720
X 8 0.87740.98200.99730.88340.90430.90250.90920.8712
X 9 0.9565 0.98930.97860.9589 0.96860.9625 0.97880.98850.5980
X 10 0.77150.97750.97530.76860.88720.80790.91060.91410.93490.6973
X 11 0.64980.97120.96000.66380.98250.71670.98880.96460.96730.77090.6120
X 12 0.9587 0.82520.97900.97800.99530.98260.99800.98380.98900.97460.98910.7859
X 13 0.86170.79190.97430.88770.87930.86830.91220.90290.98510.90150.97580.83540.7261
X 14 0.88500.99430.99680.88610.88720.91510.90690.88610.96870.88750.96820.99690.89440.8518
X 15 0.65000.98700.97170.67540.99380.70750.98380.98740.97710.76430.68010.97920.99020.98710.6229
X 16 0.71980.95340.99670.71990.94050.73060.94190.93850.99420.78560.77490.99600.92950.93960.76850.6865
X 17 0.88280.98070.99800.89980.88470.90320.91730.88780.96650.87710.98470.97400.89140.88860.97900.93990.8624
X 18 0.88530.98300.99760.90610.88620.90420.90660.88690.96830.88980.98130.98320.90240.88390.98720.93650.87430.8572
X 19 0.89780.98350.99730.91170.90470.91960.91200.90500.99620.91000.98060.99770.89970.91690.99280.93890.90480.90470.8896
X 20 0.9373 0.81990.97450.94800.98940.96040.99620.98110.98940.97630.97810.80300.82810.99420.98420.99430.97670.98110.99250.7673
Remarks: ※ represents Enhance, nonlinear, and the others are Enhance, bi-.

References

  1. Cuadrado-Roura, J.R. Deindustrialization and tertiarization. Progress towards an increasing service-industry integration. Trimest. Econ. 2021, 88, 719–768. [Google Scholar] [CrossRef]
  2. Eichengreen, B.; Gupta, P. The two waves of service-sector growth. Oxf. Econ. Pap.-New Ser. 2013, 65, 96–123. [Google Scholar] [CrossRef] [Green Version]
  3. Kim, J.; Wood, J. Service sector development in Asia: An important instrument of growth. Asian-Pac. Econ. Lit. 2020, 34, 12–25. [Google Scholar] [CrossRef]
  4. Lee, J.W.; McKibbin, W.J. Service sector productivity and economic growth in Asia. Econ. Model. 2018, 74, 247–263. [Google Scholar] [CrossRef] [Green Version]
  5. David, A.H. A service sector classification scheme using economic data. Serv. Ind. J. 2014, 34, 335–353. [Google Scholar] [CrossRef]
  6. Borel-Saladin, J.; Crankshaw, O. Social Polarisation or Professionalisation? Another Look at Theory and Evidence on Deindustrialisation and the Rise of the Service Sector. Urban Stud. 2009, 46, 645–664. [Google Scholar] [CrossRef]
  7. Liao, J.M. The rise of the service sector in China. China Econ. Rev. 2020, 59, 101385. [Google Scholar] [CrossRef]
  8. Fan, W.J.; Pan, J.D.; Zhou, M.H. An Explanation of the Underdevelopment of China’s Service Sector from the Perspective of Demand. Emerg. Mark. Financ. Trade 2019, 56, 3044–3059. [Google Scholar] [CrossRef]
  9. Wu, Z.H.; Yin, J.W.; Deng, S.G.; Wu, J.; Li, Y.; Chen, L. Modern Service Industry and Crossover Services: Development and Trends in China. IEEE Trans. Serv. Comput. 2016, 9, 664–671. [Google Scholar] [CrossRef]
  10. Li, Y.; Yuan, F. Business-promoted city-regionalism? New Industrial City projects by China Fortune Land Development. Reg. Stud. 2021, 29, 1947484. [Google Scholar] [CrossRef]
  11. Guo, S.; Liu, L.Z.; Zhao, Y. The business cycle implications of land financing in China. Econ. Model. 2015, 46, 225–237. [Google Scholar] [CrossRef]
  12. Meyssonnier, F. Service industry management control: A reflexion about its essence and tools. Comptab. Controle Audit 2012, 18, 73–97. [Google Scholar] [CrossRef] [Green Version]
  13. Gonzalez-Cruz, T.F.; Roig-Tierno, N.; Botella-Carrubi, D. Quality management as a driver of innovation in the service industry. Serv. Bus. 2018, 12, 505–524. [Google Scholar] [CrossRef]
  14. Zhong, Y.; Wei, Y.D. Economic Transition, Urban Hierarchy, and Service Industry Growth in China. Tijdschr. Voor Econ. Soc. Geogr. 2018, 109, 189–209. [Google Scholar] [CrossRef]
  15. Imbrogiano, J.P. Contingency in Business Sustainability Research and in the Sustainability Service Industry: A Problematization and Research Agenda. Organ. Environ. 2020, 34, 298–322. [Google Scholar] [CrossRef]
  16. Cao, Y.H.; Jiang, Z.R.; Ye, S.L.; Wu, W.; Liang, S.B. Spatial Pattern and Heterogeneity of Port & Shipping Service Enterprises in the Yangtze River Delta, 2002-2016. Chin. Geogr. Sci. 2019, 29, 474–487. [Google Scholar] [CrossRef] [Green Version]
  17. Wang, J.J.; Zhang, X.H.; Yeh, A.G.O. Spatial proximity and location dynamics of knowledge-intensive business service in the Pearl River Delta, China. Habitat Int. 2016, 53, 390–402. [Google Scholar] [CrossRef]
  18. De Dominicis, L.; Arbia, G.; De Groot, H.L.F. Concentration of Manufacturing and Service Sector Activities in Italy: Accounting for Spatial Dependence and Firm Size Distribution. Reg. Stud. 2013, 47, 405–418. [Google Scholar] [CrossRef]
  19. Liu, J.G.; Zhao, M.Y. Study on Evolution and Interaction of Service Industry Agglomeration and Efficiency of Hebei Province China. Complexity 2020, 2020, 1750430. [Google Scholar] [CrossRef]
  20. Fu, Y.; Yang, X.M.; Wang, T.; Supriyadi, A.; Cirella, G.T. Spatial Pattern Characteristics of the Financial Service Industry: Evidence from Nanjing, China. Appl. Spat. Anal. Policy 2021, 20, 9409. [Google Scholar] [CrossRef]
  21. Sun, C.Z.; Sun, C.; Yang, Z.S.; Zhang, J.K.; Deng, Y. Urban Land Development for Industrial and Commercial Use: A Case Study of Beijing. Sustainability 2016, 8, 1323. [Google Scholar] [CrossRef] [Green Version]
  22. Cheng, J. Analysis of commercial land leasing of the district governments of Beijing in China. Land Use Policy 2021, 100, 104881. [Google Scholar] [CrossRef]
  23. Murakami, J.; Chang, Z. Polycentric development under public leasehold: A spatial analysis of commercial land use rights. Reg. Sci. Urban Econ. 2018, 71, 25–36. [Google Scholar] [CrossRef]
  24. Nichols, J.B.; Oliner, S.D.; Mulhall, M.R. Swings in commercial and residential land prices in the United States. J. Urban Econ. 2013, 73, 57–76. [Google Scholar] [CrossRef]
  25. Garang, Z.; Wu, C.F.; Li, G.; Zhuo, Y.F.; Xu, Z.G. Spatio-Temporal Non-Stationarity and Its Influencing Factors of Commercial Land Price: A Case Study of Hangzhou, China. Land 2021, 10, 317. [Google Scholar] [CrossRef]
  26. Ustaoglu, E.; Silva, F.B.E.; Lavalle, C. Quantifying and modelling industrial and commercial land-use demand in France. Environ. Dev. Sustain. 2020, 22, 519–549. [Google Scholar] [CrossRef]
  27. Silva, F.B.E.; Koomen, E.; Diogo, V.; Lavalle, C. Estimating Demand for Industrial and Commercial Land Use Given Economic Forecasts. PLoS ONE 2014, 9, e91991. [Google Scholar] [CrossRef] [Green Version]
  28. Zhou, L.; Zhang, W.J.; Fang, C.Y.; Sun, H.Y.; Lin, J. Actors and network in the marketization of rural collectively-owned commercial construction land (RCOCCL) in China: A pilot case of Langfa, Beijing. Land Use Policy 2020, 99, 104990. [Google Scholar] [CrossRef]
  29. Chen, Z.; Zhuo, Y.F.; Li, G.; Xu, Z.G. What Drives Different Governance Modes and Marketization Performance for Collective Commercial Construction Land in Rural China? Land 2021, 10, 319. [Google Scholar] [CrossRef]
  30. Sohn, D.W. Do all commercial land uses deteriorate neighborhood safety? Examining the relationship between commercial land-use mix and residential burglary. Habitat Int. 2016, 55, 148–158. [Google Scholar] [CrossRef]
  31. Browning, C.R.; Byron, R.A.; Calder, C.A.; Krivo, L.J.; Kwan, M.P.; Lee, J.Y.; Peterson, R.D. Commercial Density, Residential Concentration, and Crime: Land Use Patterns and Violence in Neighborhood Context. J. Res. Crime Delinq. 2010, 47, 329–357. [Google Scholar] [CrossRef]
  32. Izanloo, A.; Rafsanjani, A.K.; Ebrahimi, S.P. Effect of Commercial Land Use and Accessibility Factor on Traffic Flow in Bojnourd. J. Urban Plan. Dev. 2017, 143, 05016016. [Google Scholar] [CrossRef]
  33. Yang, H.J.; Song, J.; Choi, M.J. Measuring the Externality Effects of Commercial Land Use on Residential Land Value: A Case Study of Seoul. Sustainability 2016, 8, 432. [Google Scholar] [CrossRef] [Green Version]
  34. Langer, S.; Korzhenevych, A. The effect of industrial and commercial land consumption on municipal tax revenue: Evidence from Bavaria. Land Use Policy 2018, 77, 279–287. [Google Scholar] [CrossRef]
  35. Zhang, M.Y.; Chen, Q.X.; Zhang, K.W.; Yang, D.Y. Will Rural Collective-Owned Commercial Construction Land Marketization Impact Local Governments’ Interest Distribution? Evidence from Mainland China. Land 2021, 10, 209. [Google Scholar] [CrossRef]
  36. De Fuentes, C.; Dutrenit, G.; Santiago, F.; Gras, N. Determinants of Innovation and Productivity in the Service Sector in Mexico. Emerg. Mark. Financ. Trade 2015, 51, 578–592. [Google Scholar] [CrossRef] [Green Version]
  37. Tang, R.; Xiu, P.S. The modern service industry agglomeration and tourism efficiency in China: Regional difference and influencing mechanism. J. Asia Pac. Econ. 2021, 12, 1955529. [Google Scholar] [CrossRef]
  38. Wen, S.P.; Shi, J.G.; Zhang, W. Impact of Urban Rail Transit Network on Residential and Commercial Land Values in China: A Complex Network Perspective. Complexity 2021, 2021, 8849066. [Google Scholar] [CrossRef]
  39. Kim, S.; Byun, J. Identifying spatiotemporally-varying effects of a newly built subway line on land price: Difference and correlation between commercial and residential uses. Int. J. Sustain. Transp. 2020, 15, 364–374. [Google Scholar] [CrossRef]
  40. Wang, L.; Yuan, F.; Duan, X.J. How high-speed rail service development influenced commercial land market dynamics: A case study of Jiangsu province, China. J. Transp. Geogr. 2018, 72, 248–257. [Google Scholar] [CrossRef]
  41. Shao, S.; Tian, Z.H.; Yang, L.L. High speed rail and urban service industry agglomeration: Evidence from China’s Yangtze River Delta region. J. Transp. Geogr. 2017, 64, 174–183. [Google Scholar] [CrossRef]
  42. Tian, M.; Li, T.P.; Yang, S.W.; Wang, Y.W.; Fu, S.K. The Impact of High-Speed Rail on the Service-Sector Agglomeration in China. Sustainability 2019, 11, 2128. [Google Scholar] [CrossRef] [Green Version]
  43. Tian, M.; Li, T.P.; Ye, X.Y.; Zhao, H.S.; Meng, X. The impact of high-speed rail on service industry agglomeration in peripheral cities. Transp. Res. Part D-Transp. Environ. 2021, 93, 102745. [Google Scholar] [CrossRef]
  44. Yang, L.Y.; Hu, L.Q.; Shang, P.; Ye, Y.M. Estimating the Impacts of High-speed Rail on Service Industry Agglomeration in China. J. Transp. Econ. Policy 2021, 55, 16–35. [Google Scholar]
  45. Sheng, J.F.; Xu, H.; Zheng, J.Y.; Luo, M.D.; Zhou, X. Commercial Value Assessment of “Grey Space” under Overpasses: Analytic Hierarchy Process. Adv. Civ. Eng. 2018, 2018, 4970697. [Google Scholar] [CrossRef] [Green Version]
  46. Wang, H.; Zhang, M.Q. Does China’s transportation infrastructure have an impact on employment in the service sector? Kybernetes 2020, 49, 2737–2753. [Google Scholar] [CrossRef]
  47. Gupta, S. Decoupling: A step toward sustainable development with reference to OECD countries. Int. J. Sustain. Dev. World Ecol. 2015, 22, 510–519. [Google Scholar] [CrossRef]
  48. Longhofer, W.; Jorgenson, A. Decoupling reconsidered: Does world society integration influence the relationship between the environment and economic development? Soc. Sci. Res. 2017, 65, 17–29. [Google Scholar] [CrossRef]
  49. Casadio Tarabusi, E.; Guarini, G. An axiomatic approach to decoupling indicators for green growth. Ecol. Indic. 2018, 84, 515–524. [Google Scholar] [CrossRef]
  50. Tapio, P. Towards a theory of decoupling: Degrees of decoupling in the EU and the case of road traffic in Finland between 1970 and 2001. Transp. Policy 2005, 12, 137–151. [Google Scholar] [CrossRef] [Green Version]
  51. Trubins, R. Land-use change in southern Sweden: Before and after decoupling. Land Use Policy 2013, 33, 161–169. [Google Scholar] [CrossRef]
  52. Guo, S.S.; Wang, Y.H.; Huang, J.; Dong, J.H.; Zhang, J. Decoupling and Decomposition Analysis of Land Natural Capital Utilization and Economic Growth: A Case Study in Ningxia Hui Autonomous Region, China. Int. J. Environ. Res. Public Health 2021, 18, 646. [Google Scholar] [CrossRef]
  53. Grand, M.C. Carbon emission targets and decoupling indicators. Ecol. Indic. 2016, 67, 649–656. [Google Scholar] [CrossRef]
  54. Schandl, H.; Hatfield-Dodds, S.; Wiedmann, T.; Geschke, A.; Cai, Y.Y.; West, J.; Newth, D.; Baynes, T.; Lenzen, M.; Owen, A. Decoupling global environmental pressure and economic growth: Scenarios for energy use, materials use and carbon emissions. J. Clean. Prod. 2016, 132, 45–56. [Google Scholar] [CrossRef]
  55. Song, Y.; Sun, J.J.; Zhang, M.; Su, B. Using the Tapio-Z decoupling model to evaluate the decoupling status of China’s CO2 emissions at provincial level and its dynamic trend. Struct. Change Econ. Dyn. 2020, 52, 120–129. [Google Scholar] [CrossRef]
  56. Lu, Z.W.; Wang, H.M.; Yue, Q. Decoupling Analysis of the Environmental Mountainwith Case Studies from China. J. Ind. Ecol. 2015, 19, 1082–1090. [Google Scholar] [CrossRef]
  57. Wang, J.F.; Li, X.H.; Christakos, G.; Liao, Y.L.; Zhang, T.; Gu, X.; Zheng, X.Y. Geographical detectors-based health risk assessment and its application in the neural tube defects study of the Heshun region, China. Int. J. Geogr. Inf. Sci. 2010, 24, 107–127. [Google Scholar] [CrossRef]
  58. Wang, J.F.; Hu, Y. Environmental health risk detection with GeogDetector. Environ. Model. Softw. 2012, 33, 114–115. [Google Scholar] [CrossRef]
  59. Zhang, P.; Li, W.; Zhao, K.; Zhao, S. Spatial Pattern and Driving Mechanism of Urban–Rural Income Gap in Gansu Province of China. Land 2021, 10, 1002. [Google Scholar] [CrossRef]
  60. Zhao, S.; Yan, Y.; Han, J. Industrial Land Change in Chinese Silk Road Cities and Its Influence on Environments. Land 2021, 10, 806. [Google Scholar] [CrossRef]
  61. Zhao, S.; Li, W.; Zhao, K.; Zhang, P. Change Characteristics and Multilevel Influencing Factors of Real Estate Inventory—Case Studies from 35 Key Cities in China. Land 2021, 10, 928. [Google Scholar] [CrossRef]
  62. Guan, X.Y.; Wang, S.L.; Gao, Z.Y.; Lv, Y.; Fu, X.J. Spatio-temporal variability of soil salinity and its relationship with the depth to groundwater in salinization irrigation district. Acta Ecol. Sin. 2012, 32, 198–206. [Google Scholar]
  63. Liu, X.N.; Huang, F.; Wang, P. Spatial Analysis Principle and Method of GIS; Science Press: Beijing, China, 2008; pp. 199–206. [Google Scholar]
  64. Miyamoto, S.; Chacon, A.; Hossain, M.; Martinez, L. Soil salinity of urban turf areas irrigated with saline water I. Spatial variability. Landsc. Urban Plan. 2005, 71, 233–241. [Google Scholar]
  65. She, D.L.; Shao, M.A.; Yu, S.G. Spatial Variability of Soil Water Content on a Cropland-grassland Mixed Slope Land in the Loess Plateau, China. Trans. Chin. Soc. Agric. Mach. 2010, 41, 57–63. [Google Scholar]
  66. Na, J.; Lee, J.D.; Baek, C. Is the service sector different in size heterogeneity? J. Econ. Interact. Coord. 2017, 12, 95–120. [Google Scholar] [CrossRef]
  67. Shen, Y.M.; Qiu, L.; Ren, W.B.; Cao, Y.; Hu, D.; Song, Y.J. Basic characteristics, spatial disparity and its major influencing factors of service industry in China. Chin. Geogr. Sci. 2009, 19, 314–324. [Google Scholar] [CrossRef]
  68. Wang, E.R. The Service Sector in the Chinese Economy: A Geographic Appraisal. Eurasian Geogr. Econ. 2009, 50, 275–300. [Google Scholar] [CrossRef]
  69. Seo, H.J.; Lee, Y.S.; Kim, H.S. Technological Change and Service Industry Market Share. J. Korea Trade 2013, 17, 1–28. [Google Scholar]
  70. Yin, F. Foreign Direct Investment in China’s Service Industry: Effects and Determinants. China-Int. J. 2011, 9, 144. [Google Scholar] [CrossRef]
  71. Lu, T.C.; Lin, Y.S.; Hu, J.L. FDI and Outsourcing in a Service Industry: Welfare Effects of Liberalising Trade and Investment. Econ. Rec. 2014, 90, 74–86. [Google Scholar] [CrossRef]
  72. Griffith, R.; Redding, S.; Simpson, H. Foreign ownership and productivity: New evidence from the service sector and the R&D lab. Oxf. Rev. Econ. Policy 2004, 20, 440–456. [Google Scholar] [CrossRef] [Green Version]
  73. Etchebarne, S.; Zapata, I.T. Export behaviour in Chilean exporters in service sector. Acad.-Rev. Latinoam. De Adm. 2018, 31, 719–735. [Google Scholar] [CrossRef]
  74. Tsai, P.H. Strategic evaluation criteria to assess competitiveness of the service industry in Taiwan. J. Policy Model. 2020, 42, 1287–1309. [Google Scholar] [CrossRef]
  75. Ilmakunnas, P.; Ilmakunnas, S. Work force ageing and expanding service sector: A double burden on productivity? Serv. Ind. J. 2010, 30, 2093–2110. [Google Scholar] [CrossRef]
  76. Eswaran, M.; Kotwal, A. The role of the service sector in the process of industrialization. J. Dev. Econ. 2002, 68, 401–420. [Google Scholar] [CrossRef]
  77. Rahman, M.; Kamal, M.M.; Aydin, E.; Ul Haque, A. Impact of Industry 4.0 drivers on the performance of the service sector: Comparative study of cargo logistic firms in developed and developing regions. Prod. Plan. Control 2020, 12, 1810758. [Google Scholar] [CrossRef]
  78. Yang, L.; Li, L.Y. Fuzzy based association between China’s service industry and downstream manufacturing industry with liberalization effects. J. Intell. Fuzzy Syst. 2021, 40, 8463–8476. [Google Scholar] [CrossRef]
  79. Takahashi, H.; Otsubo, K.P. A new route to the rapid growth of the service sector: Rise of the standard of living. Stud. Nonlinear Dyn. Econom. 2019, 23, 20190018. [Google Scholar] [CrossRef]
  80. Gonzalez-Blanco, J.; Coca-Perez, J.L.; Guisado-Gonzalez, M. Relations between technological and non-technological innovations in the service sector. Serv. Ind. J. 2019, 39, 134–153. [Google Scholar] [CrossRef]
  81. Micucci, G.; Di Giacinto, V. The Producer Service Sector in Italy: Long-term Growth and its Local Determinants. Spat. Econ. Anal. 2009, 4, 391–425. [Google Scholar] [CrossRef]
  82. Hu, Y.H.; Wang, M.M. Impact of resource reconfiguration on total factor productivity of service industry. Int. J. Electr. Eng. Educ. 2020, 10, 0020720920940579. [Google Scholar] [CrossRef]
  83. Wu, Y.Z.; Fan, P.L.; You, H.Y. Spatial Evolution of Producer Service Sectors and Its Influencing Factors in Cities: A Case Study of Hangzhou, China. Sustainability 2018, 10, 975. [Google Scholar] [CrossRef] [Green Version]
Figure 1. Study area.
Land 11 00013 g001
Figure 2. Comparative analysis on the proportion of secondary and tertiary industry.
Land 11 00013 g002
Figure 3. Comparative analysis on the scale and proportion of urban service-land.
Land 11 00013 g003
Figure 4. Comparative analysis on average annual growth of urban service-land.
Land 11 00013 g004
Figure 5. Decoupling types and Decoupling indicator ranges.
Land 11 00013 g005
Figure 6. Research steps.
Land 11 00013 g006
Figure 7. Analysis of average and coefficient of variation from 2012 to 2020.
Land 11 00013 g007
Figure 8. Analysis of change of urban service-land.
Land 11 00013 g008
Figure 9. Analysis of spatial clustering of urban service-land.
Land 11 00013 g009
Figure 10. Analysis of spatial cold- and hot-spots of urban service-land.
Land 11 00013 g010
Figure 11. Analysis of change of per area added value.
Land 11 00013 g011
Figure 12. Analysis of spatial clustering of per area added value.
Land 11 00013 g012
Figure 13. Analysis of spatial cold- and hot-spots of per area added value.
Land 11 00013 g013
Figure 14. Analysis of change of per unit area investment.
Land 11 00013 g014
Figure 15. Analysis of spatial clustering of per unit area investment.
Land 11 00013 g015
Figure 16. Analysis of spatial cold- and hot-spots of per unit area investment.
Land 11 00013 g016
Figure 17. Analysis of decoupling type of added value of service-industry.
Land 11 00013 g017
Figure 18. Analysis of effect of decoupling type on gross domestic product.
Land 11 00013 g018
Table 1. Interaction between Explanatory Variables ( X i and X j ).
Graphical RepresentationDescriptionInteraction
Land 11 00013 i001q( X i X j ) < Min(q( X i ), q( X j ))Weaken, nonlinear
Land 11 00013 i002Min(q( X i ),q( X j )) < q( X i X j )<Max(q( X i )), q( X j ))Weaken, uni-
Land 11 00013 i003q( X i X j ) > Max(q( X i ), q( X j ))Enhance, bi-
Land 11 00013 i004q( X i X j ) = q( X i ) + q( X j )Independent
Land 11 00013 i005q( X i X j ) > q( X i ) + q( X j )Enhance, nonlinear
Legend: Land 11 00013 i006 Min(q( X i , q( X j ) ) Land 11 00013 i007 Max(q( X i ), q( X j )) Land 11 00013 i008 q( X i ) + q( X j ) Land 11 00013 i009 q( X i X j ).
Table 2. Model variable descriptions.
VariableIndexCodeType
Y i Urban Service-Land Area Y 1 -
X i Population Urbanization Rate X 1 Urbanization
Number of People Over 65 X 2
Per Capita Disposable Income of Residents X 3
Per Capita Consumption Expenditure of Residents X 4
Added Value of Secondary Industry X 5 Industrialization
Per Capita GDP X 6
Urban Industry Land Area X 7
Number of Patents Authorized X 8
Foreign Direct Investment X 9 Globalization
Export International Trade X 10
Import International Trade X 11
Number of Mobile Internet Users X 12 Informatization
Mobile Internet Data Traffic X 13
Number of Enterprises with E-Business Transactions X 14
E-Commerce Sales Amount X 15
E-Commerce Purchase Amount X 16
Gross Domestic Product X 17 Scale-Effect
Total Retail Sales of Social Consumer Goods X 18
Urban Construction-Land Area X 19
Resident Population X 20
Table 3. Analysis of influencing factors of urban service-land area.
201220162020
qpqpqp
X 1 0.13960.06050.33140.07020.12340.0760
X 2 0.67210.0000.70140.0000.74520.000
X 3 0.30730.01810.29300.02220.61530.0139
X 4 0.16120.04470.28520.02460.28020.0264
X 5 0.88020.0000.87040.0000.85180.000
X 6 0.82920.0000.23430.04860.30690.0489
X 7 0.87140.0000.86860.0000.87200.000
X 8 0.28120.02610.74500.0000.87120.000
X 9 0.83990.0000.61460.0000.59800.0177
X 10 0.84200.0000.73020.0000.69730.000
X 11 0.78600.0000.69410.00900.61200.0053
X 12 0.73100.00390.80070.0000.78590.000
X 13 0.73140.0000.76820.0000.72610.000
X 14 0.85320.0000.86890.0000.85180.000
X 15 0.87880.0000.60630.0000.62290.0042
X 16 0.86810.0000.66760.01220.68650.0141
X 17 0.83110.0000.92490.0000.86240.000
X 18 0.84620.0000.90360.0000.85720.000
X 19 0.85420.0000.89700.0000.88960.000
X 20 0.76800.0000.76320.0000.76730.000
Table 4. Analysis of influencing factors of urban service-land area.
201220162020
Urbanization0.32000.40270.4410
Industrialization0.71550.67960.7255
Globalization0.82260.67960.6358
Informatization0.81250.74230.7346
Scale-Effect0.82490.87220.8441
Publisher’s Note: MDPI stays neutral with regard to jurisdictional claims in published maps and institutional affiliations.

