Behind the Land Use Mix: Measuring the Functional Compatibility in Urban and Sub-Urban Areas of China
Abstract
:1. Introduction
2. Functional Compatibility: An Important but Unreckoned Characteristic behind Land Use Mix
2.1. A Definition of Functional Compatibility
2.2. Methodologies for Measuring Functional Compatibility
3. An Improved Index for Measuring Functional Compatibility
3.1. Classifying Land Use Types and Defining Influence Range
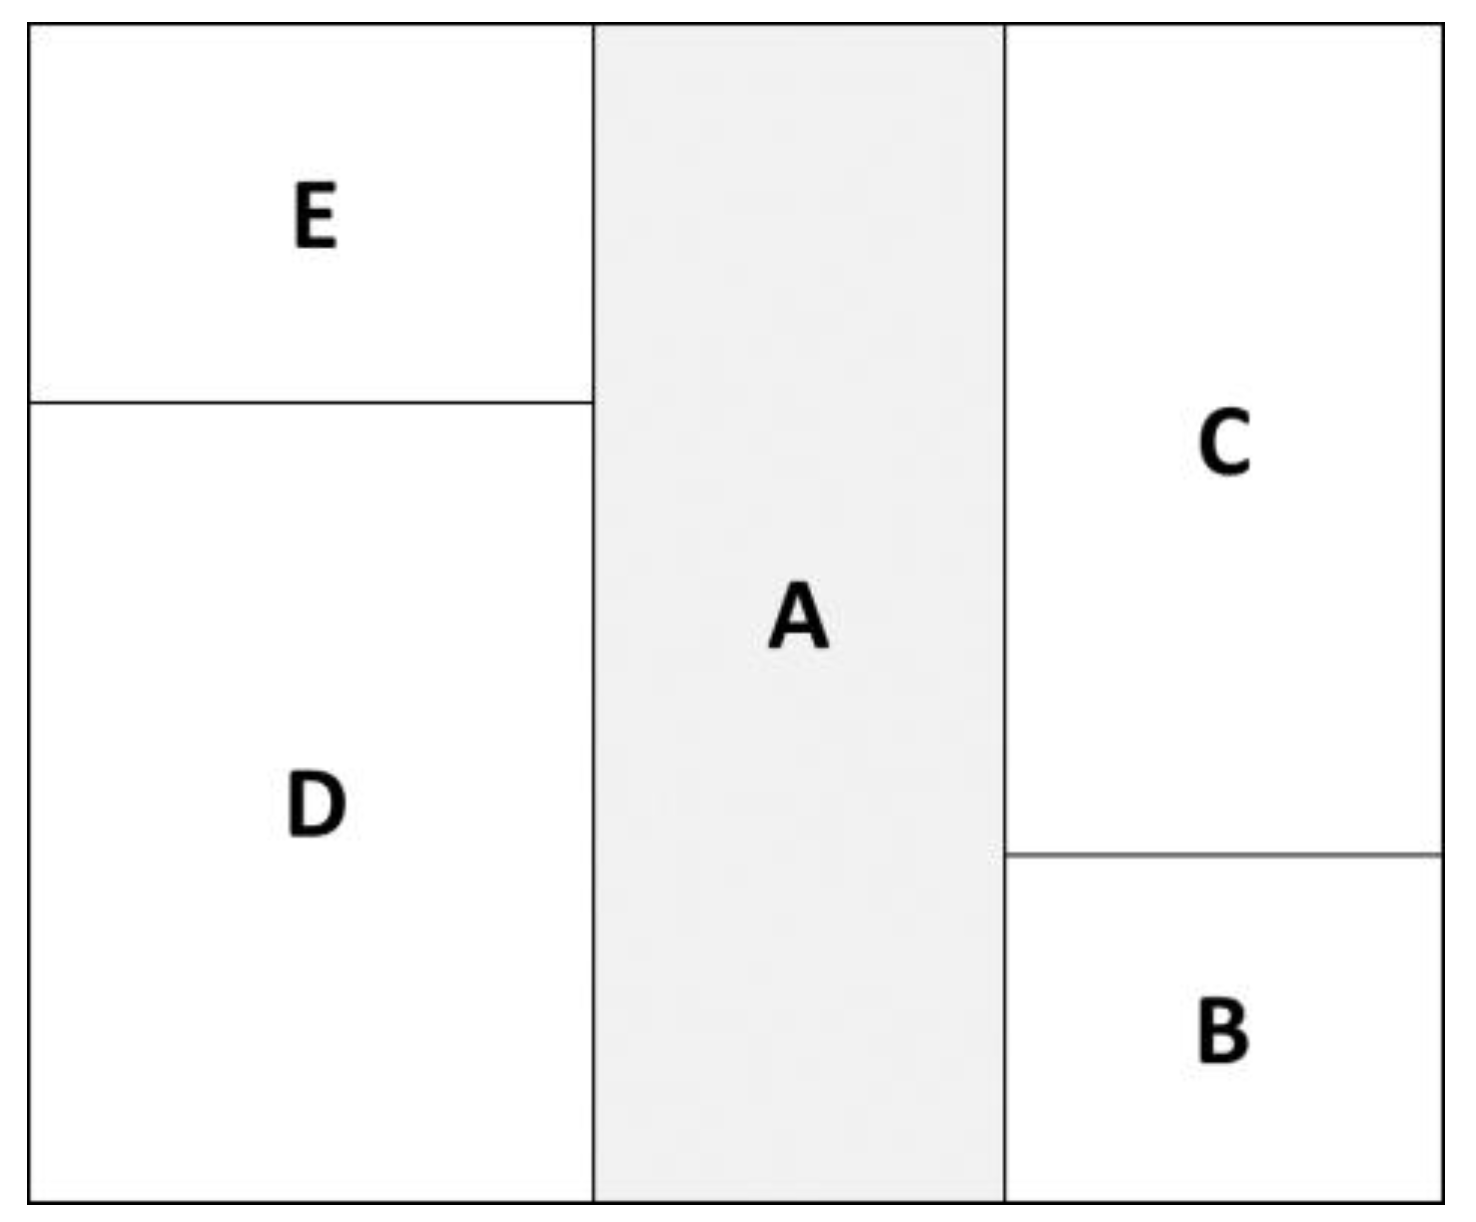
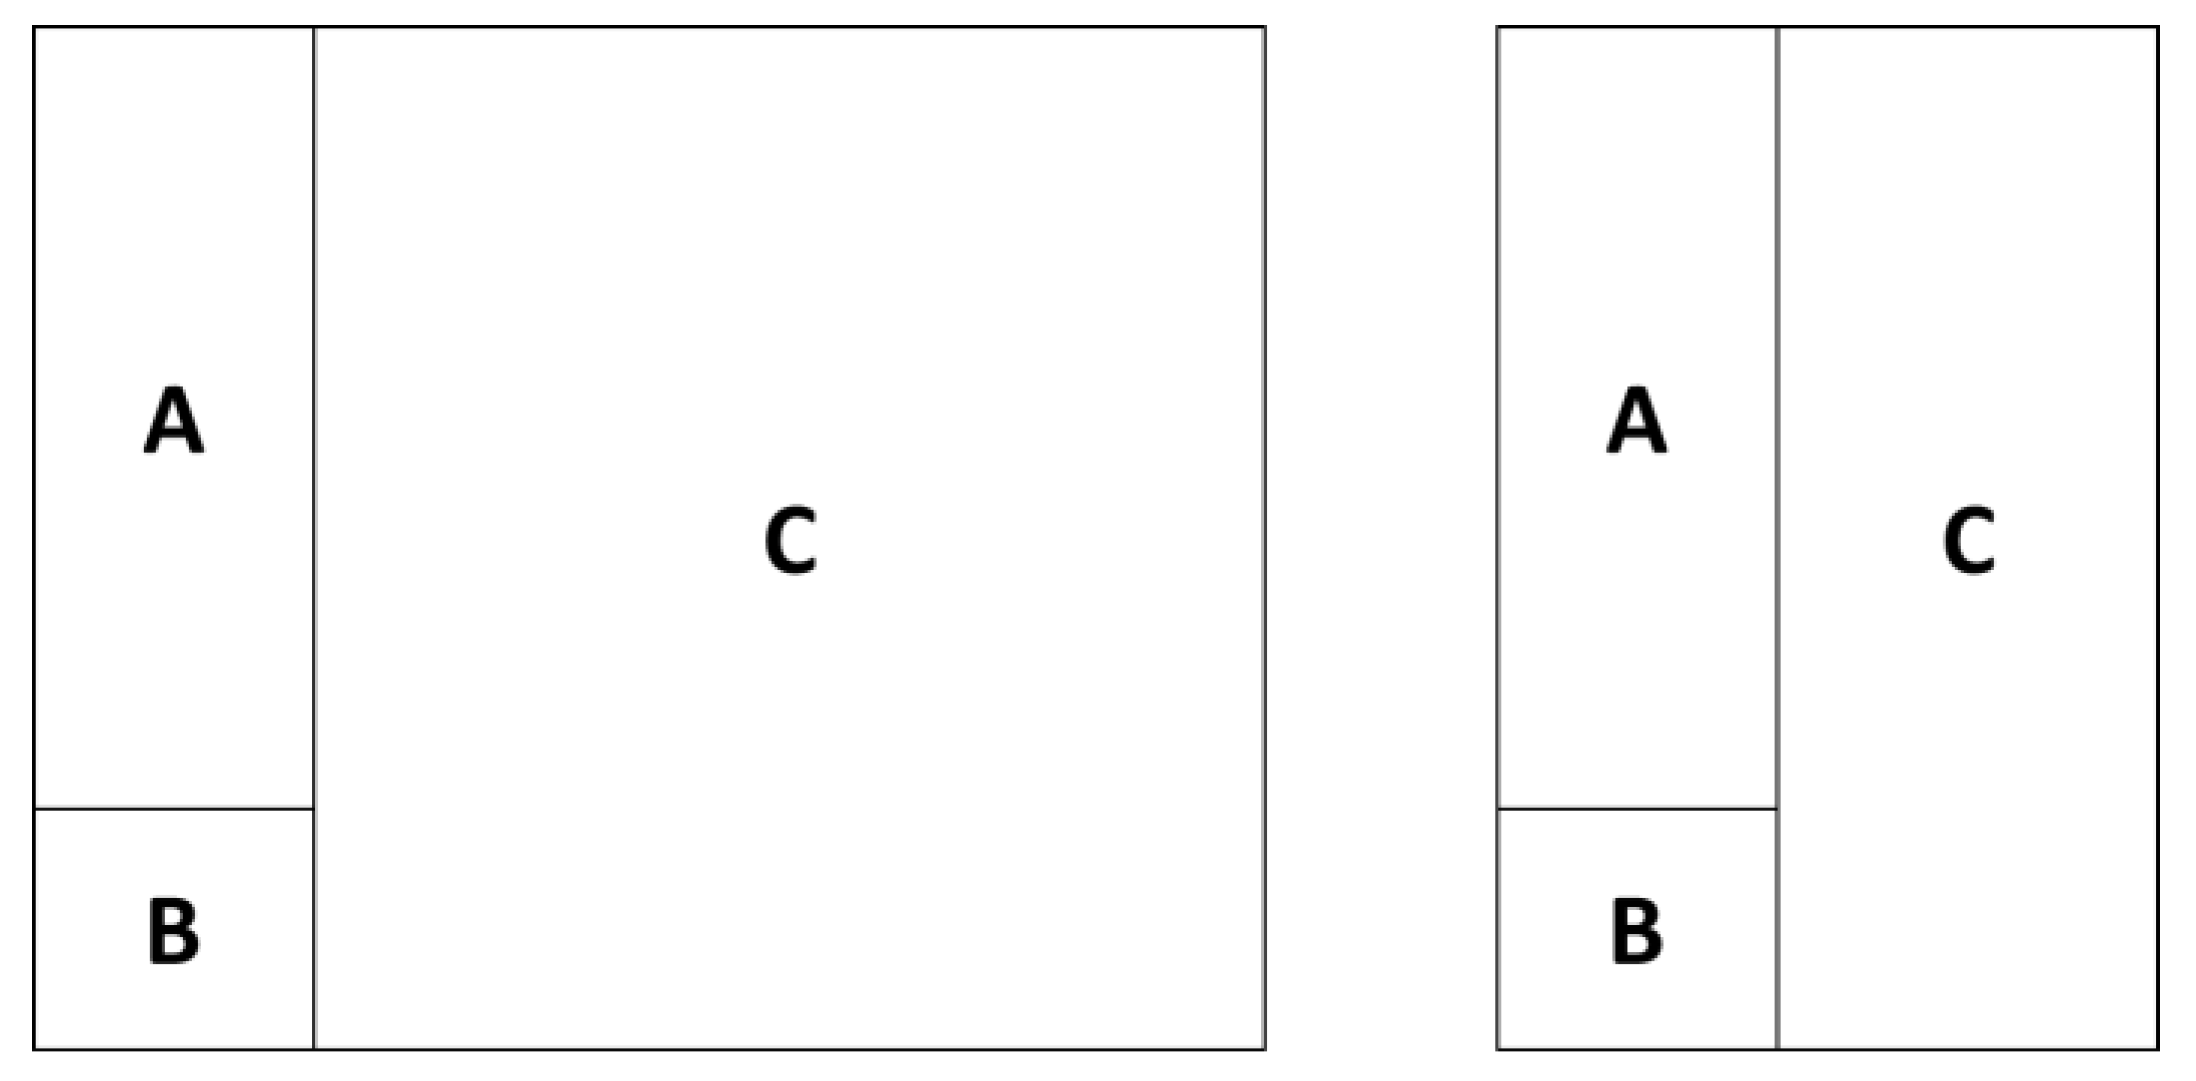
3.2. Measuring Functional Compatibility
3.3. Study Area and the Data
4. Results and Discussion
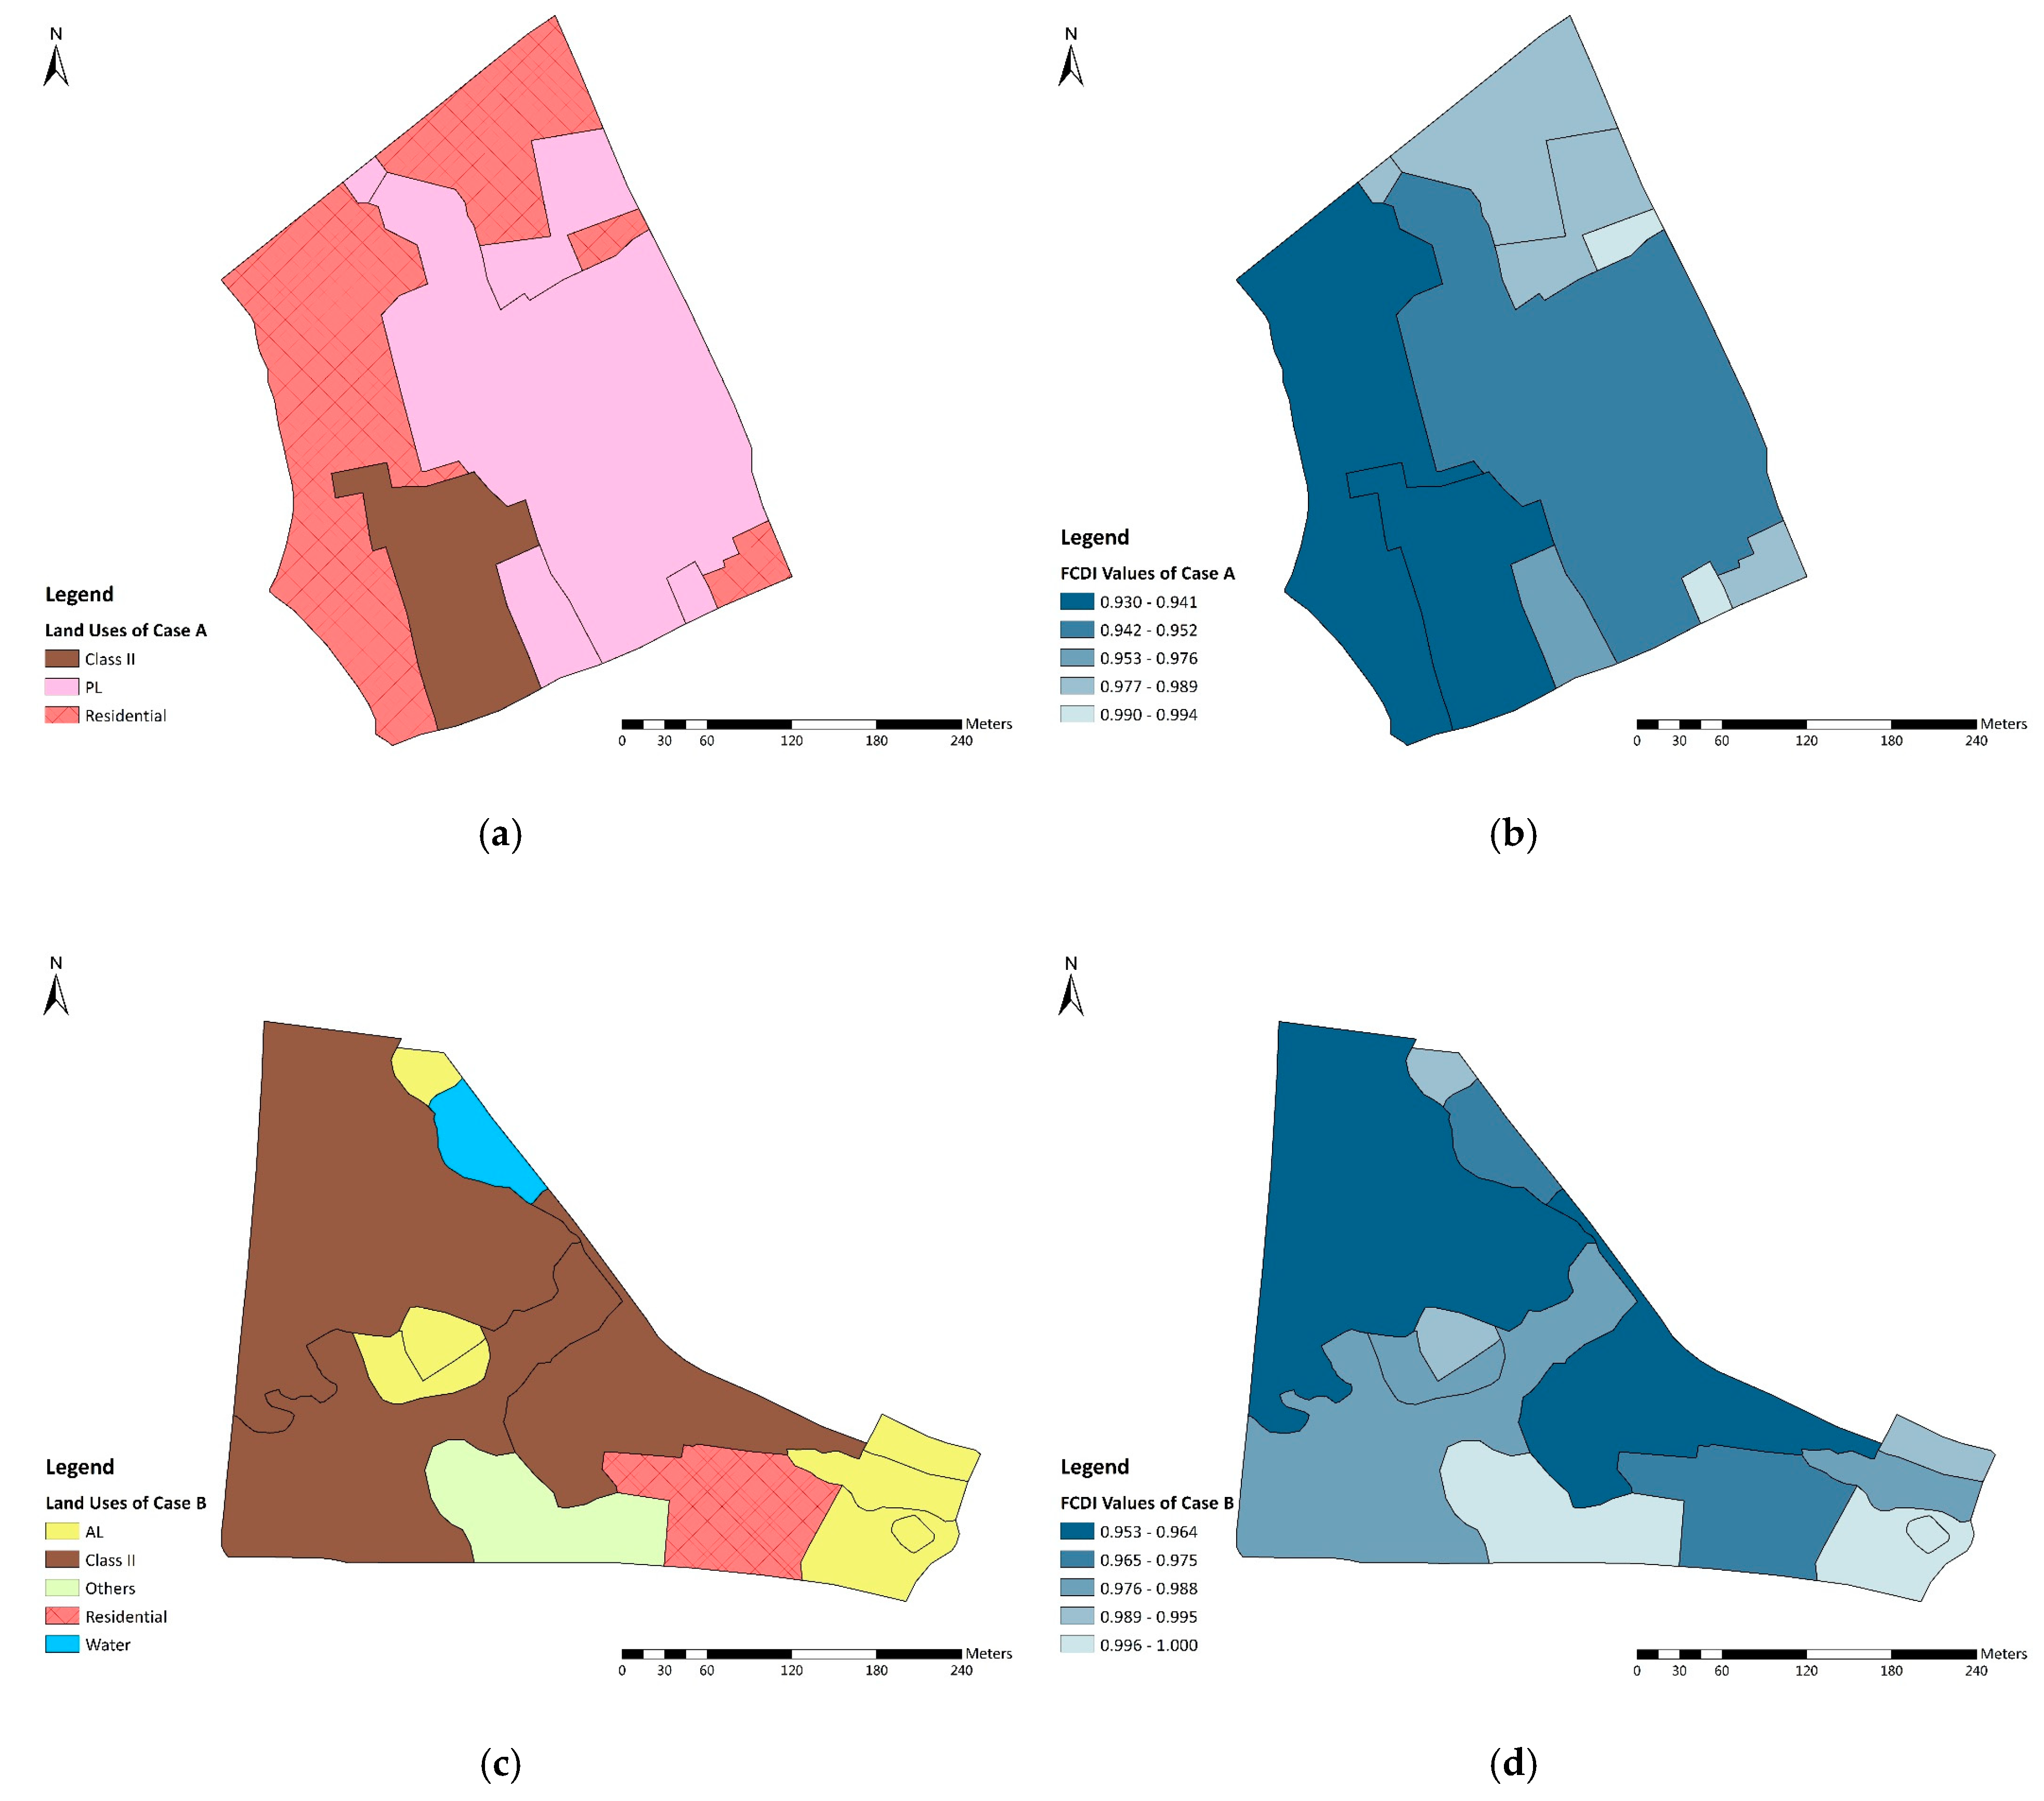
4.1. Evaluation of Functional Compatibility in the Study Area
4.2. An Integrated Evaluation of LUM Based on FCDI Index
5. Conclusions
Author Contributions
Funding
Data Availability Statement
Conflicts of Interest
Appendix A
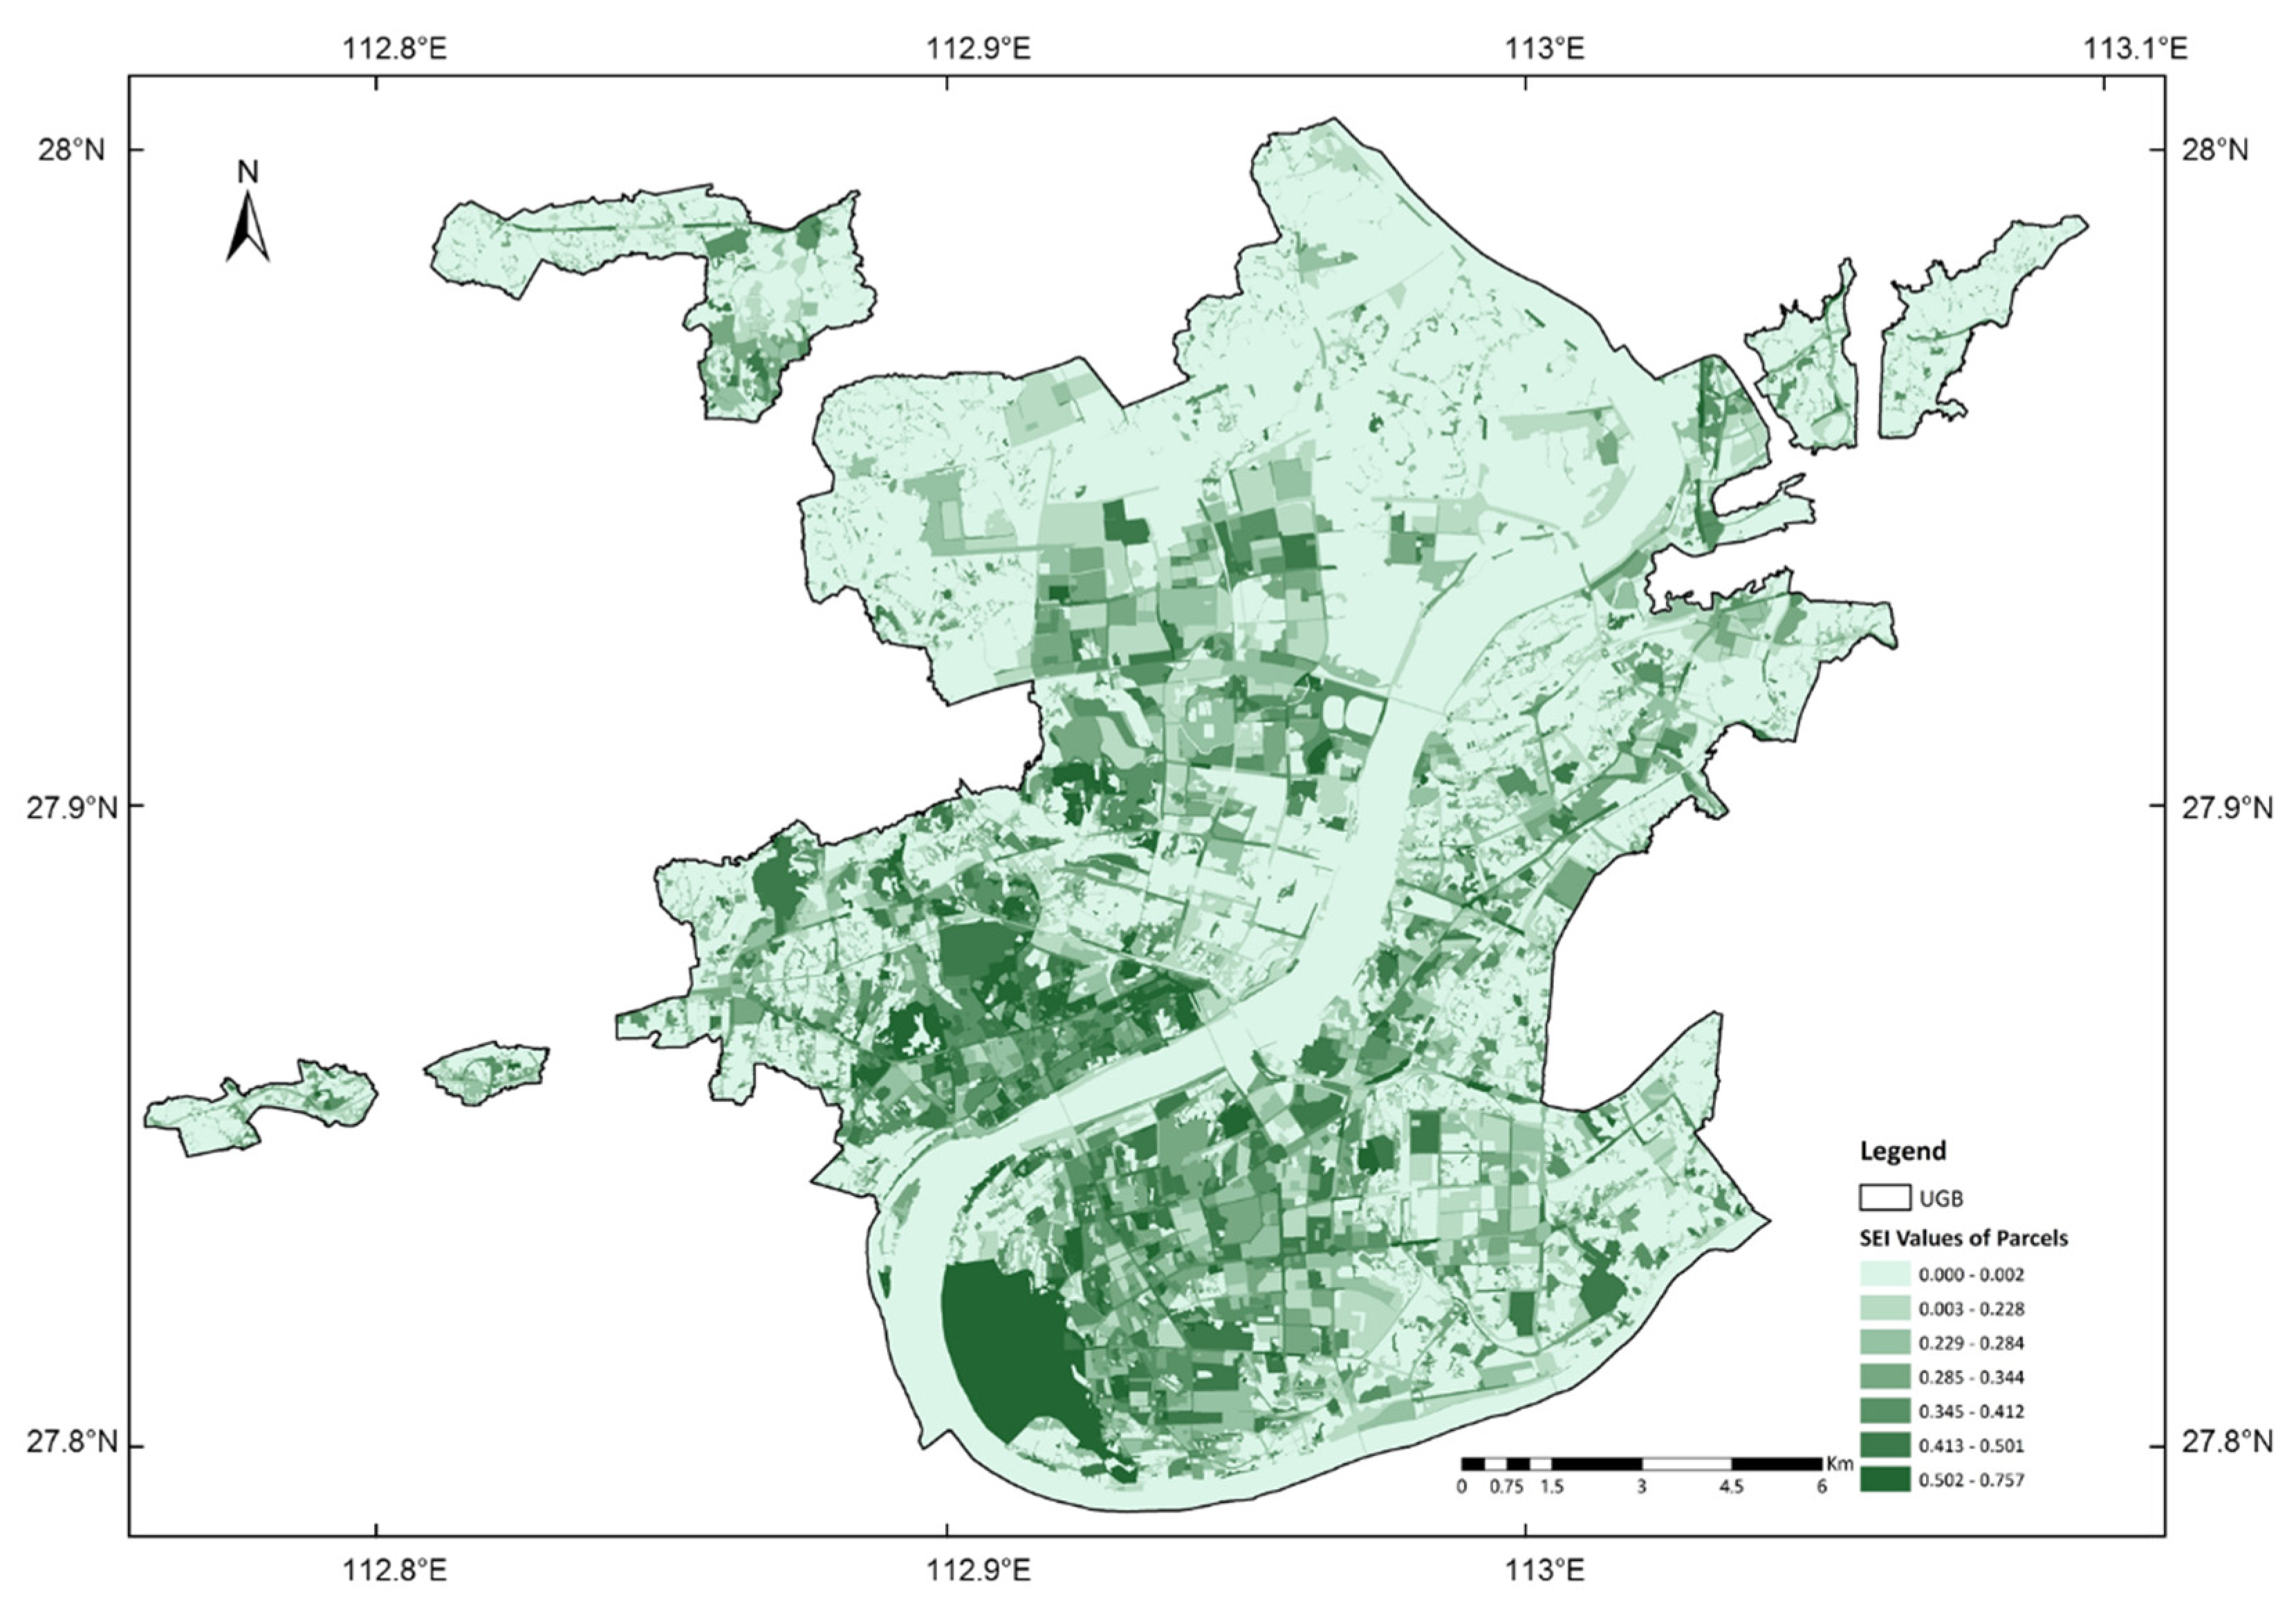
Appendix A.1. The Measurements SEI (Shannon Entropy Index)
Appendix A.2. Detailed Information of the Matrix
| People Scored 0.0 | People Scored 0.5 | People Scored 1.0 | Average Score | Mode | Std | |
|---|---|---|---|---|---|---|
| AL-Transportation | 40 | 0 | 0 | 0 | 0.0 | 0.00 |
| AL-Residential | 35 | 5 | 0 | 0.063 | 0.0 | 0.17 |
| AL-Class II | 5 | 33 | 2 | 0.463 | 0.5 | 0.21 |
| AL-Others | 39 | 1 | 0 | 0.013 | 0.0 | 0.08 |
| AL-SL | 36 | 4 | 0 | 0.050 | 0.0 | 0.15 |
| AL-Water | 40 | 0 | 0 | 0 | 0.0 | 0.00 |
| Others-Water | 40 | 0 | 0 | 0 | 0.0 | 0.00 |
| Others-Residential | 39 | 1 | 0 | 0.013 | 0.0 | 0.08 |
| Transportation-Others | 40 | 0 | 0 | 0 | 0.0 | 0.00 |
| AL-Commercial | 36 | 3 | 1 | 0.063 | 0.0 | 0.20 |
| Green-Transportation | 40 | 0 | 0 | 0 | 0.0 | 0.00 |
| Green-Water | 40 | 0 | 0 | 0 | 0.0 | 0.00 |
| Residential-Water | 40 | 0 | 0 | 0 | 0.0 | 0.00 |
| Residential-Transportation | 35 | 5 | 0 | 0.063 | 0.0 | 0.17 |
| Residential-Class II | 0 | 2 | 38 | 0.975 | 1.0 | 0.11 |
| Residential-ML | 2 | 8 | 30 | 0.850 | 1.0 | 0.28 |
| Commercial-Transportation | 36 | 4 | 0 | 0.050 | 0.0 | 0.15 |
| Residential-SL | 1 | 32 | 7 | 0.575 | 0.5 | 0.21 |
| Class II-Transportation | 40 | 0 | 0 | 0 | 0.0 | 0.00 |
| Class II-Water | 1 | 29 | 10 | 0.613 | 0.5 | 0.24 |
| Class II-ML | 35 | 4 | 1 | 0.075 | 0.0 | 0.21 |
| Transportation-Class I | 40 | 0 | 0 | 0 | 0.0 | 0.00 |
| Others-Class I | 38 | 2 | 0 | 0.025 | 0.0 | 0.11 |
| Class I-AL | 34 | 3 | 3 | 0.113 | 0.0 | 0.28 |
| Transportation-Water | 40 | 0 | 0 | 0 | 0.0 | 0.00 |
| Transportation-ML | 40 | 0 | 0 | 0 | 0.0 | 0.00 |
| Water-ML | 38 | 1 | 1 | 0.038 | 0.0 | 0.17 |
| Water-Class I | 35 | 3 | 2 | 0.088 | 0.0 | 0.25 |
| Transportation-PL | 29 | 9 | 2 | 0.163 | 0.0 | 0.28 |
| Residential-PL | 33 | 5 | 2 | 0.113 | 0.0 | 0.26 |
| Class II-PL | 1 | 8 | 31 | 0.875 | 1.0 | 0.24 |
| AL-PL | 37 | 1 | 2 | 0.063 | 0.0 | 0.23 |
| Residential-Commercial | 29 | 11 | 0 | 0.138 | 0.0 | 0.22 |
| Residential-Class I | 24 | 15 | 1 | 0.213 | 0.0 | 0.27 |
| Water-PL | 36 | 4 | 0 | 0.050 | 0.0 | 0.15 |
| Class I-Class II | 28 | 11 | 2 | 0.188 | 0.0 | 0.29 |
| Green-Residential | 40 | 0 | 0 | 0 | 0.0 | 0.00 |
| Commercial-Others | 39 | 1 | 0 | 0.013 | 0.0 | 0.08 |
| Others-Class II | 38 | 1 | 1 | 0.038 | 0.0 | 0.17 |
| Others-PL | 36 | 3 | 1 | 0.063 | 0.0 | 0.20 |
| Commercial-Water | 40 | 0 | 0 | 0 | 0.0 | 0.00 |
| Green-AL | 40 | 0 | 0 | 0 | 0.0 | 0.00 |
| ML-Others | 32 | 6 | 2 | 0.125 | 0.0 | 0.27 |
| ML-AL | 27 | 11 | 2 | 0.188 | 0.0 | 0.29 |
| PL-Commercia l | 39 | 1 | 0 | 0.013 | 0.0 | 0.08 |
| Commercial-Green | 40 | 0 | 0 | 0 | 0.0 | 0.00 |
| Commercial-Class II | 1 | 4 | 35 | 0.925 | 1.0 | 0.21 |
| Green-Class II | 2 | 31 | 7 | 0.563 | 0.5 | 0.23 |
| ML-Green | 21 | 17 | 2 | 0.263 | 0.0 | 0.30 |
| Commercial-ML | 1 | 33 | 7 | 0.588 | 0.5 | 0.21 |
| SL-Transportation | 40 | 0 | 0 | 0 | 0.0 | 0.00 |
| PL-ML | 2 | 30 | 8 | 0.575 | 0.5 | 0.24 |
| Others-Green | 40 | 0 | 0 | 0 | 0.0 | 0.00 |
| PL-Class I | 33 | 5 | 2 | 0.113 | 0.0 | 0.26 |
| PL-Green | 40 | 0 | 0 | 0 | 0.0 | 0.00 |
| Commercial-Class I | 29 | 9 | 2 | 0.163 | 0.0 | 0.28 |
| Water-SL | 40 | 0 | 0 | 0 | 0.0 | 0.00 |
| Class II-SL | 5 | 28 | 7 | 0.525 | 0.5 | 0.27 |
| SL-Others | 40 | 0 | 0 | 0 | 0.0 | 0.00 |
| SL-Commercial | 3 | 9 | 28 | 0.813 | 1.0 | 0.31 |
| SL-PL | 1 | 16 | 23 | 0.775 | 1.0 | 0.27 |
| ML-SL | 8 | 25 | 7 | 0.488 | 0.5 | 0.31 |
| SL-Green | 36 | 3 | 1 | 0.063 | 0.0 | 0.20 |
References
- Alexander, C. Notes on the Synthesis of Form; Harvard University Press: Cambridge, MA, USA, 1964; pp. 1–15. [Google Scholar]
- Alexander, C.; Neis, H.; Anninou, A.; King, I.F. A New Theory of Urban Design; Oxford University Press: New York, NY, USA, 1987; pp. 103–132. [Google Scholar]
- Portugali, J. Complexity, Cognition and the City; Springer: Berlin/Heidelberg, Germany, 2011; pp. 22–42. [Google Scholar]
- Portugali, J. What makes cities complex? In Complexity, Cognition, Urban Planning and Design; Portugali, J., Stolk, E., Eds.; Springer: Cham, Switzerland, 2016; pp. 3–19. [Google Scholar] [CrossRef]
- Baynes, T.M. Complexity in urban development and management: Historical overview and opportunities. J. Ind. Ecol. 2009, 13, 214–227. [Google Scholar] [CrossRef]
- Song, Y.; Merlin, L.; Rodriguez, D. Comparing measures of urban land use mix. Comput. Environ. Urban Syst. 2013, 42, 1–13. [Google Scholar] [CrossRef]
- Jacobs, J. The Death and Life of Great American Cities; Vintage Books: New York, NY, USA, 1961; pp. 120–156. [Google Scholar]
- Seidel, A.; John, G.; Wolfgang, F.E.P.; David, M.P. Four Commentaries on the Charter. J. Archit. Res. 1979, 7, 10–12. Available online: http://www.jstor.org/stable/43475224 (accessed on 12 November 2021).
- Congress of New Urbanism. Charter for the New Urbanism; Congress for the New Urbanism: Chicago, IL, USA, 2001. [Google Scholar]
- Daniels, T. Smart growth: A new American approach to regional planning. Plan. Pract. Res. 2001, 16, 271–279. [Google Scholar] [CrossRef]
- Adelfio, M.; Hamiduddin, I.; Miedema, E. London’s King’s Cross redevelopment: A compact, resource efficient and ‘livable’ global city model for an era of climate emergency? Urban Res. Pract. 2020, 14, 180–200. [Google Scholar] [CrossRef] [Green Version]
- Sung, H.; Lee, S.; Cheon, S. Operationalizing jane jacobs’s urban design theory: Empirical verification from the great city of Seoul, Korea. J. Plan. Educ. Res. 2015, 35, 117–130. [Google Scholar] [CrossRef]
- Christian, H.E.; Bull, F.C.; Middleton, N.J.; Knuiman, M.W.; Divitini, M.L.; Hooper, P.; Amarasinghe, A.; Giles-Corti, B. How important is the land use mix measure in understanding walking behaviour? Results from the RESIDE study. Int. J. Behav. Nutr. Phys. Act. 2011, 8, 1–12. [Google Scholar] [CrossRef] [Green Version]
- Saelens, B.E.; Sallis, J.F.; Frank, L.D. Environmental correlates of walking and cycling: Findings from the transportation, urban design, and planning literatures. Ann. Behav. Med. 2003, 25, 80–91. [Google Scholar] [CrossRef]
- Tian, L.; Liang, Y.; Zhang, B. Measuring residential and industrial land use mix in the peri-urban areas of China. Land Use Policy 2017, 69, 427–438. [Google Scholar] [CrossRef]
- Taleai, M.; Sharifi, A.; Sliuzas, R.; Mesgari, M. Evaluating the compatibility of multi-functional and intensive urban land uses. Int. J. Appl. Earth Obs. Geoinf. 2007, 9, 375–391. [Google Scholar] [CrossRef]
- Burnell, J.D. Industrial land use, externalities, and residential location. Urban Stud. 1985, 22, 399–408. [Google Scholar] [CrossRef]
- Koster, H.R.; Rouwendal, J. The impact of mixed land use on residential property values. J. Reg. Sci. 2012, 52, 733–761. [Google Scholar] [CrossRef] [Green Version]
- Wu, J.; Song, Y.; Liang, J.; Wang, Q.; Lin, J. Impact of mixed land use on housing values in high-density areas: Evidence from Beijing. J. Urban Plan. Dev. 2018, 144, 05017019. [Google Scholar] [CrossRef]
- Hachem-Vermette, C.; Grewal, K.S. Investigation of the impact of residential mixture on energy and environmental performance of mixed use neighborhoods. Appl. Energy 2019, 241, 362–379. [Google Scholar] [CrossRef]
- Delang, C.O. Causes and distribution of soil pollution in China. Environ. Socio-Econ. Stud. 2017, 5, 1–17. [Google Scholar] [CrossRef] [Green Version]
- Qu, C.; Shi, W.; Guo, J.; Fang, B.; Wang, S.; Giesy, J.P.; Holm, P.E. China’s soil pollution control: Choices and challenges. Environ. Sci. Technol. 2016, 50, 13181–13183. [Google Scholar] [CrossRef]
- Tian, L. Land use dynamics driven by rural industrialization and land finance in the peri-urban areas of China: “The examples of Jiangyin and Shunde”. Land Use Policy 2015, 45, 117–127. [Google Scholar] [CrossRef]
- Zhuo, Y.; Zheng, H.; Wu, C.; Xu, Z.; Li, G.; Yu, Z. Compatibility mix degree index: A novel measure to characterize urban land use mix pattern. Comput. Environ. Urban Syst. 2019, 75, 49–60. [Google Scholar] [CrossRef]
- Clifton, K.; Ewing, R.; Knaap, G.J.; Song, Y. Quantitative analysis of urban form: A multidisciplinary review. J. Urban. 2008, 1, 17–45. [Google Scholar] [CrossRef]
- Wong, D.W. Spatial indices of segregation. Urban Stud. 1993, 30, 559–572. [Google Scholar] [CrossRef]
- Grant, J. Mixed use in theory and practice: Canadian experience with implementing a planning principle. J. Am. Plan. Assoc. 2002, 68, 71–84. [Google Scholar] [CrossRef]
- Urban Land Institute. Mixed-Use Development Handbook; Urban Land Institute: Washington, DC, USA, 1987. [Google Scholar]
- Zhao, M.; Xu, G.; de Jong, M.; Li, X.; Zhang, P. Examining the Density and Diversity of Human Activity in the Built Environment: The Case of the Pearl River Delta, China. Sustainability 2020, 12, 3700. [Google Scholar] [CrossRef]
- Maria Kockelman, K. Travel behavior as function of accessibility, land use mixing, and land use balance: Evidence from San Francisco Bay Area. Transp. Res. Rec. 1997, 1607, 116–125. [Google Scholar] [CrossRef]
- Kong, F.; Yin, H.; Nakagoshi, N. Using GIS and landscape metrics in the hedonic price modeling of the amenity value of urban green space: A case study in Jinan City, China. Landsc. Urban Plan. 2007, 79, 240–252. [Google Scholar] [CrossRef]
- Hughes, W.T., Jr.; Sirmans, C.F. Traffic externalities and single-family house prices. J. Reg. Sci. 1992, 32, 487–500. [Google Scholar] [CrossRef]
- Willis, K.G.; Garrod, G.D.; Harvey, D.R. A review of cost–benefit analysis as applied to the evaluation of new road proposals in the UK. Transp. Res. Part D Transp. Environ. 1998, 3, 141–156. [Google Scholar] [CrossRef]
- Corbusier, L.; Eardley, A. The Charter of Athens. (Athens). 1993; Grossman Publishers: New York, NY, USA, 1973. [Google Scholar]
- Espey, M.; Lopez, H. The impact of airport noise and proximity on residential property values. Growth Change 2000, 31, 408–419. [Google Scholar] [CrossRef]
- Kyakuno, T. Quantitative representation of distribution and mixture of urban land use through spatial autocorrelation and information entropy. J. Asian Archit. Build. Eng. 2008, 7, 427–434. [Google Scholar] [CrossRef]
- Bordoloi, R.; Mote, A.; Sarkar, P.P.; Mallikarjuna, C. Quantification of land use diversity in the context of mixed land use. Procedia-Soc. Behav. Sci. 2013, 104, 563–572. [Google Scholar] [CrossRef] [Green Version]
- Griffith, J.A.; Martinko, E.A.; Price, K.P. Landscape structure analysis of Kansas at three scales. Landsc. Urban Plan. 2000, 52, 45–61. [Google Scholar] [CrossRef]
- Zhang, S.; York, A.M.; Boone, C.G.; Shrestha, M. Methodological advances in the spatial analysis of land fragmentation. Prof. Geogr. 2013, 65, 512–526. [Google Scholar] [CrossRef]
- Kennedy, S.; Tobler, W.R. Geographic interpolation. Geogr. Anal. 1983, 15, 151–156. [Google Scholar] [CrossRef]
- Wong, D.W. Spatial Measures of Segregation and Gis. Urban Geogr. 2002, 23, 85–92. [Google Scholar] [CrossRef]
- Brown, L.A.; Chung, S.Y. Spatial segregation, segregation indices and the geographical perspective. Popul. Space Place 2006, 12, 125–143. [Google Scholar] [CrossRef]
- Anselin, L. Local indicators of spatial association—LISA. Geogr. Anal. 1995, 27, 93–115. [Google Scholar] [CrossRef]
- Getis, A.; Ord, J.K. The analysis of spatial association by use of distance statistics. In Perspectives on Spatial Data Analysis; Anselin, L., Rey, S.J., Eds.; Springer: Berlin/Heidelberg, Germany, 2010; pp. 127–145. [Google Scholar] [CrossRef]
- Tobler, W. A computer movie simulating urban growth in the Detroit region. Econ. Geogr. 1970, 46, 234–240. [Google Scholar] [CrossRef]
- Shanghai Urban Planning and Land Resources Administration Bureau. Technical Guideline on Regulatory Plan of Shanghai; Shanghai Urban Planning and Land Resources Administration Bureau: Shanghai, China, 2016. (In Chinese)
- Massey, D.S.; Denton, N.A. The dimensions of residential segregation. Soc. Forces 1988, 67, 281–315. [Google Scholar] [CrossRef]
- Morrill, R. On the measure of geographic segregation. Geogr. Res. Forum 1991, 11, 25–36. [Google Scholar]
- Scripter, M.W. Nested-means map classes for statistical maps. Ann. Assoc. Am. Geogr. 1970, 60, 385–392. [Google Scholar] [CrossRef]
- Jiang, B. Head/tail breaks: A new classification scheme for data with a heavy-tailed distribution. Prof. Geogr. 2013, 65, 482–494. [Google Scholar] [CrossRef]
- Yue, Y.; Zhuang, Y.; Yeh, A.G.O.; Xie, J.Y.; Ma, C.L.; Li, Q.Q. Measurements of POI-based mixed use and their relationships with neighbourhood vibrancy. Int. J. Geogr. Inf. Sci. 2017, 31, 658–675. [Google Scholar] [CrossRef] [Green Version]
- Shi, H.; Zhao, M.; Chen, P. Measuring the Functional Compatibility of Land from the Perspective on Land-Use Mix: A Case Study of Xiangtan. Trop. Geogr. 2021, 41, 746–759. (In Chinese) [Google Scholar] [CrossRef]
- Abolhasani, S.; Taleai, M.; Karimi, M.; Rezaee Node, A. Simulating urban growth under planning policies through parcel-based cellular automata (ParCA) model. Int. J. Geogr. Inf. Sci. 2016, 30, 2276–2301. [Google Scholar] [CrossRef]
- Abolhasani, S.; Taleai, M. Assessing the effect of temporal dynamics on urban growth simulation: Towards an asynchronous cellular automata. Trans. GIS 2020, 24, 332–354. [Google Scholar] [CrossRef]
- Karimi, M.; Sharifi, M.A.; Mesgari, M.S. Modeling land use interaction using linguistic variables. Int. J. Appl. Earth Obs. Geoinf. 2012, 16, 42–353. [Google Scholar] [CrossRef]
- Alaei Moghadam, S.; Karimi, M.; Habibi, K. Simulating urban growth in a megalopolitan area using a patch-based cellular automata. Trans. GIS 2018, 22, 249–268. [Google Scholar] [CrossRef]
- Taleai, M.; Sliuzas, R.; Flacke, J. An integrated framework to evaluate the equity of urban public facilities using spatial multi-criteria analysis. Cities 2014, 40, 56–69. [Google Scholar] [CrossRef]




| Land Uses | Definition | Land Types |
|---|---|---|
| Residential land | Residential and corresponding services | built-up land |
| Class I industrial land (Class I) | The industry that impacts the residential and public environment to a certain extent | built-up land |
| Class II industrial land (Class II) | The industry that seriously disturbs the residential and public environment. | built-up land |
| Green land | Parks and other public open spaces | built-up land |
| Commercial land | Various types of business activities, catering, hotel, and other services | built-up land |
| Public management and service land (PL) | Administrative, cultural, educational, health and other services, institutions, and facilities | built-up land |
| Transportation land | Urban roads and transportation facilities | built-up land |
| Municipal utilities land (ML) | Supply, environment, and other facilities | built-up land |
| Specially-designated land (SL) | Special purposes such as security | built-up land |
| Water | Rivers, lakes, reservoirs, potholes, ditches, and tidal flats | non-built land |
| Agricultural-related land (AL) | Agricultural-related activities, including farmland, forest, grassland, garden land, and agricultural-related facilities | non-built land |
| Others | Other purposes | non-built land |
| Residential | PL | Commercial | Class I | Class II | Transportation | ML | Green | SL | AL | Water | Others | |
|---|---|---|---|---|---|---|---|---|---|---|---|---|
| Residential | 0 | |||||||||||
| PL | 0.113 | 0 | ||||||||||
| Commercial | 0.138 | 0.013 | 0 | |||||||||
| Class I | 0.213 | 0.113 | 0.163 | 0 | ||||||||
| Class II | 0.975 | 0.875 | 0.925 | 0.188 | 0 | |||||||
| Transportation | 0.238 | 0.163 | 0.050 | 0 | 0 | 0 | ||||||
| ML | 0.850 | 0.575 | 0.538 | — | 0.075 | 0 | 0 | |||||
| Green | 0 | 0 | 0 | — | 0.563 | 0 | 0.263 | 0 | ||||
| SL | 0.575 | 0.775 | 0.813 | — | 0.525 | 0 | 0.488 | 0.063 | 0 | |||
| AL | 0.063 | 0.063 | 0.063 | 0.113 | 0.463 | 0 | 0.188 | 0 | 0.050 | 0 | ||
| Water | 0 | 0.050 | 0 | 0.088 | 0.613 | 0 | 0.038 | 0 | 0 | 0 | 0 | |
| Others | 0.013 | 0.063 | 0.013 | 0.025 | 0.038 | 0 | 0.125 | 0 | 0 | 0.013 | 0 | 0 |
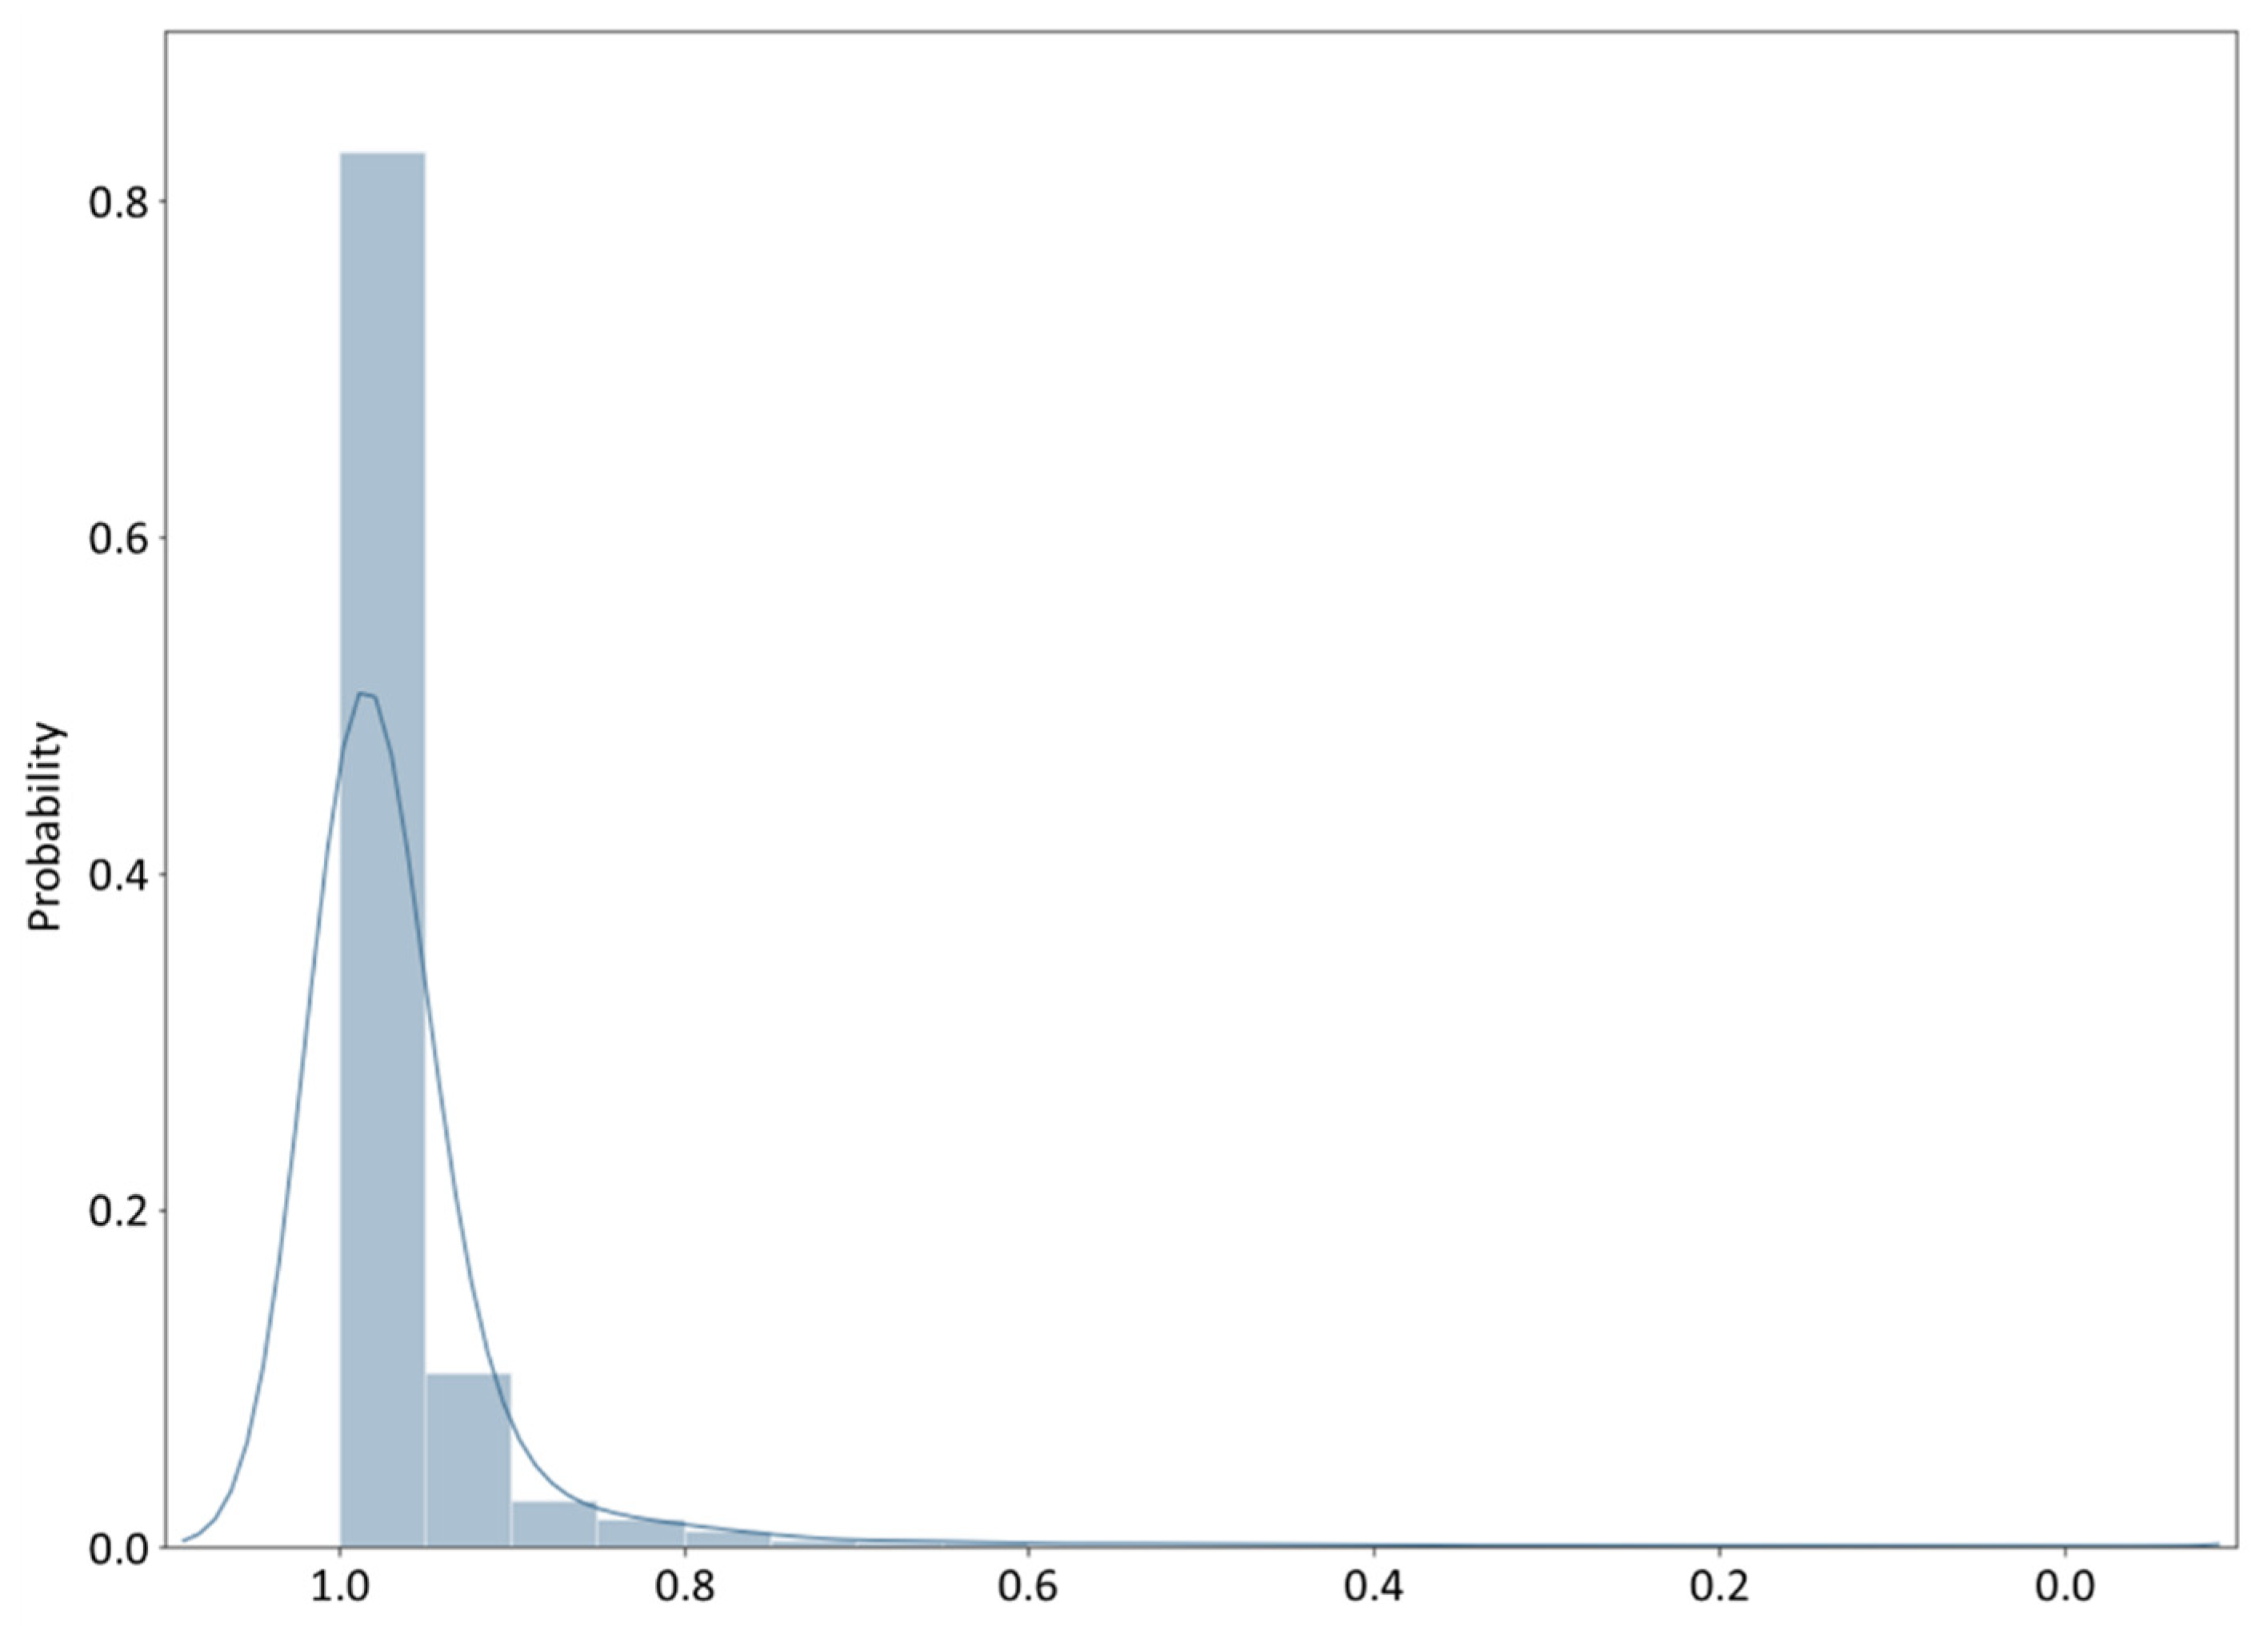
| N | Min | Max | Mean | Range | |
|---|---|---|---|---|---|
| Class 1 | 24,715 | 0.992 | 1.00 | 0.998 | (0.992, 1.0] |
| Class 2 | 5178 | 0.969 | 0.992 | 0.985 | (0.969, 0.992] |
| Class 3 | 1206 | 0.923 | 0.969 | 0.953 | (0.922, 0.969] |
| Class 4 | 363 | 0.853 | 0.922 | 0.897 | (0.853, 0.922] |
| Class 5 | 117 | 0.754 | 0.853 | 0.816 | (0.754, 0.853] |
| Class 6 | 26 | 0.623 | 0.747 | 0.702 | (0.592, 0.754] |
| Class 7 | 19 | 0.00 | 0.592 | 0.467 | [0.0, 0.592] |
| Total | 31,624 | 0.00 | 1.00 | 0.97 | - |
Publisher’s Note: MDPI stays neutral with regard to jurisdictional claims in published maps and institutional affiliations. |
© 2021 by the authors. Licensee MDPI, Basel, Switzerland. This article is an open access article distributed under the terms and conditions of the Creative Commons Attribution (CC BY) license (https://creativecommons.org/licenses/by/4.0/).
Share and Cite
Shi, H.; Zhao, M.; Simth, D.A.; Chi, B. Behind the Land Use Mix: Measuring the Functional Compatibility in Urban and Sub-Urban Areas of China. Land 2022, 11, 2. https://doi.org/10.3390/land11010002
Shi H, Zhao M, Simth DA, Chi B. Behind the Land Use Mix: Measuring the Functional Compatibility in Urban and Sub-Urban Areas of China. Land. 2022; 11(1):2. https://doi.org/10.3390/land11010002
Chicago/Turabian StyleShi, Haochen, Miaoxi Zhao, Duncan A. Simth, and Bin Chi. 2022. "Behind the Land Use Mix: Measuring the Functional Compatibility in Urban and Sub-Urban Areas of China" Land 11, no. 1: 2. https://doi.org/10.3390/land11010002
APA StyleShi, H., Zhao, M., Simth, D. A., & Chi, B. (2022). Behind the Land Use Mix: Measuring the Functional Compatibility in Urban and Sub-Urban Areas of China. Land, 11(1), 2. https://doi.org/10.3390/land11010002


