Article

Evaluation of Desertification Severity in El-Farafra Oasis, Western Desert of Egypt: Application of Modified MEDALUS Approach Using Wind Erosion Index and Factor Analysis

by
Mohamed E. Fadl
1,
Ahmed S. Abuzaid
2,
Mohamed A. E. AbdelRahman
3,* and
Asim Biswas
4,*
1
Division of Scientific Training and Continuous Studies, National Authority for Remote Sensing and Space Sciences (NARSS), Cairo 11769, Egypt
2
Soils and Water Department, Faculty of Agriculture, Benha University, Benha 13518, Egypt
3
Division of Environmental Studies and Land Use, National Authority for Remote Sensing and Space Sciences (NARSS), Cairo 11769, Egypt
4
School of Environmental Sciences, University of Guelph, Alexander Hall 135, 50 Stone Road East, Guelph, ON N1G 2W1, Canada
*
Authors to whom correspondence should be addressed.
Land 2022, 11(1), 54; https://doi.org/10.3390/land11010054
Submission received: 1 August 2021 / Revised: 18 August 2021 / Accepted: 28 December 2021 / Published: 30 December 2021

Abstract

:
Desertification is a serious threat to human survival and to ecosystems, especially to inland desert oases. An assessment of desertification severity is essential to ensure national sustainable development for agricultural and land expansion processes in this region. In this study, Index of Land Susceptibility to Wind Erosion (ILSWE) was integrated with a Modified Mediterranean Desertification and Land Use (MEDALUS) method and factor analysis (FA) to develop a GIS-based model for mapping desertification severity. The model was then applied to 987.77 km2 in the El-Farafra Oasis, located in the Western Desert of Egypt, as a case study. Climate and field survey data together with remote sensing images were used to generate five quality indices (soil, climate, vegetation, land management and wind erosion). Based on the FA, a weighted value was assigned to each index. Five thematic layers representing the indices were created within the GIS environment and overlaid using the weighted sum model. The developed model showed that 59% of the total area was identified as high-critical and 38% as medium-critical. The results of an environmentally sensitive area index suggested by the original MEDALUS model indicated similar results: 18.37% of the total area was classified as high-critical and 78.73% as medium-critical. However, the sensitivity analysis indicated that weights derived from FA resulted in better performance of the developed spatial model than that derived from the original MEDALUS method. The proposed model would be a suitable tool for monitoring vulnerable zones, and could be a starting point for sustainable agricultural development in inland oases.

1. Introduction

In dryland areas, desert oases play an important role in sustainable development [1,2]. However, they are fragile agrarian areas and are very sensitive to degradation and desertification [3]. In these areas, desertification is a dynamic and complex form of land degradation processes [4]. It poses negative effects on land productivity, and causes serious problems including food insecurity, poverty, political instability, and social disintegration [5]. Therefore, precise assessment of environmentally sensitive areas (ESAs) to desertification is essential for sustainable development [6].
Evaluating current desertification status requires key parameters and factors, including various biophysical and human factors [1]. In this context, the Mediterranean Desertification and Land Use (MEDALUS) method developed by Kosmas et al. [7] has been widely used. This model focused primarily on common degradation processes in the European Mediterranean environment. However, it provided acceptable results for assessing desertification status in many desert oases in Egypt [8], Morocco [1] and Tunisia [9]. A science-based estimation of ESAs requires the adoption and analysis of parameters and factors related directly to the locally dominant degradation-related processes [6,10]. As a result, under Egyptian local conditions, adjusted MEDALUS models have been implemented to incorporate new variables as predictors of soil quality such as salinity, organic matter content [6], calcium carbonate and gypsum content [11]. Furthermore, the vegetation index has been expressed by the Normalized Differential Vegetation Index (NDVI) [11,12]. However, land susceptibility to degradation in the inland western oasis is closely related to wind erosion [13]. According to the Egyptian National Action Program to Combat Desertification [14], wind erosion hazards in the western desert oases varies between moderate and severe with an average soil loss rate varying from 4.5 to 66.9 Mg ha−1 year−1. Thus, quantitative assessment of soil loss due to wind action is crucial when appraising desertification in these areas. The index of land susceptibility to wind erosion (ILSWE) proposed by Borrelli et al. [15] is a well-established model for measuring wind erosion. The model depends on a combination of climatic erosivity, soil erodibility, soil crust factor, vegetation cover, and surface roughness derived from comprehensive measurements of climate data, field observations, and laboratory analysis. Although ILSWE was primarily developed under European conditions, Fenta et al. [16] proved its applicability under African conditions. Therefore, integration of ILSWE and the original MEDLAUS indices in a spatial model would be useful for better evaluation of desertification hazards. Real estimation of current desertification status requires the integration of a given set of parameters and their relative importance or weights [17,18]. A statistical-based approach such as factor analysis (FA) provides an effective and objective methodology to develop dynamic weights for a set of multiple parameters [19,20]. This technique provides dynamic weights and permits modifying weight values based on spatial and temporal changes [21,22]. The FA has been used increasingly in land resource assessments [18,23,24]; however, little attention has been paid to using this technique in analyzing desertification sensitivity.
This work therefore aimed to (i) incorporate soil loss calculated by the ILSWE with the original four quality indices that were adjusted by the MEDALUS methodology, (ii) integrate FA in establishing weights for the five indices, and (iii) develop a GIS-based model using the weighted indices. The model was then applied in the El-Farafra Oasis, in the western desert of Egypt, as a case study to evaluate the current status of desertification sensitivity.

2. Materials and Methods
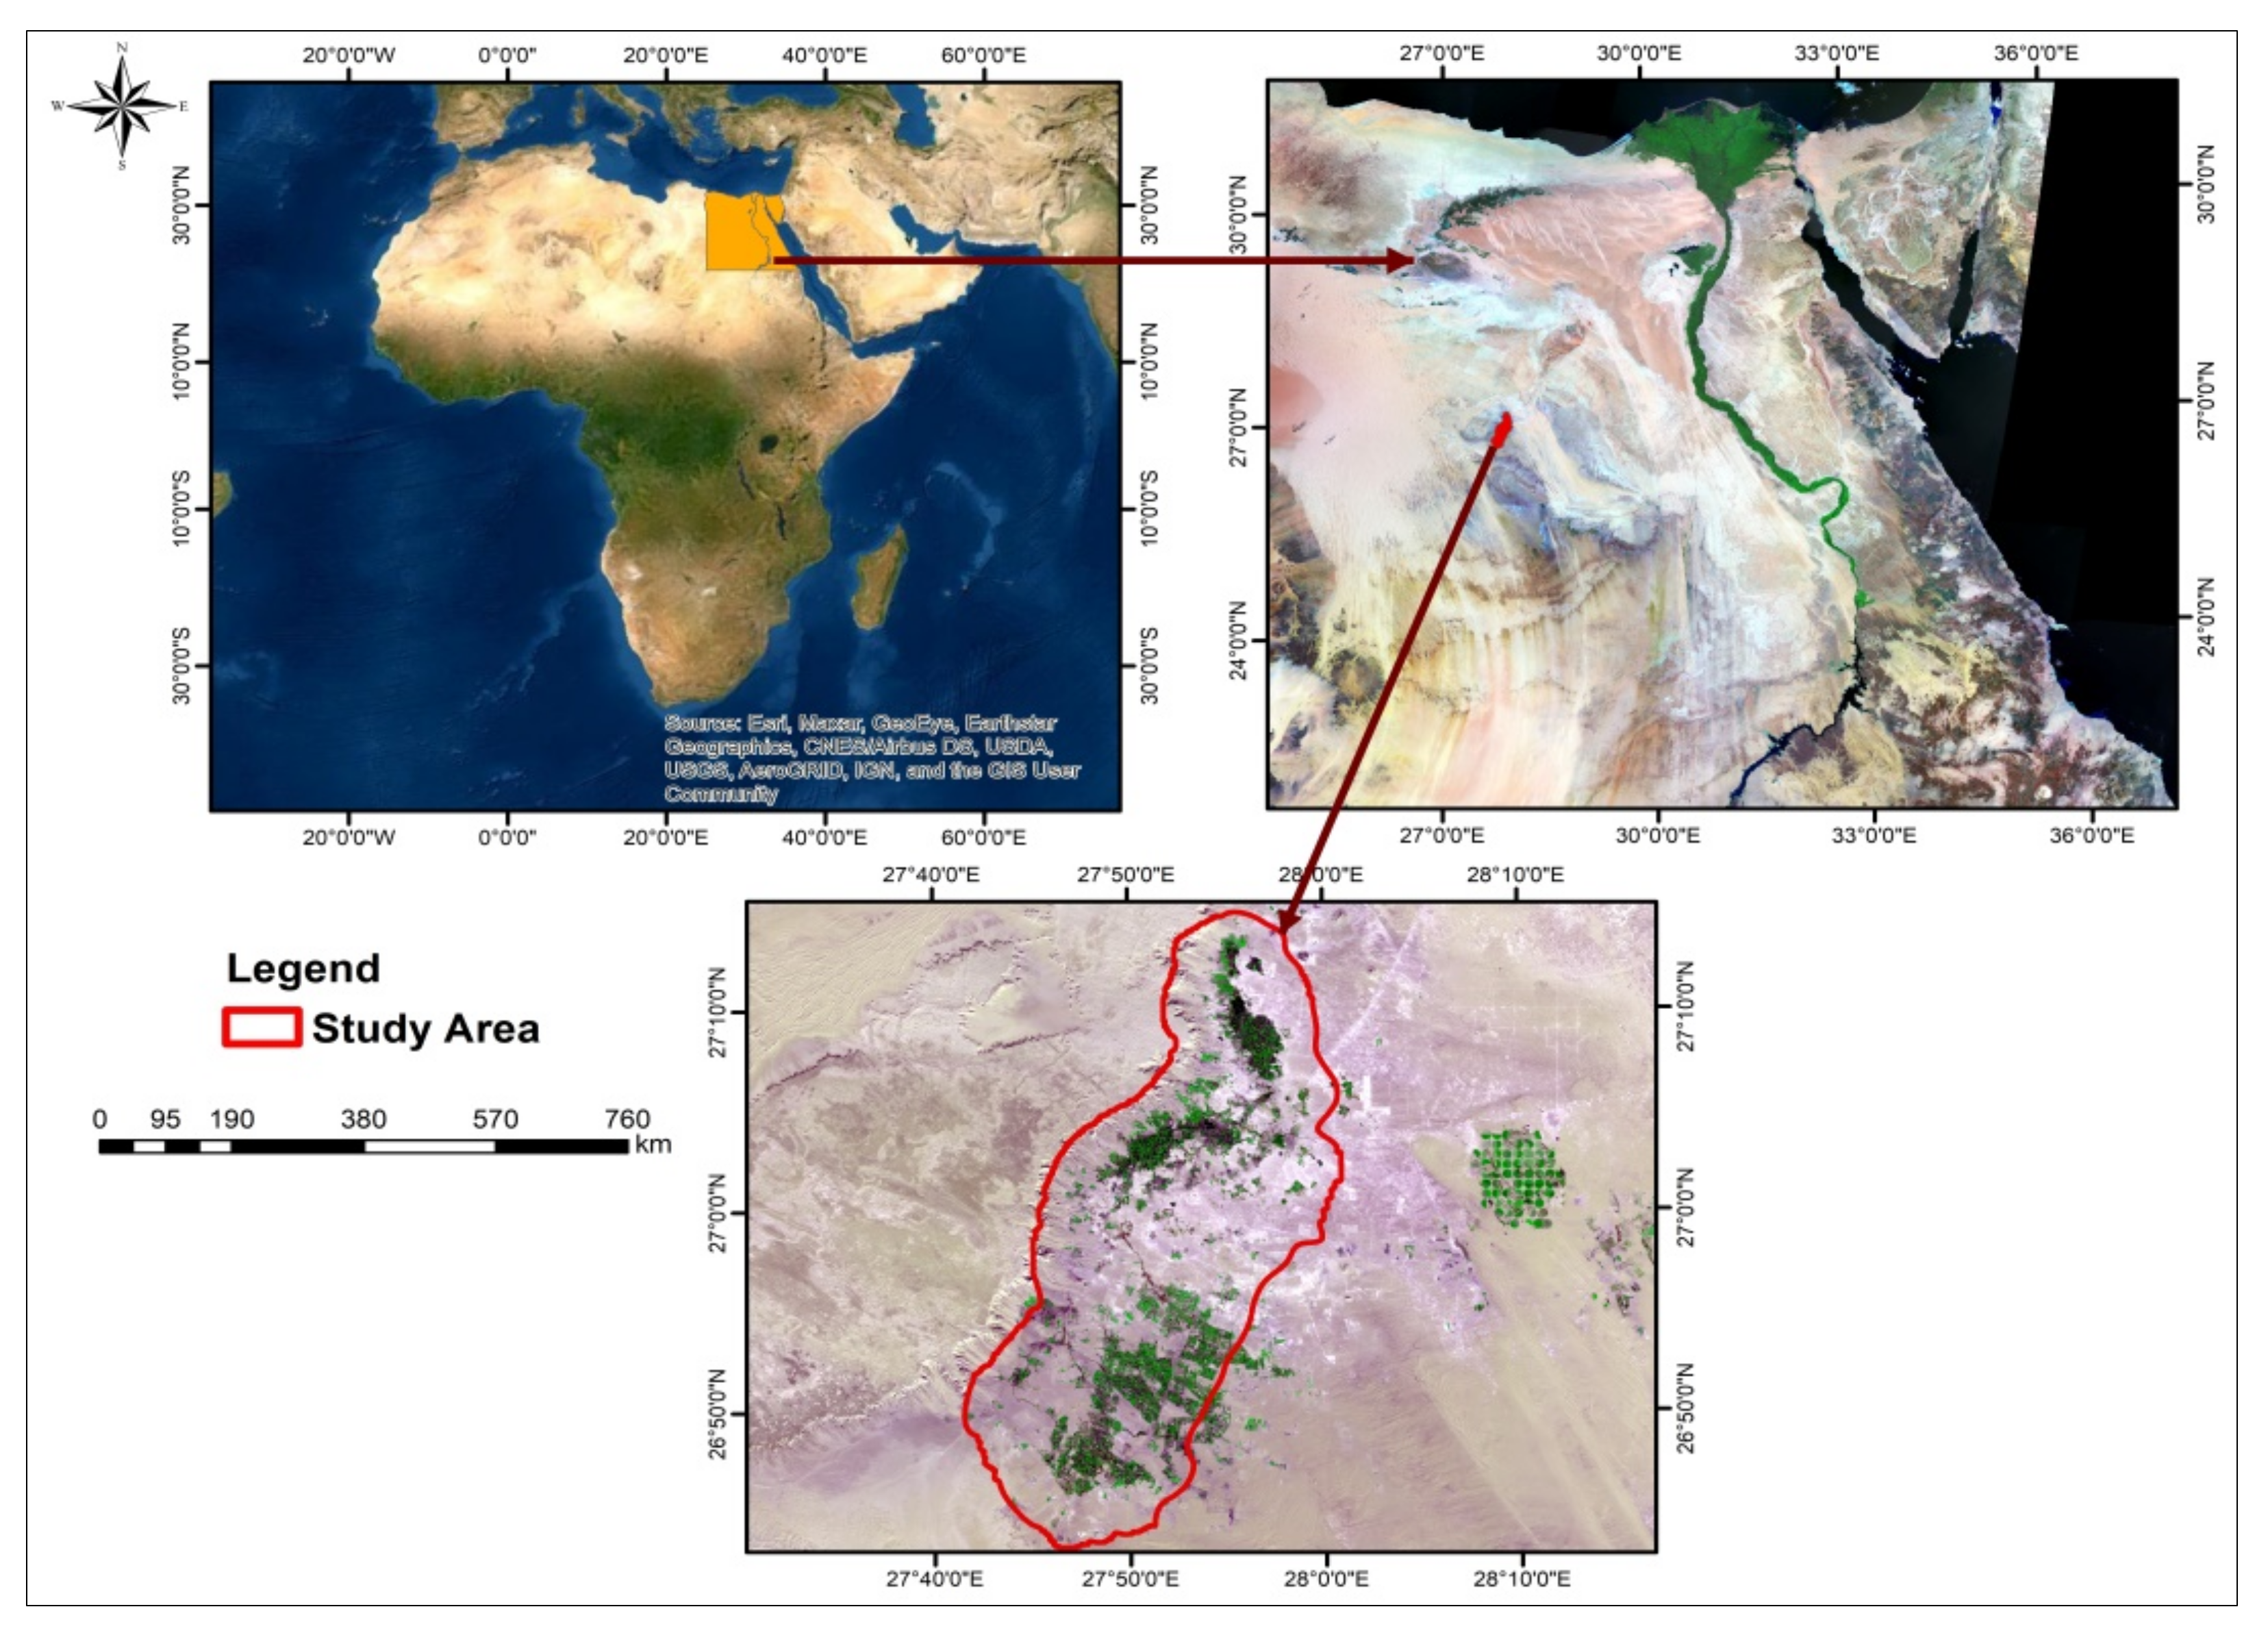
2.1. The Study Area

El-Farafra is one of the inland oases in the Egyptian western desert, approximately midway between the Dakhla and Bahariya oases. The study area was conducted in 987.77 km2 (Figure 1). The geographic location is in the UTM zone 35 between longitudes 27°39′41″ to 28°00′17″ E and latitudes 26°43′07″ to 27°14′45″ N. The climate in the investigated area is ordered as hot desert, the minimum temperate is 6 °C and occurs during January, while the highest is 39 °C and occurs during August. The mean annual temperature is 22.92 °C and the total annual rainfall is 0.25 mm. The mean annual potential evapotranspiration (PET) is 6.14 mm day−1. The mean annual relative humidity averages 36.33%, while the mean annual wind speed is 8.18 km h−1 [25]. The area is covered by sedimentary sequences of Upper Cretaceous to Quaternary eras. In the western parts, chalky limestone of Tarawan Formation (Paleocene), Farafra limestone (Eocene) and Esna shale Formations (Miocene) are predominant. The remaining parts are covered with chalk of Upper Cretaceous (Dakhla and Khoman) and Quaternary Formations (Sabkha). The elevation height ranges from 42 to 342 m above sea level.

2.2. Remote Sensing and GIS Work

Two scenes (T35RNL and T35RNK) from the Sentinel-2A Multispectral Instrument (MSI) sensor satellite with a 10 m spatial resolution were acquired from the Copernicus Data Hub gateway (https://scihub.copernicus.eu/, accessed on 23 December 2019). A digital elevation model (DEM) with 12.5 m pixel size of Advanced Land Observing Satellite (ALOS) Phased Array type L-band SAR (PALSAR) was also downloaded from the Alaska Satellite Facility (ASF) (https://www.asf.alaska.edu/sar-data/palsar/, accessed on 26 February 2021). The digital processing of satellite images was performed using ENVI 5.1 software, including atmospheric correction (FLASH module), stretching, band-stacking, mosaicking and spatial-spectral subsets. Thereafter, an unsupervised classification (ISO DATA classifier) followed by a supervised classification (maximum likelihood) was executed. Within ArcGIS 10.8 (ESRI Co, Redlands, CA, USA), slope classes and aspect were extracted from the DEM. In the light of the processed image, geological map and DEM, the different landforms were delineated [25], and the mapping units were described [26].

2.3. Field Work and Laboratory Analyses

Twenty-eight geo-referenced soil profiles (Figure 2) were dug to a 150 cm depth or to lithic contact. General features of each profile were recorded according to the Food and Agriculture Organization of the United Nations (FAO [27]. Ninety-three soil samples were collected from the subsequent horizons. Thereafter, samples were air-dried, ground, and sieved through a 2-mm mesh. Soil analyses were carried out according to the Soil Survey Staff [28]. The particle size distribution was performed using the standard pipette method. pH and electrical conductivity (EC) were measured in the 1:2.5 soil-water suspensions and in the soil paste extract, respectively. The soil organic matter (OM) was determined using the standard Walkley–Black procedure. The cation exchange capacity (CEC) and exchangeable sodium were determined using the ammonium acetate pH 7.0 method. Calcium carbonate was determined using the calcimeter. The gypsum content was determined using the acetone precipitation method. The studied area was classified into four main landscapes (physiographic units) i.e., Plateau (Pt) that divided to Summit (Pt 111) and Escarpment (Pt 211); Piedmont “Slopping area” (Pd 111); Plain (Pl) that divided to High terraces (Pl 111), Low terraces (Pl 112), Basin (Pl 113) and Salt marshes (Pl 121) and Water bodies (Wb).

2.4. Modeling Desertification in the Studied Area

This procedure involved five steps as follows: (1) quantifying the original quality indices of the MEDALUS method; (2) developing a wind erosion protection index; (3) establishing a weight for each index, (4) generating a GIS-based model and (5) model validation, (Figure 3).

2.4.1. Quantifying the Original MEDALUS Indices

Parameters used for defining the four standard indices of the MEDLUS method are shown in Table 1. The indices involve the soil quality index (SQI), climate quality index (CQI), vegetation quality index (VQI) and land management quality index (MQI). Each index was calculated using the geometric mean algorithm of number (n) of scores (S) as follows:
Index x = S 1 S 2 S 3 S n 1 / n
For the SQI, the weighted mean values for texture, EC, ESP, CaCO3, and gypsum were calculated by multiplying the value of the property by the thickness of the soil horizon and divided by the depth of soil profile.

2.4.2. Wind Erosion Protection Index (WEPI), Index of Land Susceptibility to Wind Erosion (ILSWE)

The index of land susceptibility to wind erosion protection [15,16] was computed to estimate the potential annual soil loss (t ha−1 year−1) as follows:
ILSWE = CQF WEF SCF VCF SRF
where CQF is the climatic quality factor; WEF is the wind-erodible fraction factor; SCF is the soil crust facto; VCF is the vegetation cover factor and SRF is the surface roughness factor.
1. Climate quality factor (CQF)
This factor was calculated as follows:
CQF = 1 100 i = 1 i = 12 Wi 3   PETi Pi / PETi   di
where: Wi is the mean monthly wind speed (m s−1) at 2 m height in month i, PETi is the potential evapotranspiration (mm) in month i, Pi is the precipitation (mm) in month i, and di is the total number of days in month i.
2. Wind-erodible factor (WEF)
The WEF (t ha−1 year−1) was calculated based on the soil contents of sand (SA), silt (SI), clay (CL), and organic matter (OM) as follows:
WEF = ( 29.09 + 0.31 SA + 0.17 SI + 0.33   SA / SL 2.59 SOM 0.95 CaCO 3 ) / 100
3. Soil crust factor (SCF)
The SCF factor was computed as follows:
SCF = 1 / ( 1 + 0.0066 Clay 2 + 0.21 Organic   Matter 2 )
4. Vegetation cover factor (VCF)
The VCF was expressed by the fractional vegetation cover (FVC) derived from the Sentinel 2-A satellite image. The VCF was computed based on values of the NDVI of highly dense vegetation (NDVIv) and bare soil (NDVIs) as follows:
VCF = NDVI NDVIs / NDVIv NDVIs
5. Surface roughness factor (SRF)
The SRF represents the ratio of ridge height to ridge spacing and is expressed as an index with a range of 0 (high ridges and furrows) to 1 (flat, bare, and smooth field) [32]. The focal statics within the ArcGIS 10.x tools was used to calculate SRF from DEM, as follows:
SRF = DEM Mean DEM Min DEM Max DEM min
6. Wind erosion severity classes
The ILSWE are normally arranged in five erosion severity classes, including very slight (<2), slight (2–5), moderate (5–10), high (10–50), and very high (>50). Each one was assigned a score value ranging from 1 (very slight) to 2 (very high) and these scores represented the WEPI.

2.4.3. Establishing a Weight Value for Each Index

Based on the communality extracted from FA, each of the five quality indices was assigned a weight value. Communality indicates the portion of the variance explained by each index, considering the factor model estimated. High value denotes the high contribution of this factor to explain the phenomenon examined [20].

2.4.4. Generating a GIS-Based Model

Five thematic layers representing SQI, CQI, VQI, MQI and WEPI were generated using the inverse distance weighted (IDW) interpolation technique. The IDW has been known as a powerful technique used for mapping soil and other environmental attributes [33,34]. Thereafter, they were overlain in a single map representing ESAs to desertification using the weighted sum algorithm.

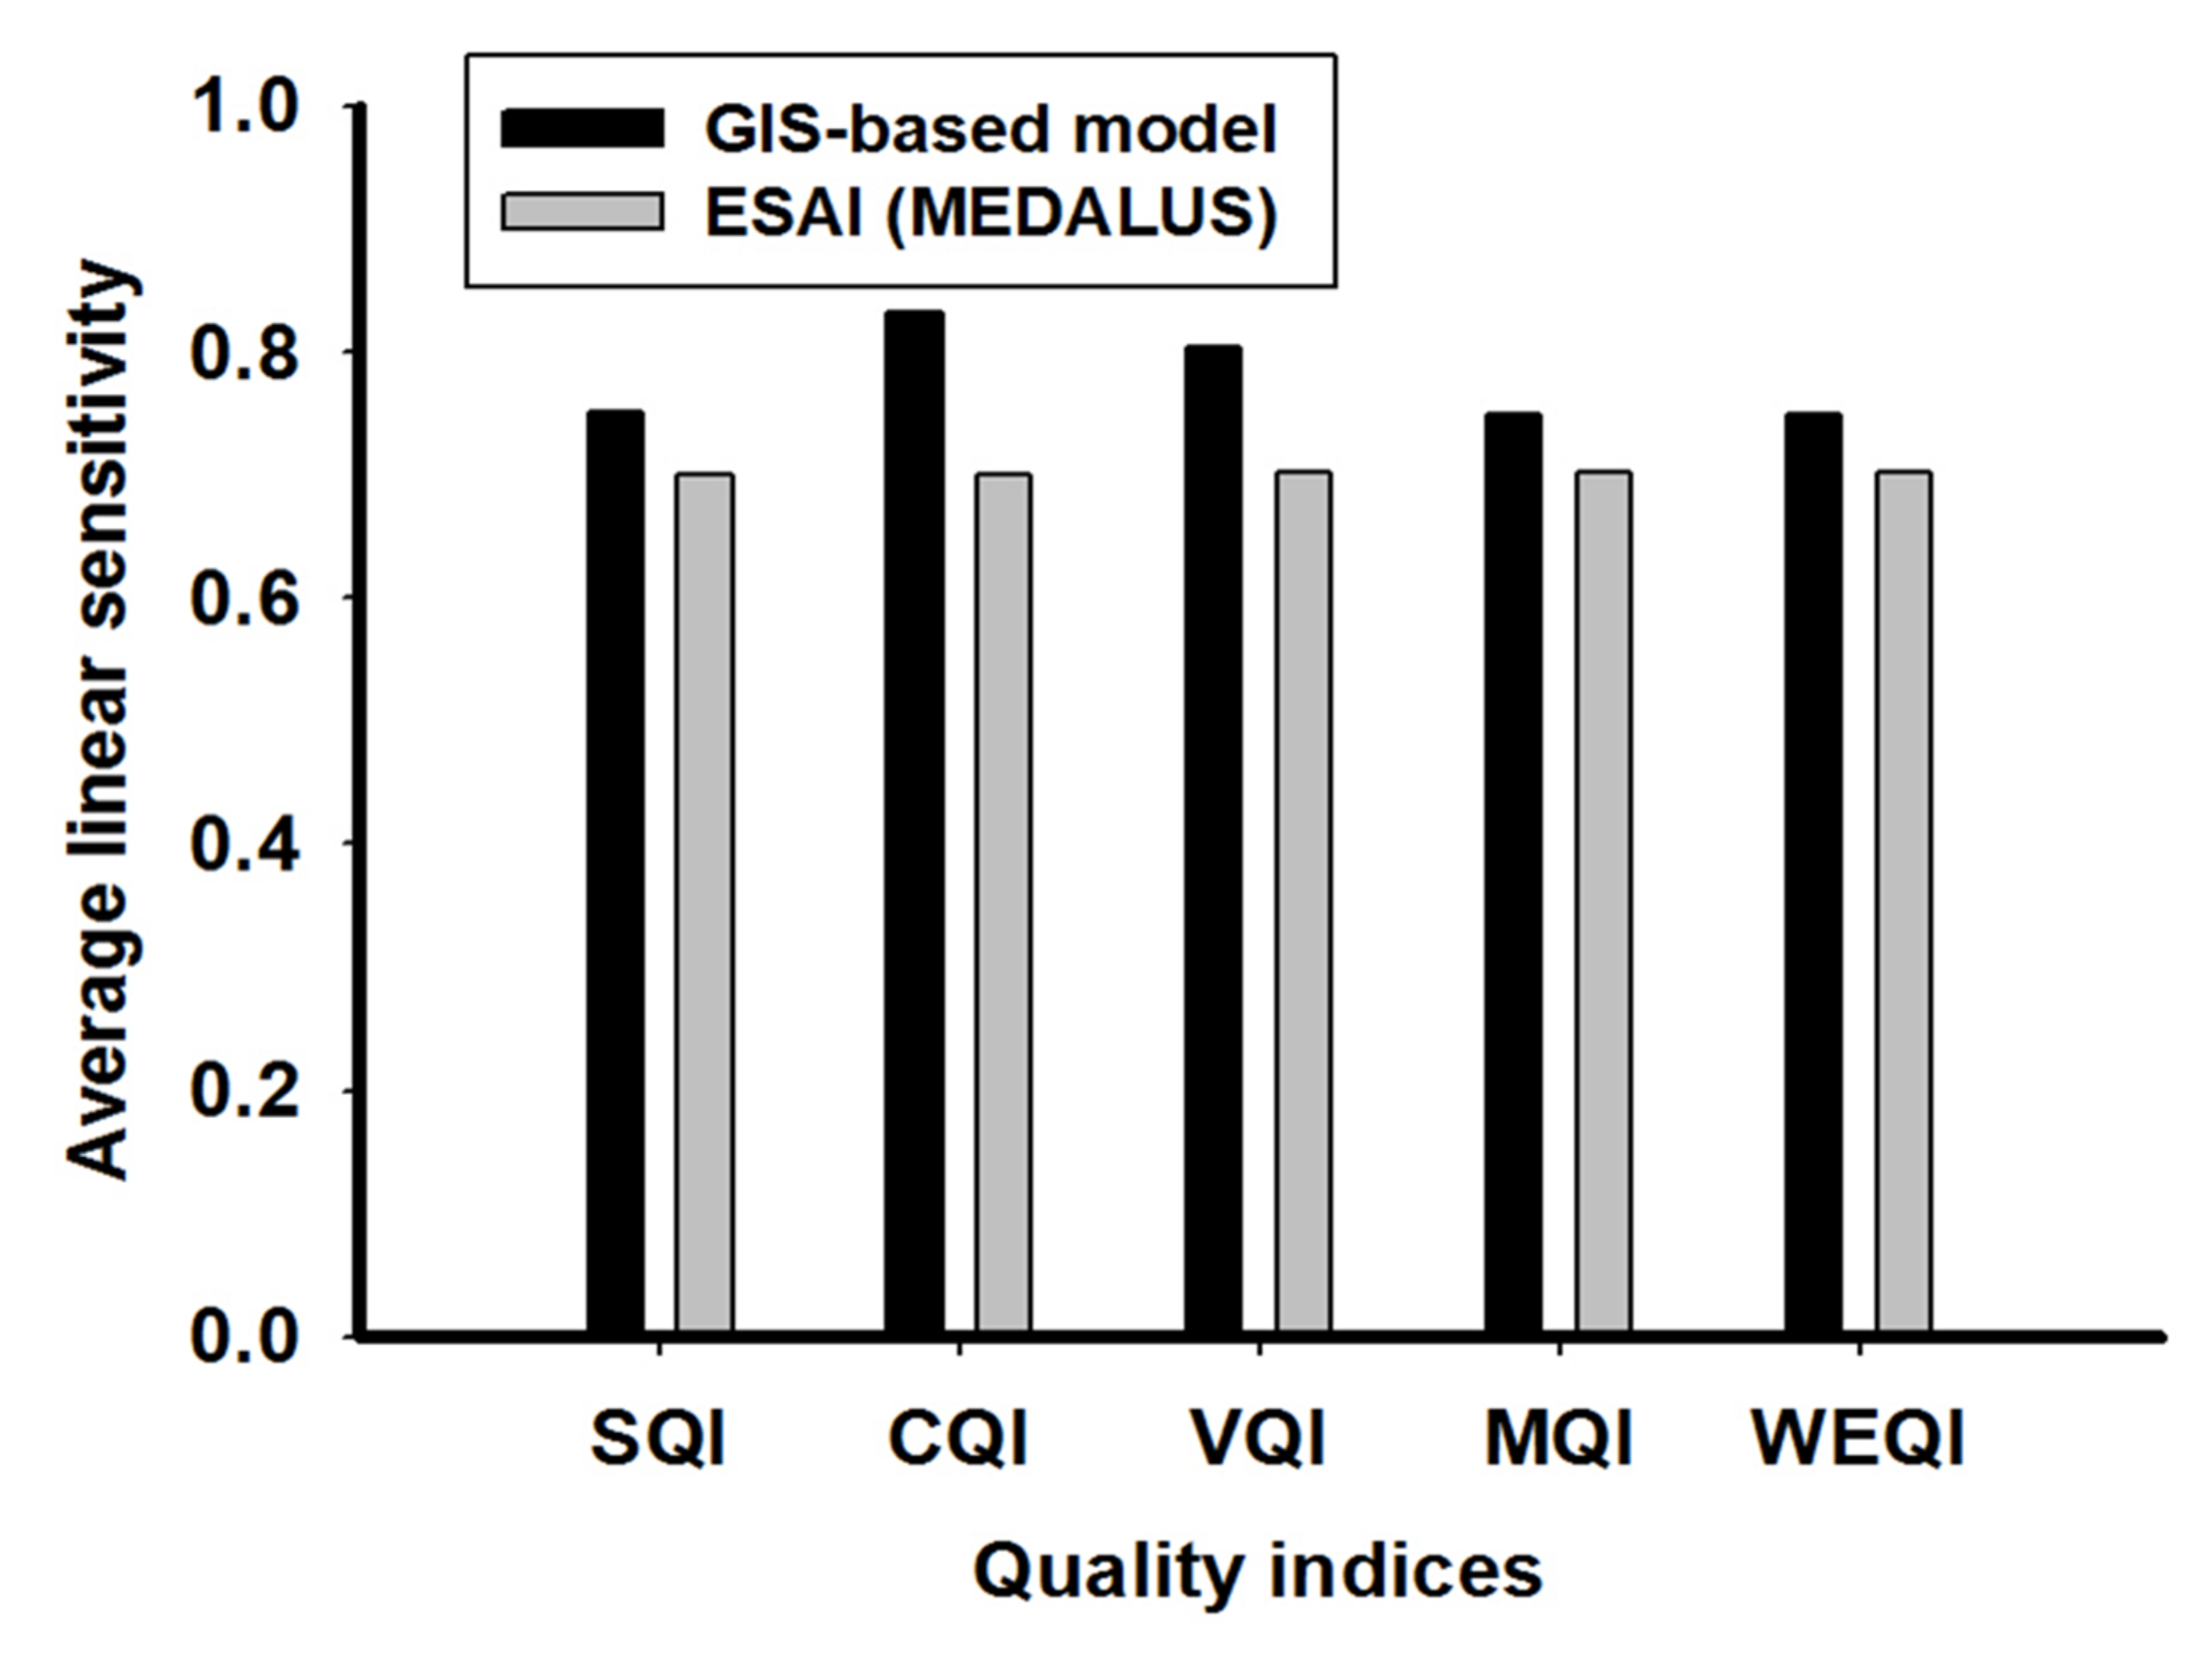
2.4.5. Model Performance

Validation was performed by comparing results of the developed model against those obtained by the environmentally sensitive area index (ESAI) provided in the original MEDALUS model. The geometric mean algorithm of the five quality indices were used for calculating the ESAI as follows:
ESAI = SQI CQI VQI MQI WEPI 1 / 5
The average linear sensitivity (ALS) method [35,36] was used for calibration of the results. The ALS denotes a relative normalized change in output in relation to a normalized change in input as follows:
ALS = O x O n O m I x I n I m
where: In and Ix represent the minimum and maximum values of the considered input parameter and On and Ox are the values of the model output for the corresponding input values; Im is the mean value of In and Ix and Om is the mean value of On and Ox. The ALS values express the correlation between the model output and the individual parameter.

3. Results

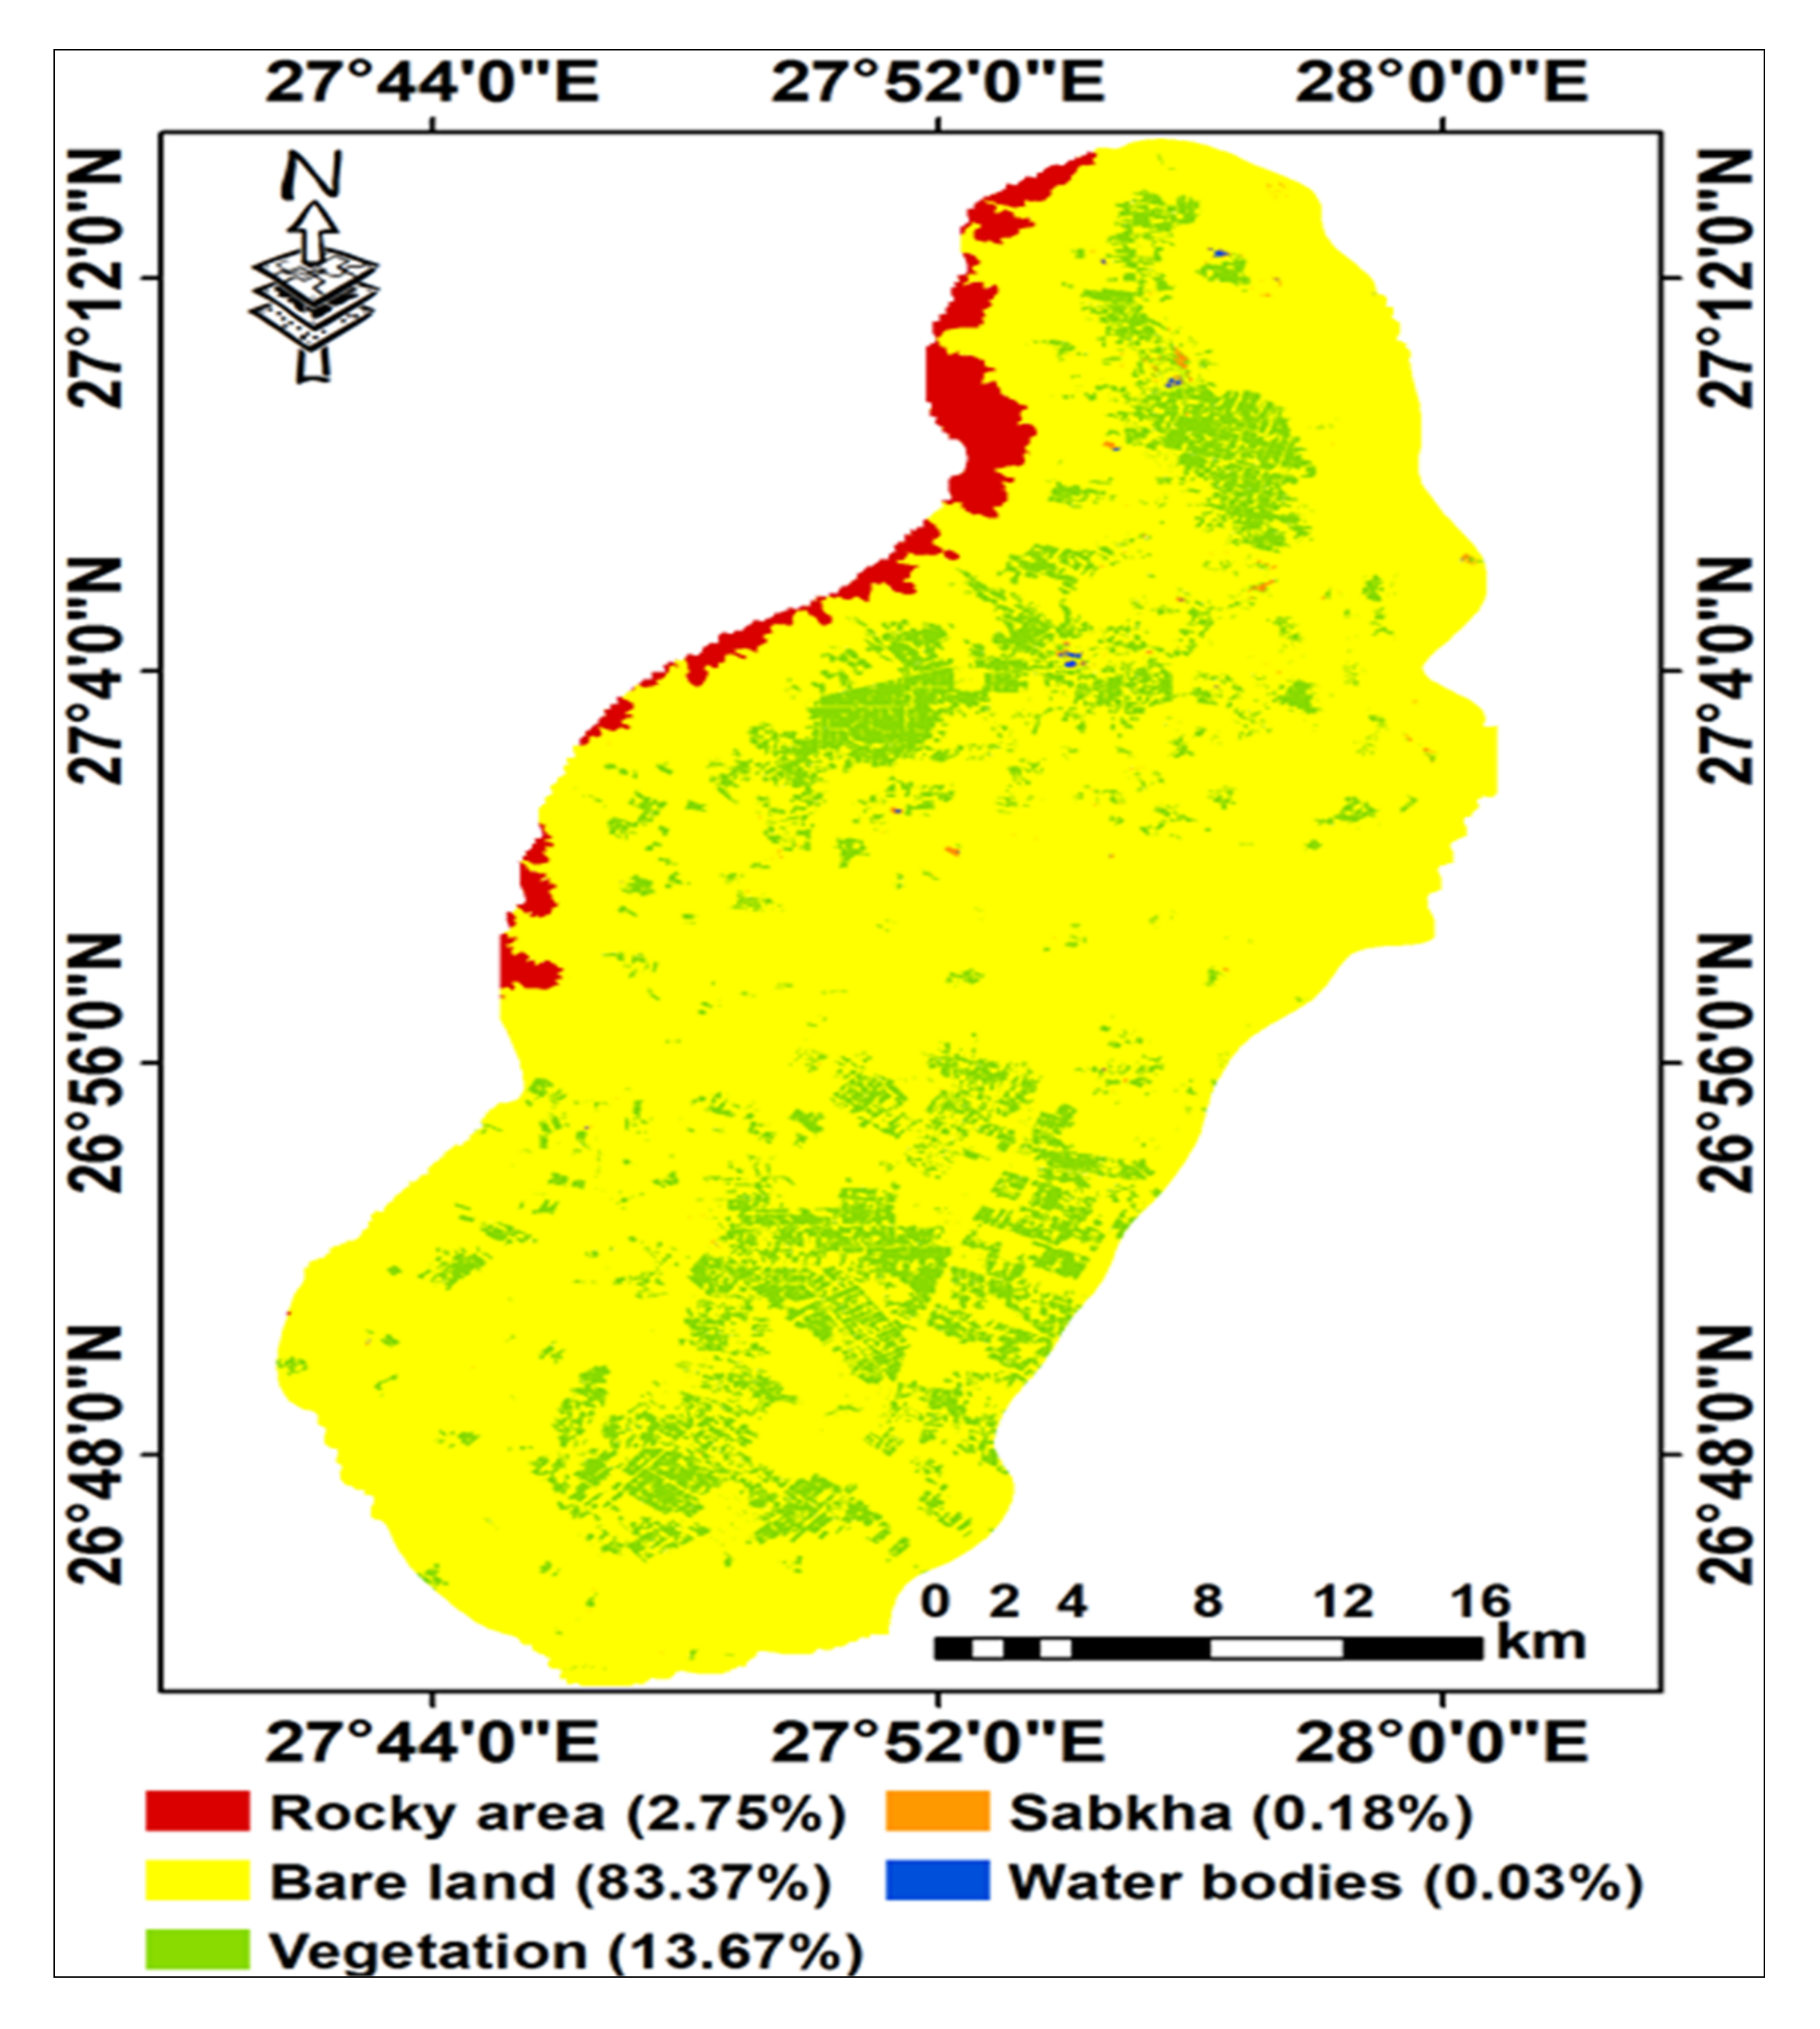
3.1. Land Use/Land Cover

According to three classification methods i.e., Parallelepiped, Mahalanobis Distance and Maximum Likelihood with overall accuracy of 96.15%, 91.31% and 97.59%, respectively, and Kappa coefficient of 0.95, 0.88 and 0.97, respectively, the best classification method is Maximum Likelihood, and according to these results, the investigated area was dominated by five land cover classes: rocky areas, bare land, vegetation, sabkha and water bodies (Figure 4). They occupied 27.15, 823.53, 134.98, 1.78 and 0.33 km2, representing 2.75, 83.37, 13.67, 0.18 and 0.03% of the total area, respectively. The natural vegetation occurred in small scattered areas covered with perennial grasses (Arundinoideae) around the lakes and halophytic species (Chenopodiaceae) of the sabkha. According to the official statistics, field crops dominated 69% of the total cultivated area of which a perennial crop (alfalfa) covers 15%, while annual crops (wheat, barely clover, broad bean, maize, sorghum, and groundnuts) cover 54%. The remaining area was occupied by orchards (19%); mango, date palm, guava and timer tress, and vegetable crops (13%); potato, tomato, onion, and arugula.

3.2. Geomorphology and Soils

Results in Table 2 and Figure 2 show that the studied area includes four main landscapes; plateau (Pt), piedmont (Pd), plain (Pl) and water bodies (Wb). The Pt covers an area of 27.15 km2 (2.75%) in the western part. The Pd covers an area of 20.55 km2 (2.08%) at the base of the Pt. Soils of Pd are classified as Typic Torriorthents. The Pl covers the bottom of the area and occupies the majority of the total coverage (95.14%). It includes four units; high terraces (Pl 111), low terraces (Pl 112), basin (Pl 113), and salt marshes (Pl 121), repressing 16.00, 42.65, 36.46 and 0.12% of the total area, respectively. Soils of the Pl 111 unit are classified as Entisols, including sub-great groups, Typic Torripsaments. Soils of the Pl 112 unit are classified as Entisols (77%) and Aridisols (23%). The Entisols include sub-great groups, Typic Torripsaments, while the Aridisols include two sub-great groups, i.e., Sodic Haplocalcids (15%) and Typic Haplocalcids (8%). Soils of the Pl 113 unit are classified as Entisols (80%) and Aridisols (20%). The Entisols include one sub-great group (Typic Torripsaments), while the Aridisols include two sub-great groups (Sodic Haplocalcids and Typic Haplocalcids).

3.3. Soil Properties

Descriptive statics of soil properties (Table 3) show that the soil depth ranged from 105 to 150 cm, slope range of 0.01 to 3.44. The soils had little to large gravel content with a range of 2.89 to 29.07%. The soil pH ranged from 7.49 to 8.95, while the EC varied from 2.67 to 42.61 dS m−1. Calcium carbonate and gypsum content varied from 22.76 to 321.97 g kg−1 for the former and from 1.21 to 31.21 g kg−1 for the latter. The OM content varied from 1.24 to 7.82 g kg−1. The CEC ranged between 8.61 to 19.90 cmolc kg−1. The ESP varied from 7.92 to 26.83. The sand dominated the soil particle size distribution averaging about 79% of the fine earth followed by silt (12%) and clay (9%).

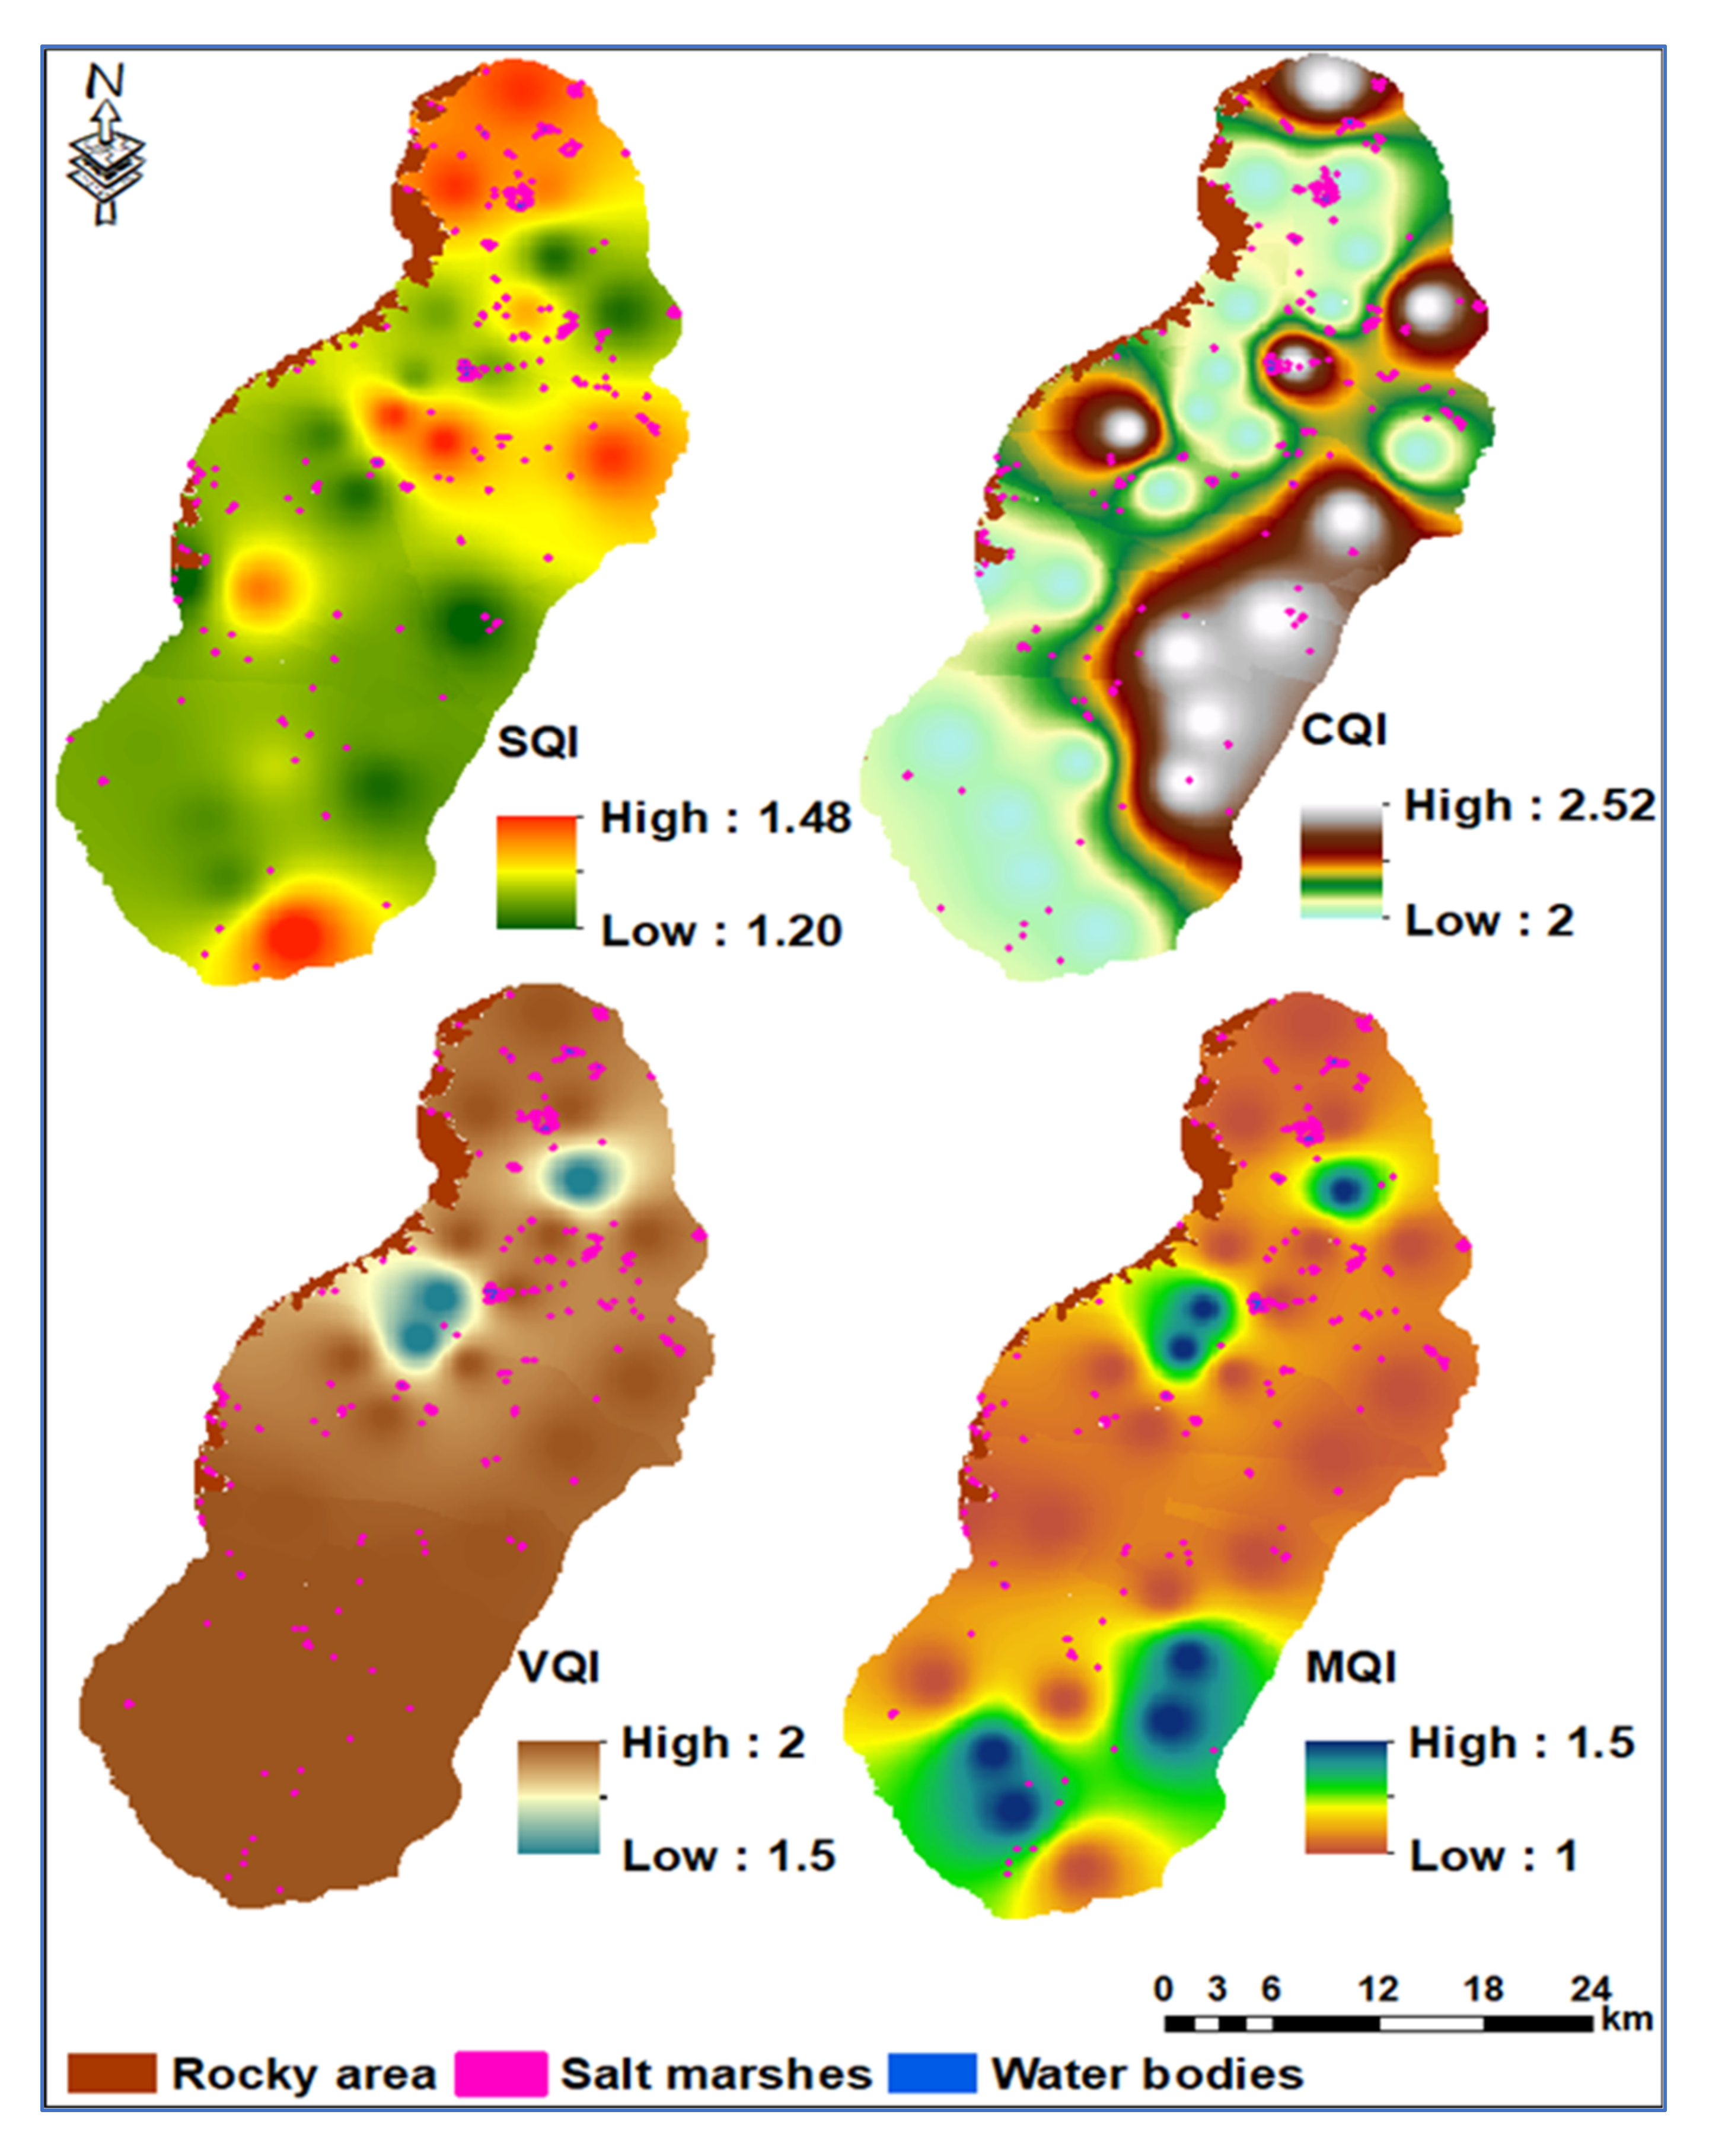
3.4. Quantifying the Original Indices

Results in Figure 5 indicate that the SQI ranged from 1.20 to 1.48, indicating moderate to low soil quality class. The moderate quality soils occupied 96.38% of the total area, while the low quality soils covered only 0.72% (Table 4). The CQI ranged from 2.00 to 2.52, indicating low climate quality due to low rainfall and high evaporation rates (Figure 5). Of the 26bstudied soil sampling sites, 18 sites occurred in the north- and east-facing slopes, while the remaining sites were on the south- and west-facing slopes.
The VQI varied from 1.20 to 2.00 (Figure 5), indicating moderate to very low vegetation quality. Areas of very low vegetation quality covered nearly 96% of the total area, while low quality areas covered about 1% of the total area (Table 4).
The land management quality varied from high to moderate, since the MQI ranged from 1.00 to 1.50 (Figure 5). Areas of high land management quality covered 77.62% of the total area, while those of moderate quality occupied 19.48% (Table 4).

3.5. Assessment of Wind Erosion Protection Index (WEPI), Index of Land Susceptibility to Wind Erosion (ILSWE)

Results in Figure 6 show values of the five parameters used for calculating the ILSWE; CQF, WEF, SCF, VCF, and SRF. Combining the five factors, the ILSWE ranged from 0.05 to 15.81 Mg ha−1 year−1, which demonstrated very slight to moderate wind erosion severity. These values were transformed to the corresponding WEPI (Table 5) with a range of 1.00 to 1.50, indicating very high to moderate quality. According to the WEPI, 90.90% of the total area was classified as high (areas with slight erosion severity), 1.07% as very high (areas with very slight erosion severity), and 5.13% as moderate (areas with moderate erosion severity).

3.6. Multivariate Analysis

Pearson’s correlation matrix (Table 6) shows that the CQI had a significant negative correlation (p < 0.05) with the WEPI. The VQI indicated highly significant negative correlations (p < 0.01) with MQI and WEPI, while the MQI showed a highly significant positive correlation with the WEPI.
Results in Table 7 indicate that the two components with eigenvalues > 1.0 explained 74.76% of the total variance. The first component was responsible for 46.79% of the total variance and included WEPI with high positive loadings and VQI with high negative loading. The second component accounted for 27.98% of the total variance and was dominated by CQI with high positive loading and SQI with high negative loading. According to weight values derived from the FA, the five indices could be arranged based on their relative importance as follows: MQI (0.21) = WEPI (0.21) > SQI (0.20) = VQI (0.20) > CQI (0.18).

3.7. Environmentally Sensitivite Areas to Desertification
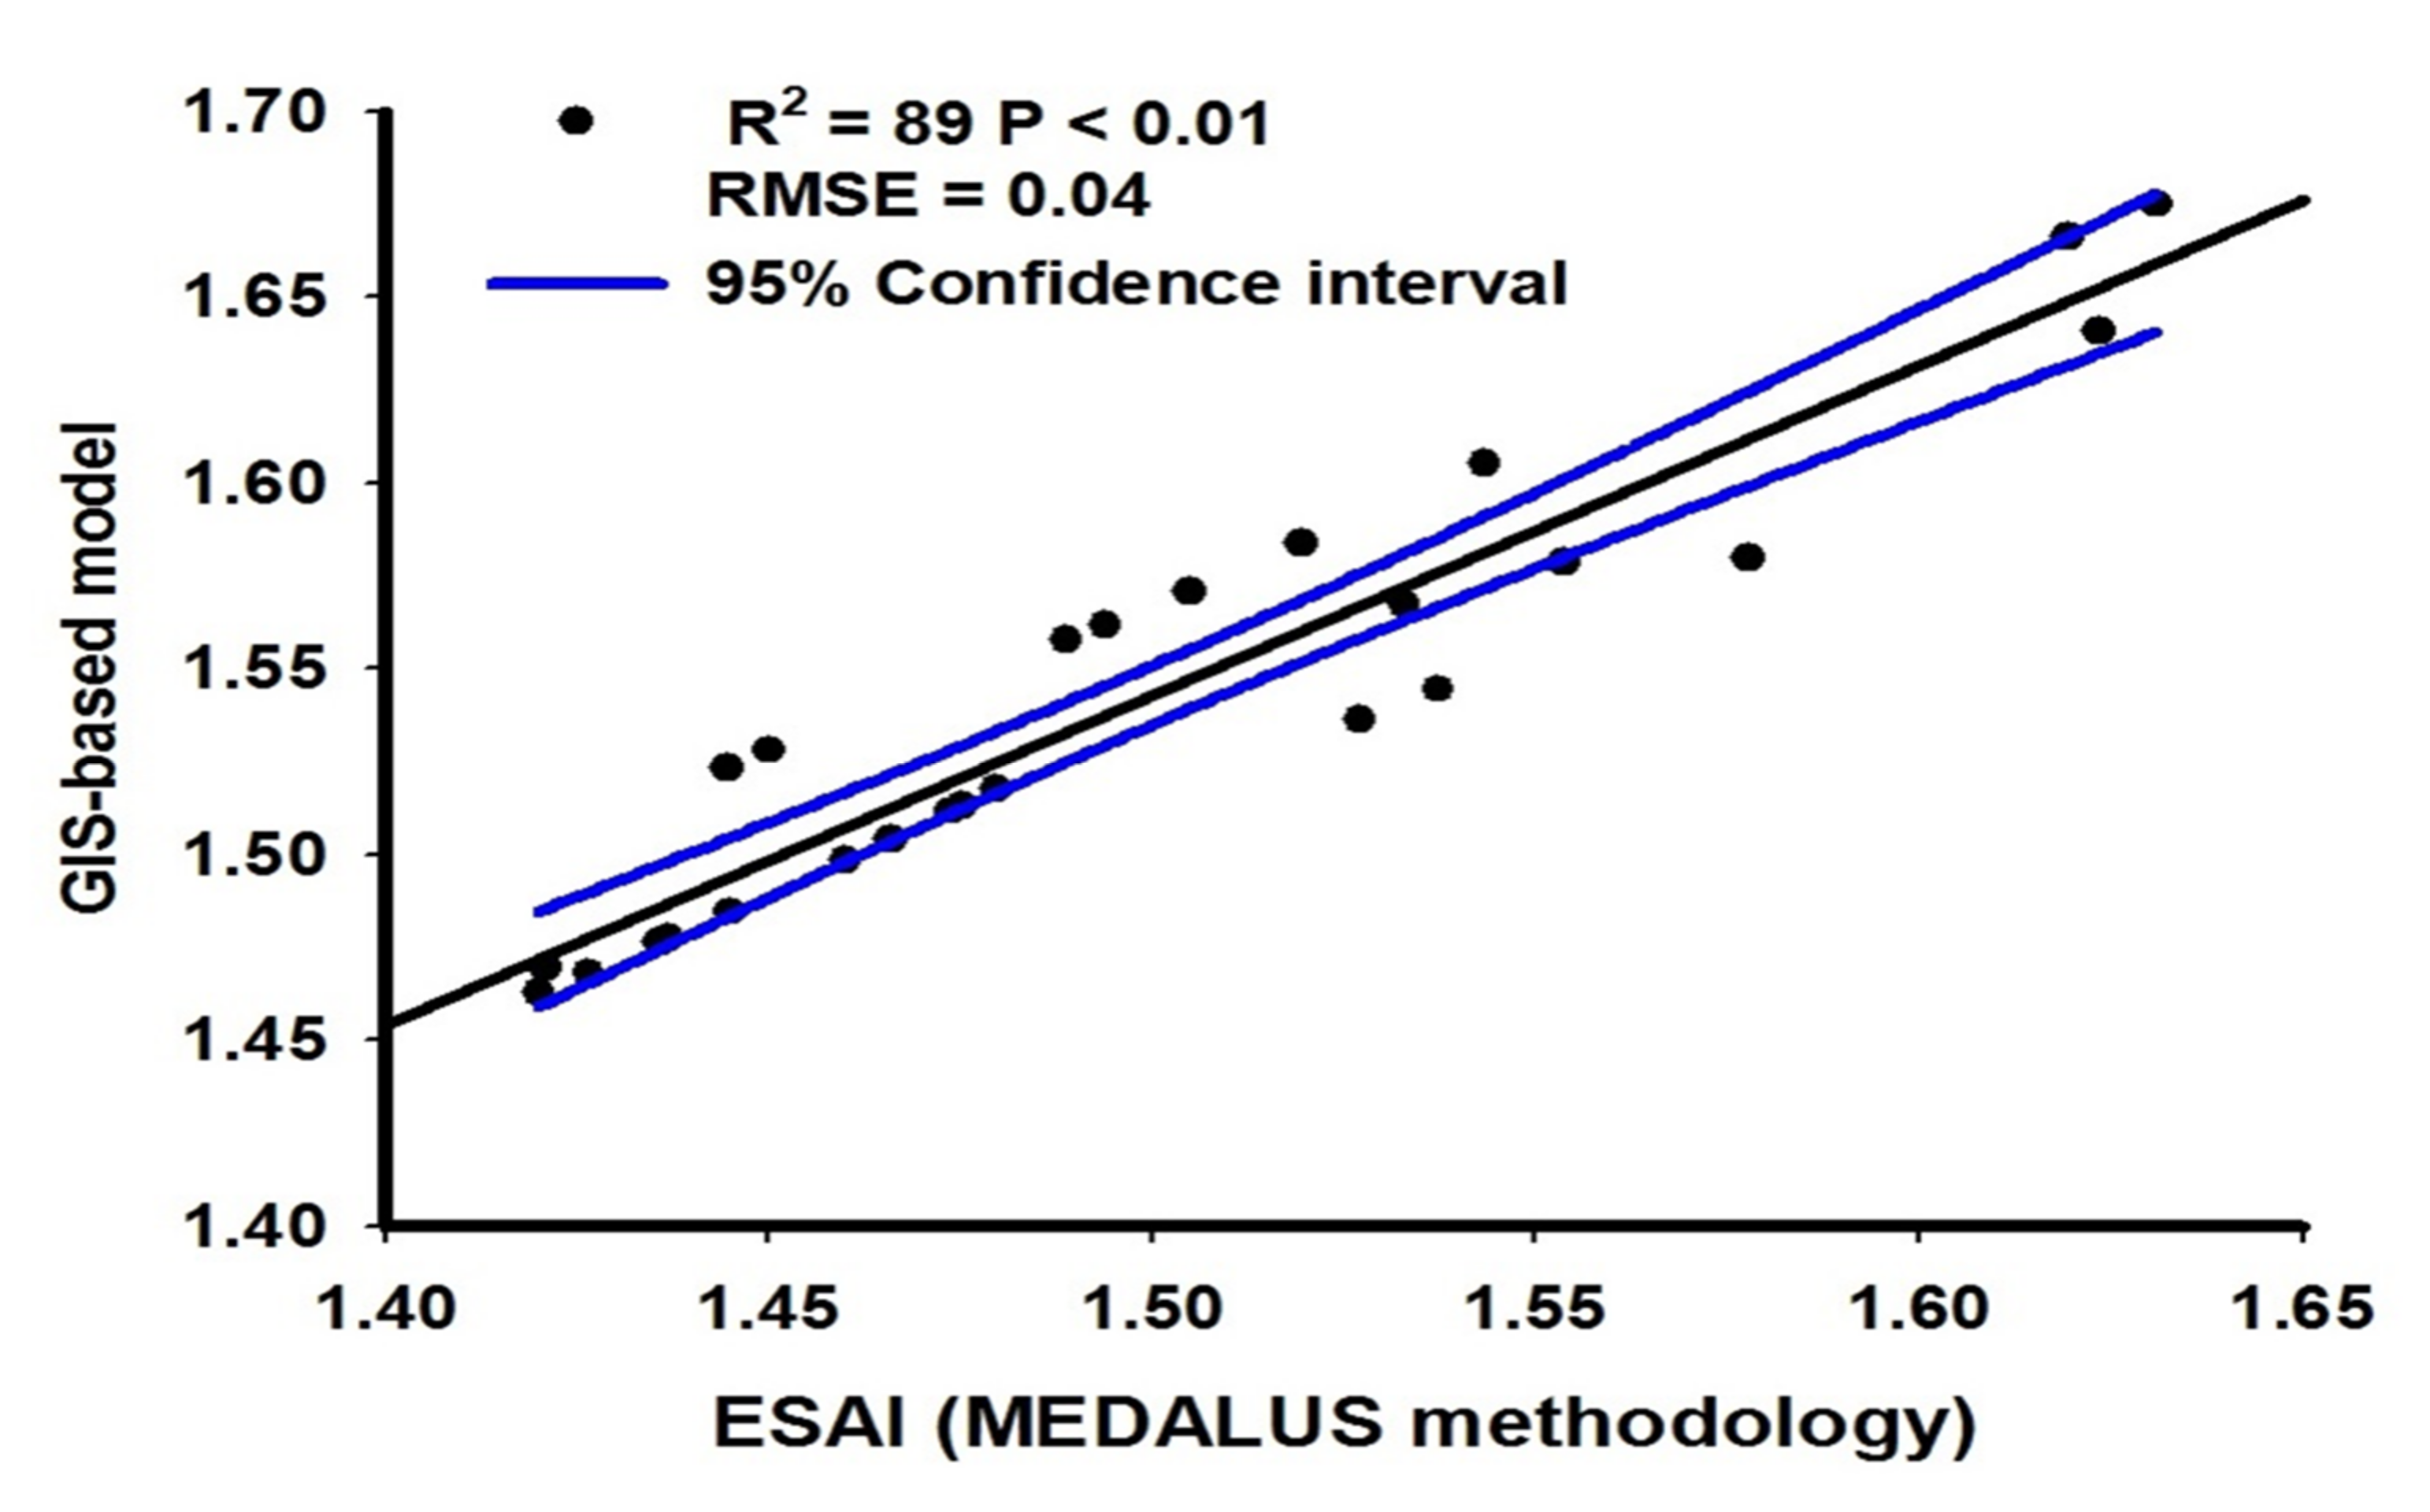
Results of the proposed model (Figure 7 and Table 8) showed that the studied area was classified as critical-sensitive to desertification. The high-critical ESAs (C3) occupied 59.25% of the total area, while the medium-critical ESAs (C2) occupied 37.85% of the total coverage. However, the spatial distribution of ESAs under this model indicated that 18.37% of the total area was classified as high-critical (C3) and 78.73% as medium-critical.

3.8. Validation

The statistical analysis indicated no significant differences (p < 0.01) between the proposed model and the ESAI. Furthermore, values of R2 and RMSE (Figure 8) were 0.89 and 0.04, respectively, which demonstrates a high correlation between the estimated values from both models. However, the sensitivity analysis (Figure 9) revealed that the outputs of the proposed model showed higher values of ALS to the five indices rather than those obtained by the ESAI.

4. Discussion

4.1. Geomorphology and Soils

Analysis of the main scene extracted from the satellite images through DEM and field observations enabled the geomorphological unit’s identification in the investigated area. Soils and sediments affect current operations, and to maintain evidence of past operations, one must refer to the evolutionary stages in the landscape and provide a basis for the relative sequence and absolute time.
Results in Table 2, show four main landscapes; plateaus, piedmonts, plains and water bodies in the investigated area. Plateau represented 2.75% of the study area. Piedmont covers an area of 2.08% and soils of piedmont are classified as Typic Torriorthents. The plain occupies the majority of the study area with a total coverage of 95.14%, and includes four geomorphic units: high terraces, low terraces, basins, and salt marshes. Soils of the high terraces are classified as Entisols, (Typic Torripsaments). Soils of the low terraces are classified as Entisols and Aridisols. The Entisols include sub-great groups (Typic Torripsaments), while the Aridisols include two sub-great groups, i.e., Sodic Haplocalcids and Typic Haplocalcids. Soils of the basin unit are classified as Entisols and Aridisols. The Entisols include sub-great groups (Typic Torripsaments), while the Aridisols include two sub-great groups (Sodic Haplocalcids and Typic Haplocalcids). The water bodies representing 0.03% of the total area. Some of these water bodies are natural lakes of brackish or saline water that were formed as a result of the uncontrolled spilling of water and flooding of the plains or due to the shallow groundwater table [37]. Other man-made lakes were developed in order to collect water drained from irrigated lands.

4.2. Land Use/Land Cover

Land cover data indicates how much of the study area is covered by land uses i.e., water bodies, agriculture, urban and other land and water types and can be determined by analyzing satellite imagery. Therefore land cover maps provide information to help decision makers best understand the best use of the land. Land use maps help managers use the landscape for agriculture expansion, soil conservation, or a combination of uses.
The study area was dominated by five land cover classes: rocky areas, bare land, vegetation, sabkha and water bodies, representing 2.75, 83.37, 13.67, 0.18 and 0.03% of the total area, respectively. Field investigations indicated two types of vegetation, i.e., natural vegetation and cropland. The current land cover status accelerates desertification risks due to low vegetation cover (40–10%) and the predominance of annual crops, providing low protection against wind erosion and drought resistance [7]. According to AbdelRahman et.al., [38] Siwa Oasis in Egypt experiences several problems that affect its development: the deterioration of cultivated lands as well as changes in land use and land cover are the main problems in the oasis. Improper land management is the main cause of soil salinization and water logging degradation processes in the area. The study also determined a rapid increase in salt marshes and saline lakes. This highlights the risks that could affect agricultural land in the oasis. To conserve the oasis requires immediate measures to confront the worsening deterioration problems in the oasis, such as salinization, water logging and encroachment of sand dunes [38].

4.3. Soil Properties

All soils contain mineral particles, organic matter, water and air; the combinations of these determine the soil’s properties such as texture, structure, porosity, chemistry and color. Soil properties such as alkalinity and salinity limit soil fertility, and soil type plays an important role in agricultural sustainability, essential to improve land production and conservation of natural resources to prevent further land desertification [39,40,41,42,43]. Table 3 represents soil depth and refers to deep to very deep soils and soils which were flat to gently sloping. The soils had little large gravel content. The soils were slightly to strongly alkaline, non-saline to strongly saline [29], moderately to extremely calcareous and slightly gypsiric [27]. According to Hazelton and Murphy [39], the soil had extremely low to very low organic matter, but low to moderate cation exchange capacity. The ESP indicated none to moderate sodicity (alkalinity) hazards [30].

4.4. Quantifying the Original Indices

Results in (Table 4) indicate that the SQI was classified into a moderate to low soil quality class representing 96.38% and 0.72% of the total area, respectively. Little variations in soil quality could be attributed mainly to similar parent materials that govern nearly all of the other soil attributes: salinity, alkalinity, calcium carbonate and gypsum content. The soils did not show limitations related to slope, depth, and drainage, while other factors (texture, parent materials, rock fragments, salinity, alkalinity, SOM, CaCO3, and gypsum) showed different degrees of limitation [44,45,46,47].
The CQI indicated low climate quality due to low rainfall and high evaporation rates; since the annual precipitation and aridity index are constant across the area, the slight variation in the CQI value was due to the slope aspect. The high values of CQI occurred within the southern and western aspects, which are warmer and have higher evaporation rates and lower water storage capacity than the northern and eastern aspects [7]. For VQI indicating moderate to very low vegetation quality, areas of very low vegetation quality covered nearly 96% of the total area, while low quality areas covered about 1% of the total area. Spatial variations in VQI related mainly to the NDVI since other factors (fire risk, erosion protection, and drought resistance) were similar due to a similar crop pattern. The NVDI derived from remotely sensed images has been used as a good indicator for monitoring and forecasting vegetation patterns in regions at risk of desertification [11,12]. This can reflect the spatial distribution density of surface vegetation and provide the growth status and coverage information for the plants being grown [45,46]. Areas of high land management quality (MQI) covered 77.62% of the total area, while those of moderate quality occupied 19.48%; this spatial variation related mainly to the land use intensity rather than the protection policies. Two types of land use intensity were identified in the area depending on the frequency of irrigation, degree of mechanization, use of pesticides and fertilizers, crop varieties, etc. [7]. They included low land use intensity on the small farms managed by local farmers and medium land use intensity on the large-scale farms owned by investors. However, there was incomplete enforcement of the policies on environmental protection across the area. The major factor of land degradation in Kafr El-Sheikh Governorate, North Nile Delta, Egypt was soil sealing; therefore, a Fuzzy model was used to assess quantitative land degradation caused by soil sealing. Land degradation caused inappropriate agricultural practices mainly associated with conservation measurements as well as improper time use of heavy machinery, over irrigation, and human interventions in natural drainage [47,48,49].

4.5. Assessment of Wind Erosion Protection Index (WEPI), Index of Land Susceptibility to Wind Erosion (ILSWE)

Results in (Table 5) show values of the five parameters used for calculating the ILSWE; CQF, WEF, SCF, VCF, and SRF. The climatic factors (rainfall, PET, and wind speed) involved in calculating the CE factor were constant across the studied area, and thus. compared with WEF and SCF, VCF and SRF seem to be more effective drivers for wind erosion hazards. This is because soil texture and chemical properties (OM and CaCO3) that affect wind-erodible fractions and surface crusting showed little variation among the studied soil profiles. On the other hand, the NDVI and elevation heights determining VCF and SRF respectively showed higher variation among the studied sites. Combining the five factors, the ILSWE demonstrated very slight to moderate wind erosion severity. These values were transformed to the corresponding WEPI which indicated very high to moderate quality.

4.6. Multivariate Analysis

CQI showed a significant negative correlation (p < 0.05) with the WEPI (Table 6). This indicates that the slope aspect, the most critical climatic factor, exerts an important influence on soil erosion intensity. The VQI showed highly significant negative correlations (p < 0.01) with MQI and WEPI, while the MQI showed a highly significant positive correlation with the WEPI. These findings illustrate that intensive cultivation through mechanized cultivation, proper use of fertilizers and pesticides and cultivation of improved varieties enhanced the vegetation vigor on the one hand, while resulting in greater wind erosion risks on the other hand. Results of the correlation analysis, in general, indicated that the FA could be used efficiently for estimating weights of the parameters since they showed correlations among themselves [20,23]. Results in Table 7 indicate that, for the two components with eigenvalues > 1.0, the first component included WEPI with high positive loadings and VQI with high negative loading, which emphasizes that areas of more intensive cultivation showed higher susceptibility to wind erosion risks rather than those of lower intensity; the second component was dominated by CQI with high positive loading and SQI with high negative loading, which indicates that poor quality soils dominated areas of the north- and east-facing slope aspects. According to weight values derived from the FA, the five indices could be arranged based on their relative importance as follows: MQI = WEPI > SQI = VQI > CQI. Weight values, in fact, refer to relative contribution and degree of priority for each factor in proportion to those remaining for decision-making [40].

4.7. Environmentally Sensitivity Areas to Desertification

Results in (Table 8) showed that the studied area was classified as critical-sensitive to desertification (high-critical ESAs (C3) and medium-critical ESAs (C2)). Results of the ESAI suggested by the MEDALUS model indicated also a critical-sensitive degree of desertification. Although both models used similar input indices, the differences in weights of indicators resulted in changes in the final output values.

4.8. Validation

The statistical analysis indicated no significant differences (p < 0.01) between the proposed model and the ESAI. Furthermore, values of R2 and RMSE were 0.89 and 0.04, respectively, which demonstrates a high correlation between the estimated values from both models. This emphasizes that the performance of the proposed model was satisfactory for quantifying ESAs to desertification in the studied area. However, the sensitivity analysis (Figure 8) revealed that the outputs of the proposed model showed higher values for ALS in the five indices rather than those obtained by the ESAI. This means that the proposed model was more representative for the input parameters [35,36], indicating its preference for tracking spatiotemporal changes in the desertification status of the studied area. This shows that the proposed model has taken into account the relative influence (weight) of each input parameter derived from a reliable and science-based estimation (FA) rather than the equal weights as adopted in the MEDALUS approach. Using weights of the indices in generating desertification maps could render the results closer to reality [40,41,48,49].

5. Conclusions

Quantifying locally dominant degradation-related processes as well as their representation is essential for proper spatiotemporal monitoring of ESAs to desertification. El-Farafra Oasis was dominated by five geomorphic units: rocky area, bare land, vegetation, sabkha and water bodies. Data was collected from remotely sensed images, field observations, climate conditions and laboratory analysis covering the 987.77 km2 of the study area. The data were analyzed in order to characterize five soil quality indices as well as climate, vegetation, land management, and wind erosion. The geometric mean algorithm of number (n) of scores (S) was used to calculated each soil quality index. They were weighted using FA and the inverse distance weighted (IDW) interpolation technique was used to generate SQI, CQI, VQI, MQI and WEPI thematic layers; then a GIS-based spatial model was implemented to superimpose the five indicators on a single map using the weighted sum model. The proposed model showed that the studied area was classified as critical-sensitive to desertification. The high-critical ESA is (C3) which occupied 59.25% of the total area, while the medium-critical is (C2) with 37.85% of the total coverage. The ESAI suggested by the MEDALUS methodology indicated that 18% of the total area was classified as high-critical and 78% as medium-critical. The statistical analysis indicated no significant differences (p < 0.01) between the proposed model and the ESAI with values of R2 and RMSE of 0.89 and 0.04, respectively, which demonstrates a high correlation between the estimated values from both models. However, the sensitivity analysis revealed that the outputs of the proposed model showed higher values of ALS to the five indices rather than those obtained by the ESAI. Using weights based on the FA technique resulted in a better representation of the quality indices than the original MEDALUS methodology. The developed model would be useful in precise monitoring of spatiotemporal changes in the desertification status under inland desert oases conditions.

Author Contributions

Conceptualization, M.E.F., A.S.A., M.A.E.A. and A.B.; methodology, M.E.F., A.S.A., M.A.E.A. and A.B. software, M.E.F., A.S.A. and M.A.E.A.; validation, M.E.F., A.S.A. and M.A.E.A.; formal analysis, M.E.F., A.S.A. and M.A.E.A.; investigation, M.E.F., A.S.A. and M.A.E.A.; resources, M.E.F., A.S.A. and M.A.E.A.; data curation, M.E.F., A.S.A., M.A.E.A. and A.B.; writing—original draft preparation M.E.F., A.S.A., M.A.E.A. and A.B.; writing—review and editing, M.E.F., A.S.A., M.A.E.A. and A.B.; visualization, M.E.F., A.S.A. and M.A.E.A.; supervision, M.E.F., A.S.A.; and M.A.E.A.; project administration, M.E.F., A.S.A. and M.A.E.A.; funding acquisition. All authors have read and agreed to the published version of the manuscript.

Funding

This research received no external funding.

Acknowledgments

The manuscript presented a scientific collaboration between scientific institutions in two countries (Egypt and Canada). The authors would like to thank the University of Guelph, Canada, National Authority for Remote Sensing and Space Science (NARSS) and Benha University for funding the satellite data and the field survey.

Conflicts of Interest

The authors would like to hereby certify that no conflict of interest in the data collection, analyses, and the interpretation; in the writing of the manuscript, and in the decision to publish the results. The authors also would like to declare that the funding of the study has been supported by the authors’ institutions.

References

  1. Lamqadem, A.A.; Pradhan, B.; Saber, H.; Rahimi, A. Desertification sensitivity analysis using MEDALUS model and GIS: A case study of the oases of middle Draa Valley, Morocco. Sensors 2018, 18, 2230. [Google Scholar] [CrossRef] [Green Version]
  2. Fadl, M.E.; Abuzaid, A.S. Assessment of land suitability and water requirements for different crops in Dakhla Oasis, Western Desert. Egypt Int. J. Plant Soil Sci. 2017, 16, 1–16. [Google Scholar]
  3. Puy, A.; Herzog, M.; Escriche, P.; Marouche, A.; Oubana, Y.; Bubenzer, O. Detection of sand encroachment patterns in desert oases. The case of Erg Chebbi (Morocco). Sci. Total Environ. 2018, 642, 241–249. [Google Scholar] [CrossRef] [PubMed]
  4. Akbari, M.; Modarres, R.; Noughani, M.A. Assessing early warning for desertification hazard based on E-SMART indicators in arid regions of northeastern Iran. J. Arid Environ. 2020, 174, 104086. [Google Scholar] [CrossRef]
  5. Huber-Sannwald, E.; Martínez-Tagüeña, N.; Espejel, I.; Lucatello, S.; Coppock, D.L.; Reyes Gómez, V.M. Introduction: International network for the sustainability of drylands-transdisciplinary and participatory research for dryland stewardship and sustainable development. In Stewardship of Future Drylands and Climate Change in the Global South: Challenges and Opportunities for the Agenda 2030; Lucatello, S., Huber-Sannwald, E., Espejel, I., Martínez-Tagüeña, N., Eds.; Springer International Publishing: Cham, Switzerland, 2020; pp. 1–24. [Google Scholar]
  6. Bakr, N.; Weindorf, D.C.; Bahnassy, M.H.; El-Badawi, M.M. Multi-temporal assessment of land sensitivity to desertification in a fragile agro-ecosystem: Environmental indicators. Ecol. Indic. 2012, 15, 271–280. [Google Scholar] [CrossRef]
  7. Kosmas, C.; Ferrara, A.; Briassouli, H.; Imeson, A. Methodology for Mapping Environmentally Sensitive Areas (ESAs) to Desertification. In The Medalus Project—Mediterranean Desertification and Land Use’. Manual on Key Indicators of Desertification and Mapping Environmentally Sensitive Areas to Desertification; European Commission—Office for Official Publications of the European Communities: Luxembourg, 1999; pp. 31–47. ISBN 92-828-6349-2. [Google Scholar]
  8. Ismael, H. Evaluation of present-day climate-induced desertification in El-Dakhla Oasis, Western Desert of Egypt, based on integration of MEDALUS method, GIS and RS techniques. Present Environ. Sustain. Dev. 2015, 9, 47–72. [Google Scholar] [CrossRef] [Green Version]
  9. Besser, H.; Hamed, Y. Environmental impacts of land management on the sustainability of natural resources in Oriental Erg Tunisia, North Africa. Environ. Dev. Sustain. 2021, 23, 11677–11705. [Google Scholar] [CrossRef]
  10. Rasmy, M.; Gad, A.; Abdelsalam, H.; Siwailam, M. A dynamic simulation model of desertification in Egypt. J. Remote Sens. Space Sci. 2010, 13, 101–111. [Google Scholar]
  11. Mohamed, E.S. Spatial assessment of desertification in north Sinai using modified MEDLAUS model. Arab. J. Geosci. 2013, 6, 4647–4659. [Google Scholar] [CrossRef]
  12. Saleh, A.M.; Belal, A.B.; Jalhoum, M.E. Quantitative assessment of environmental sensitivity to desertification in Sidi Abdel-Rahman area, northern west coast of Egypt. Egypt. J. Soil Sci. 2018, 58, 13–26. [Google Scholar] [CrossRef] [Green Version]
  13. Meguid, M.A. Key features of the Egypt’s water and agricultural resources. In Conventional Water Resources and Agriculture in Egypt; Negm, A.M., Ed.; Springer International Publishing: Cham, Switzerland, 2019; pp. 39–99. [Google Scholar]
  14. DRC. Egyptian National Action Program to Combat Desertification; Desert Research Center (DRC), Ministry of Agriculture and Land Reclamation (MALR): Cairo, Egypt, 2005.
  15. Borrelli, P.; Panagos, P.; Ballabio, C.; Lugato, E.; Weynants, M.; Montanarella, L. Towards a pan-European assessment of land susceptibility to wind erosion. Land Degrad. Dev. 2016, 27, 1093–1105. [Google Scholar] [CrossRef]
  16. Fenta, A.A.; Tsunekawa, A.; Haregeweyn, N.; Poesen, J.; Tsubo, M.; Borrelli, P.; Panagos, P.; Vanmaercke, M.; Broeckx, J.; Yasuda, H.; et al. Land susceptibility to water and wind erosion risks in the East Africa region. Sci. Total Environ. 2020, 703, 135016. [Google Scholar] [CrossRef]
  17. Mohamed, A.H.; Shendi, M.M.; Awadalla, A.A.; Mahmoud, A.G.; Semida, W.M. Land suitability modeling for newly reclaimed area using GIS-based multi-criteria decision analysis. Environ. Monit. Assess. 2019, 191, 535. [Google Scholar] [CrossRef]
  18. Abuzaid, A.S.; Abdellatif, A.D.; Fadl, M.E. Modeling soil quality in Dakahlia Governorate, Egypt using GIS techniques. Egypt J. Remote Sens. Space Sci. 2021, 24, 255–264. [Google Scholar] [CrossRef]
  19. Härdle, W.K.; Simar, L. Factor analysis. In Applied Multivariate Statistical Analysis; Springer: Berlin/Heidelberg, Germay, 2015; pp. 359–384. [Google Scholar]
  20. Aljandali, A. Factor analysis. In Multivariate Methods and Forecasting with IBM® SPSS® Statistics; Springer International Publishing: Cham, Switzerland, 2017; pp. 97–106. [Google Scholar]
  21. Jahin, H.S.; Abuzaid, A.S.; Abdellatif, A.D. Using multivariate analysis to develop irrigation water quality index for surface water in Kafr El-Sheikh Governorate, Egypt. Environ. Technol. Innov. 2020, 17, 100532. [Google Scholar] [CrossRef]
  22. Abdellatif, A.D.; Abuzaid, A.S. Integration of multivariate analysis and spatial modeling to assess agricultural potentiality in Farafra Oasis, Western Desert of Egypt. Egypt J. Soil Sci. 2021, 61, 201–218. [Google Scholar] [CrossRef]
  23. Abuzaid, A.S.; Bassouny, M.A. Multivariate and spatial analysis of soil quality in Kafr El-Sheikh Governorate. Egypt J. Soil Sci. Agric. Eng. Mansoura Univ. 2018, 9, 333–339. [Google Scholar] [CrossRef]
  24. Mohamed, E.S.; Ali, A.M.; Borin, M.; Abd-Elmabod, S.K.; Aldosari, A.A.; Khalil, M.M.N.; Abdel-Fattah, M.K. On the use of multivariate analysis and land evaluation for potential agricultural development of the Northwestern Coast of Egypt. Agronomy 2020, 10, 1318. [Google Scholar] [CrossRef]
  25. Dobos, E.; Norman, B.; Worstell, B. The use of DEM and satellite data for regional scale soil databases. Agrokém. Talajtan 2002, 51, 263–272. [Google Scholar]
  26. Zinck, J.A.; Valenzuela, C.R. Soil geographic database: Structure and application examples. Inf. Technol. Control 1990, 3, 270–294. [Google Scholar]
  27. FAO. Guidelines for Soil Description; FAO: Rome, Italy, 2006. [Google Scholar]
  28. Soil Survey Staff. Soil Survey Field and Laboratory Methods Manual. Soil Survey Investigations Report No. 51, Version 2.0.; Burt, R., Soil Survey Staff, Eds.; U.S. Department of Agriculture, Natural Resources Conservation Service: Washington, DC, USA, 2014.
  29. Soil Science Division Staff. Soil Survey Manual. USDA Handbook 18; Government Printing Office: Washington, DC, USA, 2017.
  30. FAO. A Provisional Methodology for Soil Degradation Assessment; FAO: Rome, Italy, 1980. [Google Scholar]
  31. Michael, C.; Charles, H.; James, H.R.; Stefan, S.; Graham, V.M. World Atlas of Desertification; Publications Office of the European Union: Luxembourg, 2018. [Google Scholar]
  32. Jarrah, M.; Mayel, S.; Tatarko, J.; Funk, R.; Kuka, K. A review of wind erosion models: Data requirements, processes, and validity. Catena 2020, 187, 104388. [Google Scholar] [CrossRef]
  33. Abuzaid, A.S.; Jahin, H.S. Changes in alluvial soil quality under long-term irrigation with two marginal water sources in an arid environment. Egypt J. Soil Sci. 2021, 61, 113–128. [Google Scholar] [CrossRef]
  34. Abuzaid, A.S.; Fadl, M.E. Mapping potential risks of long-term wastewater irrigation in alluvial soils. Egypt Arab. J. Geosci. 2018, 11, 433. [Google Scholar] [CrossRef]
  35. Jain, P.; Ramsankaran, R. GIS-based modelling of soil erosion processes using the modified-MMF (MMMF) model in a large watershed having vast agro-climatological differences. Earth Surf. Processes Landf. 2018, 43, 2064–2076. [Google Scholar] [CrossRef]
  36. Morgan, R.P.C.; Duzant, J.H. Modified MMF (Morgan-Morgan-Finney) model for evaluating effects of crops and vegetation cover on soil erosion. Earth Surf. Processes Landf. 2008, 33, 90–106. [Google Scholar] [CrossRef]
  37. El-Ghani, M.M.A.; Huerta-Martínez, F.M.; Hongyan, L.; Qureshi, R. The inland Western Desert of Egypt. In Plant Responses to Hyperarid Desert Environments; Springer International Publishing: Cham, Switzerland, 2017; pp. 179–256. [Google Scholar]
  38. AbdelRahman, M.A.E.; Shalaby, A.; Aboelsoud, M.H.; Moghanm, F.S. GIS spatial model based for determining actual land degradation status in Kafr El-Sheikh Governorate, North Nile Delta. Modeling Earth Syst. Environ. 2018, 4, 359–372. [Google Scholar] [CrossRef]
  39. Hazelton, P.; Murphy, B. Interpreting Soil Test Results: What Do All the Numbers Mean? CSIRO Publishing: Collingwood, Australia, 2016. [Google Scholar]
  40. Guo, B.; Zang, W.Q.; Han, B.M.; Yang, F.; Luo, W.; He, T.L.; Fan, Y.W.; Yang, X.; Chen, S.T. Dynamic monitoring of desertification in Naiman Banner based on feature space models with typical surface parameters derived from LANDSAT images. Land Degrad. Dev. 2020, 2020, 1–20. [Google Scholar] [CrossRef]
  41. Pishyar, S.; Khosravi, H.; Tavili, A.; Malekian, A.; Sabourirad, S. A combined AHP- and TOPSIS-based approach in the assessment of desertification disaster risk. Environ. Modeling Assess. 2020, 25, 219–229. [Google Scholar] [CrossRef]
  42. Budak, M.; Günal, H.; Çelik, İ.; Yıldız, H.; Acir, N.; Acar, M. Environmental sensitivity to desertification in northern Mesopotamia; application of modified MEDALUS by using analytical hierarchy process. Arab. J. Geosci. 2018, 11, 481. [Google Scholar] [CrossRef]
  43. Cherlet, M.; Hutchinson, C.; Reynolds, J.; Hill, J.; Sommer, S.; von Maltitz, G. (Eds.) World Atlas of Desertification; Publication Office of the European Union: Luxembourg, 2018. [Google Scholar]
  44. Abuzaid, A.S.; AbdelRahman, M.A.E.; Fadl, M.E.; Scopa, A. Land Degradation Vulnerability Mapping in a Newly-Reclaimed Desert Oasis in a Hyper-Arid Agro-Ecosystem Using AHP and Geospatial Techniques. Agronomy 2021, 11, 1426. [Google Scholar] [CrossRef]
  45. AbdelRahman, M.A.E.; Natarajan, A.; Rajendra, H.; Prakash, S.S. Assessment of land degradation using comprehensive geostatistical approach and remote sensing data in GIS-model builder. Egypt J. Remote Sens. Space Sci. 2019, 22, 223–234. [Google Scholar] [CrossRef]
  46. AbdelRahman, M.A.E.; Tahoun, S. GIS model-builder based on comprehensive geostatistical approach to assess soil quality. Remote Sens. Appl. Soc. Environ. 2018, 13, 204–2014. [Google Scholar] [CrossRef]
  47. AbdelRahman, M.A.; Natarajan, A.; Srinivasamurthy, C.A.; Hegde, R. Estimating soil fertility status in physically degraded land using GIS and remote sensing techniques in Chamarajanagar district, Karnataka, India. Egypt J. Remote Sens. Space Sci. 2016, 19, 95–108. [Google Scholar] [CrossRef] [Green Version]
  48. AbdelRahman, M.A.E.; Natarajan, A.; Hegde, R. Assessment of land suitability and capability by integrating remote sensing and GIS for agriculture in Chamarajanagar district, Karnataka, India. Egypt J. Remote Sens. Space Sci. 2016, 19, 125–141. [Google Scholar] [CrossRef] [Green Version]
  49. Sayed, Y.A.; Fadl, M.E. Agricultural Sustainability Evaluation of the New Reclaimed Soils at Dairut Area, Assiut, Egypt using GIS Modeling. Egypt J. Remote Sens. Space Sci. 2021, 24, 707–719. [Google Scholar] [CrossRef]
Figure 1. Location maps of the studied area (Sentinel-2A and landsat-8 mosaic images).
Land 11 00054 g001
Figure 2. Physiographic units and locations of soil profiles in the studied area.
Land 11 00054 g002
Figure 3. Methodology flowchart in the current work.
Land 11 00054 g003
Figure 4. Land cover map of the studied area.
Land 11 00054 g004
Figure 5. The four original quality indices used in the MEDALUS methodology.
Land 11 00054 g005
Figure 6. Index of land susceptibility to wind erosion and corresponding erosion protection index.
Land 11 00054 g006
Figure 7. Maps of sensitive areas to desertification in the studied area.
Land 11 00054 g007
Figure 8. Relationship between the proposed model and ESAI used in MEDALUS methodology.
Land 11 00054 g008
Figure 9. Average linear sensitivity of the input parameters for the proposed model and ESAI.
Land 11 00054 g009
Table 1. Dataset included in the modified MEDALUS methodology.
IndexParameterClassDescriptionScore
Soil quality index (SQI)Texture a1L, SCL, SL, LS, CL1.0
2SC, SiL SiCL1.2
3Si, C, SiC1.6
4S2.0
Slope a1Very gentle to flat: <6%1.0
2Gentle: 1–18%1.2
3Steep: 18–35%1.5
4Very steep: >35%2.0
Parent material a1Shale, Schist, Basic, ultra Basic, Conglomerates, unconsolidated1.0
2Limestone, Marble, Granite, Rhyolite, Ignibrite, Gneiss, Siltstone, Sandstone1.7
3Marl, Pyroclastics2.0
Depth a1Deep: >75 cm1.0
2Moderate: 75–30 cm2.0
3Shallow: 30–15 cm3.0
4Very shallow: <15 cm4.0
Drainage a1Well drained1.0
2Imperfectly drained1.2
3Poorly drained2.0
Rock fragment a1Very stony: >60%1.0
2Stony: 60–20%1.3
3Bare to slightly stony: <20%2.0
Electrical conductivity
(EC) b
1None: EC < 4 dS m−11.0
2Slight: EC 4–8 dS m−11.2
3Moderate: EC 8–16 dS m−11.5
4Strong: EC 16–32 dS m−11.7
5Extreme: EC > 32 dS m−12.0
Exchangeable sodium percentage
(ESP) c
1None: ESP < 101.0
2Slight: ESP 10–151.2
3Moderate: ESP 15–301.5
4Strong: ESP 30–501.7
5Extreme: ESP > 502.0
Calcium carbonate
(CaCO3) d
1Non-calcareous: 0 g kg−11.0
2Slightly calcareous: 0–20 g kg−11.2
3Moderately calcareous: 20–100 g kg−11.5
4Strongly calcareous: 100–250 g kg−11.7
5Extremely calcareous: >250 g kg−12.0
Gypsum d1Non-gepsiric: 0 g kg−11.0
2Slightly gypsiric: 0–50 g kg−11.2
3Moderately gypsiric: 50–150 g kg−11.5
4Strongly gypsiric: 150–600 g kg−11.7
5Extremely gypsiric: >600 g kg−12.0
Climate quality index
(CQI)
Rainfall a1High: >650 mm1.0
2Moderate: 650–280 mm2.0
3Low: <280 mm4.0
Aridity index (P/PET) e1Humid: >651.0
2Dry sub-humid: 0.50–0.651.2
3Semi-arid: 0.20–0.501.5
4Arid: 0.05–2.01.7
5Hyper-arid < 0.052.0
Aspect a1NE and NW1.0
2SE and SW2.0
Vegetation quality index
(VQI)
Fire risk a1Low: Bare land, perennial crops, annual crops1.0
2Moderate: Annual crops, deciduous oak, mixed Mediterranean, macchia/evergreen forests1.3
3High: Mediterranean macchia1.6
4Very high: Pine forests2.0
Erosion protection a1Very high: Mixed mediterranean macchia/evergreen forests1.0
2High: Mediterranean macchia, pine forests, Permanent grasslands, evergreen perennial crops1.3
3Moderate: Deciduous forests1.6
4Low: Deciduous perennial agricultural crops (almonds, orchards)1.8
5Very low: Annual agricultural crops (cereals), annual grasslands, vines2.0
Drought resistance a1Very high: Mixed Mediterranean macchia/evergreen forests, Mediterranean macchia1.0
2High: Conifers, deciduous, olives1.2
3Moderate: Perennial agricultural trees (vines, almonds, ochrand)1.4
4Low: Perennial grasslands1.7
5Very low: Annual agricultural crops, annual grasslands2.0
Plant cover f1High: NDVI > 0.951.0
2Moderate: NDVI 95–651.2
3Low: NDVI 65–0.351.5
4Very low: NDVI < 0.352.0
Land manage-ment quality index
(MQI)
Cropland a1Low: Land use intensity (LLUI)1.0
2Medium: Land use intensity (MLUI)1.5
3High: Land use intensity (HLUI)2.0
Pasture a1Low: ASR< SSR1.0
2Moderate: ASR = SSR to 1.5×SSR1.5
3High: ASR > 1.5×SSR2.0
Natural areas a1Low: A/S = 01.0
2Moderate: A/S < 11.2
3High: A/S = 1 or greater2.0
Mining areas a1Low: Adequate erosion control measurements1.0
2Moderate: Moderate erosion control measurements1.5
3High: Low erosion control measurements2.0
Recreations areas a1Low: A/P > 11.0
2Moderate: A/P = 1 to 2.51.5
3High: A/P > 2.52.0
Policy a1High: Complete, >75% of the area under protection1.0
2Moderate: Partial, 25–75% of the area under protection1.5
3Low: Incomplete: <25% of the area under protection2.0
a Kosmas et al. [7], b Soil Science Division Staff [29], c FAO [30], d FAO [27], e Michael et al. [31], f Mohamed [11] and Saleh et al. [12].
Table 2. Physiographic map legend and soil taxonomy of the studied area.
LandscapeReliefLithologyLandformUnitArea, km2Area, %ProfileSoil Taxonomy
Plateau (Pt)Almost flat (1)Farafra chalk formation (1)Summit (1)Pt 11114.871.51------
Steep back slope (2)Esna shale formation (1)Escarpment (2)Pt 21112.271.24---
Piedmont (Pd)Gently undulating (1)Quaternary sand deposits mixed with alluvial-colluvial deposits and Tarawan chalk formation (1)Slopping area (1)Pd 11120.522.0821Typic Torriorthents
Plain (Pl)Flat to almost flat (1)High terraces (1)Pl 111158.0516.0014Typic Torriorthents 25%
17, 19, 24Typic Torripsaments 75%
Low terraces (2)Pl 112420.4142.562, 6, 12, 16, 18, 23, 25, 26, 27Typic Torripsaments 69%
11Typic Torriorthents 8%
13Typic Haplocalcids 8%
15, 20Sodic Haplocalcids 15%
Basin (3)Pl 113360.1336.461, 3, 4, 7, 8, 9, 22, 28Typic Torripsaments 80%
5Typic Haplocalcids 10%
10Sodic Haplocalcids 10%
Sabkha formation (2)Salt marshes (1)Pl 1211.180.12------
Water bodies (Wb) 0.330.03------
Table 3. Descriptive statistics of soil properties of the studied area.
ParameterUnitMinMaxMeanSDCV, %
Depthcm105.00150.00130.7711.668.92
Slope%0.013.440.490.70144.13
Gravel%2.8929.0714.665.9040.26
pH---7.498.958.050.293.66
ECdS m−12.6742.619.3110.79115.90
CaCO3g kg−122.76321.97109.8567.9261.83
Gypsumg kg−11.2131.219.658.5188.15
OMg kg−11.247.823.781.7746.79
CECcmolc kg−18.6119.9012.292.9423.96
ESP---7.9226.8318.135.0227.67
Sand%58.4091.1079.0510.3713.11
Silt%4.9527.7211.586.7057.90
Clay%3.9528.729.385.3356.89
SD, standard deviation; CV, coefficient of variation; EC, electrical conductivity; OM, organic matter; CEC, cation exchange capacity; ESP, exchangeable sodium percentage.
Table 4. Classes and areas of quality indices of the modified MEDLAUS methodology.
Soil quality indexClassQualityRangeArea, km2Area, %
1High<1.130.000.00
2Moderate1.13–1.45951.9796.38
3Low>1.457.140.72
Vegetation quality index1High<1.20.000.00
2Moderate1.2–1.40.000.00
3Low1.4–1.610.291.04
4Very low>1.6949.8296.06
Land management quality index1High<1.25766.7377.62
2Moderate1.25–1.5192.3819.48
3Low>1.50.000.00
Reference terms (Rocky areas, Salt marshes and Water bodies)28.662.90
Table 5. Classes and areas of the index of land susceptibility to wind erosion (ILSWE) and corresponding wind erosion quality index (WEPI).
ClassILSWEWEPIArea, km2Area, %
RangeSeverityScoreQuality
1<2Very slight1.0Very high10.521.07
22–10Slight1.2High897.8790.90
310–20Moderate1.5Moderate50.725.13
420–50High1.7Low0.000.00
5>50Very high2.0Very low0.000.00
Reference terms (Rocky areas, Salt marshes and Water bodies)28.662.90
Table 6. Correlation matrix among the five quality indices.
SoilClimateVegetationLand ManagementWind Erosion
Soil1.000
Climate−0.3091.000
Vegetation0.0130.2631.000
Land management−0.265−0.077−0.595 **1.000
Wind erosion0.003−0.400 *−0.666 **0.577 **1.000
* Correlation is significant at the 0.05 level, ** Correlation is significant at the 0.01 level.
Table 7. Varimax rotated component matrix of the five quality parameters.
ParameterPC1PC2CommunalityWeight
Eigenvalue2.341.40
Variance, %46.7927.98
Cumulative, %46.7974.76
IndicatorEigenvectors
Soil index−0.20−0.830.740.20
Climate index−0.340.760.690.18
Vegetation index−0.860.110.750.20
Land management index0.840.260.780.21
Wind erosion index0.86−0.220.790.21
Bold-face numbers indicates highly-loaded variables (>0.6).
Table 8. Classes and areas of sensitive areas to desertification in the studied area.
Sensitivity DegreeTypeSubtypeIndexModelArea, km2Area, %
HighCriticalC3>1.53Weighted sum585.8759.25
ESAI181.6218.37
C21.53–142Weighted sum374.2437.85
ESAI778.4978.73
Reference terms (plateau, sabkha and water bodies)28.662.90
Publisher’s Note: MDPI stays neutral with regard to jurisdictional claims in published maps and institutional affiliations.

