Evaluation of Desertification Severity in El-Farafra Oasis, Western Desert of Egypt: Application of Modified MEDALUS Approach Using Wind Erosion Index and Factor Analysis
Abstract
:1. Introduction
2. Materials and Methods
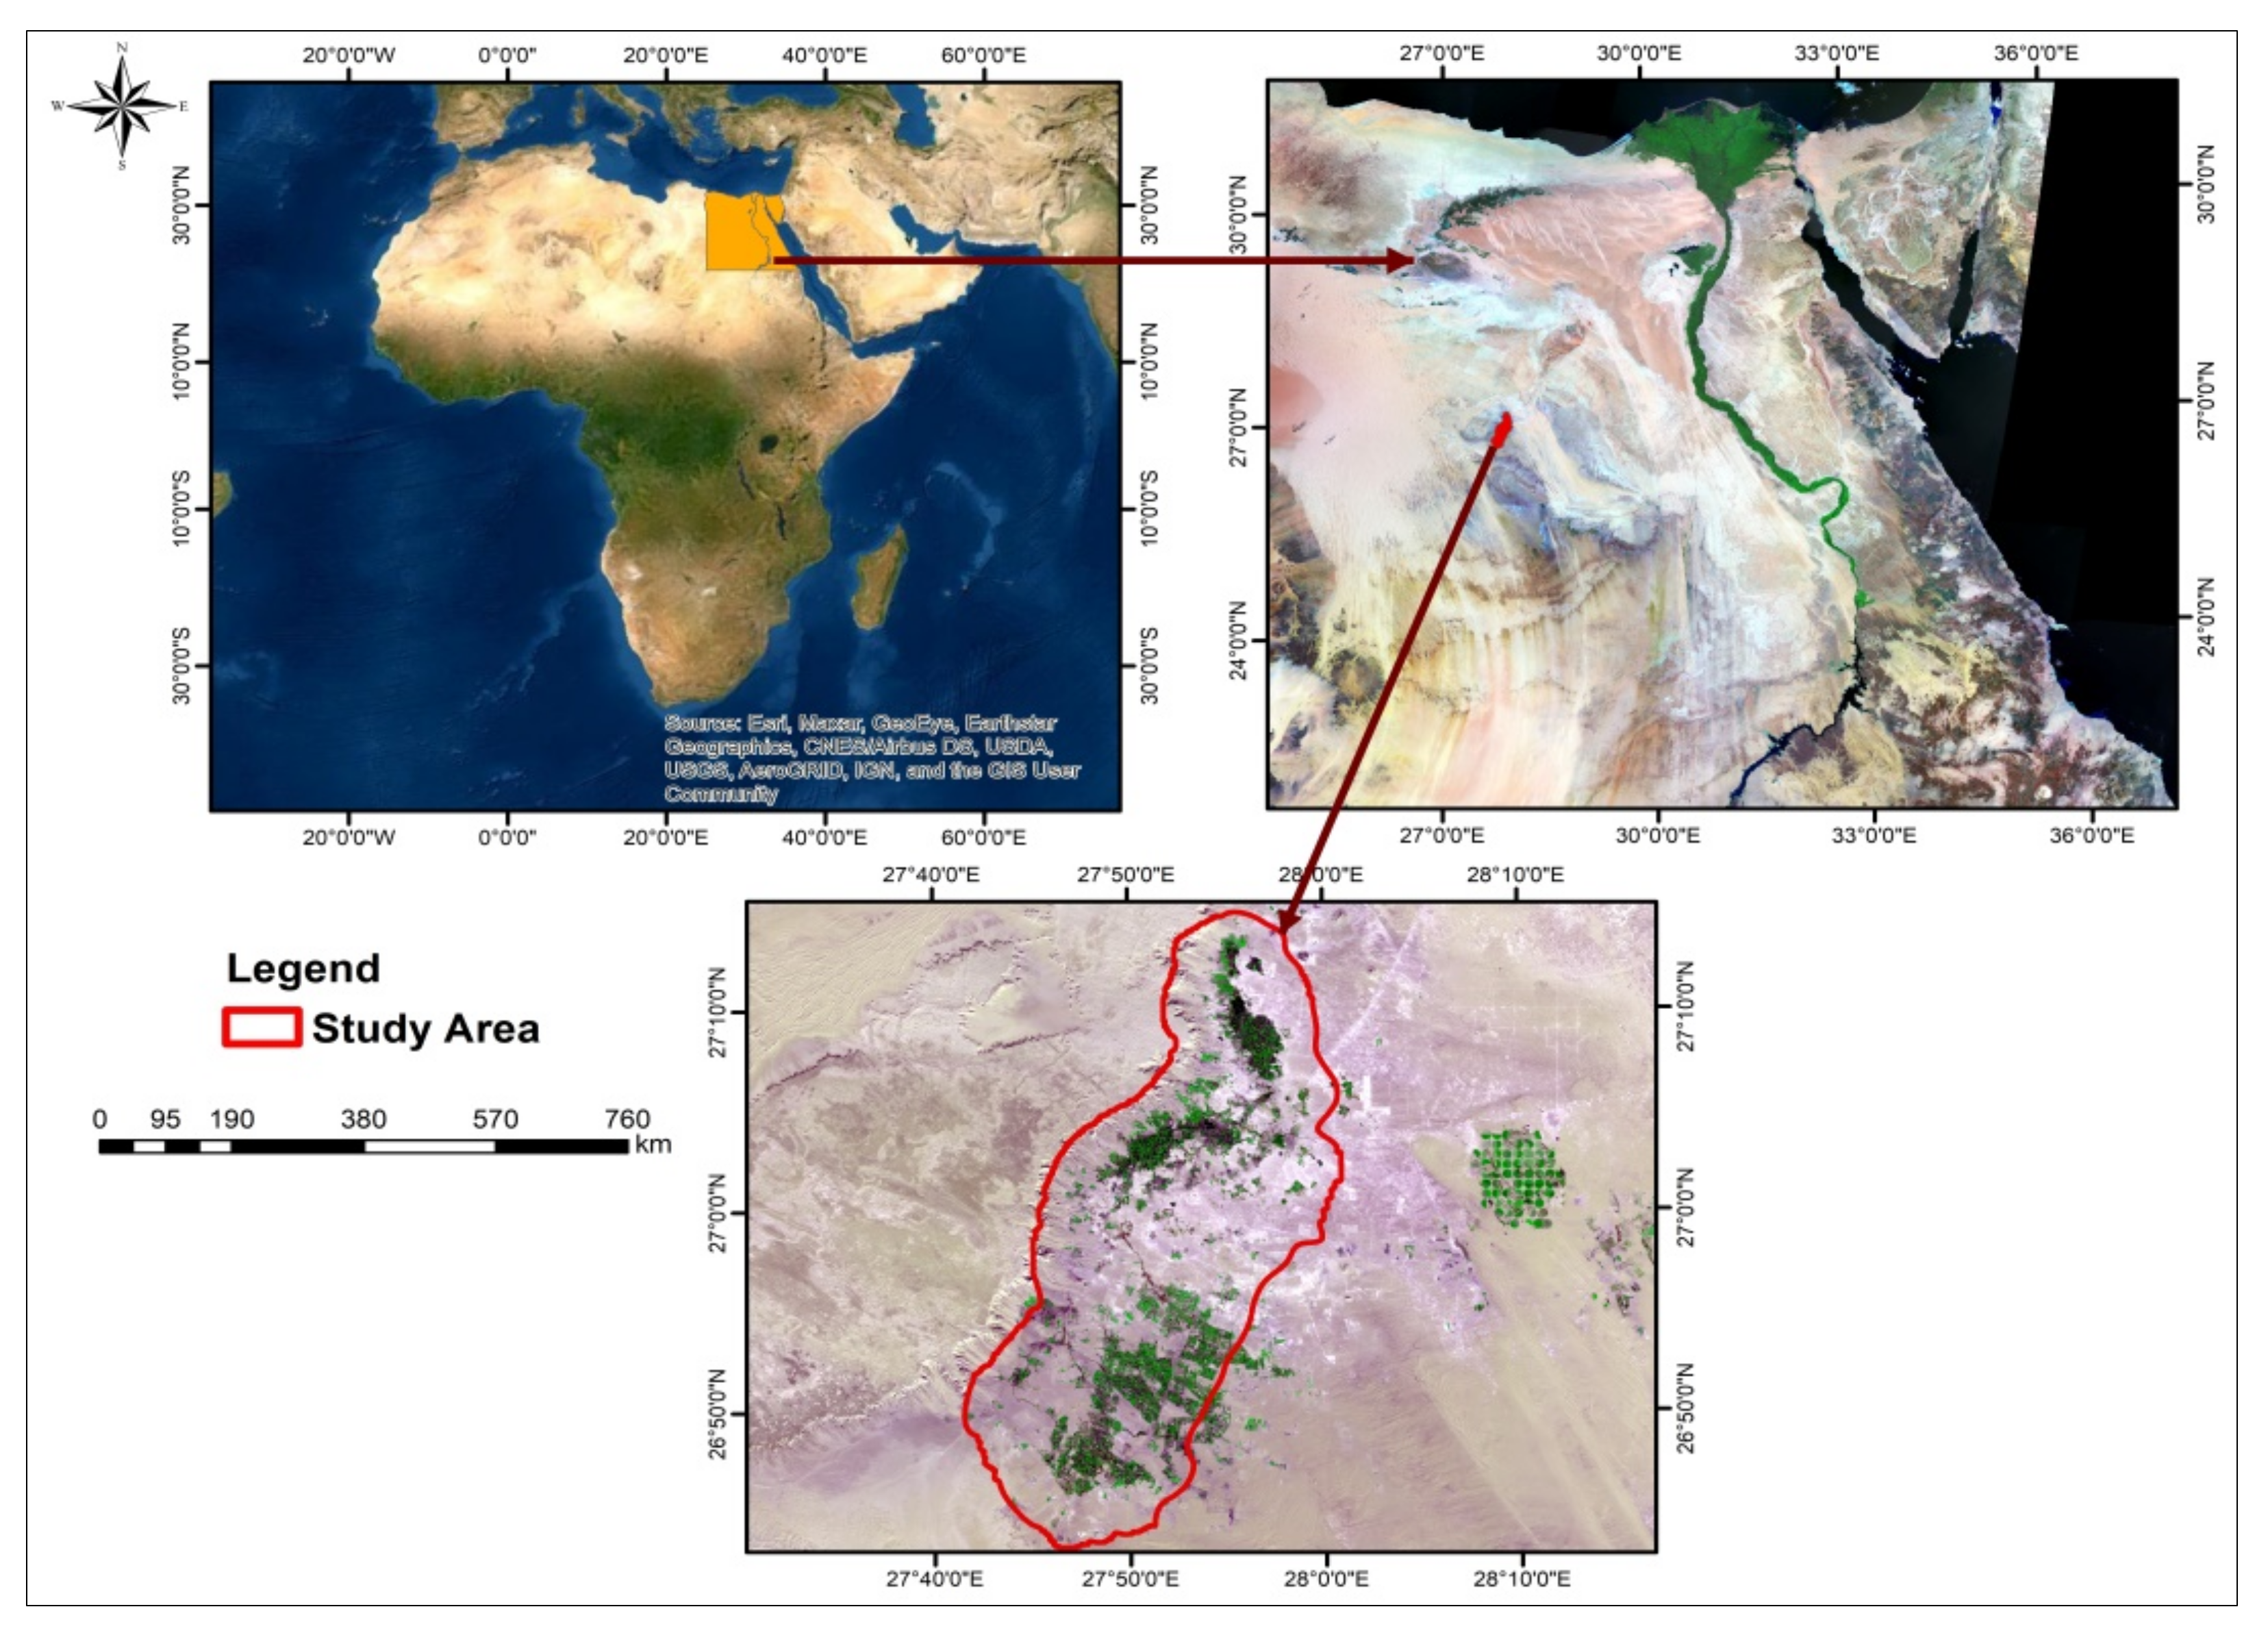
2.1. The Study Area
2.2. Remote Sensing and GIS Work
2.3. Field Work and Laboratory Analyses
2.4. Modeling Desertification in the Studied Area
2.4.1. Quantifying the Original MEDALUS Indices
2.4.2. Wind Erosion Protection Index (WEPI), Index of Land Susceptibility to Wind Erosion (ILSWE)
2.4.3. Establishing a Weight Value for Each Index
2.4.4. Generating a GIS-Based Model
2.4.5. Model Performance
3. Results
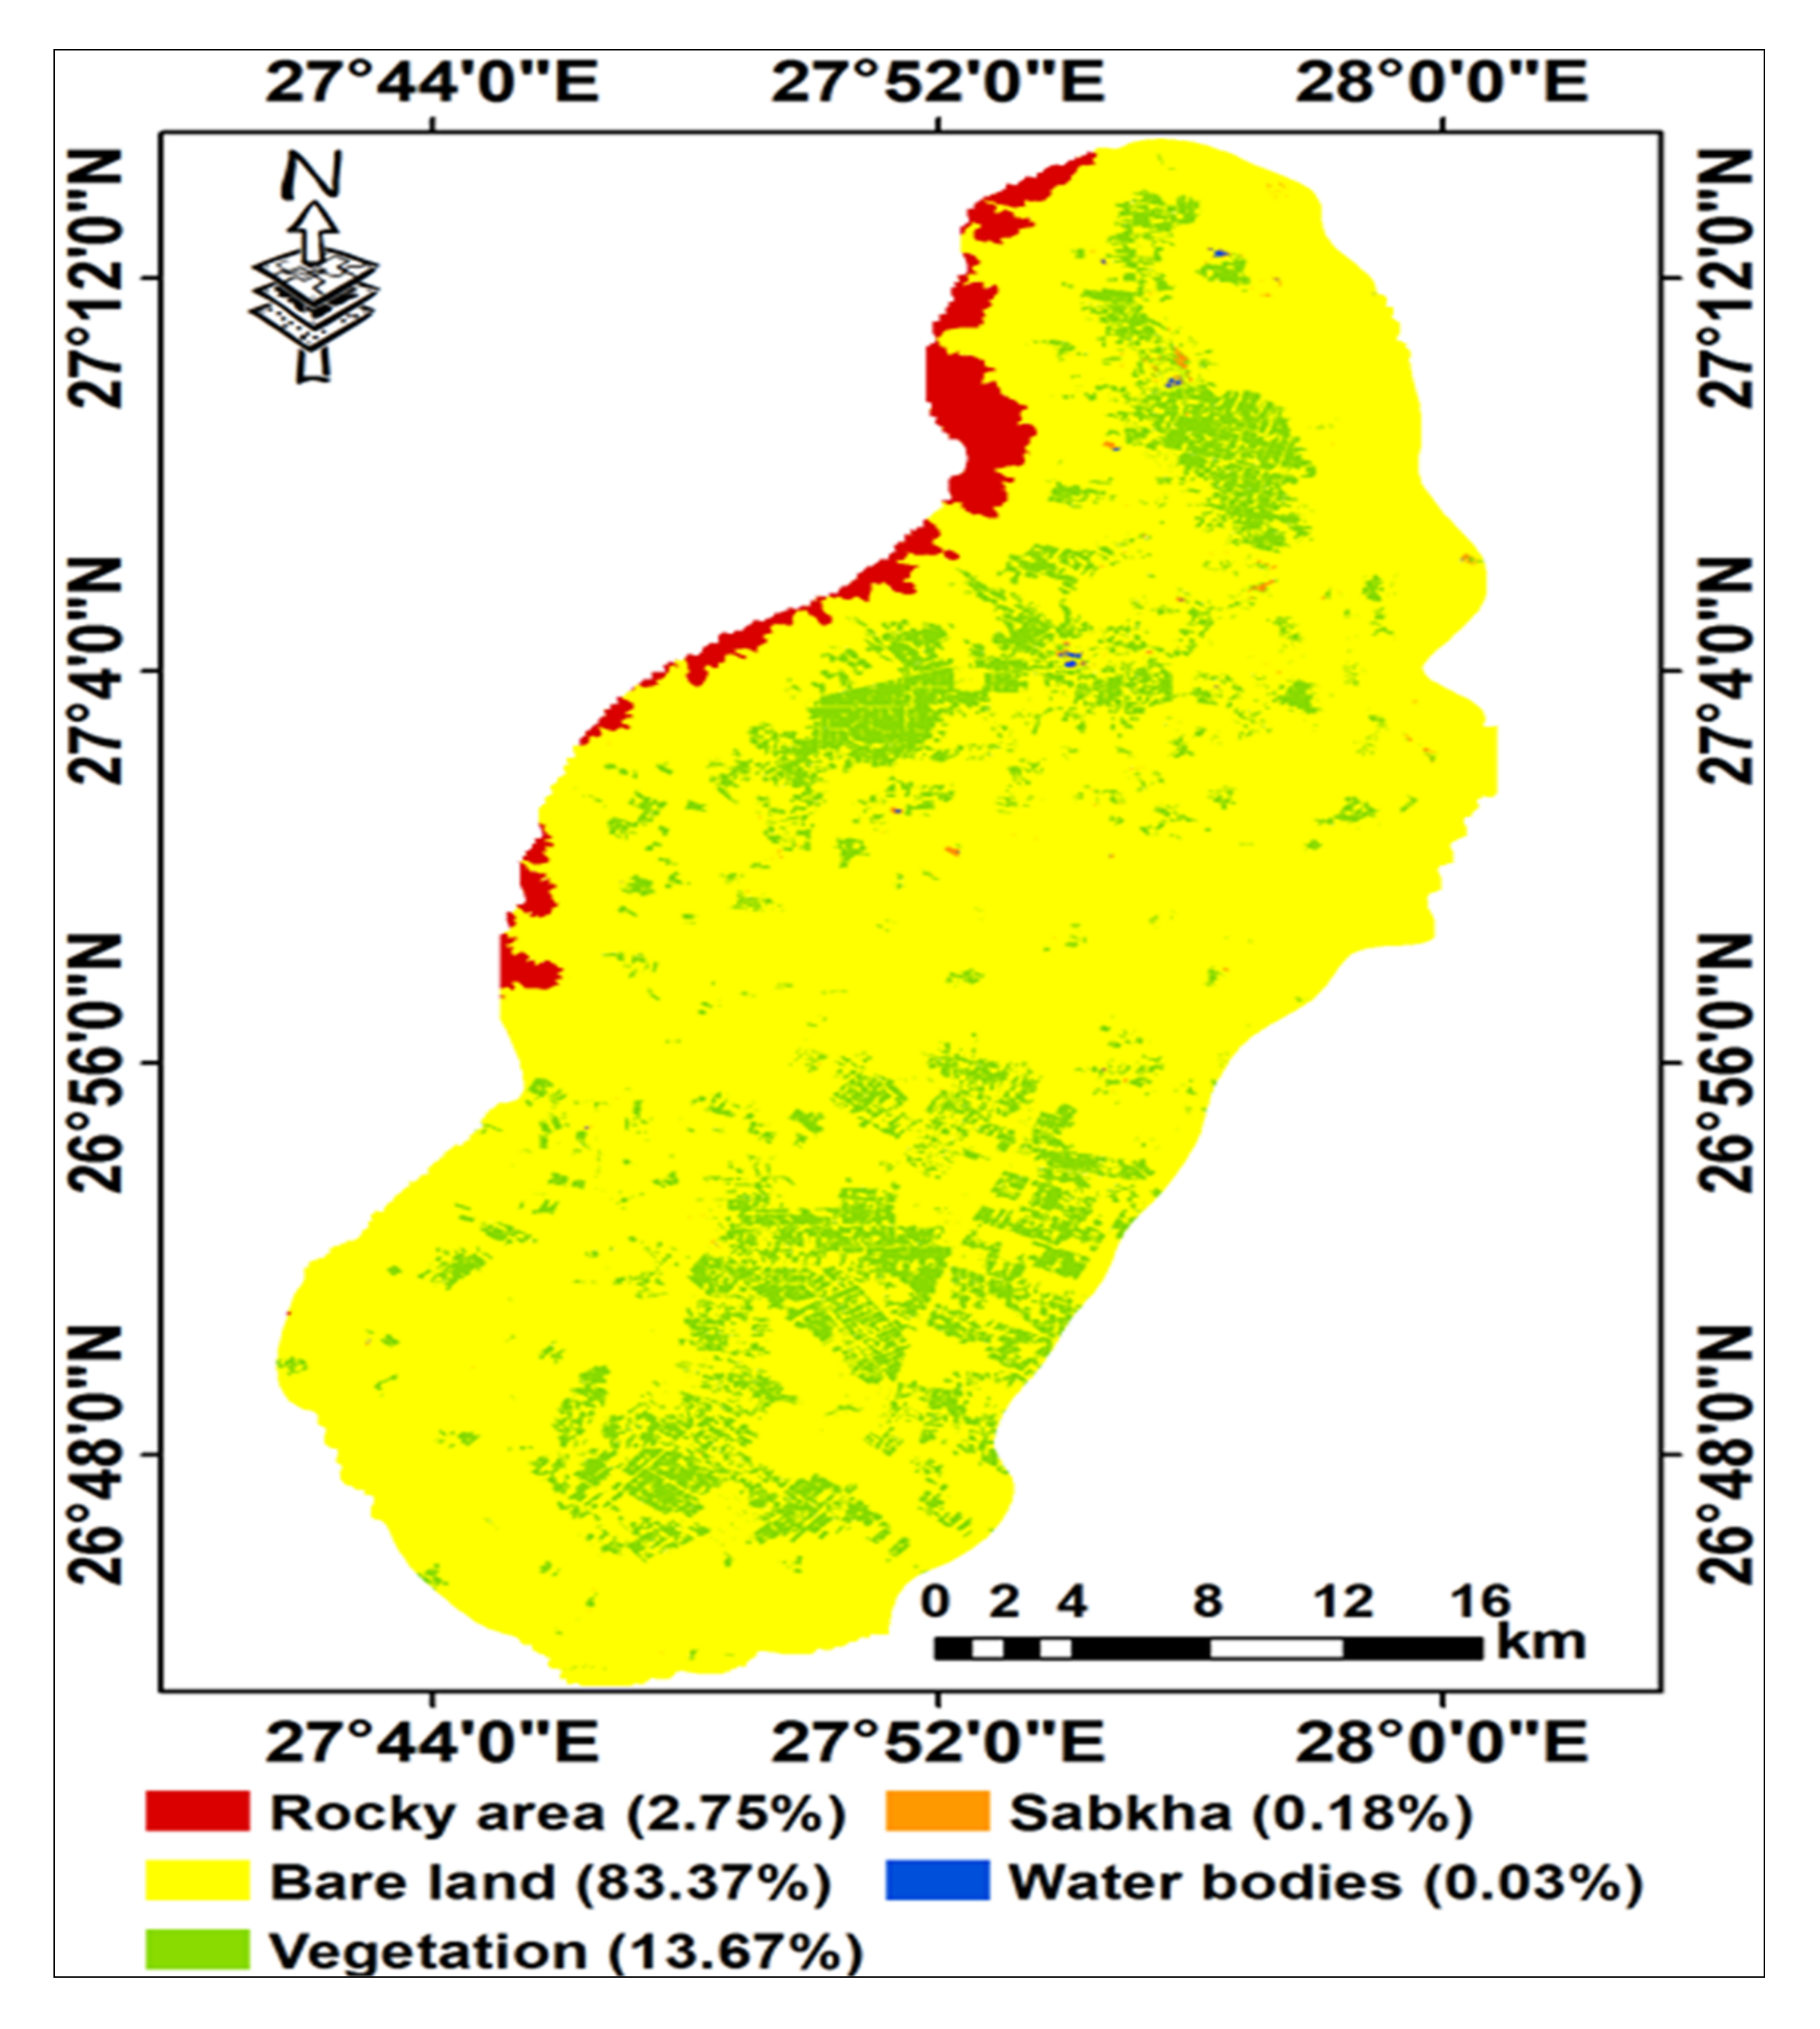
3.1. Land Use/Land Cover
3.2. Geomorphology and Soils
3.3. Soil Properties
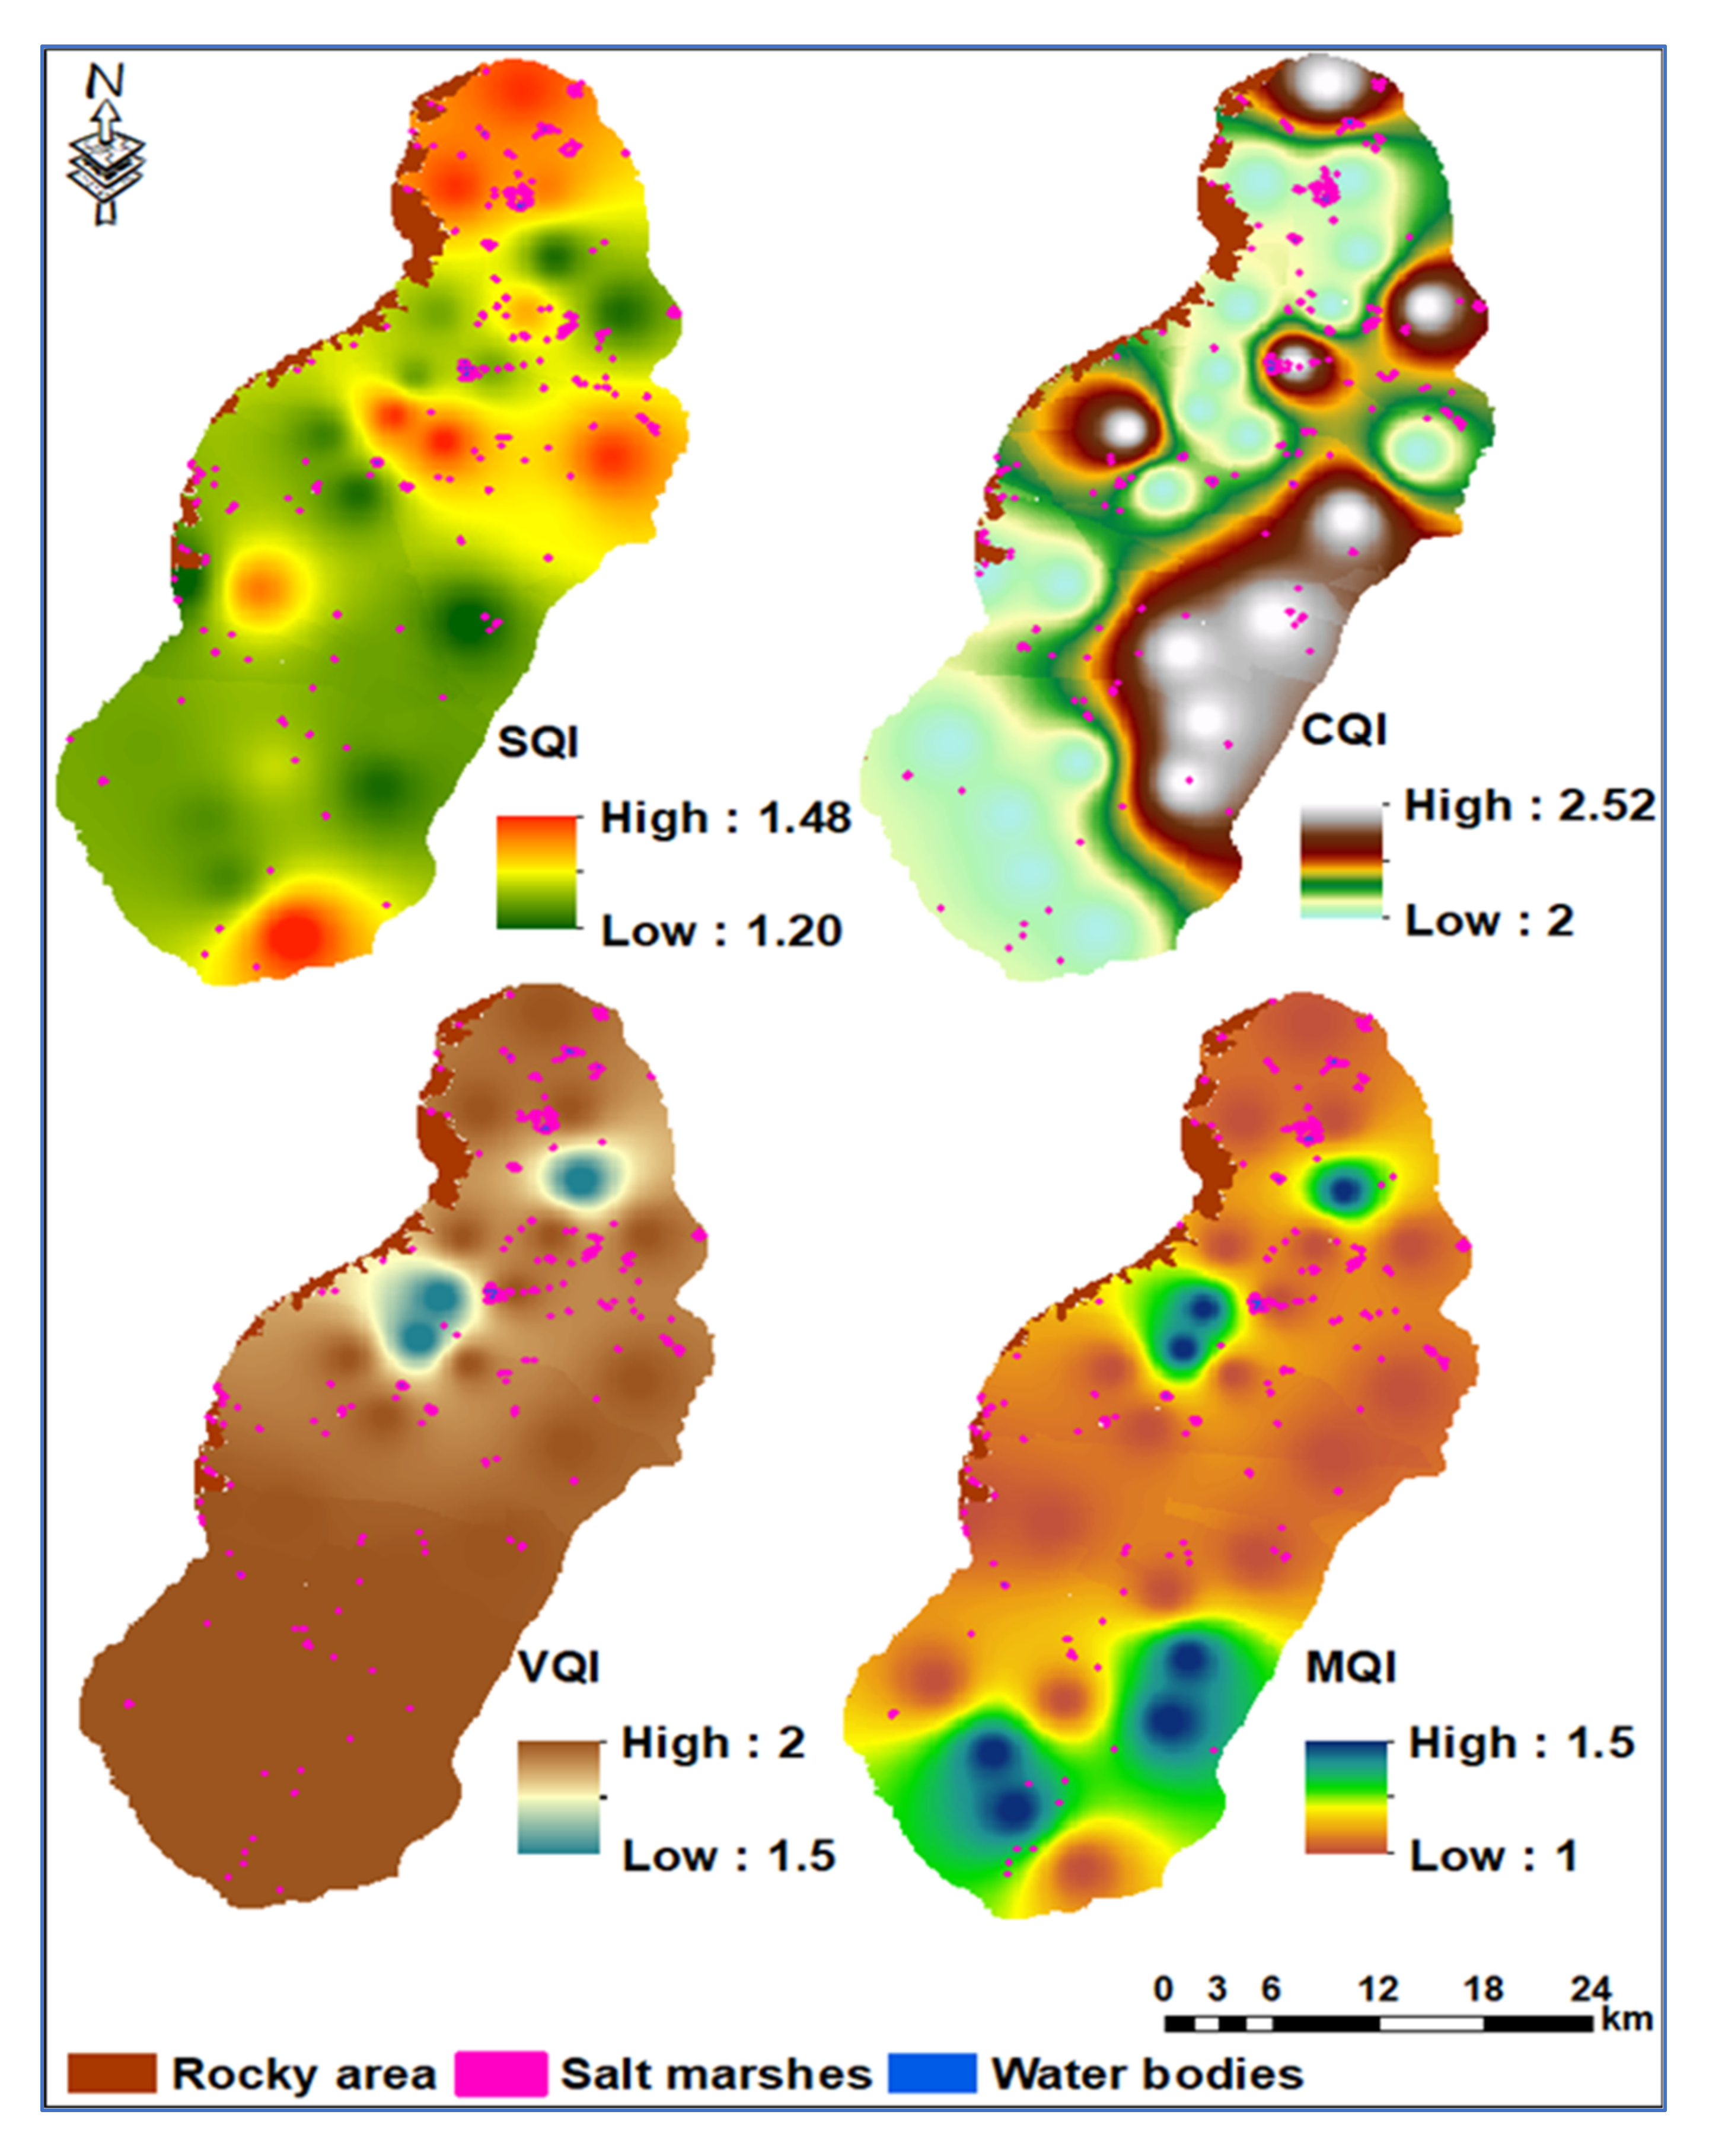
3.4. Quantifying the Original Indices
3.5. Assessment of Wind Erosion Protection Index (WEPI), Index of Land Susceptibility to Wind Erosion (ILSWE)
3.6. Multivariate Analysis
3.7. Environmentally Sensitivite Areas to Desertification
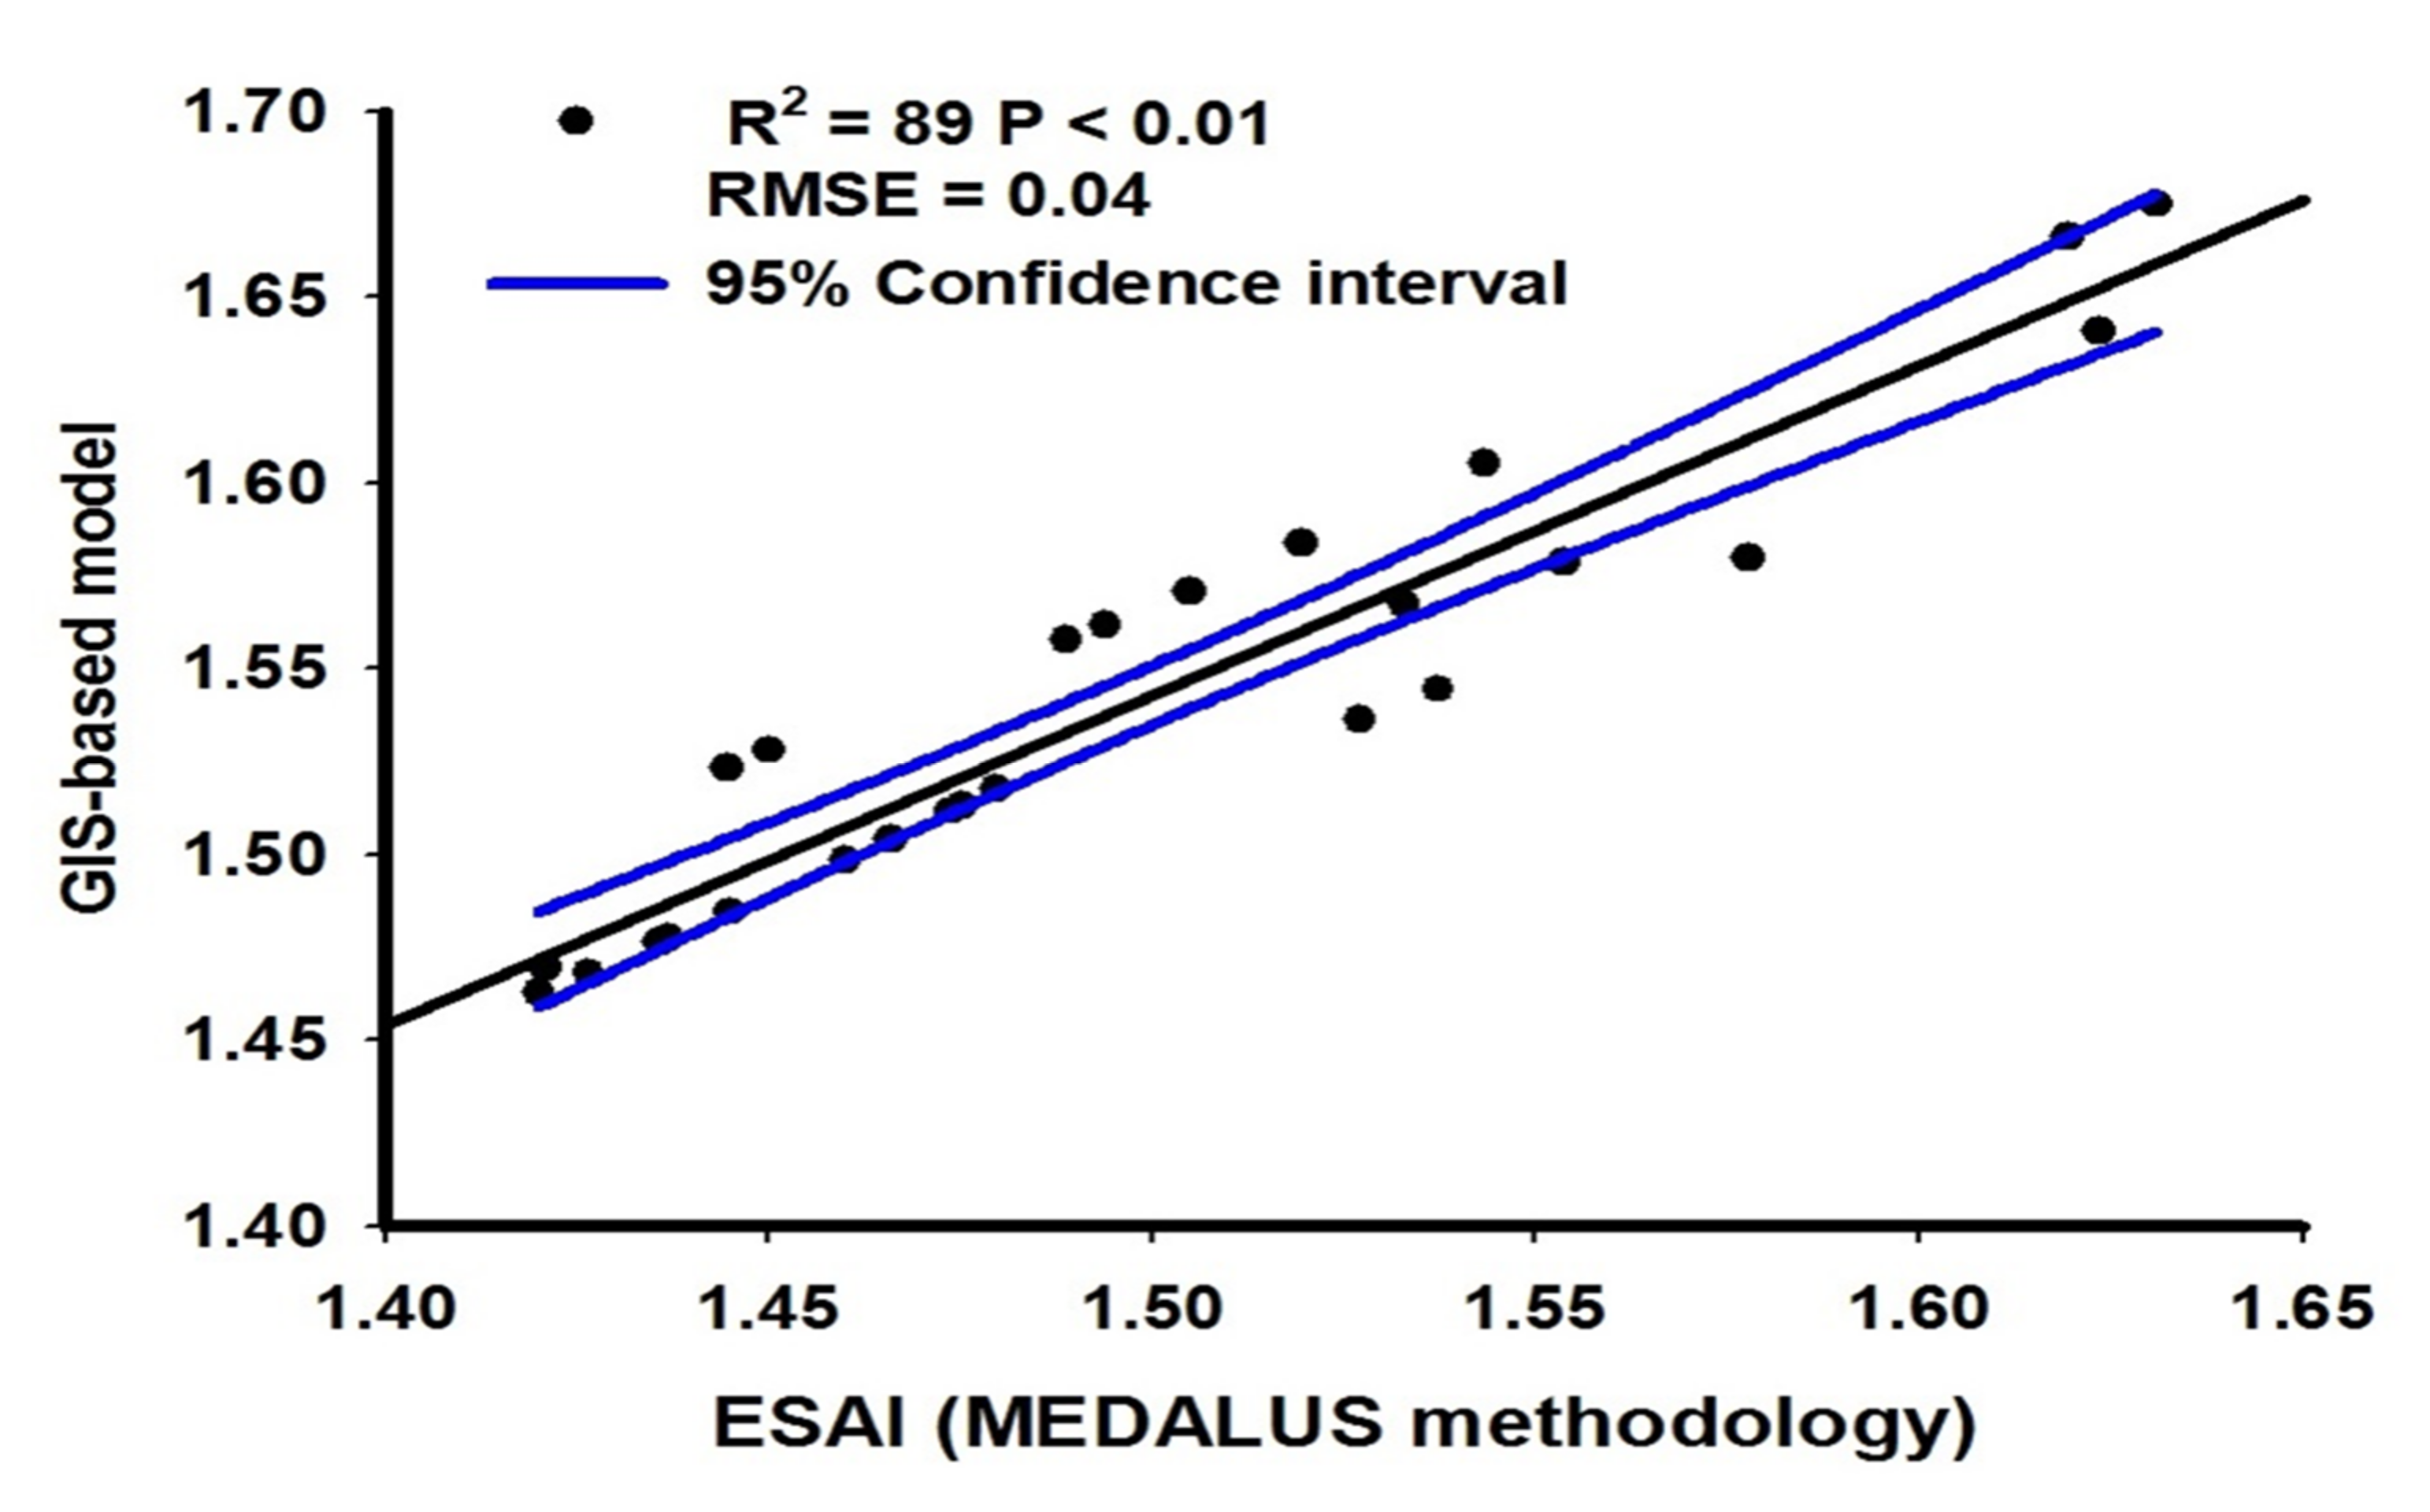
3.8. Validation
4. Discussion
4.1. Geomorphology and Soils
4.2. Land Use/Land Cover
4.3. Soil Properties
4.4. Quantifying the Original Indices
4.5. Assessment of Wind Erosion Protection Index (WEPI), Index of Land Susceptibility to Wind Erosion (ILSWE)
4.6. Multivariate Analysis
4.7. Environmentally Sensitivity Areas to Desertification
4.8. Validation
5. Conclusions
Author Contributions
Funding
Acknowledgments
Conflicts of Interest
References
- Lamqadem, A.A.; Pradhan, B.; Saber, H.; Rahimi, A. Desertification sensitivity analysis using MEDALUS model and GIS: A case study of the oases of middle Draa Valley, Morocco. Sensors 2018, 18, 2230. [Google Scholar] [CrossRef] [Green Version]
- Fadl, M.E.; Abuzaid, A.S. Assessment of land suitability and water requirements for different crops in Dakhla Oasis, Western Desert. Egypt Int. J. Plant Soil Sci. 2017, 16, 1–16. [Google Scholar]
- Puy, A.; Herzog, M.; Escriche, P.; Marouche, A.; Oubana, Y.; Bubenzer, O. Detection of sand encroachment patterns in desert oases. The case of Erg Chebbi (Morocco). Sci. Total Environ. 2018, 642, 241–249. [Google Scholar] [CrossRef] [PubMed]
- Akbari, M.; Modarres, R.; Noughani, M.A. Assessing early warning for desertification hazard based on E-SMART indicators in arid regions of northeastern Iran. J. Arid Environ. 2020, 174, 104086. [Google Scholar] [CrossRef]
- Huber-Sannwald, E.; Martínez-Tagüeña, N.; Espejel, I.; Lucatello, S.; Coppock, D.L.; Reyes Gómez, V.M. Introduction: International network for the sustainability of drylands-transdisciplinary and participatory research for dryland stewardship and sustainable development. In Stewardship of Future Drylands and Climate Change in the Global South: Challenges and Opportunities for the Agenda 2030; Lucatello, S., Huber-Sannwald, E., Espejel, I., Martínez-Tagüeña, N., Eds.; Springer International Publishing: Cham, Switzerland, 2020; pp. 1–24. [Google Scholar]
- Bakr, N.; Weindorf, D.C.; Bahnassy, M.H.; El-Badawi, M.M. Multi-temporal assessment of land sensitivity to desertification in a fragile agro-ecosystem: Environmental indicators. Ecol. Indic. 2012, 15, 271–280. [Google Scholar] [CrossRef]
- Kosmas, C.; Ferrara, A.; Briassouli, H.; Imeson, A. Methodology for Mapping Environmentally Sensitive Areas (ESAs) to Desertification. In The Medalus Project—Mediterranean Desertification and Land Use’. Manual on Key Indicators of Desertification and Mapping Environmentally Sensitive Areas to Desertification; European Commission—Office for Official Publications of the European Communities: Luxembourg, 1999; pp. 31–47. ISBN 92-828-6349-2. [Google Scholar]
- Ismael, H. Evaluation of present-day climate-induced desertification in El-Dakhla Oasis, Western Desert of Egypt, based on integration of MEDALUS method, GIS and RS techniques. Present Environ. Sustain. Dev. 2015, 9, 47–72. [Google Scholar] [CrossRef] [Green Version]
- Besser, H.; Hamed, Y. Environmental impacts of land management on the sustainability of natural resources in Oriental Erg Tunisia, North Africa. Environ. Dev. Sustain. 2021, 23, 11677–11705. [Google Scholar] [CrossRef]
- Rasmy, M.; Gad, A.; Abdelsalam, H.; Siwailam, M. A dynamic simulation model of desertification in Egypt. J. Remote Sens. Space Sci. 2010, 13, 101–111. [Google Scholar]
- Mohamed, E.S. Spatial assessment of desertification in north Sinai using modified MEDLAUS model. Arab. J. Geosci. 2013, 6, 4647–4659. [Google Scholar] [CrossRef]
- Saleh, A.M.; Belal, A.B.; Jalhoum, M.E. Quantitative assessment of environmental sensitivity to desertification in Sidi Abdel-Rahman area, northern west coast of Egypt. Egypt. J. Soil Sci. 2018, 58, 13–26. [Google Scholar] [CrossRef] [Green Version]
- Meguid, M.A. Key features of the Egypt’s water and agricultural resources. In Conventional Water Resources and Agriculture in Egypt; Negm, A.M., Ed.; Springer International Publishing: Cham, Switzerland, 2019; pp. 39–99. [Google Scholar]
- DRC. Egyptian National Action Program to Combat Desertification; Desert Research Center (DRC), Ministry of Agriculture and Land Reclamation (MALR): Cairo, Egypt, 2005.
- Borrelli, P.; Panagos, P.; Ballabio, C.; Lugato, E.; Weynants, M.; Montanarella, L. Towards a pan-European assessment of land susceptibility to wind erosion. Land Degrad. Dev. 2016, 27, 1093–1105. [Google Scholar] [CrossRef]
- Fenta, A.A.; Tsunekawa, A.; Haregeweyn, N.; Poesen, J.; Tsubo, M.; Borrelli, P.; Panagos, P.; Vanmaercke, M.; Broeckx, J.; Yasuda, H.; et al. Land susceptibility to water and wind erosion risks in the East Africa region. Sci. Total Environ. 2020, 703, 135016. [Google Scholar] [CrossRef]
- Mohamed, A.H.; Shendi, M.M.; Awadalla, A.A.; Mahmoud, A.G.; Semida, W.M. Land suitability modeling for newly reclaimed area using GIS-based multi-criteria decision analysis. Environ. Monit. Assess. 2019, 191, 535. [Google Scholar] [CrossRef]
- Abuzaid, A.S.; Abdellatif, A.D.; Fadl, M.E. Modeling soil quality in Dakahlia Governorate, Egypt using GIS techniques. Egypt J. Remote Sens. Space Sci. 2021, 24, 255–264. [Google Scholar] [CrossRef]
- Härdle, W.K.; Simar, L. Factor analysis. In Applied Multivariate Statistical Analysis; Springer: Berlin/Heidelberg, Germay, 2015; pp. 359–384. [Google Scholar]
- Aljandali, A. Factor analysis. In Multivariate Methods and Forecasting with IBM® SPSS® Statistics; Springer International Publishing: Cham, Switzerland, 2017; pp. 97–106. [Google Scholar]
- Jahin, H.S.; Abuzaid, A.S.; Abdellatif, A.D. Using multivariate analysis to develop irrigation water quality index for surface water in Kafr El-Sheikh Governorate, Egypt. Environ. Technol. Innov. 2020, 17, 100532. [Google Scholar] [CrossRef]
- Abdellatif, A.D.; Abuzaid, A.S. Integration of multivariate analysis and spatial modeling to assess agricultural potentiality in Farafra Oasis, Western Desert of Egypt. Egypt J. Soil Sci. 2021, 61, 201–218. [Google Scholar] [CrossRef]
- Abuzaid, A.S.; Bassouny, M.A. Multivariate and spatial analysis of soil quality in Kafr El-Sheikh Governorate. Egypt J. Soil Sci. Agric. Eng. Mansoura Univ. 2018, 9, 333–339. [Google Scholar] [CrossRef]
- Mohamed, E.S.; Ali, A.M.; Borin, M.; Abd-Elmabod, S.K.; Aldosari, A.A.; Khalil, M.M.N.; Abdel-Fattah, M.K. On the use of multivariate analysis and land evaluation for potential agricultural development of the Northwestern Coast of Egypt. Agronomy 2020, 10, 1318. [Google Scholar] [CrossRef]
- Dobos, E.; Norman, B.; Worstell, B. The use of DEM and satellite data for regional scale soil databases. Agrokém. Talajtan 2002, 51, 263–272. [Google Scholar]
- Zinck, J.A.; Valenzuela, C.R. Soil geographic database: Structure and application examples. Inf. Technol. Control 1990, 3, 270–294. [Google Scholar]
- FAO. Guidelines for Soil Description; FAO: Rome, Italy, 2006. [Google Scholar]
- Soil Survey Staff. Soil Survey Field and Laboratory Methods Manual. Soil Survey Investigations Report No. 51, Version 2.0.; Burt, R., Soil Survey Staff, Eds.; U.S. Department of Agriculture, Natural Resources Conservation Service: Washington, DC, USA, 2014.
- Soil Science Division Staff. Soil Survey Manual. USDA Handbook 18; Government Printing Office: Washington, DC, USA, 2017.
- FAO. A Provisional Methodology for Soil Degradation Assessment; FAO: Rome, Italy, 1980. [Google Scholar]
- Michael, C.; Charles, H.; James, H.R.; Stefan, S.; Graham, V.M. World Atlas of Desertification; Publications Office of the European Union: Luxembourg, 2018. [Google Scholar]
- Jarrah, M.; Mayel, S.; Tatarko, J.; Funk, R.; Kuka, K. A review of wind erosion models: Data requirements, processes, and validity. Catena 2020, 187, 104388. [Google Scholar] [CrossRef]
- Abuzaid, A.S.; Jahin, H.S. Changes in alluvial soil quality under long-term irrigation with two marginal water sources in an arid environment. Egypt J. Soil Sci. 2021, 61, 113–128. [Google Scholar] [CrossRef]
- Abuzaid, A.S.; Fadl, M.E. Mapping potential risks of long-term wastewater irrigation in alluvial soils. Egypt Arab. J. Geosci. 2018, 11, 433. [Google Scholar] [CrossRef]
- Jain, P.; Ramsankaran, R. GIS-based modelling of soil erosion processes using the modified-MMF (MMMF) model in a large watershed having vast agro-climatological differences. Earth Surf. Processes Landf. 2018, 43, 2064–2076. [Google Scholar] [CrossRef]
- Morgan, R.P.C.; Duzant, J.H. Modified MMF (Morgan-Morgan-Finney) model for evaluating effects of crops and vegetation cover on soil erosion. Earth Surf. Processes Landf. 2008, 33, 90–106. [Google Scholar] [CrossRef]
- El-Ghani, M.M.A.; Huerta-Martínez, F.M.; Hongyan, L.; Qureshi, R. The inland Western Desert of Egypt. In Plant Responses to Hyperarid Desert Environments; Springer International Publishing: Cham, Switzerland, 2017; pp. 179–256. [Google Scholar]
- AbdelRahman, M.A.E.; Shalaby, A.; Aboelsoud, M.H.; Moghanm, F.S. GIS spatial model based for determining actual land degradation status in Kafr El-Sheikh Governorate, North Nile Delta. Modeling Earth Syst. Environ. 2018, 4, 359–372. [Google Scholar] [CrossRef]
- Hazelton, P.; Murphy, B. Interpreting Soil Test Results: What Do All the Numbers Mean? CSIRO Publishing: Collingwood, Australia, 2016. [Google Scholar]
- Guo, B.; Zang, W.Q.; Han, B.M.; Yang, F.; Luo, W.; He, T.L.; Fan, Y.W.; Yang, X.; Chen, S.T. Dynamic monitoring of desertification in Naiman Banner based on feature space models with typical surface parameters derived from LANDSAT images. Land Degrad. Dev. 2020, 2020, 1–20. [Google Scholar] [CrossRef]
- Pishyar, S.; Khosravi, H.; Tavili, A.; Malekian, A.; Sabourirad, S. A combined AHP- and TOPSIS-based approach in the assessment of desertification disaster risk. Environ. Modeling Assess. 2020, 25, 219–229. [Google Scholar] [CrossRef]
- Budak, M.; Günal, H.; Çelik, İ.; Yıldız, H.; Acir, N.; Acar, M. Environmental sensitivity to desertification in northern Mesopotamia; application of modified MEDALUS by using analytical hierarchy process. Arab. J. Geosci. 2018, 11, 481. [Google Scholar] [CrossRef]
- Cherlet, M.; Hutchinson, C.; Reynolds, J.; Hill, J.; Sommer, S.; von Maltitz, G. (Eds.) World Atlas of Desertification; Publication Office of the European Union: Luxembourg, 2018. [Google Scholar]
- Abuzaid, A.S.; AbdelRahman, M.A.E.; Fadl, M.E.; Scopa, A. Land Degradation Vulnerability Mapping in a Newly-Reclaimed Desert Oasis in a Hyper-Arid Agro-Ecosystem Using AHP and Geospatial Techniques. Agronomy 2021, 11, 1426. [Google Scholar] [CrossRef]
- AbdelRahman, M.A.E.; Natarajan, A.; Rajendra, H.; Prakash, S.S. Assessment of land degradation using comprehensive geostatistical approach and remote sensing data in GIS-model builder. Egypt J. Remote Sens. Space Sci. 2019, 22, 223–234. [Google Scholar] [CrossRef]
- AbdelRahman, M.A.E.; Tahoun, S. GIS model-builder based on comprehensive geostatistical approach to assess soil quality. Remote Sens. Appl. Soc. Environ. 2018, 13, 204–2014. [Google Scholar] [CrossRef]
- AbdelRahman, M.A.; Natarajan, A.; Srinivasamurthy, C.A.; Hegde, R. Estimating soil fertility status in physically degraded land using GIS and remote sensing techniques in Chamarajanagar district, Karnataka, India. Egypt J. Remote Sens. Space Sci. 2016, 19, 95–108. [Google Scholar] [CrossRef] [Green Version]
- AbdelRahman, M.A.E.; Natarajan, A.; Hegde, R. Assessment of land suitability and capability by integrating remote sensing and GIS for agriculture in Chamarajanagar district, Karnataka, India. Egypt J. Remote Sens. Space Sci. 2016, 19, 125–141. [Google Scholar] [CrossRef] [Green Version]
- Sayed, Y.A.; Fadl, M.E. Agricultural Sustainability Evaluation of the New Reclaimed Soils at Dairut Area, Assiut, Egypt using GIS Modeling. Egypt J. Remote Sens. Space Sci. 2021, 24, 707–719. [Google Scholar] [CrossRef]




| Index | Parameter | Class | Description | Score |
|---|---|---|---|---|
| Soil quality index (SQI) | Texture a | 1 | L, SCL, SL, LS, CL | 1.0 |
| 2 | SC, SiL SiCL | 1.2 | ||
| 3 | Si, C, SiC | 1.6 | ||
| 4 | S | 2.0 | ||
| Slope a | 1 | Very gentle to flat: <6% | 1.0 | |
| 2 | Gentle: 1–18% | 1.2 | ||
| 3 | Steep: 18–35% | 1.5 | ||
| 4 | Very steep: >35% | 2.0 | ||
| Parent material a | 1 | Shale, Schist, Basic, ultra Basic, Conglomerates, unconsolidated | 1.0 | |
| 2 | Limestone, Marble, Granite, Rhyolite, Ignibrite, Gneiss, Siltstone, Sandstone | 1.7 | ||
| 3 | Marl, Pyroclastics | 2.0 | ||
| Depth a | 1 | Deep: >75 cm | 1.0 | |
| 2 | Moderate: 75–30 cm | 2.0 | ||
| 3 | Shallow: 30–15 cm | 3.0 | ||
| 4 | Very shallow: <15 cm | 4.0 | ||
| Drainage a | 1 | Well drained | 1.0 | |
| 2 | Imperfectly drained | 1.2 | ||
| 3 | Poorly drained | 2.0 | ||
| Rock fragment a | 1 | Very stony: >60% | 1.0 | |
| 2 | Stony: 60–20% | 1.3 | ||
| 3 | Bare to slightly stony: <20% | 2.0 | ||
| Electrical conductivity (EC) b | 1 | None: EC < 4 dS m−1 | 1.0 | |
| 2 | Slight: EC 4–8 dS m−1 | 1.2 | ||
| 3 | Moderate: EC 8–16 dS m−1 | 1.5 | ||
| 4 | Strong: EC 16–32 dS m−1 | 1.7 | ||
| 5 | Extreme: EC > 32 dS m−1 | 2.0 | ||
| Exchangeable sodium percentage (ESP) c | 1 | None: ESP < 10 | 1.0 | |
| 2 | Slight: ESP 10–15 | 1.2 | ||
| 3 | Moderate: ESP 15–30 | 1.5 | ||
| 4 | Strong: ESP 30–50 | 1.7 | ||
| 5 | Extreme: ESP > 50 | 2.0 | ||
| Calcium carbonate (CaCO3) d | 1 | Non-calcareous: 0 g kg−1 | 1.0 | |
| 2 | Slightly calcareous: 0–20 g kg−1 | 1.2 | ||
| 3 | Moderately calcareous: 20–100 g kg−1 | 1.5 | ||
| 4 | Strongly calcareous: 100–250 g kg−1 | 1.7 | ||
| 5 | Extremely calcareous: >250 g kg−1 | 2.0 | ||
| Gypsum d | 1 | Non-gepsiric: 0 g kg−1 | 1.0 | |
| 2 | Slightly gypsiric: 0–50 g kg−1 | 1.2 | ||
| 3 | Moderately gypsiric: 50–150 g kg−1 | 1.5 | ||
| 4 | Strongly gypsiric: 150–600 g kg−1 | 1.7 | ||
| 5 | Extremely gypsiric: >600 g kg−1 | 2.0 | ||
| Climate quality index (CQI) | Rainfall a | 1 | High: >650 mm | 1.0 |
| 2 | Moderate: 650–280 mm | 2.0 | ||
| 3 | Low: <280 mm | 4.0 | ||
| Aridity index (P/PET) e | 1 | Humid: >65 | 1.0 | |
| 2 | Dry sub-humid: 0.50–0.65 | 1.2 | ||
| 3 | Semi-arid: 0.20–0.50 | 1.5 | ||
| 4 | Arid: 0.05–2.0 | 1.7 | ||
| 5 | Hyper-arid < 0.05 | 2.0 | ||
| Aspect a | 1 | NE and NW | 1.0 | |
| 2 | SE and SW | 2.0 | ||
| Vegetation quality index (VQI) | Fire risk a | 1 | Low: Bare land, perennial crops, annual crops | 1.0 |
| 2 | Moderate: Annual crops, deciduous oak, mixed Mediterranean, macchia/evergreen forests | 1.3 | ||
| 3 | High: Mediterranean macchia | 1.6 | ||
| 4 | Very high: Pine forests | 2.0 | ||
| Erosion protection a | 1 | Very high: Mixed mediterranean macchia/evergreen forests | 1.0 | |
| 2 | High: Mediterranean macchia, pine forests, Permanent grasslands, evergreen perennial crops | 1.3 | ||
| 3 | Moderate: Deciduous forests | 1.6 | ||
| 4 | Low: Deciduous perennial agricultural crops (almonds, orchards) | 1.8 | ||
| 5 | Very low: Annual agricultural crops (cereals), annual grasslands, vines | 2.0 | ||
| Drought resistance a | 1 | Very high: Mixed Mediterranean macchia/evergreen forests, Mediterranean macchia | 1.0 | |
| 2 | High: Conifers, deciduous, olives | 1.2 | ||
| 3 | Moderate: Perennial agricultural trees (vines, almonds, ochrand) | 1.4 | ||
| 4 | Low: Perennial grasslands | 1.7 | ||
| 5 | Very low: Annual agricultural crops, annual grasslands | 2.0 | ||
| Plant cover f | 1 | High: NDVI > 0.95 | 1.0 | |
| 2 | Moderate: NDVI 95–65 | 1.2 | ||
| 3 | Low: NDVI 65–0.35 | 1.5 | ||
| 4 | Very low: NDVI < 0.35 | 2.0 | ||
| Land manage-ment quality index (MQI) | Cropland a | 1 | Low: Land use intensity (LLUI) | 1.0 |
| 2 | Medium: Land use intensity (MLUI) | 1.5 | ||
| 3 | High: Land use intensity (HLUI) | 2.0 | ||
| Pasture a | 1 | Low: ASR< SSR | 1.0 | |
| 2 | Moderate: ASR = SSR to 1.5×SSR | 1.5 | ||
| 3 | High: ASR > 1.5×SSR | 2.0 | ||
| Natural areas a | 1 | Low: A/S = 0 | 1.0 | |
| 2 | Moderate: A/S < 1 | 1.2 | ||
| 3 | High: A/S = 1 or greater | 2.0 | ||
| Mining areas a | 1 | Low: Adequate erosion control measurements | 1.0 | |
| 2 | Moderate: Moderate erosion control measurements | 1.5 | ||
| 3 | High: Low erosion control measurements | 2.0 | ||
| Recreations areas a | 1 | Low: A/P > 1 | 1.0 | |
| 2 | Moderate: A/P = 1 to 2.5 | 1.5 | ||
| 3 | High: A/P > 2.5 | 2.0 | ||
| Policy a | 1 | High: Complete, >75% of the area under protection | 1.0 | |
| 2 | Moderate: Partial, 25–75% of the area under protection | 1.5 | ||
| 3 | Low: Incomplete: <25% of the area under protection | 2.0 |
| Landscape | Relief | Lithology | Landform | Unit | Area, km2 | Area, % | Profile | Soil Taxonomy |
|---|---|---|---|---|---|---|---|---|
| Plateau (Pt) | Almost flat (1) | Farafra chalk formation (1) | Summit (1) | Pt 111 | 14.87 | 1.51 | --- | --- |
| Steep back slope (2) | Esna shale formation (1) | Escarpment (2) | Pt 211 | 12.27 | 1.24 | --- | ||
| Piedmont (Pd) | Gently undulating (1) | Quaternary sand deposits mixed with alluvial-colluvial deposits and Tarawan chalk formation (1) | Slopping area (1) | Pd 111 | 20.52 | 2.08 | 21 | Typic Torriorthents |
| Plain (Pl) | Flat to almost flat (1) | High terraces (1) | Pl 111 | 158.05 | 16.00 | 14 | Typic Torriorthents 25% | |
| 17, 19, 24 | Typic Torripsaments 75% | |||||||
| Low terraces (2) | Pl 112 | 420.41 | 42.56 | 2, 6, 12, 16, 18, 23, 25, 26, 27 | Typic Torripsaments 69% | |||
| 11 | Typic Torriorthents 8% | |||||||
| 13 | Typic Haplocalcids 8% | |||||||
| 15, 20 | Sodic Haplocalcids 15% | |||||||
| Basin (3) | Pl 113 | 360.13 | 36.46 | 1, 3, 4, 7, 8, 9, 22, 28 | Typic Torripsaments 80% | |||
| 5 | Typic Haplocalcids 10% | |||||||
| 10 | Sodic Haplocalcids 10% | |||||||
| Sabkha formation (2) | Salt marshes (1) | Pl 121 | 1.18 | 0.12 | --- | --- | ||
| Water bodies (Wb) | 0.33 | 0.03 | --- | --- | ||||
| Parameter | Unit | Min | Max | Mean | SD | CV, % |
|---|---|---|---|---|---|---|
| Depth | cm | 105.00 | 150.00 | 130.77 | 11.66 | 8.92 |
| Slope | % | 0.01 | 3.44 | 0.49 | 0.70 | 144.13 |
| Gravel | % | 2.89 | 29.07 | 14.66 | 5.90 | 40.26 |
| pH | --- | 7.49 | 8.95 | 8.05 | 0.29 | 3.66 |
| EC | dS m−1 | 2.67 | 42.61 | 9.31 | 10.79 | 115.90 |
| CaCO3 | g kg−1 | 22.76 | 321.97 | 109.85 | 67.92 | 61.83 |
| Gypsum | g kg−1 | 1.21 | 31.21 | 9.65 | 8.51 | 88.15 |
| OM | g kg−1 | 1.24 | 7.82 | 3.78 | 1.77 | 46.79 |
| CEC | cmolc kg−1 | 8.61 | 19.90 | 12.29 | 2.94 | 23.96 |
| ESP | --- | 7.92 | 26.83 | 18.13 | 5.02 | 27.67 |
| Sand | % | 58.40 | 91.10 | 79.05 | 10.37 | 13.11 |
| Silt | % | 4.95 | 27.72 | 11.58 | 6.70 | 57.90 |
| Clay | % | 3.95 | 28.72 | 9.38 | 5.33 | 56.89 |
| Soil quality index | Class | Quality | Range | Area, km2 | Area, % |
| 1 | High | <1.13 | 0.00 | 0.00 | |
| 2 | Moderate | 1.13–1.45 | 951.97 | 96.38 | |
| 3 | Low | >1.45 | 7.14 | 0.72 | |
| Vegetation quality index | 1 | High | <1.2 | 0.00 | 0.00 |
| 2 | Moderate | 1.2–1.4 | 0.00 | 0.00 | |
| 3 | Low | 1.4–1.6 | 10.29 | 1.04 | |
| 4 | Very low | >1.6 | 949.82 | 96.06 | |
| Land management quality index | 1 | High | <1.25 | 766.73 | 77.62 |
| 2 | Moderate | 1.25–1.5 | 192.38 | 19.48 | |
| 3 | Low | >1.5 | 0.00 | 0.00 | |
| Reference terms (Rocky areas, Salt marshes and Water bodies) | 28.66 | 2.90 | |||
| Class | ILSWE | WEPI | Area, km2 | Area, % | ||
|---|---|---|---|---|---|---|
| Range | Severity | Score | Quality | |||
| 1 | <2 | Very slight | 1.0 | Very high | 10.52 | 1.07 |
| 2 | 2–10 | Slight | 1.2 | High | 897.87 | 90.90 |
| 3 | 10–20 | Moderate | 1.5 | Moderate | 50.72 | 5.13 |
| 4 | 20–50 | High | 1.7 | Low | 0.00 | 0.00 |
| 5 | >50 | Very high | 2.0 | Very low | 0.00 | 0.00 |
| Reference terms (Rocky areas, Salt marshes and Water bodies) | 28.66 | 2.90 | ||||
| Soil | Climate | Vegetation | Land Management | Wind Erosion | |
|---|---|---|---|---|---|
| Soil | 1.000 | ||||
| Climate | −0.309 | 1.000 | |||
| Vegetation | 0.013 | 0.263 | 1.000 | ||
| Land management | −0.265 | −0.077 | −0.595 ** | 1.000 | |
| Wind erosion | 0.003 | −0.400 * | −0.666 ** | 0.577 ** | 1.000 |
| Parameter | PC1 | PC2 | Communality | Weight |
| Eigenvalue | 2.34 | 1.40 | ||
| Variance, % | 46.79 | 27.98 | ||
| Cumulative, % | 46.79 | 74.76 | ||
| Indicator | Eigenvectors | |||
| Soil index | −0.20 | −0.83 | 0.74 | 0.20 |
| Climate index | −0.34 | 0.76 | 0.69 | 0.18 |
| Vegetation index | −0.86 | 0.11 | 0.75 | 0.20 |
| Land management index | 0.84 | 0.26 | 0.78 | 0.21 |
| Wind erosion index | 0.86 | −0.22 | 0.79 | 0.21 |
| Sensitivity Degree | Type | Subtype | Index | Model | Area, km2 | Area, % |
|---|---|---|---|---|---|---|
| High | Critical | C3 | >1.53 | Weighted sum | 585.87 | 59.25 |
| ESAI | 181.62 | 18.37 | ||||
| C2 | 1.53–142 | Weighted sum | 374.24 | 37.85 | ||
| ESAI | 778.49 | 78.73 | ||||
| Reference terms (plateau, sabkha and water bodies) | 28.66 | 2.90 | ||||
Publisher’s Note: MDPI stays neutral with regard to jurisdictional claims in published maps and institutional affiliations. |
© 2021 by the authors. Licensee MDPI, Basel, Switzerland. This article is an open access article distributed under the terms and conditions of the Creative Commons Attribution (CC BY) license (https://creativecommons.org/licenses/by/4.0/).
Share and Cite
Fadl, M.E.; Abuzaid, A.S.; AbdelRahman, M.A.E.; Biswas, A. Evaluation of Desertification Severity in El-Farafra Oasis, Western Desert of Egypt: Application of Modified MEDALUS Approach Using Wind Erosion Index and Factor Analysis. Land 2022, 11, 54. https://doi.org/10.3390/land11010054
Fadl ME, Abuzaid AS, AbdelRahman MAE, Biswas A. Evaluation of Desertification Severity in El-Farafra Oasis, Western Desert of Egypt: Application of Modified MEDALUS Approach Using Wind Erosion Index and Factor Analysis. Land. 2022; 11(1):54. https://doi.org/10.3390/land11010054
Chicago/Turabian StyleFadl, Mohamed E., Ahmed S. Abuzaid, Mohamed A. E. AbdelRahman, and Asim Biswas. 2022. "Evaluation of Desertification Severity in El-Farafra Oasis, Western Desert of Egypt: Application of Modified MEDALUS Approach Using Wind Erosion Index and Factor Analysis" Land 11, no. 1: 54. https://doi.org/10.3390/land11010054
APA StyleFadl, M. E., Abuzaid, A. S., AbdelRahman, M. A. E., & Biswas, A. (2022). Evaluation of Desertification Severity in El-Farafra Oasis, Western Desert of Egypt: Application of Modified MEDALUS Approach Using Wind Erosion Index and Factor Analysis. Land, 11(1), 54. https://doi.org/10.3390/land11010054


