Article

On Physical Urban Boundaries, Urban Sprawl, and Compactness Measurement: A Case Study of the Wen-Tai Region, China

School of Design and Architecture, Zhejiang University of Technology, Hangzhou 310024, China
*
Author to whom correspondence should be addressed.
Land 2022, 11(10), 1637; https://doi.org/10.3390/land11101637
Submission received: 1 September 2022 / Revised: 19 September 2022 / Accepted: 20 September 2022 / Published: 23 September 2022

Abstract

:
China’s rapid urbanization has been accompanied by serious urban sprawl. Instead of measuring the physical urban boundaries (PUBs), most of existing studies in China rely on yearbook statistics to describe the growth of urbanized area; therefore, the understanding of the actual form and quantity of urban sprawl are restrained. As the statistical unit is generally at or above the county level, these studies tend to omit the lower-level “larger towns”. This paper discusses the measurement of urban sprawl and compactness using multi-source data on the GIS platform through the case study of the Wen-Tai region in China. GlobeLand30 remote sensing image data, vector road network data, NPP/VIIRS nighttime light data, and points of interest (POIs) data are adopted. The new method enhances the identification of built-up areas in larger towns. Besides, the 2020s’ PUBs of this region, data for 2010 and 2000 are retraced to assess the urban expansion rate, and two approaches are used to discuss the urban growth pattern. Additionally, a compactness model is constructed from four dimensions, i.e., the compactness of external contour, accessibility of road network, land-use intensity, and functional diversity, by which a high-resolution visual analysis tool is created for the provincial government to monitor urban sprawl.

1. Introduction

Urban development and urban sprawl in China have increased in concert with China’s economic boom [1,2]. Urban sprawl is the “haphazard” or unplanned encroachment on non-urban land of the city periphery, commonly seen in developing countries [3,4]. According to the UN’s projections, the global urban population will double and the urban built-up area will triple between 2000 and 2030 [5,6,7]. Moreover, the rapid urban sprawl has caused serious social and environmental problems, e.g., the high consumption of resources and energy, as well as loss of arable land and habitats [1,4,6,8,9]. Therefore, it is urgent to quantitatively characterize and assess the regional or global urban sprawl to predict urban growth trends and support relevant decision making, especially for regions undergoing rapid urbanization in the future [6]. The UN 2030 Agenda for Sustainable Development aims to end poverty in all of its forms in accordance with a UN vision that imagines a world of respect for human rights and human dignity, the rule of law, justice, equality, and non-discrimination. The land planning control of urban sprawling in the Chinese context to conserve valuable farmland is definitely in line with the UN’s aspirations. Such control highlights the significance of land boundaries.
Two major problems exist in the current research on urban sprawl in China. First, modern Chinese cities are defined from the administrative perspective. However, cities never constitute an independent administrative category, although they serve as capitals of territorial units at different levels [10]. Researchers rely on statistical and aggregated indicators in officially published yearbooks to understand the Chinese city system [11]. China’s administrative divisions include the province-level, prefecture-level, county-level, and township-level. Most studies focus on the county-level or above [7,12,13,14], and descriptions of the township level are lacking. In many maritime provinces, e.g., Zhejiang and Guangdong, there is a special type of township, namely the larger town. Larger towns are townships not serving as the seat of government for the county, without a clear definition, usually with a resident population of 100,000 or more [15]. These larger towns are perfectly suited as independent cities based on the definition of physical cities, but they are subordinate to a higher level unit and are usually not treated independently. Consequently, these towns playing a crucial role during urbanization may be neglected. Due to their lower administrative level, rapid development status, complex urban–rural interaction, and ambiguous urban–rural fringe [16], it is more difficult to measure their urban sprawl level.
The second problem also derives from the administrative management of Chinese cities. The township jurisdiction contains both built-up and rural hinterland, and the proportion of the built-up area is usually low. Nevertheless, traditional studies rely on reported statistics that count the man-made surface area within the administrative boundary rather than the built-up area within the same boundary. A portion of cities with backward management do not have real-time updated data on built-up areas. Consequently, these studies are limited by data sources, making it hard to describe the true sprawl level of urban built-up areas accurately. As Lai et al. (2022) [17] has explained, without the boundary delineation (Zoning), planning is not possible. There have been many recent studies discussing methods for determining urban development boundaries [18,19], yet there has been far less discussion of how the changing physical urban boundaries are identified. Since the corresponding method has not yet formed a consensus, the Ministry of Natural Resources of the People’s Republic of China just designated a “Code of Practice for Standard Urban Built-up Area Delineation” in 2021 to serve the management of the preparation, implementation, and supervision of urban planning.
Recently, Ying Long (2016) [11] and Shuang Ma et al. (2019) [20] proposed that newly emerging big/open data can be used to identify the urban–rural divides and obtain information on the physical territories of cities in China more easily. Their work has laid a basis for the formulation of Chinese urbanization policies, and this paper will continue to advance their research efforts by using multi-source data to improve the identification technology of urban physical territories.
In this paper, the extraction of physical urban boundaries (PUBs) and the sprawl measurement are performed in the Wen-Tai region, one of the most developed regions in Zhejiang Province, China. It has seen rapid socioeconomic development in the last two decades, accompanied by an extreme expansion of built-up areas [21]. Since built-up area boundaries are not easily accessible, it is difficult for local authorities to make cross-sectional comparisons of the sprawl level and thus tailor interventions. From the perspective of planning assessment, local authorities need to obtain visual data on the sprawl of urban built-up areas in this region to understand the urban growth pattern and to launch appropriate initiatives.
The present paper aims to address the following questions: First, considering the difficulty in obtaining accurate built-up area boundaries of low-level towns, could we explore a reliable method for generating physical boundaries of towns using multi-source data to support urban morphology studies? Second, cities in coastal regions of China show rapid growth, while no comparative studies have been conducted to analyze the contemporary urban sprawl for these towns quantitatively. Is it possible to calculate the urban sprawl degree in the Wen-Tai region in the last 20 years by the above method? Third, is it possible to include functional data to assess the compactness of larger towns in the Wen-Tai region and to provide suggestions for future planning?

2. Literature Review

2.1. The Meaning of Urban Boundaries in the Chinese Context and the Concept of Larger Town

The term “city” generally refers to the area within the administrative boundary in the Chinese context. The hierarchy of administrative units is decentralized from the province, prefecture, and county to the township. As the third level of administration, 659 administrative cities are officially recognized. The criteria for the recognition of Chinese city change frequently and have multiple indicators. 100,000 people is a general standard. For administrative cities, both built-up areas and a larger rural hinterland are under jurisdiction. Therefore, it is important to clarify whether the discussion of city boundaries concerns the administrative boundary of city jurisdiction or the boundary for its built-up area. Precise identification of built-up areas in low-grade cities is not easy for the existing planning administration in China. In 2021, the Ministry of Natural Resources of the People’s Republic of China issued a new “Code of Practice for Standard Urban Built-up Area Delineation” [22] to help planners determine the built-up area of some fast-growing cities with a common standard.
Recently, Shuang Ma et al. (2019) [20] identified 1227 physical urban areas (PUAs) in China, which were defined as entities with a geographic area ≥ 10 km2. Of these, 480 PUAs were not within any administrative city and covered an area of 9820 km2, representing 16.2% of the total area. They suggested that these PUAs, which are not included in administrative cities, are overlooked in China’s statistics, and their identification was an important basis for measuring the development of China’s small and medium-sized cities, determining their development stage and contribution to the overall urbanization of the nation. A large proportion of these “cities” are the larger towns discussed in this paper, which are within the boundaries of higher administrative units but are separated from the downtowns of these units. Numerous larger towns meet the criteria of cities in terms of economy, population, and built-up area, which has received the attention of the Chinese government.
Zhejiang Province launched Central Town Cultivation Program in 2007 [23] to support certain towns to become “central towns” to better coordinate urban and rural development and transfer rural populations nearby. In 2010, Zhejiang further implemented the Small City Fostering Plan [24] to select potential towns from the central towns. More policy and funding support were targeted to develop them into small cities. Recently, Longgang, a larger town in Zhejiang, has been successfully upgraded from township to “county level city” in 2019. According to the China Township Comprehensive Competitiveness Report 2020 [25], Zhejiang Province boasted 13 of the top 100 towns in China, ranking only third to Jiangsu Province and Guangdong Province. While Zhejiang had a land area of 1055 km2, accounting for only 1.1% of China’s land area. In this paper, the Wen-Tai region was selected as the subject occupied four of the top 100 towns.

2.2. PUB Extraction Method

As mentioned above, urban boundaries generally refer to administrative boundaries for Chinese cities. In many cases, to obtain the PUBs, planners rely on specialized extraction methods. Remote sensing imagery [26,27,28] and nighttime light imagery [29,30] have been widely used and their corresponding methods are widely discussed. However, both approaches have shortcomings.
In remote sensing images, because of the interspersion and similar spectral characteristics of many built-up areas and bare city-edge land, it is easy to form hard-to-distinguish mixed images on multi-spectral images [31]. Consequently, remote sensing images can only distinguish the visual interpretation of urban areas, which may cause the misinterpretation of actual urban areas [32,33]. It is difficult to extract finer built-up areas from low-resolution nighttime light data, such as DMSP/OLS and NPP/VIIRS nighttime light data with resolutions of about 1 km and 500 m, respectively. Therefore, studies on built-up area extraction based on nighttime light data are mainly on the national scale [34,35].
To improve the accuracy of boundary identification, the data output quality has been improved by integrating multiple data [36,37]. Due to the differential boundaries identified by various methods, how to evaluate and correct these differences has become a challenge. Notably, high-resolution vector data have also been used (e.g., open street map (OSM) road networks and points of interest (POIs)) to extract PUBs [11,38]. Corresponding studies have been used nationwide but have not yet emerged in lower administrative units, which may be owing to the lack of integrity of such data.

2.3. Compact City Measurements

Sprawl and compactness are opposite concepts [3]. Controlling urban sprawl and promoting the compactness of urban built-up areas are common goals of cities worldwide in pursuing sustainable development. The methods of measuring urban compactness include single-indicator measures, and multiple-indicator approaches. Single-indicator measures are mostly used in early compactness measurement studies, such as Richardson index [39], Cole index [40], Gibbs index [41], etc. They are mostly based on the morphological outline, failing to cover the complex meaning for compactness. In recent studies, multi-indicators tend to be used for measuring the urban compactness [42,43,44], with indicators including population density, the continuity of urbanized land, the concentration of land, and mixed land use. Compared with single-indicator measure, it can reflect the compactness of cities in a more comprehensive and integrated way. The commonly used methods for constructing indicator models include the analytic hierarchy process (AHP) [13], principal component analysis (PCA) [45], entropy weight method (EWM) [46], etc. The indicator matrix is constructed mostly considering economic functions [47,48] and morphological contours [6,26]. These indicators usually reflect the characteristics of compactness as described in theoretical studies: high density, mixed land use, intensive land development, compact morphology, public transportation, and road network connectivity [49,50,51,52,53].
Case studies of compactness in China can be divided into system of cities studies and big city studies. In system of cities studies, local statistical yearbook data are mostly used to quantify the economic function dimension, and the analysis unit corresponds to the administrative unit so that economic function indicators (e.g., GDP and population) can be directly called for analysis [47,54]. Nevertheless, this type of study cannot reflect the influence of spatial morphological factors and cannot produce direct guidance for spatial planning.
In the studies of big cities, land-cover remote sensing images are generally employed [6,26], and studies based on multi-source open data have also emerged. For instance, Wenze Yue et al. (2020) [55] collected data from 106 big cities across China for comparison. They mainly used Landsat remote sensing image data and local statistical yearbook data to comprehensively measure the sprawl of big cities in three dimensions: economic efficiency, population density, and spatial pattern.
Neither of the above two case study approaches can be directly applied to the issues in this study for two reasons. First, the administrative cities in China are much larger in scope than PUAs. Data at the township level often include the vast surrounding rural hinterland, while data for the built-up areas of towns are difficult to isolated from the administrative unit. Second, metropolitan areas generally expand outward from a distinct core and their morphological change is easy to grasp. In contrast, the larger towns involved in this study expand in multiple ways, including expansion from the old urban core, the merging of several cores, the spillover of administrative boundaries, and administrative boundary adjustments.
The emergence of new Internet data certainly addressed this challenge. New Internet data, such as POIs and OSM road networks, allow for a detailed analysis of the functional and spatial structure of regions and even blocks, owing to their high resolution and large volume [37]. Preliminary studies have emerged using these data in compactness assessment. For instance, Ting Lan et al. (2021) [56] used POIs data to assess the functional compactness of blocks, and Chang Xia et al. (2020) [57] employed data from Dianping (the Chinese equivalent of Yelp) records to reflect the area vitality. Although these studies are for big cities, this type of methods is also useful for studies of larger towns.

3. Study Site and Data Sources
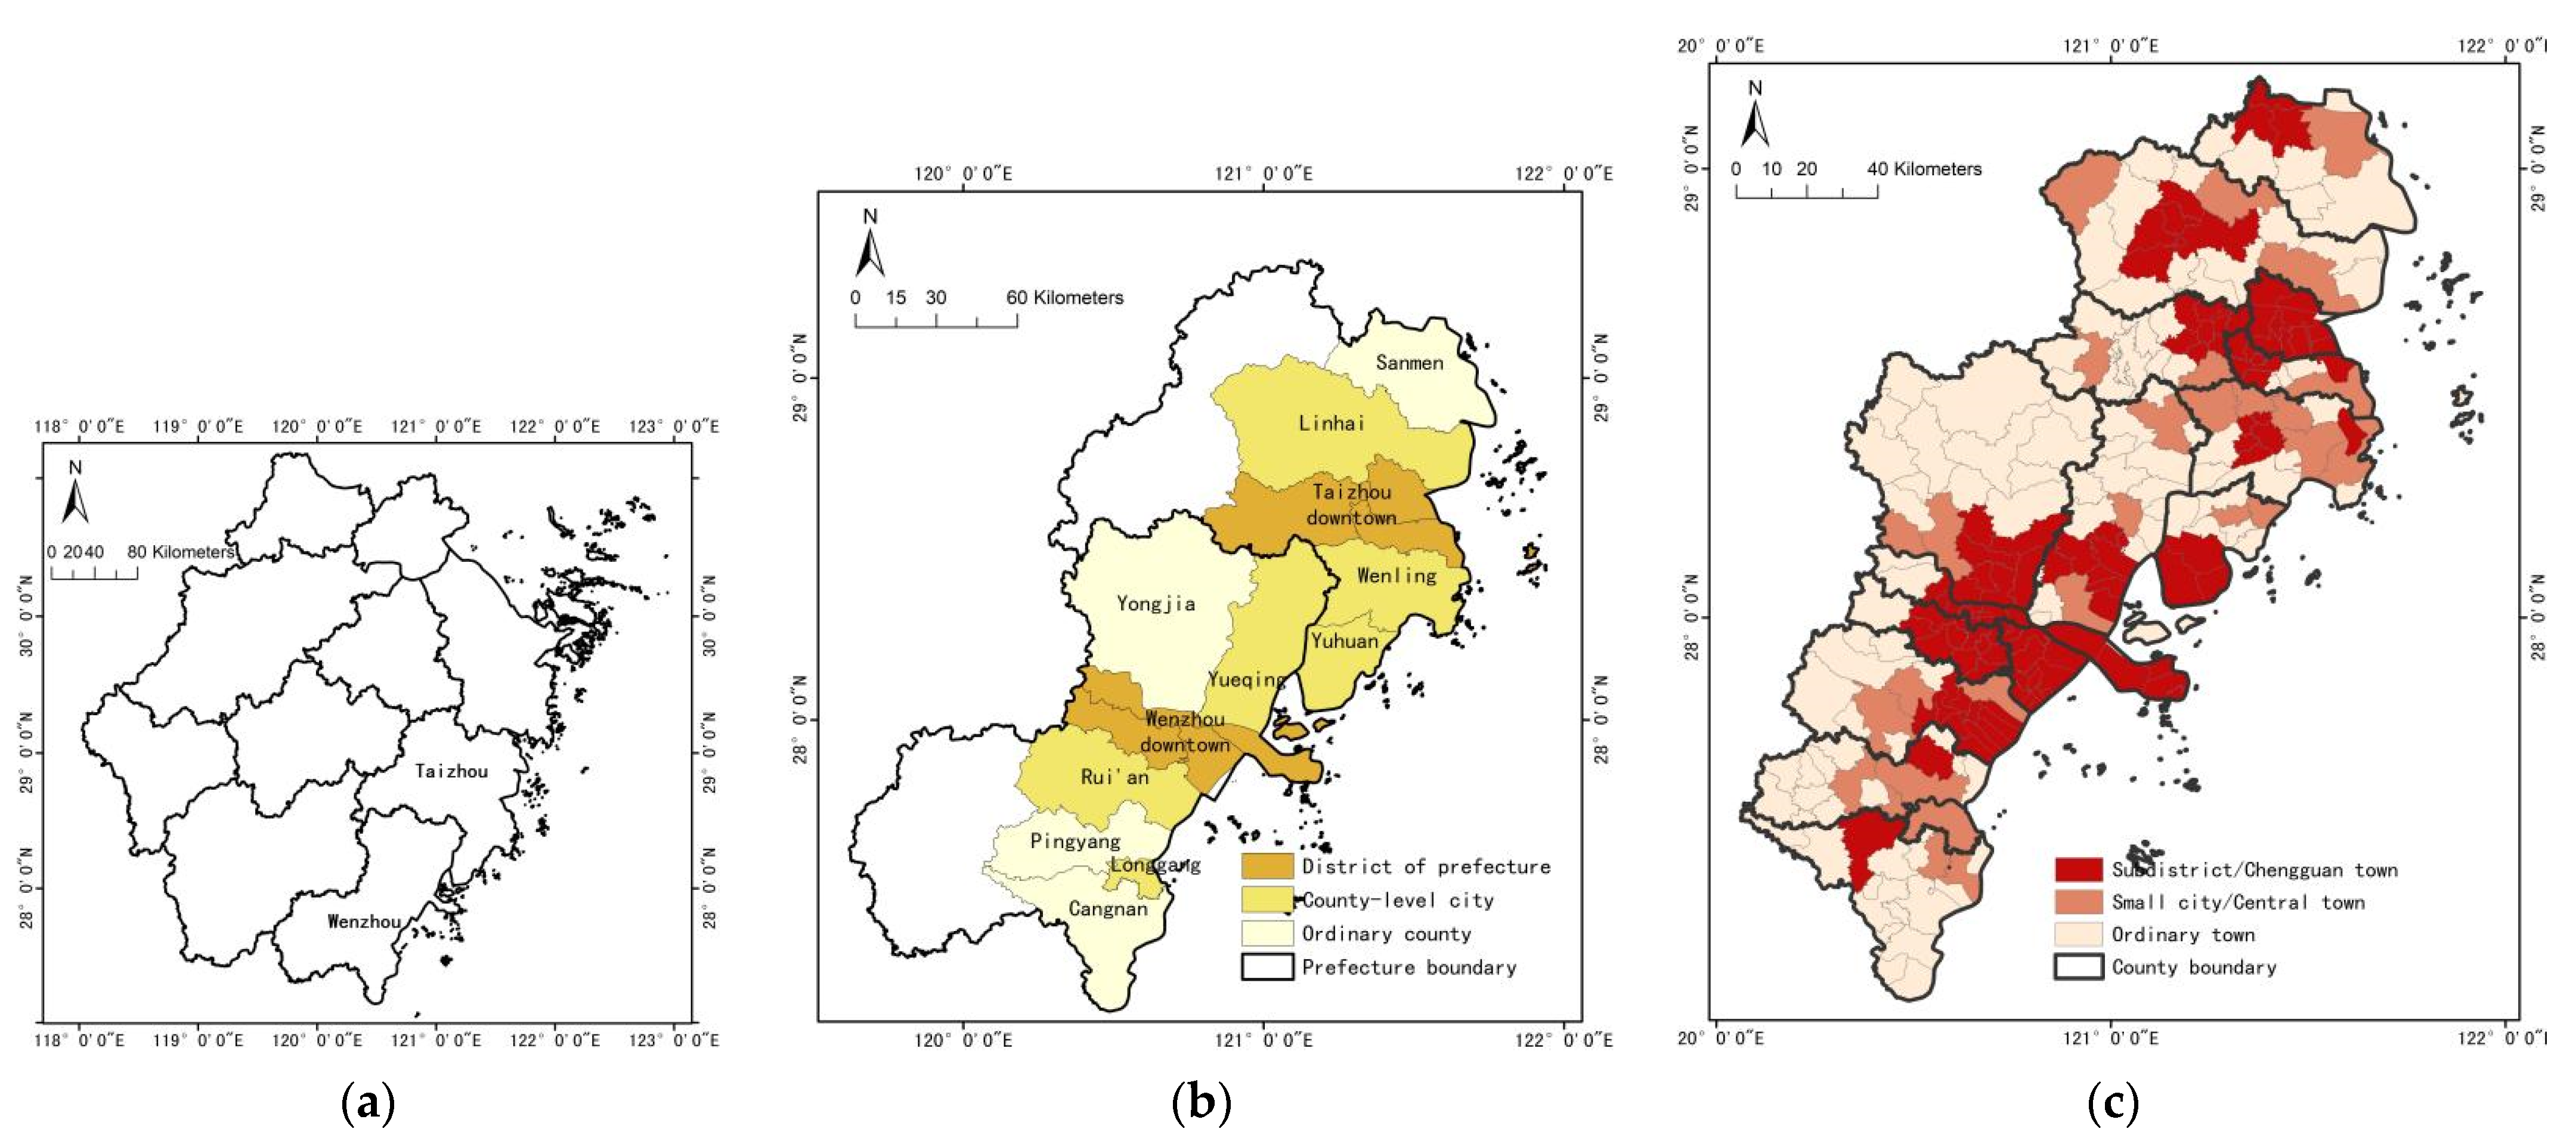
3.1. Study Site

This study selected the coastal region of Wen-Tai, Zhejiang Province, China, as an empirical case. This region is dominated by hilly terrain and is abundant in marine, mudflat, and tourism resources and basically consists of two prefecture-level cities (Figure 1a). According to the 2011–2020 Urban System Planning of Zhejiang Province, the Wen-Tai region is listed among the three major systems of cities in Zhejiang, with a spatial extent of 27°05′–29°20′ N and 120°06′–121°94′ E 1.
The study area encompassed 17 county-level administrative districts at three levels of urbanization degree. Among them, the municipal districts of Wenzhou and Taizhou show the highest degree of urbanization; the six county-level cities of Yueqing, Rui’an, Longgang, Wenling, Linhai, and Yuhuan present a medium degree of region-wide urbanization; the four county units of Cangnan, Pingyang, Sanmen, and Yongjia have the lowest degree of region-wide urbanization (Figure 1b).
The next level of these 17 county-level administrative districts is the designated town or subdistrict. There are 254 units in this study area, which are divided into three categories according to their urbanization level: the first category is the subdistricts in municipal districts and county-level cities or Chengguan towns (capital of the county); the second category is small cities fostering towns and central towns; the third category is ordinary towns. Figure 1c provides a visual representation of this classification; a redder color indicates a higher level of urbanization. As a reminder, the more urbanized township units generally have much smaller areas than the less urbanized ones.

3.2. Data Sources

This study used GlobeLand30 remote sensing image data, vector road network data, NPP/VIIRS nighttime light data, and POIs data. The first two were mainly used for boundary extraction, while the latter two were utilized for compactness assessment.

3.2.1. GlobeLand30 Remote Sensing Image Data

GlobeLand30 (Figure 2a) is a data product covering global land, developed by the China Geological Survey. It includes 10 land cover types, namely water bodies, wetlands, artificial surfaces, croplands, forests, shrublands, grasslands, and barren lands [58]. This study used the GlobeLand30 datasets of 2000, 2010, and 2020, from which the artificial surface data were extracted as build-up area coverage data to study the change in expansion rate across the years.

3.2.2. Vector Road Network Data

This study used OSM (Figure 2b) vector road network data acquired in March 2022. OSM is an open-source map supplier, providing free and easily accessible digital map resources, and is currently the most popular volunteered geographic information (VGI) with a complete road network for urbanized lands [59]. However, the later research will show that OSM data omit certain major streets in certain towns, which need manual verification.

3.2.3. NPP/VIIRS Nighttime Light Data

NPP/VIIRS nighttime light data (Figure 2c) represent visible light (e.g., city lights, fishing fleet lights, and fires) captured by remote sensing satellites under cloud-free conditions at night. These data derive from the National Geoscience Data Center of the National Oceanic and Atmospheric Administration (NOAA/NGDC). The raw nighttime light data are disturbed by clouds, stray light, fires, and other transient light, which can be reduced using annual integrated data [56]. Therefore, this study employed the annual integrated data for 2020.

3.2.4. POIs Data

POIs data (Figure 2d) are zero-dimensional elements involving specific real-world locations, such as historical sites, landmarks, public service facilities, stores, schools, and restaurants [56]. The data used in this study were crawled from a Chinese mapping website AMap in 2020. Then they were filtered and classified into 14 major categories based on the broad category classification of AMap POIs: food and beverage services, scenic spots, public facilities, companies and enterprises, shopping services, financial and insurance services, scientific, educational, and cultural services, transportation services, business housing, living services, sports and leisure services, health care services, government agencies, and services for social organizations and accommodation.

4. Method

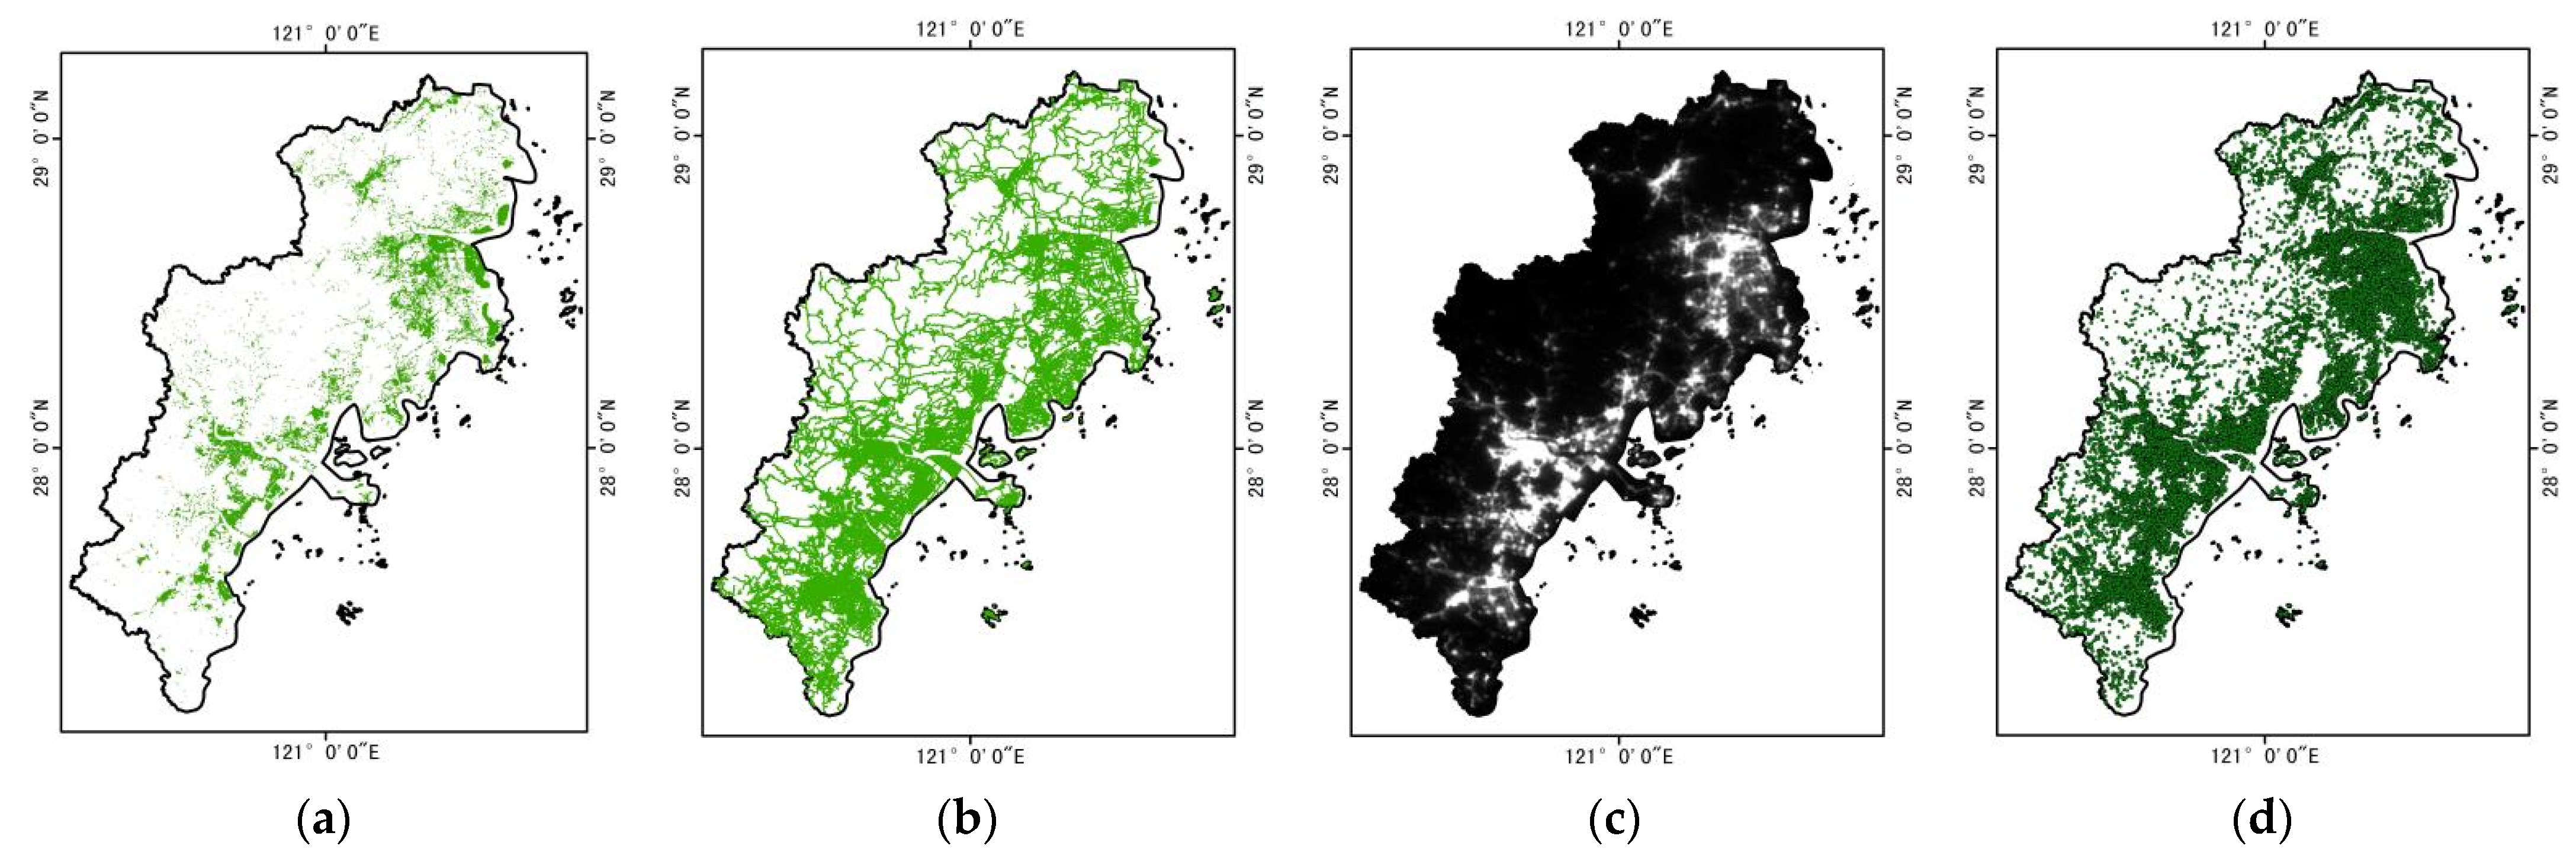
4.1. PUB Extraction with Two Types of Data

This study used vector road network data to compensate for the shortcomings of remote sensing images and extract more reliable PUBs. Ying Long (2016) [11] performed the spatial aggregation of vector road network intersections to extract PUBs across China. Shuang Ma et al. (2019) [20] used community units to conduct the secondary correction of the boundaries extracted from remote sensing image data. Based on the two studies, this paper proposed a novel method for PUB extraction. With the flow chart shown in Figure 3, this method consisted of four steps. The first step was the processing of remote sensing images. The man-made surface was extracted in the GlobeLand30 2020 dataset and then transformed into vector data. The second step was the processing of the vector road network. Highways were first removed, and two-lane roads were converted to single lanes. Then dangling roads and independent roads were removed by topology processing. Finally, the road network was interrupted at intersections. The third step was block aggregation. First, the vector road network was converted into blocks, and then the blocks containing at least 50% of the artificial surface were selected. Subsequently, the blocks were aggregated using ArcGIS 10.6 with a threshold of 300 m. The fourth step was to select spatial clusters with a continuous solid area greater than 1.5 km2 as the PUBs of the Wen-Tai region.
Threshold setting is the key to identifying physical territories, and the threshold value varies with diverse research situations [20]. This study set the threshold based on the smallest PUA of the central towns and small cities. The first round of calculation indicated that Dajing was the smallest central town with a 1.0 km2 entity area, and 119 PUAs were identified with this value, essentially covering the built-up areas of three types of towns: districts, small cities, and central towns. Moreover, the built-up areas of 29 ordinary towns were also identified. According to the comparison of the satellite map with the identified PUAs, the identified PUAs of six towns, namely, Mayu, Dajing, Qiaoxia, Zeguo, Baishuiyang, and Jiantiao, were significantly smaller than the actual built-up areas. The reason is that the missing road networks in the OSM cause the missing edge blocks and requires manual supplementation of the absent data. Then, the second round of calculation showed that Dajing was still the smallest central town with an entity area of 1.5 km2, and 95 PUAs were identified with this threshold. Some ordinary towns also presented the size of larger towns, such as Furong, Pengjie, and Yishan (Figure 4), with their size exceeding the threshold condition according to the satellite map.
In this section, the Liubai district in Yueqing county-level city was selected for testing, and the differences in the extracted PUB boundaries in this paper were compared with those by the methods of Ying Long (2016) [11] and Shuang Ma et al. (2019) [20] (Table 1). The Liubai district consists of two neighboring towns, which has double cores and cross-administrative boundary. From the Yueqing Municipal Master Plan (2013–2030) [60], the superior planning encourages the integrated development of the two towns. As shown in Table 1, in Long’s method, the threshold setting is too subjective and the identified boundary is too small compared with the actual built-up area, failing to reflect the vision of merging the two towns. Long’s study mostly applies to the national scale and shows poor identification accuracy at the larger town level. Ma’s method reflects the administrative elements but neglects the urban spatial structure. Compared with the methods of Long and Ma, this study used blocks as the basic identification unit of the urban system, which showed relatively higher extraction accuracy at the larger town level and fitted better with the spatial structure of the town. Consequently, the method proposed in this study appears a better performance than the other two methods in terms of larger towns.

4.2. A Longitudinal Study of Urban Expansion

Statistics showed the tremendous expansion of built-up areas in Zhejiang cities and towns in the past 20 years. Since the PUBs of towns are not easily available, it is extremely challenging for the planning department to conduct cross-sectional comparisons of such expansion. From the perspective of planning assessment, government departments need to obtain visual data on the expansion dynamics of built-up areas of towns in the region to understand the urban growth law and implement proper interventions.
Considering the public availability of GlobeLand30 data for 2000, 2010, and 2020 and the virtually unchanged constructed road network, we can use the latest OSM road networks, combined with remote sensing images from 2000 and 2010, to obtain the approximate historical PUBs. In this way, the expansion rate of larger towns can be further calculated, and the expansion rate of larger towns in the Wen-Tai region can be compared horizontally. For the PUBs in 2000 and 2010, this study still used 1.5 km2 as the threshold for extraction.

4.3. Measurement Framework for Urban Compactness

This study proposes to create a new compactness index by incorporating multidimensional aspects of compactness. Considering the availability of data sources and relevant literature findings, four dimensions are selected: the compactness of external contour, the accessibility of road network, land-use intensity, and functional diversity. Entropy weight method (EWM) was used to construct this compactness index.

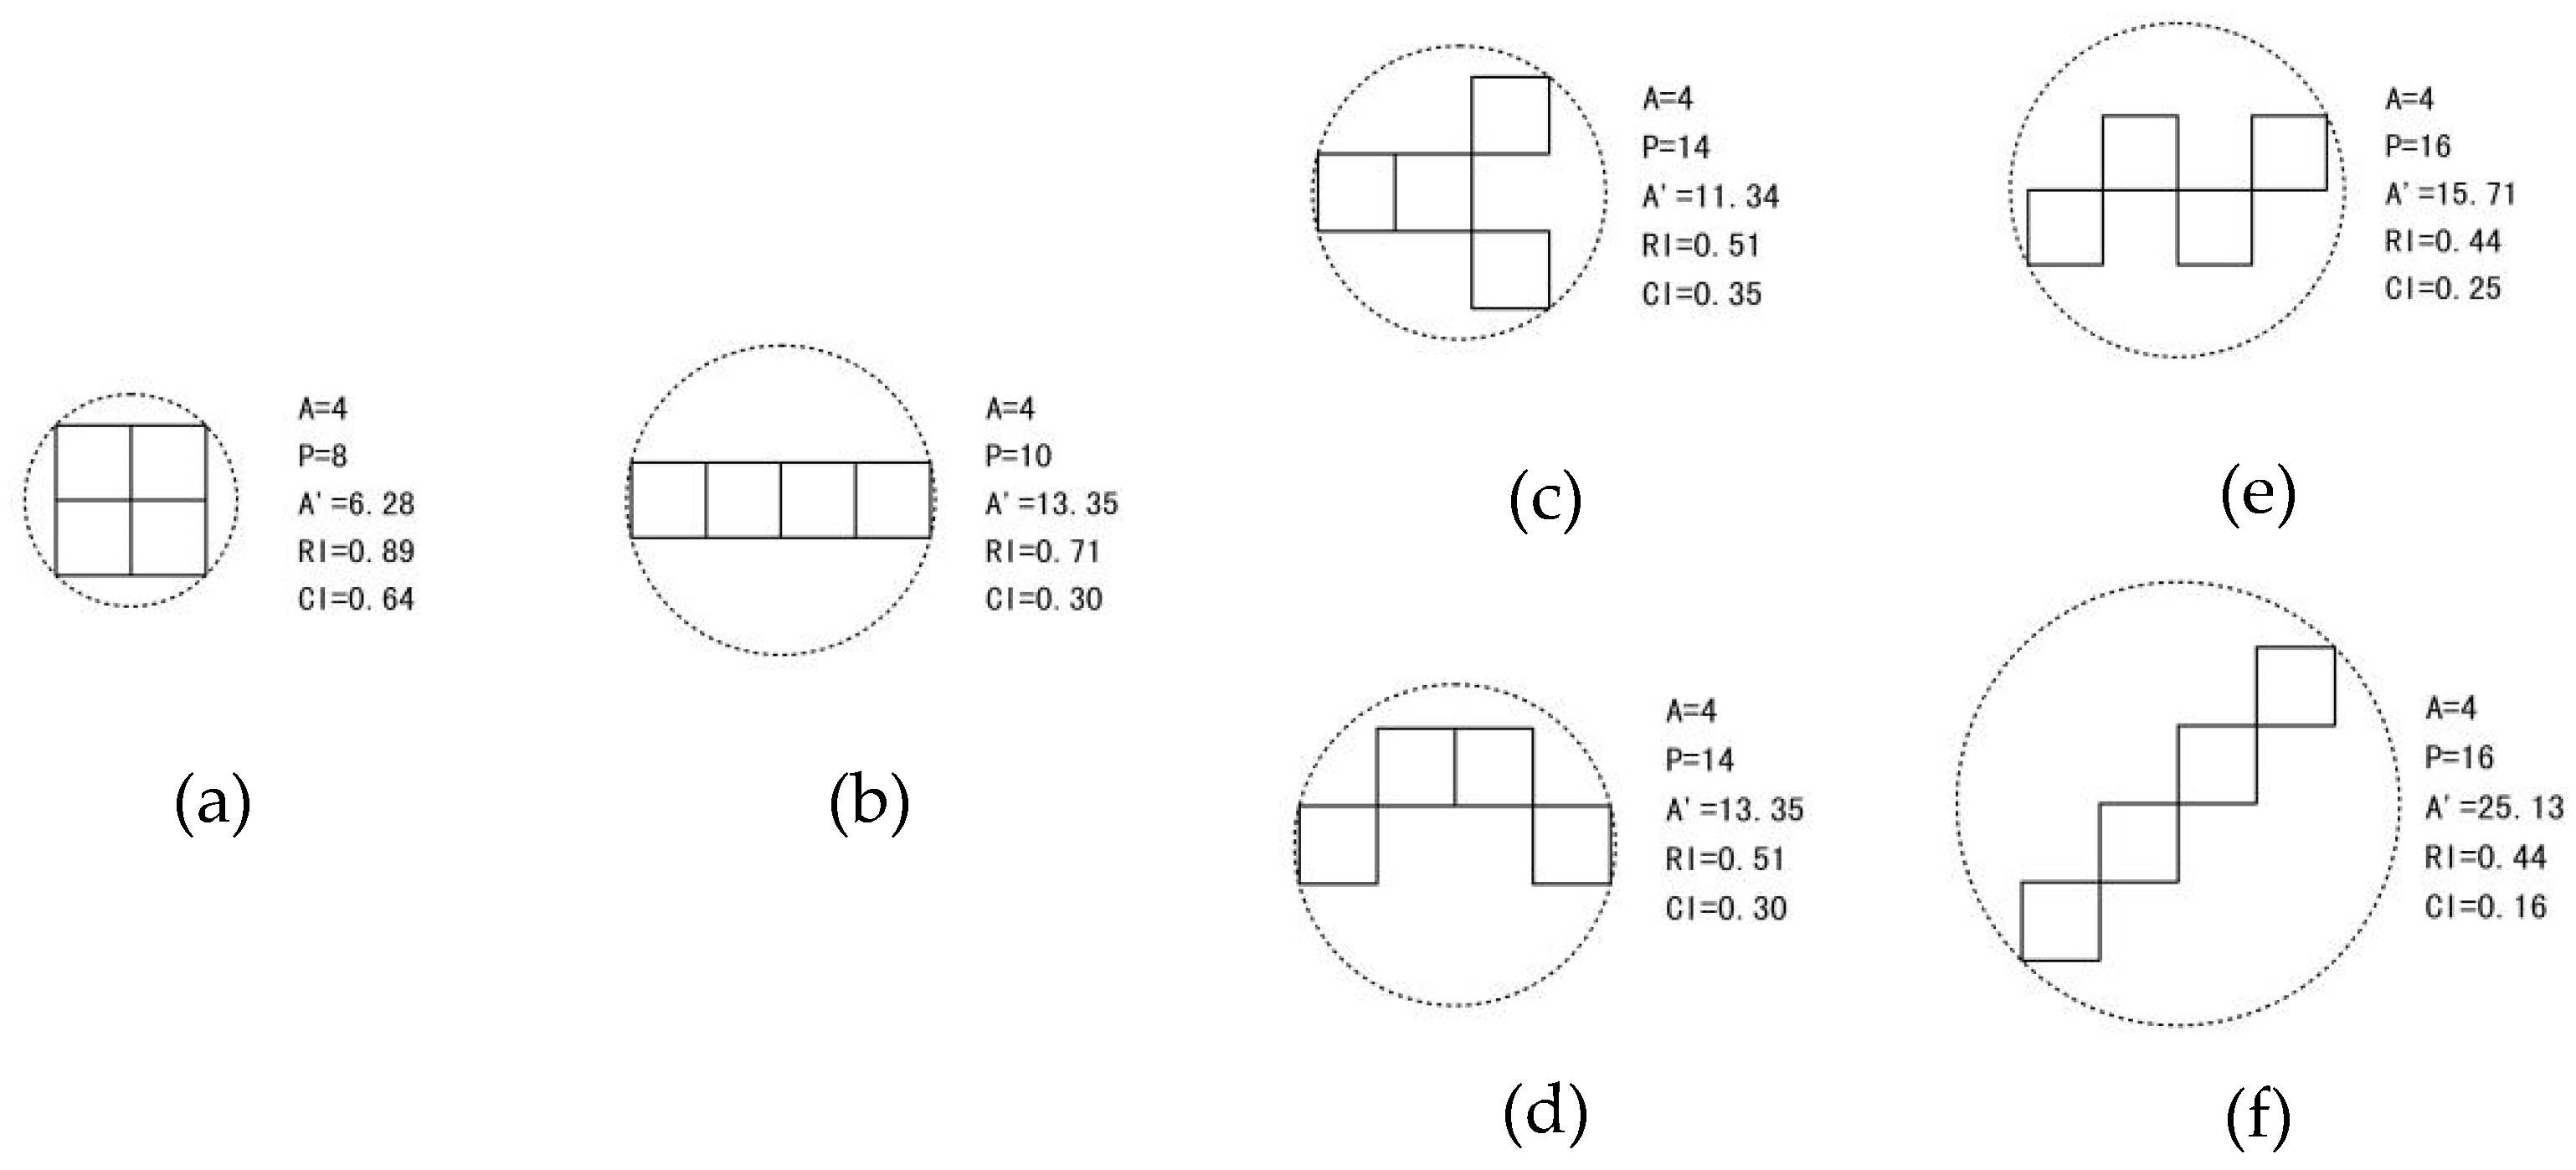
4.3.1. Compactness of External Contour

Richardson index (RI) and Cole index (CI) are widely used for measuring the compactness of the external urban contour. Both are calculated as follows:
RI = 2 π A P
where A and P are the area and perimeter of PUA, respectively.
CI = A A
where A is the area of PUA, and A′ is the area of the smallest external circle of PUA.
RI and CI are both classical compactness indicators, and their values represent different aspects of the compactness for different types of settlements. Therefore, both indicators are included in this measurement framework. Figure 5 gives an example of six abstract settlements to demonstrate the attributes of these two indicators. The six settlements have the same area, and in terms of perimeter, (c) is the same as (d), (e) is the same as (f). Therefore, their RI values are decreasing from left to right. However, the external contour of (f) is obviously more disperse than that of (e). The CI value of (f) is indeed the lowest, which means the area of outer tangent circle variable in the formula of CI is crucial. However, from the ranking of CI values, (c) > (b) = (d). As an elongated settlement, the compactness of (b) should be higher than the scattered development of (c) and (d). Therefore, the RI value which can represent this feature is a good complement to their value of CI.

4.3.2. Accessibility of Road Network

The idea of compact cities is that all urban functions are within walkable distances to reduce the traffic consumption of each visitor and resident, and space syntax is widely applied in measuring the accessibility of neighborhoods [53]. In this regard, this study used the sDNA (spatial design network analysis) model developed by Cardiff University, UK, to assess the accessibility of each town [61], expressed as follows:
AC x = i = 1 n BtAR ( x ) i L i   i = 1 n L i  
where ACx is the accessibility of a certain urban settlement within radius x, while BtAR(x)i is the betweenness centrality of a line segment in an angular analysis within radius x. Since the values of line elements need to be assigned to the settlement in which they are located, we used the mean value of BtAR(x)i for these lines weighted by length. The radii x chose in this paper are 800 m and 5000 m, n is the total number of street segments within the urban area, and Li is the length of a street segment. In the Figure 6 below, it can be seen that for the same settlement, the accessibility expressed by the two radii differ sig-nificantly. In general, settlements with small blocks have higher AC values within radius 800 m, while the settlements which have better connection with the surrounding areas have higher AC values within radius 5000 m.

4.3.3. Land Use Intensity

Urban land use intensity refers to the degree of land development in urban areas, as a term widely used in urban planning and design, landscape analysis, and land use management. It has a strong and complex relationship with the sustainability of society [57]. In this study, the indicator nighttime light intensity (NLI) was used to characterize the land use intensity, calculated as follows:
NLI = S A
where A is the area of PUA, and S is the sum of the brightness values of the lights within the PUA at night.

4.3.4. Functional Diversity

The intensity of human activities in the region is maximized by increasing the regional functional diversity to accommodate people’s daily activities in the area. In this study, the indicators POIs density (PD) and POIs mixed index (PMI) are used to characterize the functional diversity of PUAs, as calculated as follows:
PD = P A
where A denotes the area of PUA, and P denotes the number of POIs within the PUA.
PMI = j = 1 m i = 1 n x ij ln x ij m
The formula for calculating PMI in this study refers to the algorithm of the Shannon index. First, a 100 m × 100 m sampling point was constructed in the study area, then the POIs mixing index within the 200 m buffer of the sampling point was calculated. Finally, the average POIs mixture index of the points was obtained. j represents the sampling point number; m is the number of sampling points; i is the POIs category number within the sampling point buffer; n is the total number of POIs categories within the sampling point buffer; and xij is the proportion of POIs in category i.
We give an example to illustrate the algorithm of PMI. Figure 7a shows the example of POIs and town. In Figure 7b, we construct 100 m × 100 m grids and calculate the SI (Shannon index) of each grid. S I = P i × ln P i . Pi is the proportion of the ith functional type. In Figure 7c, PMI is equal to the mean value of Shannon indexes of all grids.

4.3.5. Statistical Analysis

We standardized all indicators, which were all positive, with the following standardization formula:
C normalize = C C min C max C min
C denotes an individual observation of an indicator, normalized to a value limited between 0 and 1. We then determined the weights for each indicator using the EWM, an objective weighting method for measuring value dispersion. A larger dispersion means a more obvious change in measurements, which may provide more information. These measurements have higher weights when calculating the level of compactness [46].

5. Results

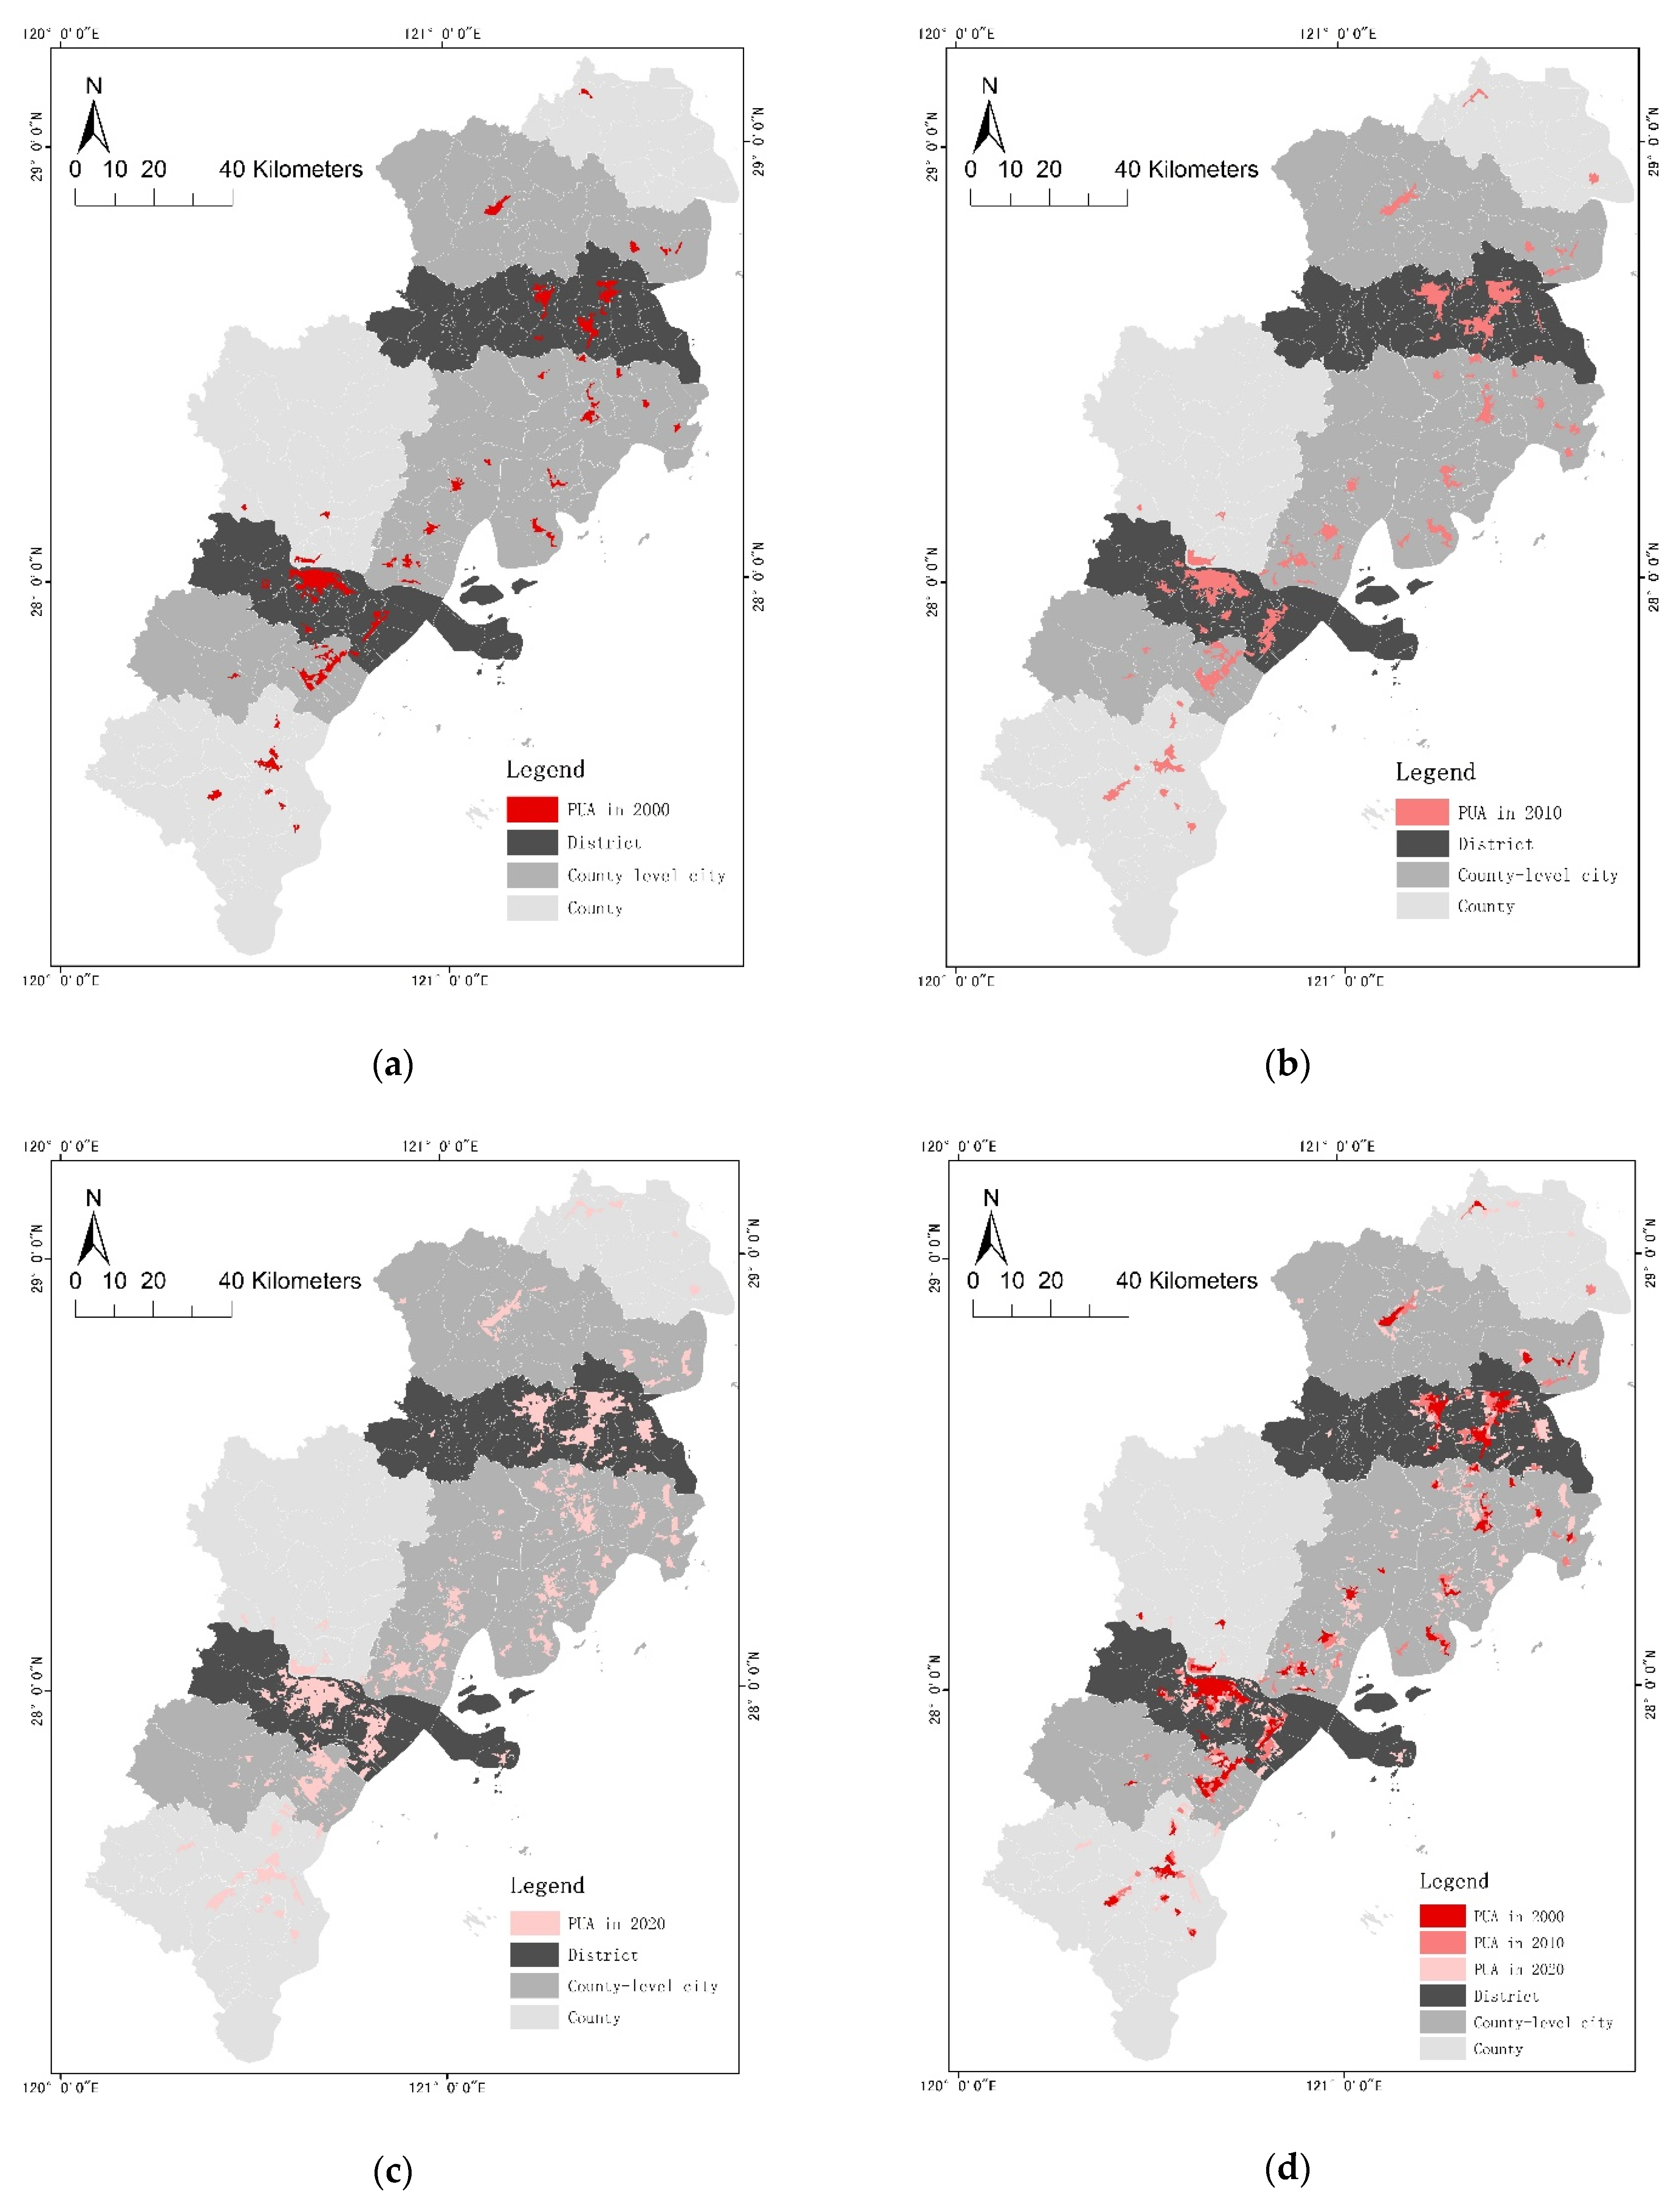
5.1. Results of the Identification of PUAs for 2000–2020

Table 2 shows the descriptive statistics of the identified PUAs in the Wen-Tai region for 2000, 2010, and 2020. The total PUAs identified for 2000, 2010, and 2020 were 290.3 km2, 521.1 km2, and 904.0 km2, respectively. The rate of expansion from 2000 to 2010 was 79.5%, with an area growth rate of 23.1 km2/year. In contrast, the expansion rate for 2010–2020 was 73.5%, with an area growth rate of 38.3 km2/year. The expansion rate in these two periods was basically consistent, with the first decade slightly higher than the second decade. However, the urban area growth was extremely rapid in the second decade, about 1.66 times greater than that of the first decade.
Figure 8 provides a visual representation of the identified three stages of PUAs with administrative hierarchy information overlaid in the background. As can be found, the expansion of PUAs in Wenzhou and Taizhou downtown was the most obvious. The visualization of the physical cities in 2020 showed a spatial development pattern with Wenzhou and Taizhou downtowns as the two urban cores, around which county downtowns and larger towns expanded, indirectly promoting the construction of many ordinary towns and new coastal zones. This was highly consistent with the multi-level town system of Wen-Tai in 2011–2020 Urban System Planning of Zhejiang Province [62], and the identification results were satisfactory.

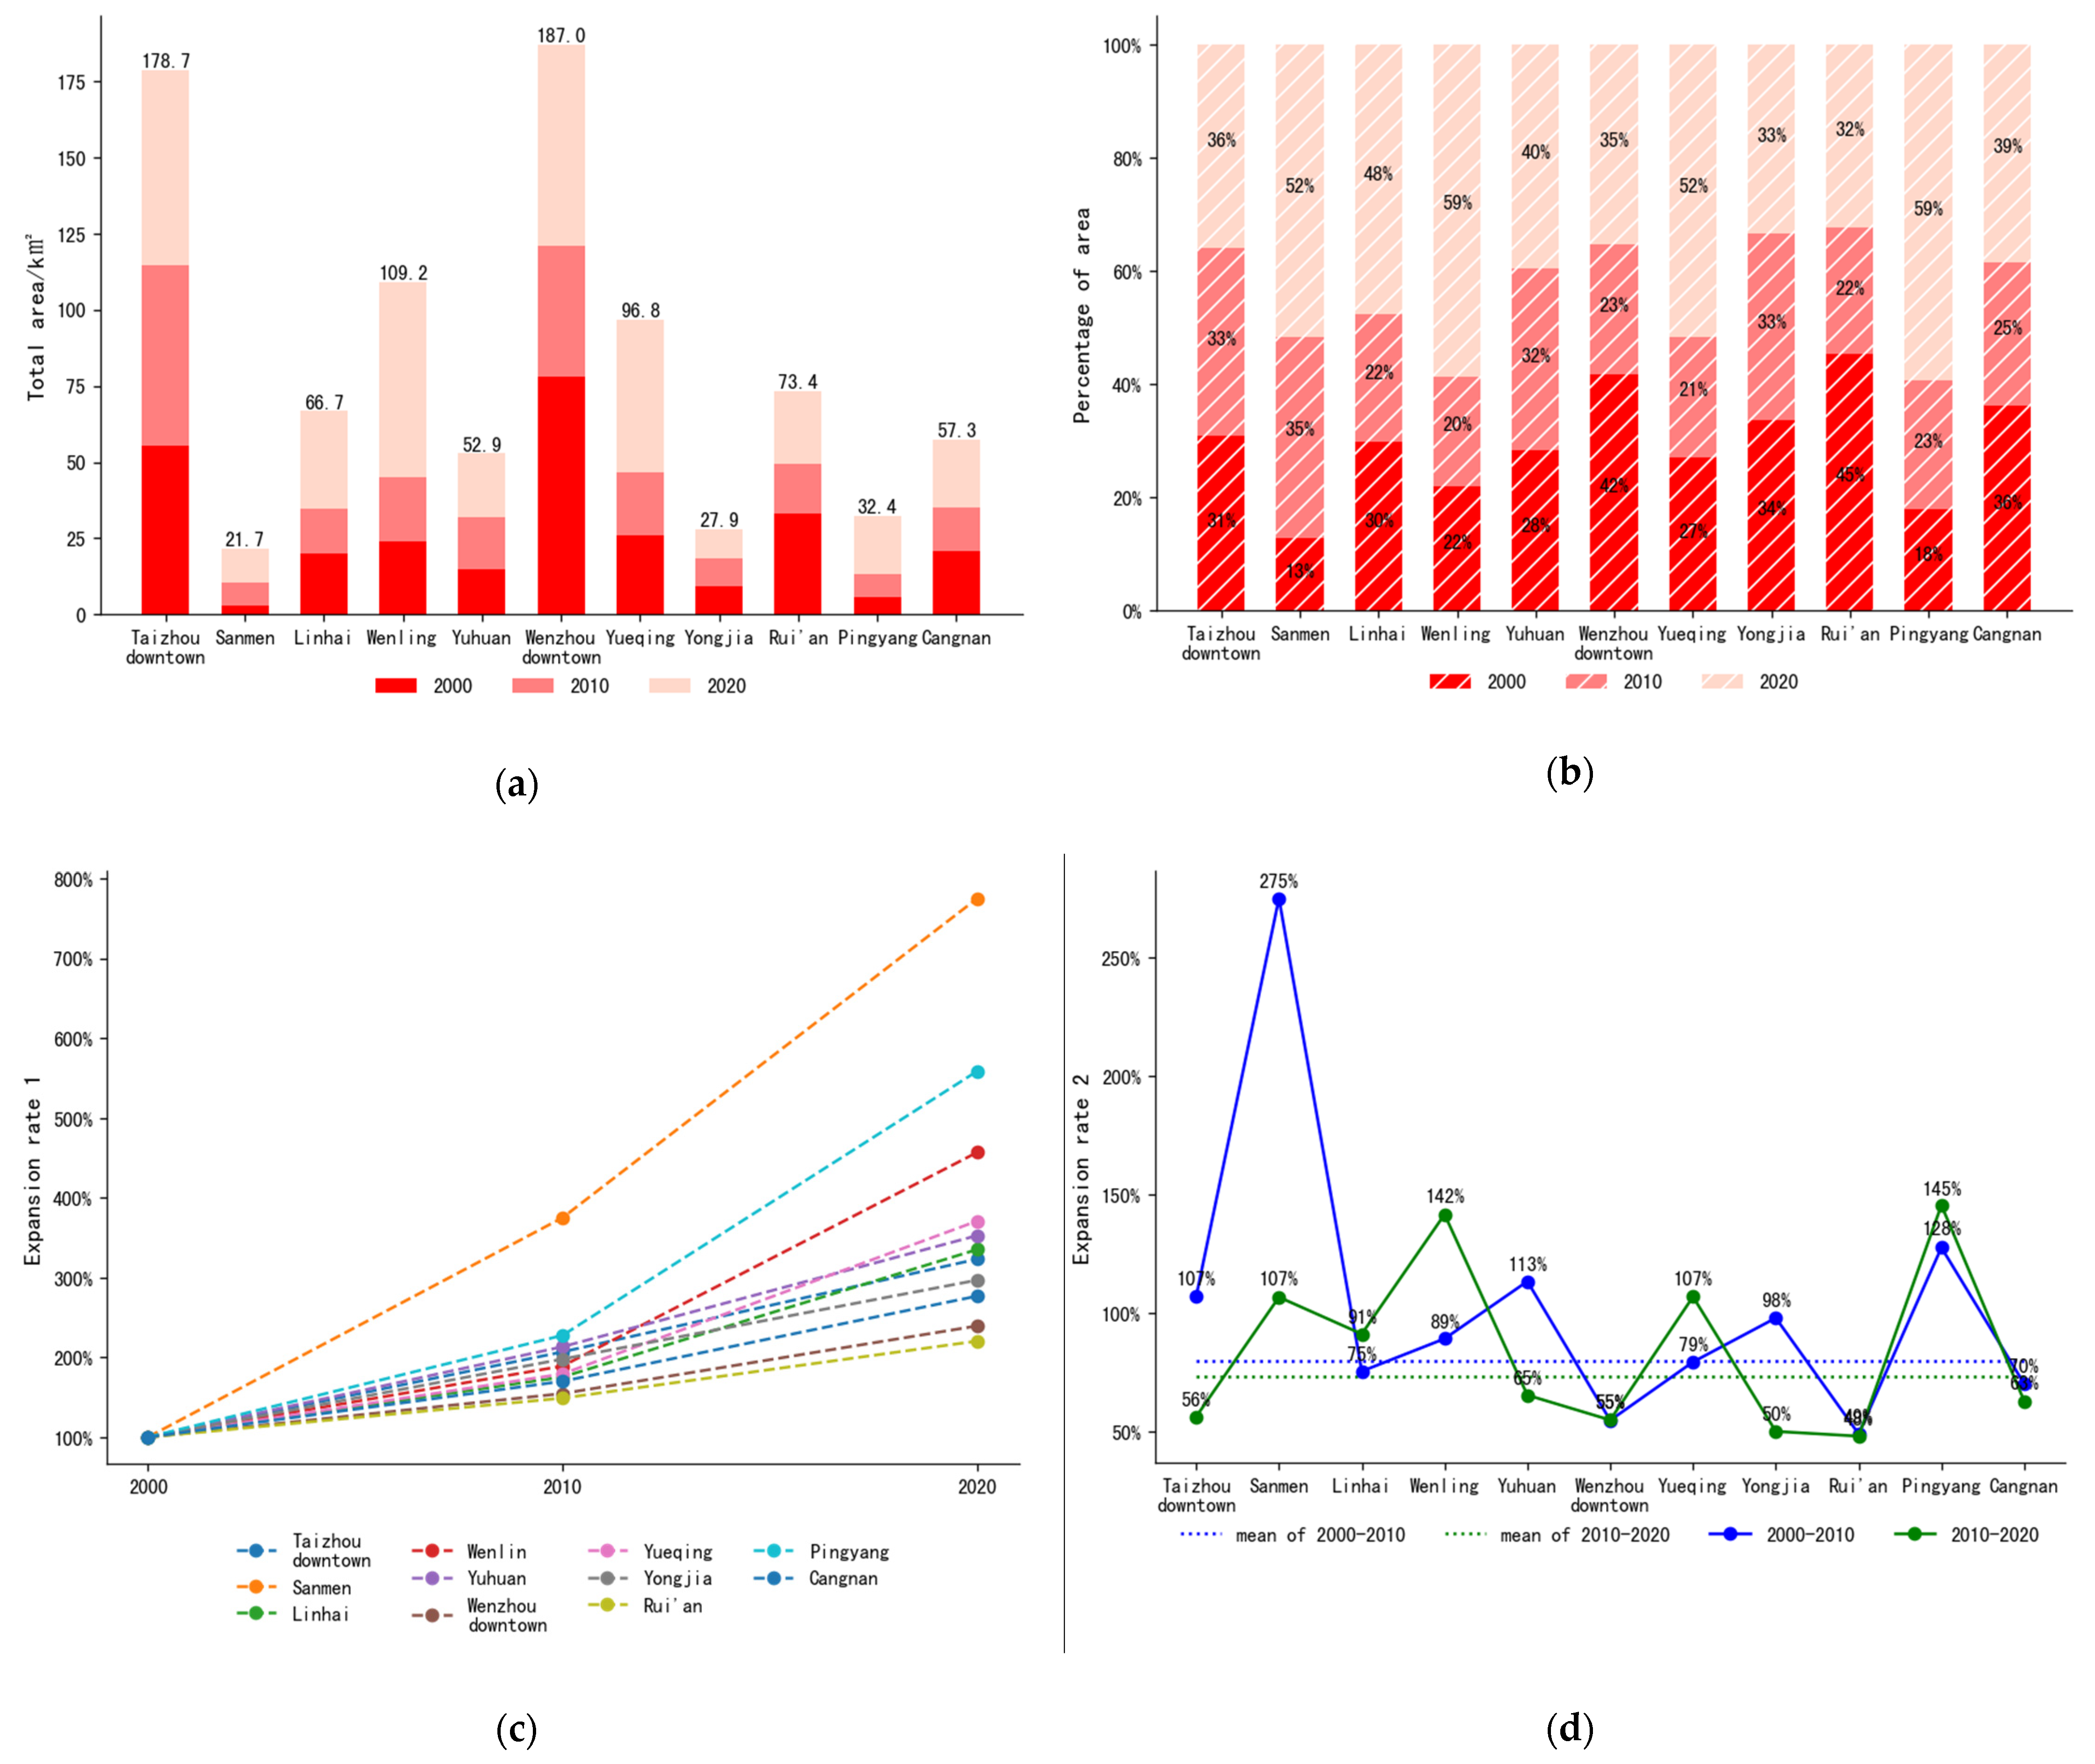
5.2. Expansion Rate of PUAs Based on County Level

Since many new PUAs emerged during the two decades, it is difficult to compare the expansion rate for PUAs per se. In this subsection, the expansion rate of PUAs was measured based on county units to achieve a cross-sectional comparison. It should be noted that the Wenzhou downtown includes four districts equivalent to county units, while the Taizhou downtown encompasses three. However, these districts are often cognitively part of a whole and thus were combined in the following analysis. Additionally, Longgang City has been merged into its original territory Cangnan County due to its short period of independence. Therefore, the following analysis was carried for the two downtowns and the nine county units.
Table 3 shows the area of PUAs identified by different county units and the expansion rate, which is visualized as presented in Figure 9. In Figure 9a, it can be seen that the PUAs identified in Wenzhou and Taizhou downtowns were the largest, totaling 187.0 and 178.7 km2, respectively, followed by the county-level cities of Wenling, Yueqing, Rui’an, and Linhai. In contrast, Pingyang, Yongjia, and Sanmen counties had the poorest physical area, and the size of the physical area identified in the county unit was generally consistent with the urbanization levels. Figure 9b shows that for all county-level units, the new area in the latter decade was larger than that in the former decade. Even for the four county-level units, namely Wenling, Yueqing, Pingyang, and Sanmen, the proportion of the new area growth exceeded 50% in the latter decade, implying that urbanization was mainly concentrated in the latter decade.
Figure 9c shows the 10- and 20-year expansion rates calculated using the total built-up area in 2000 as the base, with fluctuations of 149–375% and 220–775%, respectively. The huge fluctuation was induced by the low base and significant urbanization of some counties in the last 20 years. Figure 9d shows the expansion rate of the two decades separately. In the first decade, Sanmen and Pingyang showed the highest rate of 275.0% and 127.6% but the least new area of 7.7 and 7.4 km2, respectively. Their faster expansion resulted from their lower bases in 2000. In the second decade, Pingyang and Wenling presented the highest rates of 145.5% and 141.6%, respectively. Among them, Pingyang had an additional area of merely 19.2 km2 due to its low base, below the average level of the research units. In contrast, Wenling had an additional area of 64 km2, third only to Wenzhou and Taizhou downtowns, with relatively serious expansion.
The dashed line in Figure 9d indicates the average expansion rate of the 11 analyzed units in the first and second decades. During the two phases, units can be classified into four categories by comparing their expansion values with the average: 1. High–High: Pingyang, Sanmen, and Wenling. These units saw an above-average expansion in both phases and were the key governance targets. 2. Low–High: Yueqing and Linhai. The above-average expansion in the latter decade of this category of units tended to accelerate and was a critical concern. 3. High–Low: Taizhou, Yongjia, and Yuhuan. Such units had above-average expansion in the first decade, and their rapid urbanization was mainly accomplished in the first decade. 4. Low–Low: Wenzhou, Rui’an, and Cangnan. Such units had a below-average level of expansion in both phases and grew relatively intensively in the last 20 years.

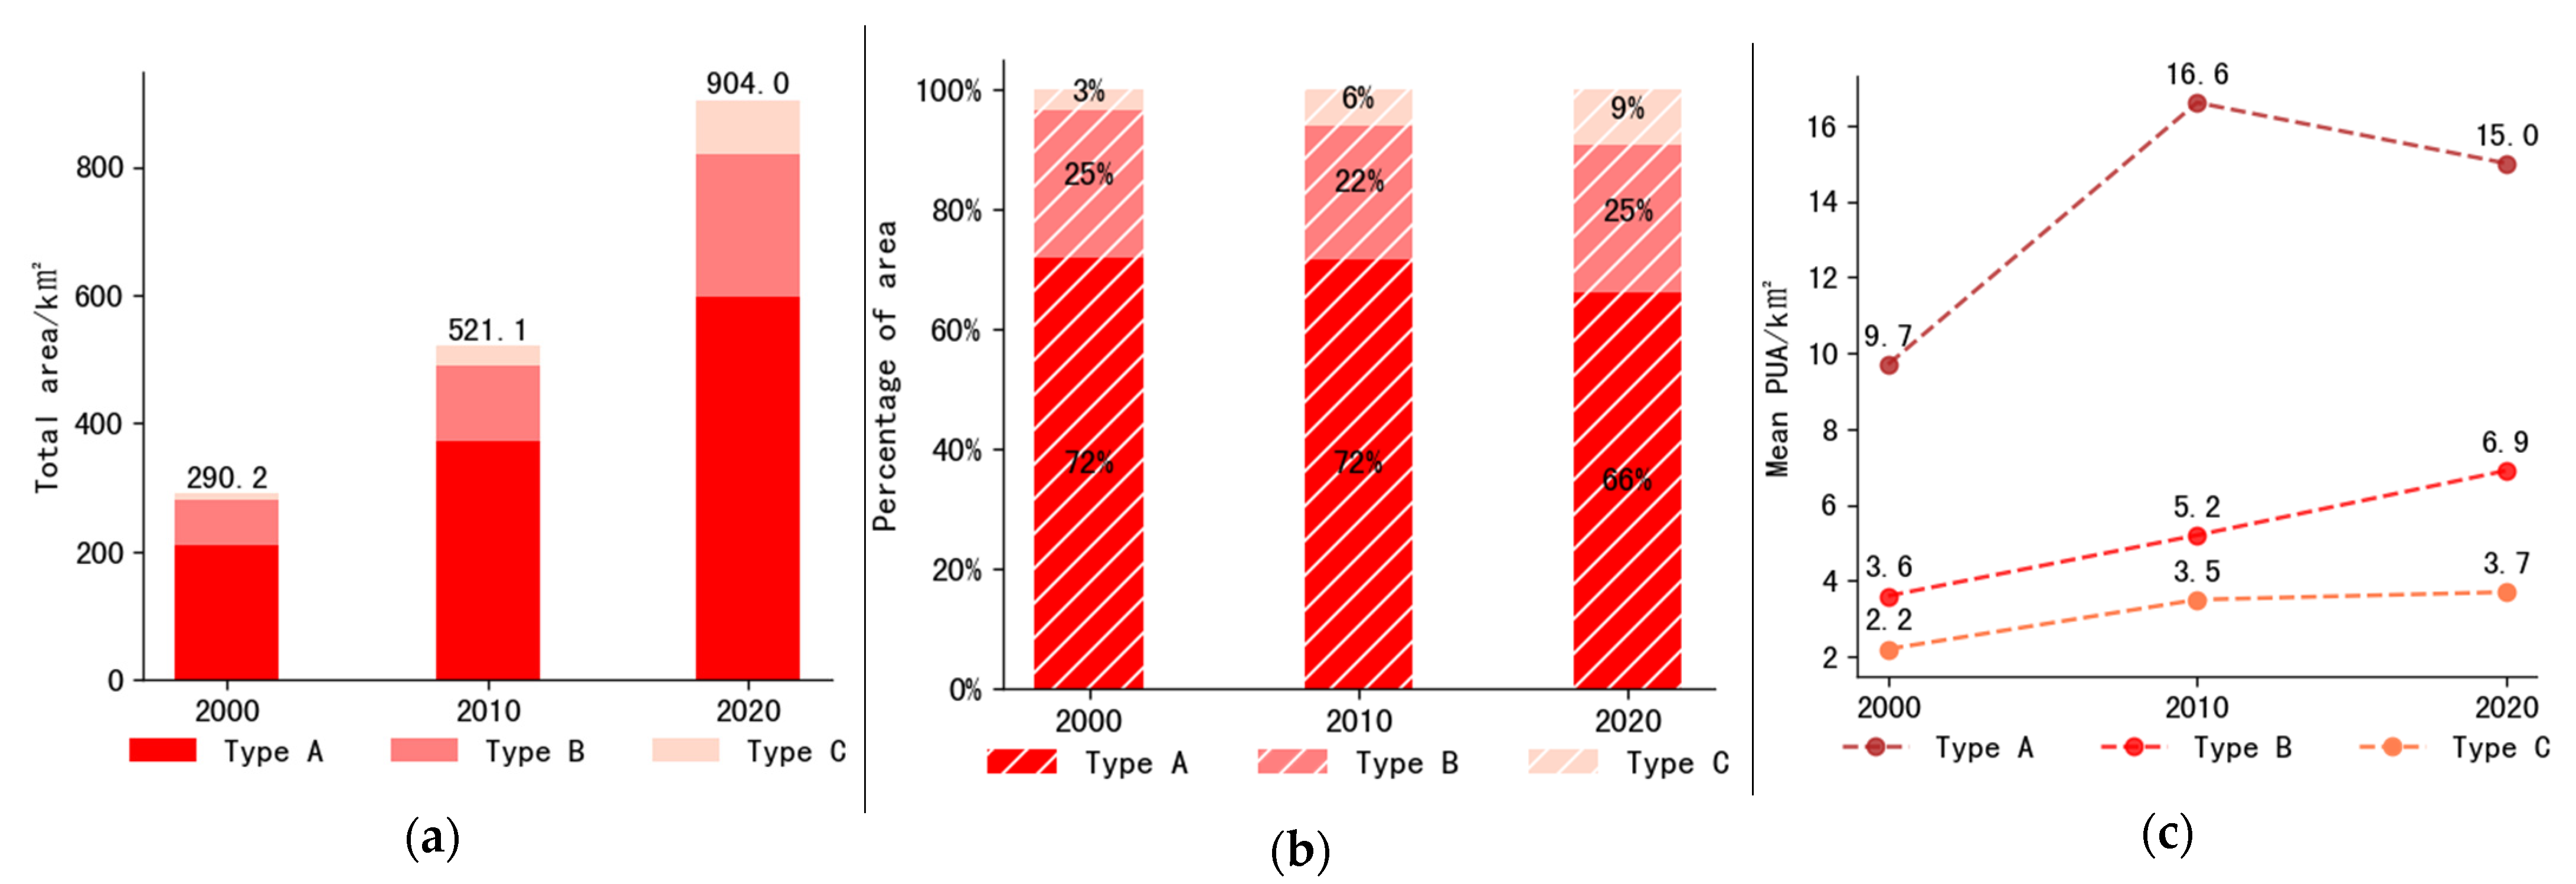
5.3. Expansion Rate of PUAs Examined by Different Administrative Type

Next, we examined the differences in the expansion patterns of different types of towns. Taking PUAs as the analysis object, we classified them into three categories according to their types of township units: Type A was subdistricts and Chengguan towns, receiving the most financial resources; Type B was small cities and central towns, obtaining an average amount of resources; Type C was ordinary townships with the least resources. Two cases required special treatment before analysis: (1) Due to the huge changes in the township system in the Wen-Tai region during the last two decades, certain townships merged or upgraded to subdistricts are hard to trace. Therefore, this study categorized PUAs according to the administrative divisions in 2020. (2) Some PUAs grow across administrative boundaries. For this reason, administrative boundaries were used to divide them into parts, and only the area and number of parts belonging to each type of PUAs were counted (thus, the number of PUAs may be fractional). Table 4 indicates that the number of PUAs across categories gradually increased, indirectly reflecting an integrated development of the system of cities in the Wen-Tai region.
Figure 10a,b displayed that the total area followed the order of Type A > Type B > Type C on three time slices, and a large discrepancy existed between areas of different types of township units. The area percentage of the three types of township units did not change obviously; the area percentage of Type A remained at about 70%, slightly decreasing in three years; the area percentage of Type B maintained at about 24%, showing a trend of first decrease and then increase; the area percentage of Type C was elevated, occupying 9% in 2020, exerting a marked influence. Figure 10c exhibits the change in the mean area of the three types of physical towns. The mean area of Type A was much larger than that of Type B and Type C, consistent with the resource input of the three types of cities. The mean area of Type A represented a significant enhancement during 2000–2010 but a slight decline during 2010–2020, which was found to be related to the emergence of numerous independent new zones in 2020 after examining the data. Within the administrative boundary of the subdistricts and Chengguan towns, new zones were developed away from the original urban core and not merged into a whole, thus pulling down the mean values.

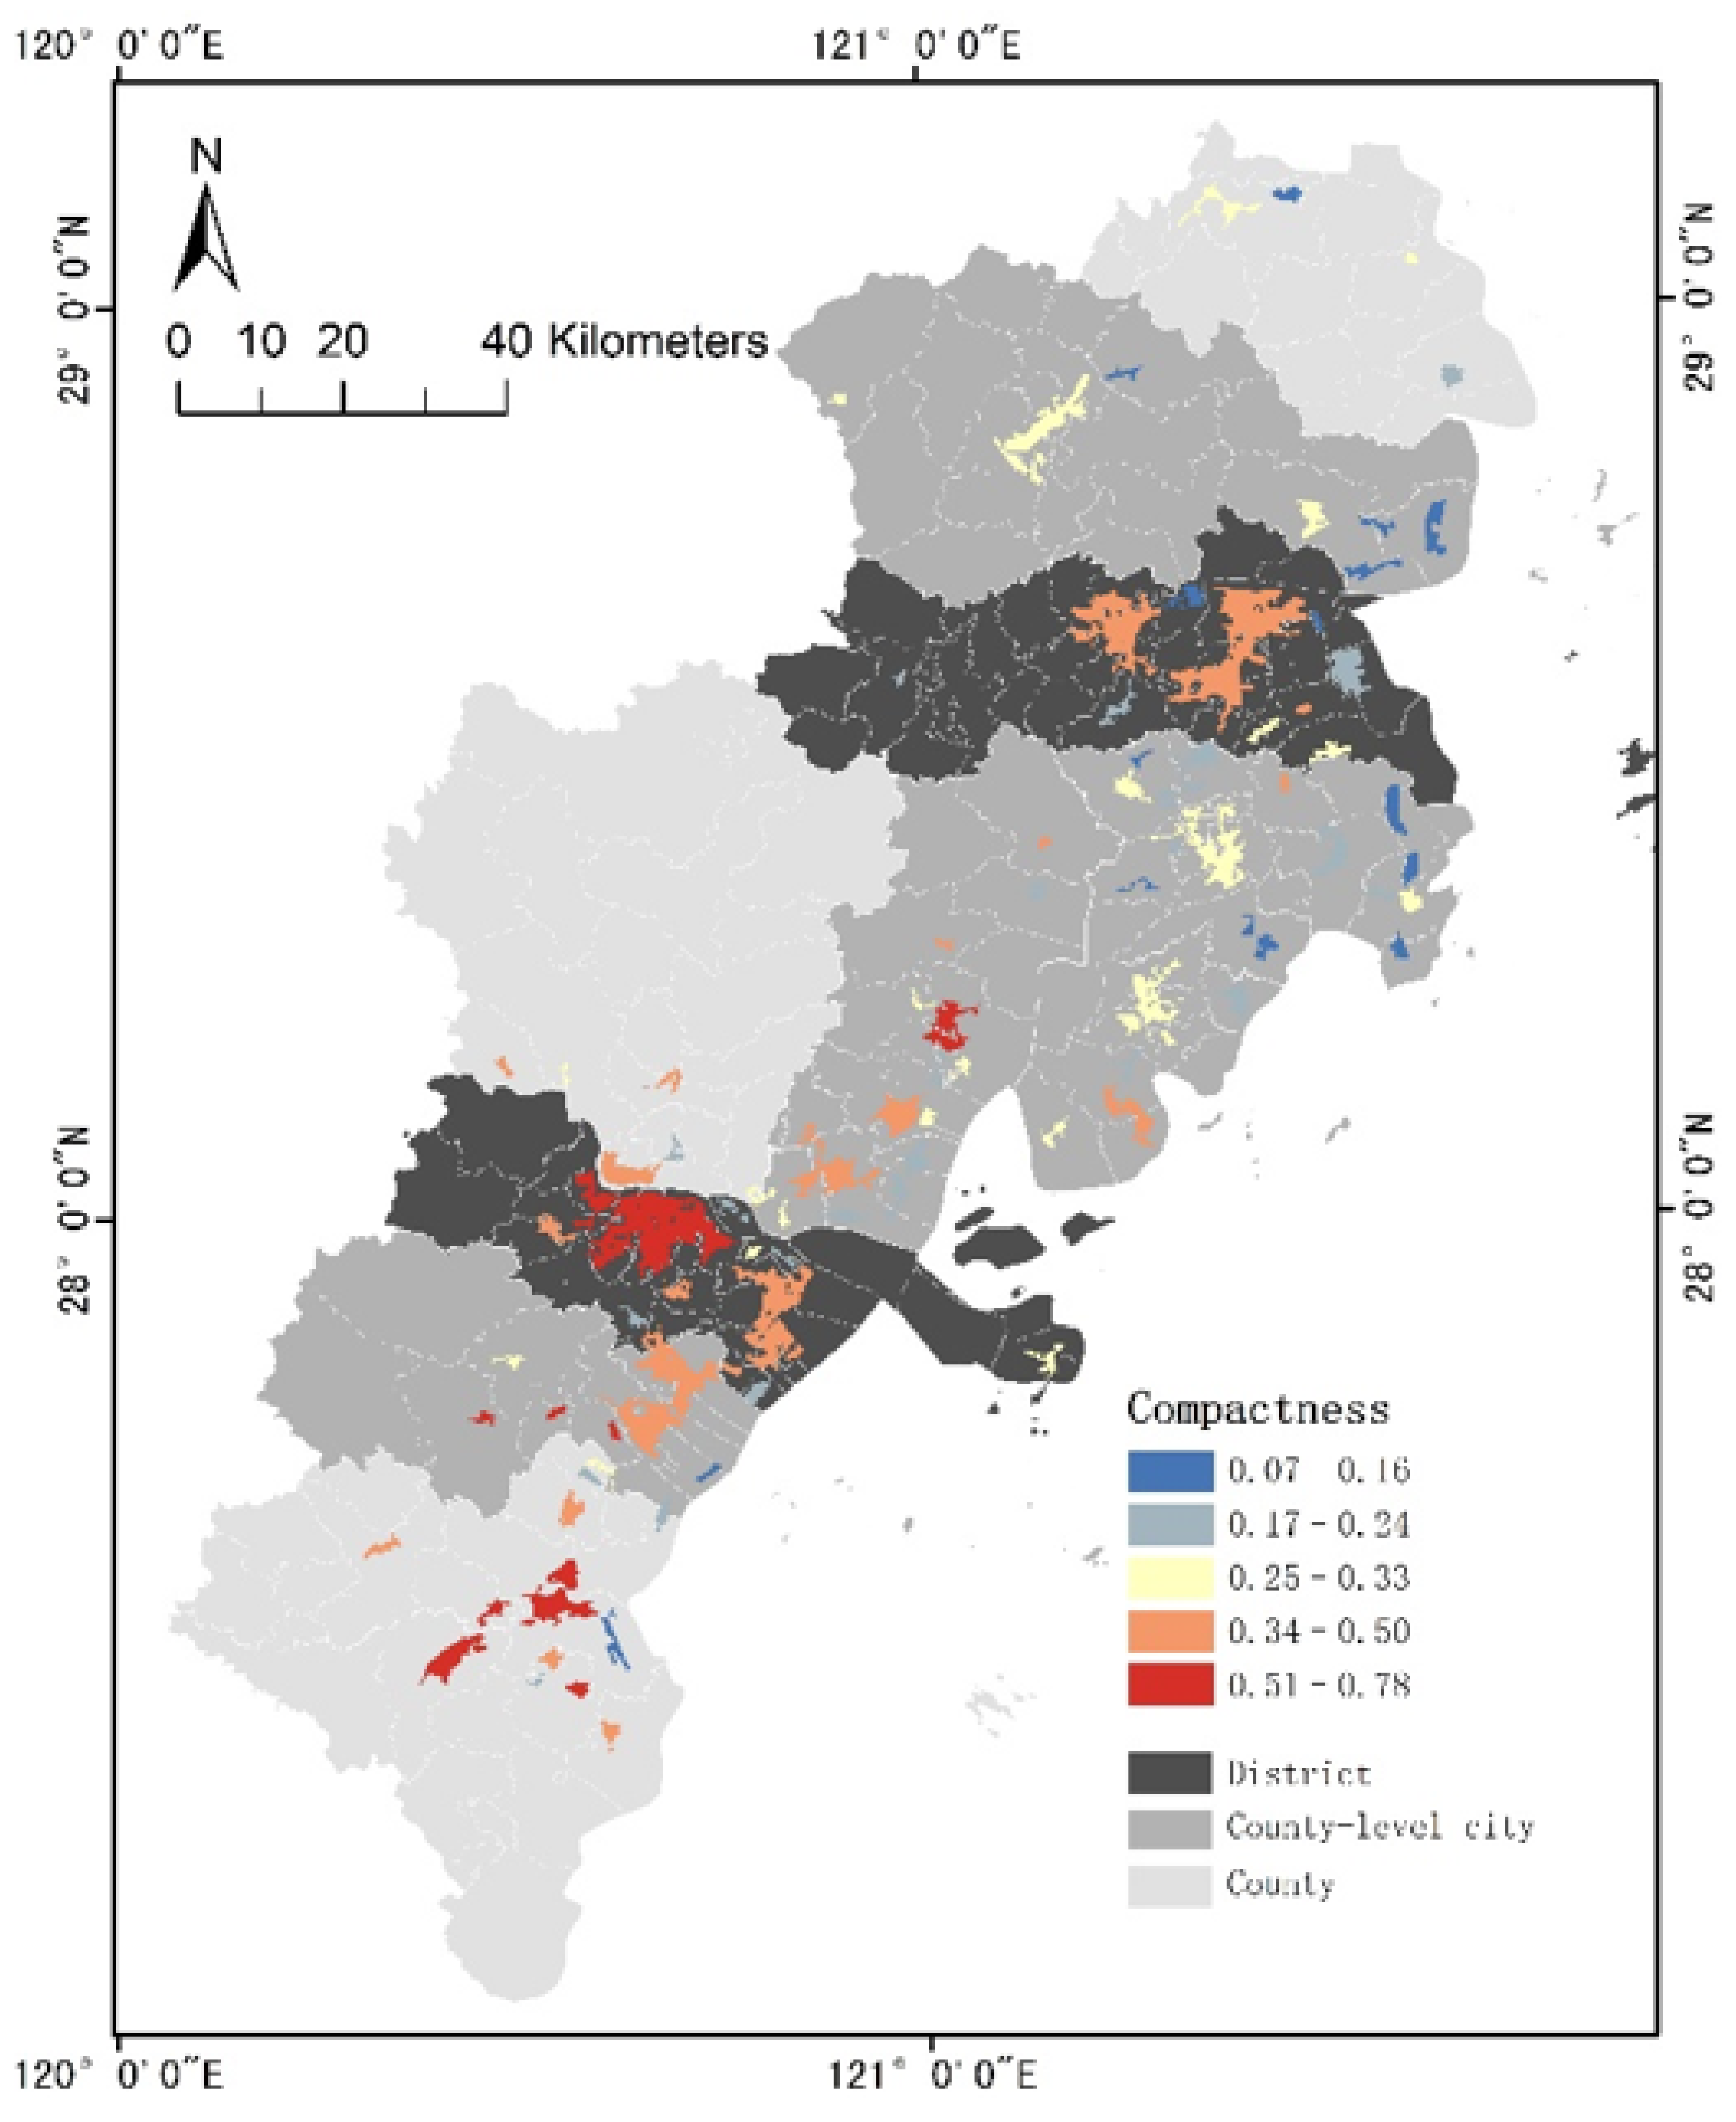
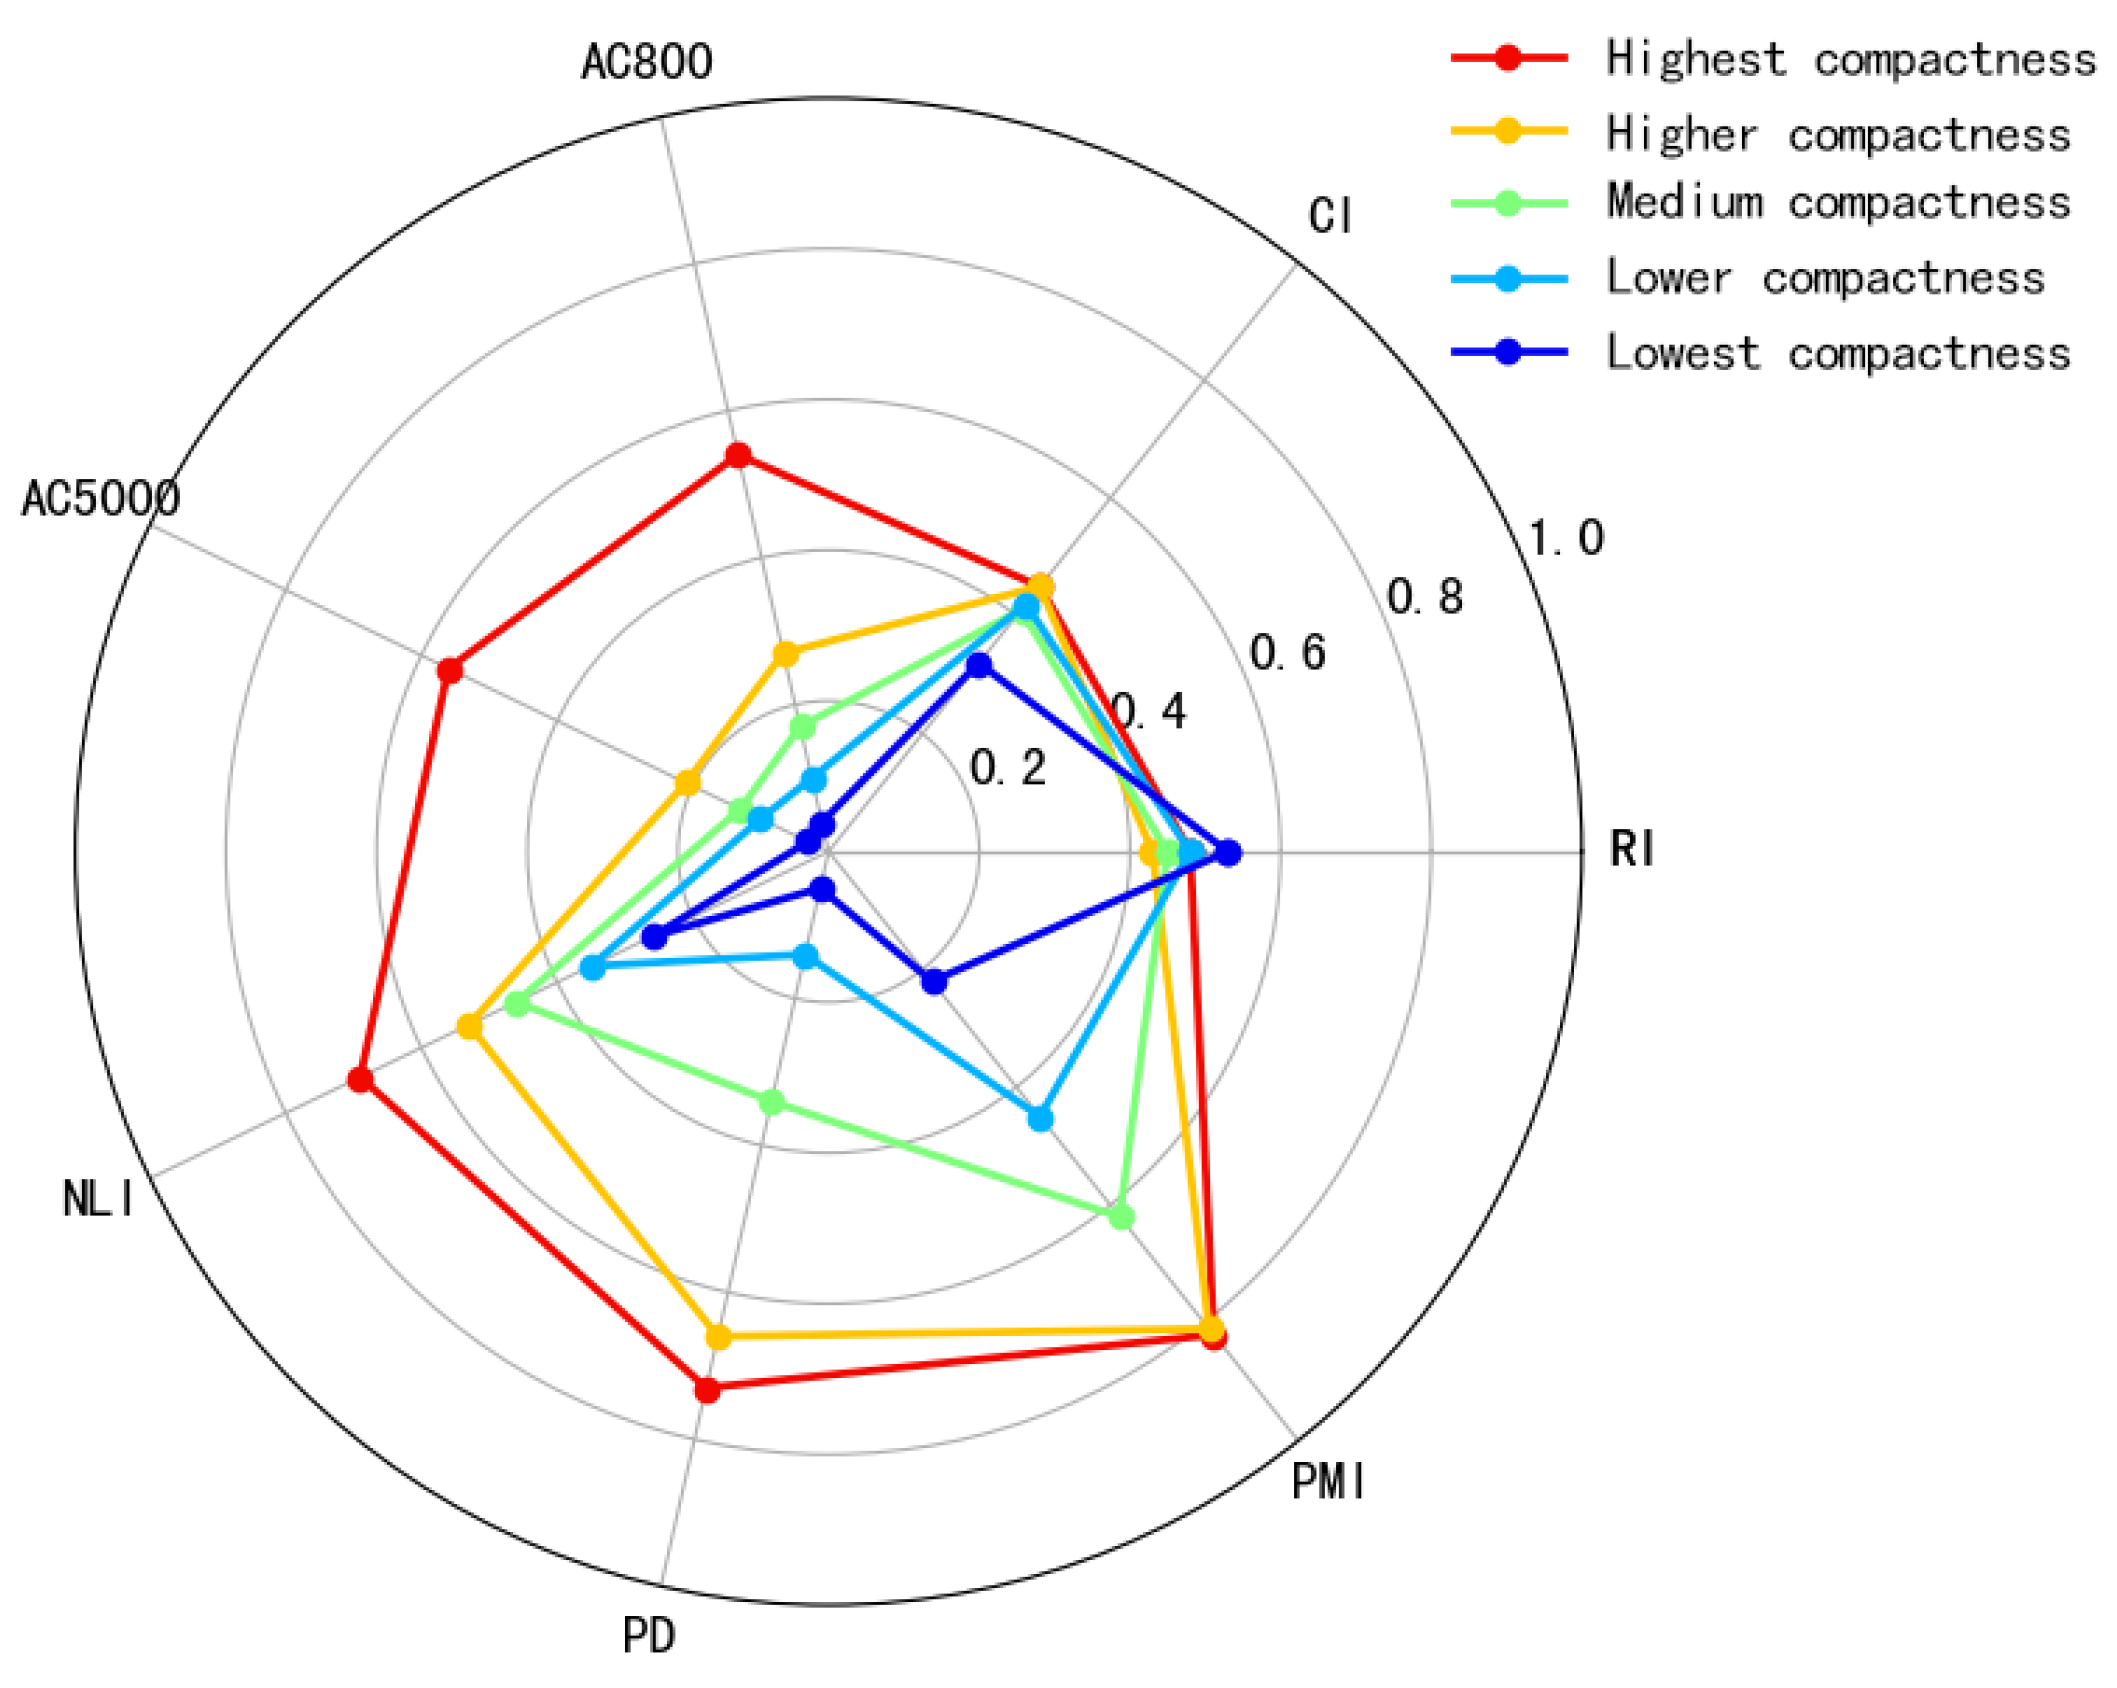
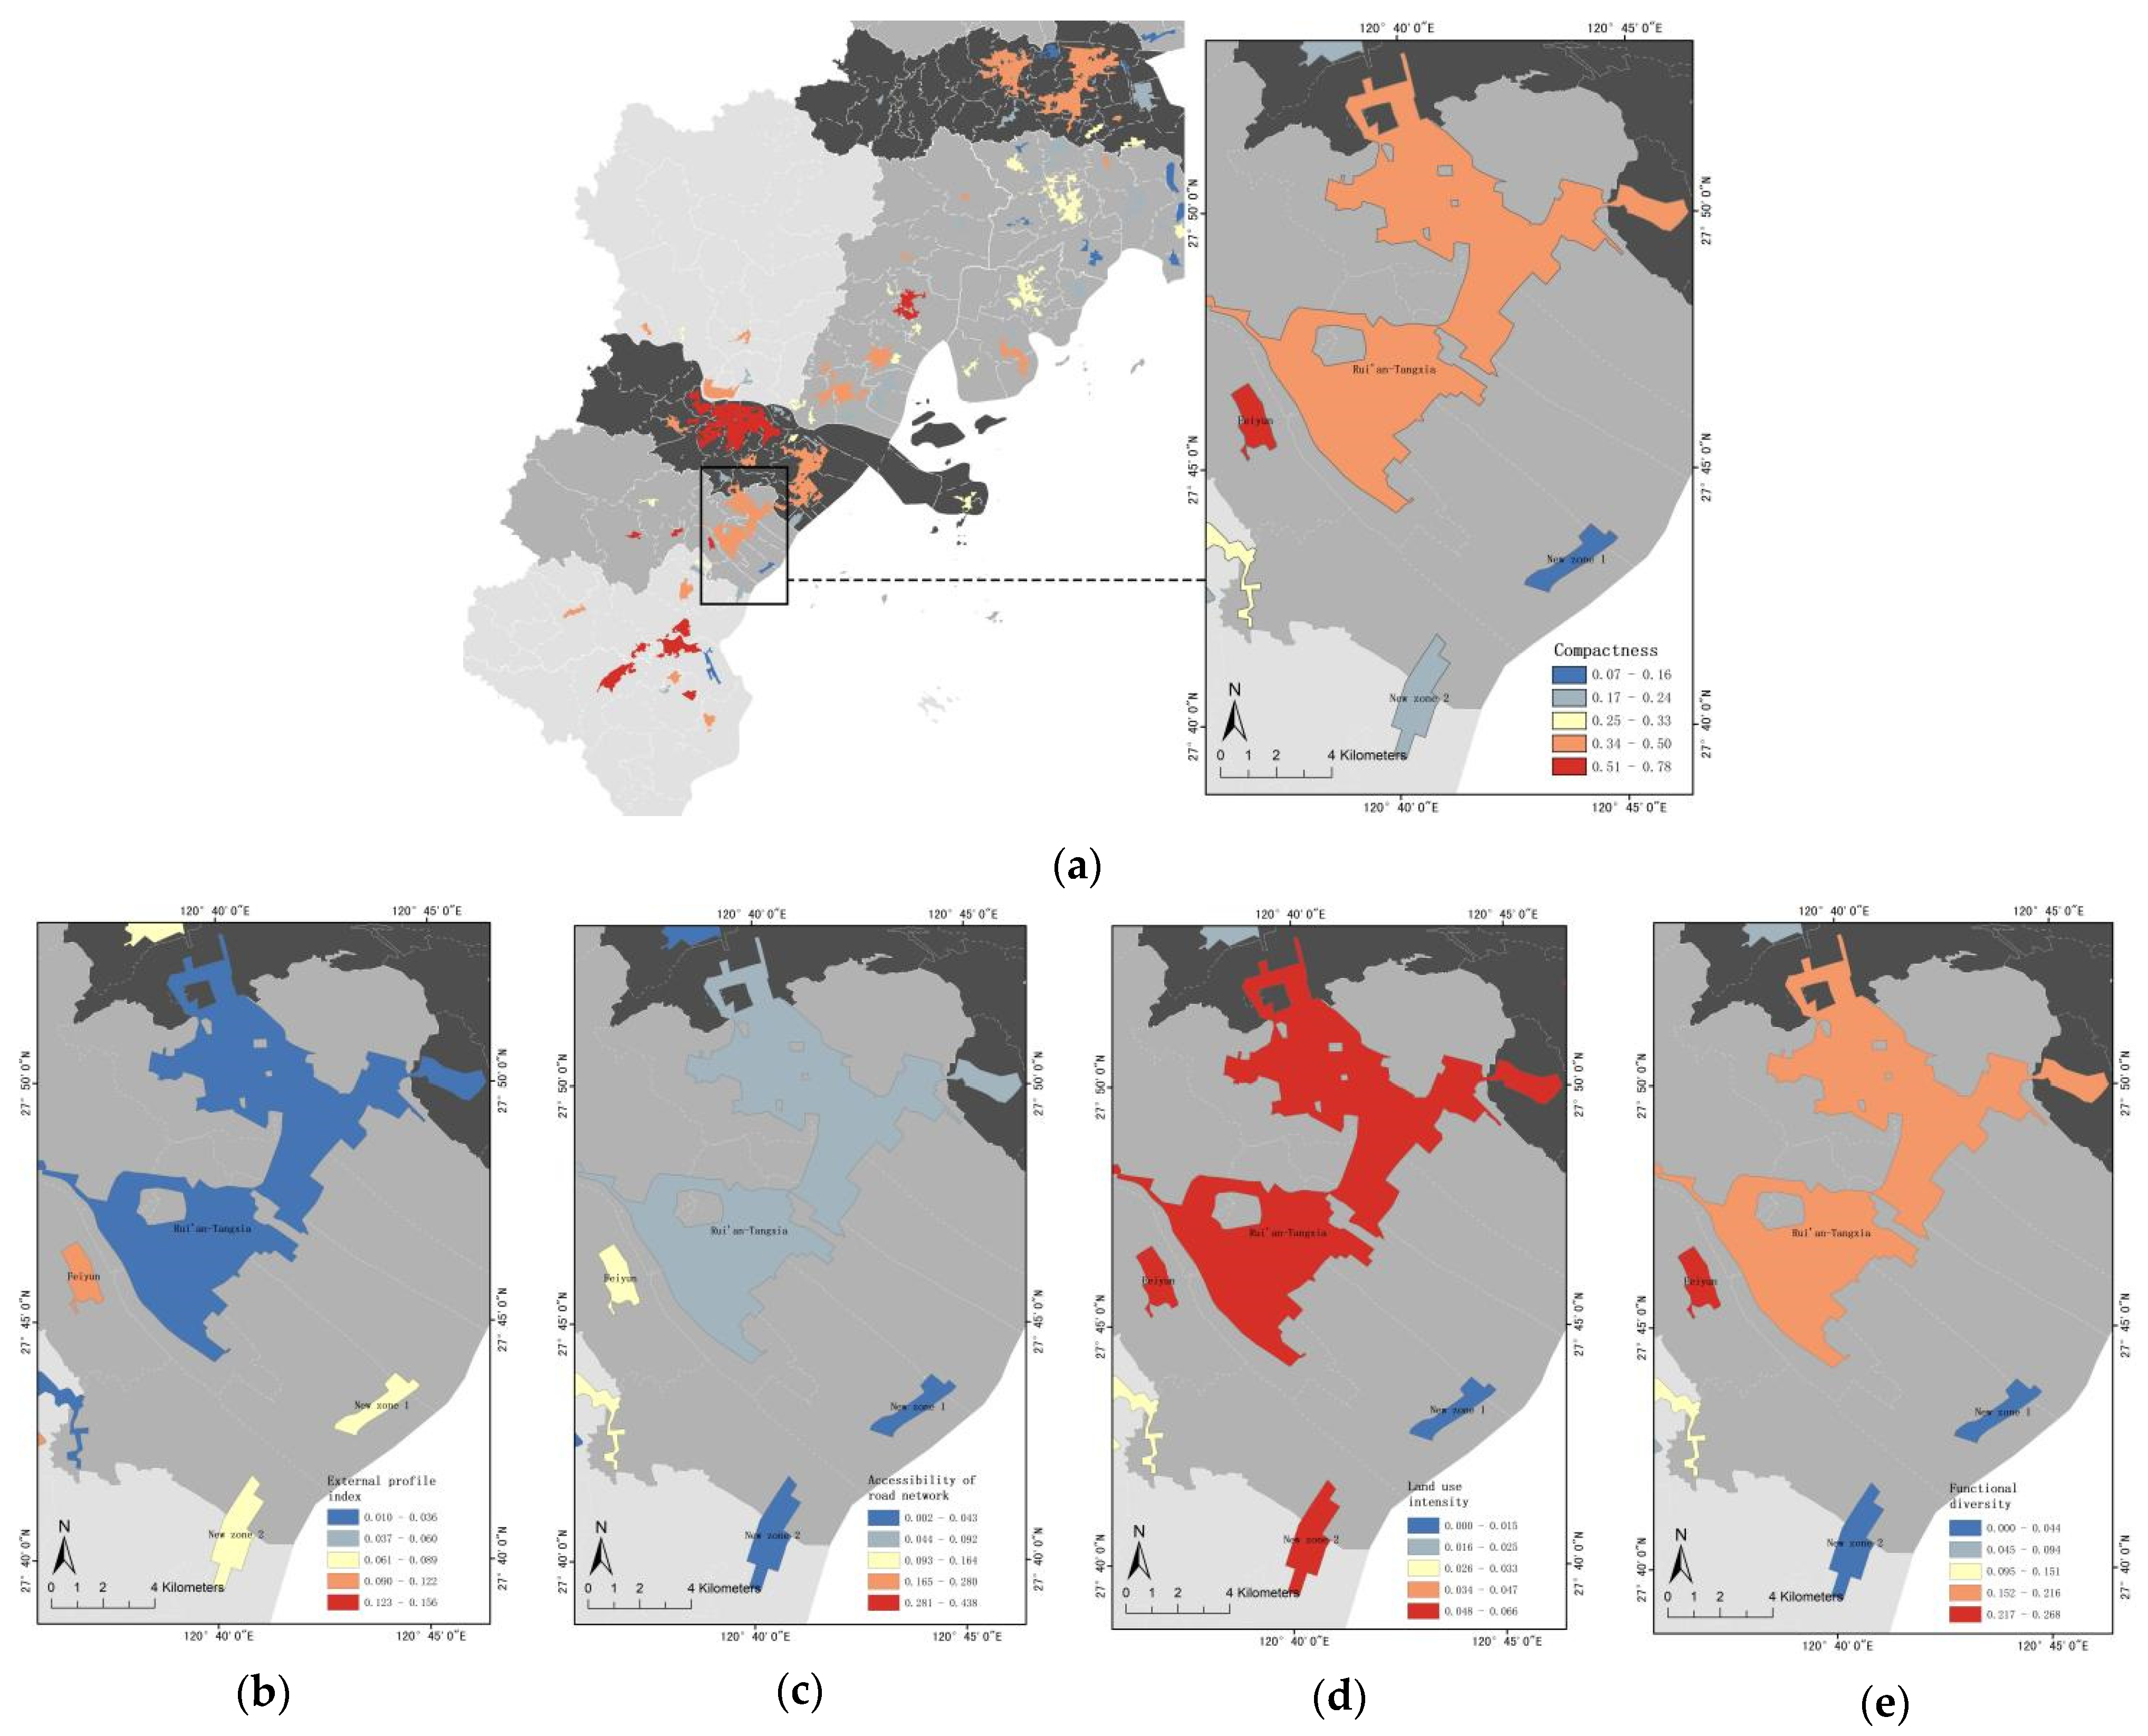
5.4. Measure the Compactness of System of Cities in Wen-Tai Region

This section investigates the 95 PUAs identified in 2020. EWM was used to construct a weight matrix (Table 5) to measure the compactness of urban areas. Urban compactness took values from 0.06 to 0.78, and a higher value indicated a more compact city development. Based on the natural breakpoint method, urban areas could be classified into five categories of highest compactness, higher compactness, medium compactness, lower compactness, and lowest compactness, with the numbers of 10, 20, 25, 24, and 16, respectively. Through ArcGIS 10.6, the compactness was assigned to PUAs, which were visually classified to obtain the spatial distribution of compactness in the system of cities of the Wen-Tai region in 2020 (Figure 11).
Figure 11 shows the marked geographical differences in the distribution of urban compactness. Specifically, PUAs with high compactness were concentrated in Wenzhou City, mostly found in long-established and relatively developed downtowns, central towns, and small cities. In contrast, PUAs with low compactness were mostly found in Taizhou City, mostly distributed in new coastal zones.
To deeply evaluate the compactness of the PUAs in the Wen-Tai region, we evaluated each of the five types of PUAs from seven compactness indicators, namely RI, CI, AC800, AC5000, NLI, PD, and PMI. The average values of each indicator for each type of urban area are shown in Table 6, according to which the corresponding radar chart can be drawn (Figure 12).
The seven compactness indicators generally tended to decrease with decreasing compactness, indirectly indicating a degree of linear correlation between indicators. Nevertheless, the variation degree varied among the indicators. The results (Figure 12) showed that among the five types of PUAs, the two indicators of shape contour compactness, i.e., RI and CI, did not differ much, and the RI of low-compact urban areas was the highest; in the two indicators of road network accessibility, i.e., AC800 and AC5000, the data showed an approximate power-law distribution; in the indicator of land use intensity, NLI, the data nearly showed an arithmetic sequence distribution; in the two indicators of functional diversity, i.e., PD and PMI, the values were found to differ little between cities of highest compactness and higher compactness.

6. Discussion

6.1. Discussion of the Results

“Sprawl” can represent both the state of a city at a given moment (i.e., the antonym of compactness) and a dynamic process over time [55], of which only one aspect was measured in many studies [4,26,45]. This study measures both aspects simultaneously to describe the complex urban sprawl in a comprehensive manner.
The expansion rate indicates that the Wen-Tai region has experienced a high-rate sprawl in the last 20 years, consistent with the findings of Zhonghao Zhang et al. (2017) [21]. Moreover, the sprawl pattern differs in 2000–2010 and in 2010–2020. In the first decade, Type A PUAs (subdistricts and Chengguan towns) are the main force of urban sprawl, serving as the center of spreading in all directions and occupying most development resources. In the second decade, Type A PUAs still contribute the most to the expansion area, mostly in the form of independent new coastal zones; Type B PUAs (small cities and central towns) emerge abundantly and grow rapidly, while ordinary townships also gradually emerge as a new force of urban sprawl. Comparing these two periods, obvious changes are found in urban development strategies, closely related to the Central Town Cultivation Program [23] introduced in 2007 and the Small City Fostering Plan [24] implemented in 2010 in Zhejiang. The two projects aim to optimize the spatial layout of urban and rural areas and relieve the development pressure of large- and medium-sized cities. Then the coordinated development of large, medium, and small cities is expected to be achieved, and the integrated development of urban and rural areas can be promoted. However, this has indirectly accelerated urban sprawl, causing irreversible damage to natural ecosystems, such as farmland and mudflats.
According to the radar plot of compactness indicators for the five sub-sets of PUAs, the differences among highly compact and lowly compact urban areas are not marked in morphological contours but in the internal functional structures, such as road network accessibility and functional diversity, which is highly consistent with the finding from the study of Wenze Yue et al. (2020) [55]. Additionally, many low-density urban areas mostly belong to new coastal zones far away from the urban centers and therefore far away from the public facilities in the urban cores, resulting in the lack of vitality in these areas. Moreover, the new coastal zones are not built according to the standard of “short blocks” [63], and most of them are gated industrial areas, which both lead to poor road network accessibility.

6.2. Policy Implication

Ineffective urban planning is often considered an important factor of urban sprawl in China. Therefore, it is crucial to control urban growth boundaries and develop scientific and reasonable planning strategies [64]. This study can provide relevant knowledge for the policy making of urban planning in the Wen-Tai region.
First, we continue to deepen the spatial accuracy of the boundary identification based on the research of Ying Long (2016) [11] and Shuang Ma et al. (2019) [20] and make the method applicable to the feature of larger towns. The generated full-region PUA visualization drawings and data can allow local government to monitor and assess the sprawl of larger towns more accurately, and to identify areas requiring extra intervention accordingly.
Next, our measurements directly correspond to the administrative units of townships and counties and focus on the PUA growth across administrative units. On this basis, the provincial government can further coordinate the management of administrative units and system of cities.
Again, our objective data can remind the government that the built-up area in the Wen-Tai region has expanded dramatically over the past 20 years. Some counties with an expansion rate larger than average should be monitored seriously.
Eventually, the compactness measurement consists of four dimensions: the compactness of external contour, the accessibility of road network, land-use intensity, and functional diversity, and their visualization can provide ideas for individual cities to analyze the causes of problems and further develop targeted optimization strategies. Figure 13 takes some PUAs in Rui’an City as examples to show the differences between indicators from the four dimensions. Specifically, for the Rui’an-Tangxia district, the overall compactness is higher, but the morphological contour index and road network accessibility are poor. There is still much room for improvement, such as completing the road network structure and filling in the vacant plots in the district. The Feiyun subdistrict is superior in all indicators and needs to maintain the advantage of high compactness. The two new zones have low road network accessibility and functional diversity; moreover, they are far from the urban core and not accessible to the city’s well-developed public service facilities, and thus their compactness interventions are most challenging.

6.3. Limitations and Future Research

This study extracted the PUBs and proposed a compact index in the Wen-Tai region, while three limitations are as follows. First, since the size of larger towns is much smaller than that of big cities and their urban growth patterns are varied, the identification of PUBs for a longitudinal study is extremely difficult. Although the boundary extraction method used in this study is scientific and reasonable, the actual cases tests show certain shrinking PUAs, which is due to the identification error of the GlobeLand30 datasets. Moreover, the OSM data are incomplete in some towns, resulting in a much smaller scale of the extracted boundaries than the actual size. Therefore, a manual calibration step is required during the identification [65]. Second, in the sprawl measurement, the lack of high-resolution historical population data leads to the fact that only the land expansion rate can be assessed. Finally, during the compactness measurement, nighttime light data are used to characterize land use intensity. However, due to the limitation of human activities and the protection of cultural heritage, nighttime light may not reflect the true intensity of human activities in some areas, possibly introducing bias to the study results [56].
In the future, we plan to expand the scope of our research to the entire Zhejiang Province and even China to deeply explore the influence of terrain and environmental factors such as mountainous, plains, and seashores on urban sprawl to explore the key factors of urban sprawl.

7. Conclusions

The Chinese government attaches great importance to the goal of “compact, intensive, efficient, and green development” and advocates “scientific planning of urban space” [66]. This paper develops a new PUB extraction method based on the research of Ying Long (2016) [11] and Shuang Ma et al. (2019) [20] using OSM vector road network data and GlobeLand30 remote sensing image data. Furthermore, multi-source data are used, and a cross-sectional comparison of the built-up area expansion rate and the compactness of different types of PUAs in the Wen-Tai region is calculated. The main research findings are as follows:
(1) The extraction of PUAs shows that with the threshold of 1.5 km2, there are 46, 54, and 95 PUAs, with areas of 290.3, 521.1, and 904.0 km2 in 2000, 2010, and 2020, respectively. The expansion rate varies widely with the types of towns, and the more financial support was provided, the higher the expansion rate.
(2) By comparing the administrative boundaries and the location of real physical cities, it is proved that across boundary growth become increasingly common over the past two decades, which suggests the current integrated system of cities development principle is appropriate.
(3) The sprawl pattern of 2000–2010 differs from that of 2010–2020. The urban expansion in first decade mainly focus on the municipal and county downtowns, while in the second decade, expansion of larger towns and new coastal zones become the new growth pillar. This shift of growth pattern is due to the top-down force of provincial government, i.e., the larger town cultivation policies.
(4) By the compactness index, we divided the PUAs in Wen-Tai region into five clusters according to the cross-sectional data set in 2020. Compared with high compact cities, low compact cities have obvious disadvantages in internal functional structures, such as road network accessibility and functional diversity, and little difference in morphological contours. In addition, the new coastal zones are less compact, partly due to its short opening years, which remains to be tested over time. In future development and construction, emphasis should be placed on brownfields regeneration and the efficient improvement of land use per unit instead of the expansion and new zone construction which threaten the Earth and the future well-being of humankind.

Author Contributions

Conceptualization, validation, supervision, funding acquisition, writing—review and editing, X.D.; resources, methodology, software, data collection, visualization, writing—original draft preparation, project administration, J.J.; supervision, Q.C.; visualization, X.F.; All authors have read and agreed to the published version of the manuscript.

Funding

This research was funded by National Natural Science Foundation of China (No. 51878612).

Institutional Review Board Statement

Not applicable.

Informed Consent Statement

Not applicable.

Data Availability Statement

The data presented in this study are available on request from the corresponding author.

Acknowledgments

The author gratefully acknowledges the editors and referees for their positive and constructive comments in the review process.

Conflicts of Interest

The authors declare no conflict of interest.

Note

1
Taishun County, Wencheng County, Tiantai County and Xianju County are not included in the Wen-Tai system of cities in the 2011–2020 Urban System Planning of Zhejiang Province because they are far from the sea.

References

  1. Yu, B. Ecological effects of new-type urbanization in China. Renew. Sustain. Energy Rev. 2021, 135, 110239. [Google Scholar] [CrossRef]
  2. Li, G.; Li, F. Urban sprawl in China: Differences and socioeconomic drivers. Sci. Total Environ. 2019, 673, 367–377. [Google Scholar] [CrossRef]
  3. Ewing, R.H. Characteristics, Causes, and Effects of Sprawl: A Literature Review. In Urban Ecology: An International Perspective on the Interaction between Humans and Nature; Marzluff, J.M., Shulenberger, E., Endlicher, W., Alberti, M., Bradley, G., Ryan, C., Simon, U., ZumBrunnen, C., Eds.; Springer: Boston, MA, USA, 2008; pp. 519–535. [Google Scholar] [CrossRef]
  4. Yue, W.; Zhang, L.; Liu, Y. Measuring sprawl in large Chinese cities along the Yangtze River via combined single and multidimensional metrics. Habitat Int. 2016, 57, 43–52. [Google Scholar] [CrossRef]
  5. United Nations. World Urbanization Prospects, the 2011 Revision. 2012. Available online: http://esa.un.org/unpd/wup/index.htm (accessed on 16 June 2013).
  6. Jiao, L. Urban land density function: A new method to characterize urban expansion. Landsc. Urban Plan. 2015, 139, 26–39. [Google Scholar] [CrossRef]
  7. Deng, H.; Zhang, K.; Wang, F.; Dang, A. Compact or disperse? Evolution patterns and coupling of urban land expansion and population distribution evolution of major cities in China, 1998–2018. Habitat Int. 2021, 108, 102324. [Google Scholar] [CrossRef]
  8. Deng, X.; Huang, J.; Rozelle, S.; Zhang, J.; Li, Z. Impact of urbanization on cultivated land changes in China. Land Use Policy 2015, 45, 1–7. [Google Scholar] [CrossRef]
  9. Steurer, M.; Bayr, C. Measuring urban sprawl using land use data. Land Use Policy 2020, 97, 104799. [Google Scholar] [CrossRef]
  10. Ma, L.J.C. Urban administrative restructuring, changing scale relations and local economic development in China. Polit. Geogr. 2005, 24, 477–497. [Google Scholar] [CrossRef]
  11. Long, Y. Redefining Chinese city system with emerging new data. Appl. Geogr. 2016, 75, 36–48. [Google Scholar] [CrossRef]
  12. Yue, W.; Liu, Y.; Fan, P. Measuring urban sprawl and its drivers in large Chinese cities: The case of Hangzhou. Land Use Policy 2013, 31, 358–370. [Google Scholar] [CrossRef]
  13. Tian, L.; Li, Y.; Yan, Y.; Wang, B. Measuring urban sprawl and exploring the role planning plays: A shanghai case study. Land Use Policy 2017, 67, 426–435. [Google Scholar] [CrossRef]
  14. Li, Y.; Xiong, W.; Wang, X. Does polycentric and compact development alleviate urban traffic congestion? A case study of 98 Chinese cities. Cities 2019, 88, 100–111. [Google Scholar] [CrossRef]
  15. Huang, Y.; Dong, B.; Shen, J.; Zhuo, Z.; Wang, C. A Practical Path to Incorporating Large Towns to Municipalities: A Case Study in the Province of Zhejiang. Urban Dev. Stud. 2016, 23, 8–13. [Google Scholar]
  16. Zhao, P.; Lyu, D. Characteristics of land use structure in small towns of China: Empirical evidences from 121 townships. Acta Geogr. Sin. 2019, 74, 1011–1024. [Google Scholar]
  17. Lai, L.W.C.; Davies, S.N.G. Is non-zoning of land impossible? Eight fundamental propositions of zoning. J. Environ. Policy Plan. 2022, 1–16. [Google Scholar] [CrossRef]
  18. Niu, W.; Nie, T.; Chen, X.; Wang, T.; Shi, J.; Xu, Z.; Zhang, H. Understanding the Corrective Effect of the Urban Growth Boundary Policy on Land Finance Dependence of Local Governments in China. Int. J. Environ. Res. Public Health 2022, 19, 4785. [Google Scholar] [CrossRef]
  19. He, Q.; Tan, R.; Gao, Y.; Zhang, M.; Xie, P.; Liu, Y. Modeling urban growth boundary based on the evaluation of the extension potential: A case study of Wuhan city in China. Habitat Int. 2018, 72, 57–65. [Google Scholar] [CrossRef]
  20. Ma, S.; Long, Y. Identifying spatial cities in China at the community scale. J. Urban Reg. Plan 2019, 11, 37–50. [Google Scholar]
  21. Zhang, Z.; Xiao, R.; Yu, W.; Liu, Y.; Lin, M.; Wang, M. Characterizing Factors Associated with Built-Up Land Expansion in Urban and Non-Urban Areas from a Morphological Perspective. Sustainability 2017, 9, 1411. [Google Scholar] [CrossRef]
  22. Information Service Platform for Standardization of Natural Resources. Code of Practice for Standard Urban Built-Up Area Delineation. Available online: http://www.nrsis.org.cn/portal/stdDetail/240174 (accessed on 20 August 2022).
  23. The People’s Government of Zhejiang Province. The Central Town Cultivation Program. Available online: https://www.zj.gov.cn/art/2007/4/10/art_1229591319_64120.html (accessed on 20 August 2022).
  24. The People’s Government of Zhejiang Province. Small City Fostering Plan. Available online: https://www.zj.gov.cn/art/2012/7/14/art_1229019365_63266.html (accessed on 20 August 2022).
  25. China Economic Herald. China Township Comprehensive Competitiveness Report 2020. Available online: http://www.chinadevelopment.com.cn/news/zj/2021/09/1742706.shtml (accessed on 20 August 2022).
  26. Hu, S.; Tong, L.; Frazier, A.E.; Liu, Y. Urban boundary extraction and sprawl analysis using Landsat images: A case study in Wuhan, China. Habitat Int. 2015, 47, 183–195. [Google Scholar] [CrossRef]
  27. Peng, J.; Hu, Y.n.; Liu, Y.; Ma, J.; Zhao, S. A new approach for urban-rural fringe identification: Integrating impervious surface area and spatial continuous wavelet transform. Landsc. Urban Plan. 2018, 175, 72–79. [Google Scholar] [CrossRef]
  28. Chen, J.; Fan, W.; Li, K.; Liu, X.; Song, M. Fitting Chinese cities’ population distributions using remote sensing satellite data. Ecol. Indic. 2019, 98, 327–333. [Google Scholar] [CrossRef]
  29. Liu, X.; Ning, X.; Wang, H.; Wang, C.; Zhang, H.; Meng, J. A Rapid and Automated Urban Boundary Extraction Method Based on Nighttime Light Data in China. Remote Sens. 2019, 11, 1126. [Google Scholar] [CrossRef]
  30. Yang, Y.; Ma, M.; Tan, C.; Li, W. Spatial Recognition of the Urban-Rural Fringe of Beijing Using DMSP/OLS Nighttime Light Data. Remote Sens. 2017, 9, 1141. [Google Scholar] [CrossRef]
  31. Small, C.; Lu, J.W.T. Estimation and vicarious validation of urban vegetation abundance by spectral mixture analysis. Remote Sens. Environ. 2006, 100, 441–456. [Google Scholar] [CrossRef]
  32. Jayasinghe, A.; Kalpana, L.D.C.H.N.; Abenayake, C.C.; Mahanama, P.K.S. Urban Boundary Demarcation—An iCN Model Approach. Soc. Sci. 2021, 10, 448. [Google Scholar] [CrossRef]
  33. Liu, T.; Yang, X. Monitoring land changes in an urban area using satellite imagery, GIS and landscape metrics. Appl. Geogr. 2015, 56, 42–54. [Google Scholar] [CrossRef]
  34. Yu, B.; Shu, S.; Liu, H.; Song, W.; Wu, J.; Wang, L.; Chen, Z. Object-based spatial cluster analysis of urban landscape pattern using nighttime light satellite images: A case study of China. Int. J. Geogr. Inf. Sci. 2014, 28, 2328–2355. [Google Scholar] [CrossRef]
  35. Huang, X.; Schneider, A.; Friedl, M.A. Mapping sub-pixel urban expansion in China using MODIS and DMSP/OLS nighttime lights. Remote Sens. Environ. 2016, 175, 92–108. [Google Scholar] [CrossRef]
  36. Lau, B.P.L.; Marakkalage, S.H.; Zhou, Y.; Hassan, N.U.; Yuen, C.; Zhang, M.; Tan, U.X. A survey of data fusion in smart city applications. Inf. Fusion 2019, 52, 357–374. [Google Scholar] [CrossRef]
  37. Xue, X.; Yu, Z.; Zhu, S.; Zheng, Q.; Weston, M.; Wang, K.; Gan, M.; Xu, H. Delineating Urban Boundaries Using Landsat 8 Multispectral Data and VIIRS Nighttime Light Data. Remote Sens. 2018, 10, 799. [Google Scholar] [CrossRef]
  38. Song, Y.; Long, Y.; Wu, P.; Wang, X. Are all cities with similar urban form or not? Redefining cities with ubiquitous points of interest and evaluating them with indicators at city and block levels in China. Int. J. Geogr. Inf. Sci. 2018, 32, 2447–2476. [Google Scholar] [CrossRef]
  39. Richardson, H.W. The Economics of Urban Size; Saxon House: Lexington, KY, USA, 1973. [Google Scholar]
  40. Cole, J.P. Study of major and minor civil divisions in political geography. In Proceedings of the 20th International Geographical Congress, London, UK, 20–28 July 1964. [Google Scholar]
  41. Gibbs, J.P. Urban Research Methods; Van Nostrand: Princeton, NJ, USA, 1961. [Google Scholar]
  42. Galster, G.; Hanson, R.; Ratcliffe, M.R.; Wolman, H.; Coleman, S.; Freihage, J. Wrestling Sprawl to the Ground: Defining and measuring an elusive concept. Hous. Policy Debate 2001, 12, 681–717. [Google Scholar] [CrossRef]
  43. Tsai, Y.-H. Quantifying Urban Form: Compactness versus ‘Sprawl’. Urban Stud. 2016, 42, 141–161. [Google Scholar] [CrossRef]
  44. Siedentop, S.; Fina, S. Monitoring urban sprawl in Germany: Towards a GIS-based measurement and assessment approach. J. Land Use Sci. 2010, 5, 73–104. [Google Scholar] [CrossRef]
  45. Hamidi, S.; Ewing, R. A longitudinal study of changes in urban sprawl between 2000 and 2010 in the United States. Landsc. Urban Plan. 2014, 128, 72–82. [Google Scholar] [CrossRef]
  46. Jia, M.; Zhang, H.; Yang, Z. Compactness or sprawl: Multi-dimensional approach to understanding the urban growth patterns in Beijing-Tianjin-Hebei region, China. Ecol. Indic. 2022, 138, 108816. [Google Scholar] [CrossRef]
  47. Qi, W.; Fang, C.; Song, J. Measurement and spatial distribution of urban agglomeration industrial compactness in China. Chin. Geogr. Sci. 2008, 18, 291–299. [Google Scholar] [CrossRef]
  48. Tan, F.; Lu, Z. The impact of urban compactness on urban sustainable development in China: The case of Nanjing. Sustain. Dev. 2018, 27, 270–280. [Google Scholar] [CrossRef]
  49. Newman, P.W.G.; Kenworthy, J.R. Gasoline Consumption and Cities. J. Am. Plan. Assoc. 1989, 55, 24–37. [Google Scholar] [CrossRef]
  50. Gordon, P.; Richardson, H.W. Are Compact Cities a Desirable Planning Goal? J. Am. Plan. Assoc. 1997, 63, 95–106. [Google Scholar] [CrossRef]
  51. Jabareen, Y.R. Sustainable Urban Forms. J. Plan. Educ. Res. 2016, 26, 38–52. [Google Scholar] [CrossRef]
  52. Ewing, R.; Hamidi, S. Compactness versus Sprawl. J. Plan. Lit. 2015, 30, 413–432. [Google Scholar] [CrossRef]
  53. van Nes, A. Spatial Configurations and Walkability Potentials. Measuring Urban Compactness with Space Syntax. Sustainability 2021, 13, 5785. [Google Scholar] [CrossRef]
  54. Wang, Y.; Liu, Y.; Zhou, G.; Ma, Z.; Sun, H.; Fu, H. Coordinated Relationship between Compactness and Land-Use Efficiency in Shrinking Cities: A Case Study of Northeast China. Land 2022, 11, 366. [Google Scholar] [CrossRef]
  55. Yue, W.; Wu, T.; Liu, X. Developing an urban sprawl index for China’s mega-cities. Acta Geogr. Sin. 2020, 75, 2730–2743. [Google Scholar]
  56. Lan, T.; Shao, G.; Xu, Z.; Tang, L.; Sun, L. Measuring urban compactness based on functional characterization and human activity intensity by integrating multiple geospatial data sources. Ecol. Indic. 2021, 121, 107177. [Google Scholar] [CrossRef]
  57. Xia, C.; Yeh, A.G.-O.; Zhang, A. Analyzing spatial relationships between urban land use intensity and urban vitality at street block level: A case study of five Chinese megacities. Landsc. Urban Plan. 2020, 193, 103669. [Google Scholar] [CrossRef]
  58. Arsanjani, J.J.; Tayyebi, A.; Vaz, E. GlobeLand30 as an alternative fine-scale global land cover map: Challenges, possibilities, and implications for developing countries. Habitat Int. 2016, 55, 25–31. [Google Scholar] [CrossRef]
  59. Hong, Y.; Yao, Y. Hierarchical community detection and functional area identification with OSM roads and complex graph theory. Int. J. Geogr. Inf. Sci. 2019, 33, 1569–1587. [Google Scholar] [CrossRef]
  60. Natural Resources and Planning Bureau of Yueqing City. Yueqing Municipal Master Plan (2013–2030). Available online: http://www.yueqing.gov.cn/art/2020/10/30/art_1322027_59198023.html (accessed on 20 August 2022).
  61. Cooper, C.H.V.; Chiaradia, A.J.F. sDNA: 3-d spatial network analysis for GIS, CAD, Command Line & Python. SoftwareX 2020, 12, 100525. [Google Scholar] [CrossRef]
  62. Zhejiang Urban and Rural Planning Design Institute. The 2011–2020 Urban System Planning of Zhejiang Province. Available online: https://www.zjplan.com/product/48.html (accessed on 20 August 2022).
  63. Jacobs, J. The Death and Life of Great American Cities (New York: Random). In Versión Castellana (1967) Muerte y Vida de las Grandes Ciudades; Península: Madrid, Spain, 1961. [Google Scholar]
  64. Zhang, X.; Pan, J. Spatiotemporal Pattern and Driving Factors of Urban Sprawl in China. Land 2021, 10, 1275. [Google Scholar] [CrossRef]
  65. Guan, C.; Wang, Y.; Keith, M.; Li, Y.; Cao, G. Does local planning of fast-growing medium-sized towns lead to higher urban intensity or to sprawl? Cases from Zhejiang Province. Cities 2022, 130, 103869. [Google Scholar] [CrossRef]
  66. Xi, J. Central Urban Work Conference. 2015. Available online: http://www.xinhuanet.com//politics/2015-12/22/c_1117545528.htm (accessed on 20 August 2022).
Figure 1. Different levels of the Wen-Tai region: (a) prefecture, (b) county, and (c) town.
Land 11 01637 g001
Figure 2. Data presentation: (a) Artificial surface of Globeland30 in 2020; (b) OSM road network of 2022; (c) NPP/VIIRS nighttime light data of 2020; (d) POIs of AMAP in 2020.
Land 11 01637 g002
Figure 3. Flow chart of PUB extraction.
Land 11 01637 g003
Figure 4. Some ordinary towns reach the size of larger town: (a) Furong town, (b) Pengjie town, and (c) Yishan town.
Land 11 01637 g004
Figure 5. Examples of compactness calculation for external contour: (af) are abstract examples with different areas and perimeters.
Land 11 01637 g005
Figure 6. Examples of accessibility calculation for road network. (a) Betweenness value within radius 800 m. (b) Betweenness value within radius 5000 m. (c) Mean betweenness value weighted by length within radius 800 m. (d) Mean betweenness value weighted by length within radius 5000 m.
Land 11 01637 g006
Figure 7. Examples of PMI calculation: (a) An example of town with POI data; (b) 100 m × 100 m grids and SI of each grid; (c) PMI of the example.
Land 11 01637 g007
Figure 8. The PUAs of Wen-Tai in (a) 2000, (b) 2010, (c) 2020, and (d) three stages overlay.
Land 11 01637 g008
Figure 9. Visualization of Table 3: (a) Total area of 2000 area, 2010 new area and 2020 new area; (b) Area percentage of 2000’s area, new areas for 2010’s and 2020’s; (c) Expansion rate based on 2000’s area; (d) Expansion rate of 2000–2010 and 2010–2020.
Land 11 01637 g009
Figure 10. Visualization of Table 2: (a) Total area of three types in 2000, 2010, and 2020; (b) Area percentage of three types in 2000, 2010, and 2020; (c) Mean area of three types in 2000, 2010, and 2020.
Land 11 01637 g010
Figure 11. Spatial distribution of PUAs compactness.
Land 11 01637 g011
Figure 12. Radar plot of Table 6.
Land 11 01637 g012
Figure 13. Differences of compact dimensions among PUAs in Rui’an: (a) Location and compactness; (b) External profile index; (c) Accessibility of road network; (d) Land use intensity; (e) Functional diversity.
Land 11 01637 g013
Table 1. Comparison of different PUB extraction methods.
PublicationDataMethodBoundary (Liubai District)Annotation
Ying Long (2016) [11] Vector networkA city is defined as “a spatial cluster with a minimum of 100 road/street junctions within a 300 m distance threshold.” Land 11 01637 i001The boundary is calculated using OSM road networks in this study
Shuang Ma et al. (2019) [20] Community boundary and remote sensing dataThe ArcGIS platform overlays urban built-up land with community boundaries to determine the proportion of urban built-up land within each community. Communities exceeding 40% are candidates for urban physical territories, and physical territories that are contiguous and exceed 10 km2 are PUAs. Land 11 01637 i002Available at https://www.beijingcitylab.com/data-released-1/data21–40/
This paperVector network and remote sensing data/ Land 11 01637 i003/
Table 2. Statistical description of the Wen-Tai region.
YearNumberTotal Area/km2Mean Area/km2Standard Deviation/km2Maximum/km2
200046290.36.39.154.6
201054521.19.714.971.8
202095904.09.516.2100.0
Table 3. Statistical description of PUAs in different counties.
County UnitArea in 2000/km2Area in 2010/km2Area in 2020/km22000–20102010–2020
New Area/km2Expansion
Rate
New Area/km2Expansion
Rate
Taizhou downtown55.3114.4178.759.1106.90%64.356.20%
Sanmen2.810.521.77.7275.00%11.2106.70%
Linhai19.934.966.71575.40%31.891.10%
Wenling23.945.2109.221.389.10%64141.60%
Yuhuan153252.917113.30%20.965.30%
Wenzhou downtown78.1120.818742.754.70%66.254.80%
Yueqing26.146.896.820.779.30%50106.80%
Yongjia9.418.627.99.297.90%9.350.00%
Rui’an33.349.673.416.348.90%23.848.00%
Pingyang5.813.232.47.4127.60%19.2145.50%
Cangnan20.735.257.314.570.00%22.162.80%
Table 4. Statistical description of PUAs for settlements by different categories.
YearCategoryNumberTotal Area/km2Mean Area/km2Number of Cross-Category City
2000Type A21.5208.99.72
Type B2071.33.6
Type C4.5102.2
Total46290.36.3
2010Type A22.5372.716.63
Type B22.5116.95.2
Type C931.53.5
Total54521.19.7
2020Type A39.8596.3158
Type B32.3222.66.9
Type C22.885.13.7
Total959049.5
Table 5. Weights of compactness measurements.
DimensionIndicatorWeight
External profile indexRI0.087
CI0.076
Accessibility of road networkAC8000.209
AC50000.288
Land use intensityNLI0.066
Functional diversityPD0.208
PMI0.066
Table 6. The average value of each indicator for the five types of PUAs.
CategoryRICIAC800AC5000NLIPDFMI
Highest compactness0.480.450.540.560.690.730.82
Higher compactness0.430.450.270.210.530.660.81
Medium compactness0.450.410.170.130.460.340.62
Lower compactness0.480.420.100.100.350.140.45
Lowest compactness0.530.320.040.030.260.050.22
Publisher’s Note: MDPI stays neutral with regard to jurisdictional claims in published maps and institutional affiliations.

