Article

Confronting Complexity: Interpretation of a Dry Stone Walled Landscape on the Island of Cres, Croatia

1
Department of Prehistoric and Historical Archaeology, University of Vienna, Franz-Klein-Gasse 1, 1190 Vienna, Austria
2
Human Evolution & Archaeological Sciences (HEAS), University of Vienna, Universitätsring 1, 1010 Vienna, Austria
3
Vienna Institute for Archaeological Science (VIAS), University of Vienna, Franz-Klein-Gasse 1, 1190 Vienna, Austria
4
Historic Environment Scotland, John Sinclair House, 16 Bernard Terrace, Edinburgh EH8 9NX, UK
*
Author to whom correspondence should be addressed.
Land 2022, 11(10), 1672; https://doi.org/10.3390/land11101672
Submission received: 31 August 2022 / Revised: 17 September 2022 / Accepted: 19 September 2022 / Published: 27 September 2022
(This article belongs to the Special Issue Landscape Archaeology by Using Remote Sensing Data)

Abstract

:
Dry stone walls are a worldwide phenomenon that may shape entire regions. As a specific form of vernacular agro-pastoral practice, they are expressions of the culture and history of a region. Dry stone walls have recently received increased attention in Croatia, primarily due to research in landscape architecture and (historical) geography, though archaeological research on such remains is rare in part due to the challenges of undertaking such work in areas covered by dense evergreen maquis vegetation. In this paper, this type of landscape has been studied in detail for the first time using Airborne Laser Scanning (ALS) based digital feature models as a basis to articulate dynamic dry stone wall landscapes in a diachronic archaeological interpretation. Using a case study from the Mediterranean region of Punta Križa, Croatia, we show that what superficially appears to be a simple system of dry stone walls contains a wealth of information on a complex sequence of human activity. The systematic, detailed, and diachronic interpretation applies a transparent workflow that provides a tool for all those undertaking interpretative mappings of archaeological prospection datasets and has proved highly effective when working with ALS-derived visualizations. The capacity to develop spatio-temporal interpretation within the framework of GIS and a Harris Matrix is especially powerful and has the potential to change our image of any region. While the case study presented here deals with a small area in Croatia, the methods described have a broad application in any areas of complex landscape remains.

1. Introduction: Dry Stone Walled Landscapes

In “Axioms for Reading the Landscape”, the geographer Peirce F. Lewis observes that “… the culture of any nation is unintentionally reflected in its ordinary vernacular landscape“ [1]. This makes an important point that landscapes are not empty, but reflect the lives and activities of those who inhabit them—an observation that makes any dichotomy between traditional concepts of ‘site’ and ‘off-site’, e.g., [2,3,4,5] unhelpful to landscape archaeology. This is particularly evident in extensive archaeological surveys and mapping, where a wealth of ‘off-site’ archaeological remains reflects those vernacular landscapes—the landscapes of the day-to-day, year-to-year, and generation-to-generation routines and cycles of activity.
Areas characterised by an abundance of stone and building in dry stone techniques are a specific form of such everyday landscapes and are important features worldwide [6,7] (p. 11). The art and skill of building with dry stone techniques are very long-established, and as an enduring shaper of landscape, the ‘Art of dry stone walling, knowledge and techniques’ was recognized by UNESCO in 2018 as an Intangible Cultural Heritage of Humanity [8]. With dry stone buildings used to construct terraces, field boundaries, enclosures or other structures (e.g., hillforts), dry stone walls often characterise agro-pastoral cultural landscapes and shape entire regions, such as the Croatian coast and islands, see, e.g., [9] (pp. 978–979). Here, associations such as 4 Grada-Dragodid [10] are active in the preservation of traditional stone building practices, offering workshops on traditional techniques and undertaking documentation and research (e.g., suhozid, an open public GIS inventory of Croatian dry stone heritage [11]).
While the UNESCO inscription emphasises the intangible aspects of art, knowledge and techniques, the focus of this paper lies in the archaeological interpretation of the material remains of landscapes that express this cultural heritage, explored through a case study in Croatia. While dry stone walling is represented in the Croatian Register of Cultural Goods since 2016 [7] (p. 13), they are a minor consideration in Croatian archaeological research. In many cases, dry stone constructions are investigated in the context of traditional sites, for example, in the Neolithic [12,13] and in Bronze and Early Iron Age hillforts, mounds, and dwellings, e.g., [14,15,16,17]. However, with the exception of the remains of Greek and Roman land divisions [18,19,20,21] detailed large area investigations of dry stone landscapes are rare. Otherwise, dry stone walled landscapes have so far been researched within the disciplines of landscape architecture and (historical) geography. Such research has made use of on-site surveys, aerial photographs and (historical) maps, supporting methods for mapping and (stratigraphic) interpretation, typology and classificatory schemes, historical narratives, and assessing the change of economy and value from practical agro-pastoral features to heritage objects. Recent research on the island of Cres in Croatia demonstrates this potential, e.g., [7,9,22,23].
In further exploring such dry stone walled landscapes, an explicitly archaeological focus brings with it an emphasis on the potential time-depth of remains and their evident complexity. On the Croatian coast, for example, in an area of centuries-old agriculture and cattle breeding, the dry stone walls are elements in a dynamic, living landscape. Thus, they are subject to degradation, removal, rebuilding, accretion, and reshaping, which makes mapping and interpretation challenging. This can be compounded when former agricultural areas have been abandoned for economic or historical reasons and are now covered by forest, shrub and dense, low-to-ground maquis vegetation [7] (p. 171) that may effectively prevent field investigation and undermine the utility of aerial photographs. Such areas require an appropriate methodology that can capture spatial and temporal factors with equal accuracy. Here, the application of Airborne Laser Scanning (ALS) may be particularly suitable for mapping, though the dense low vegetation presents its own difficulties to the effective processing of ALS data.
These issues are discussed with reference to a case study area at Punta Križa in Croatia, using a digital ALS-based terrain model produced in 2012. These data have been modelled from an archaeological perspective with a view to exploring the following research questions: (1) is it possible to systematically map dry stone walls from ALS-derived digital terrain models in an area of dense, low-to-ground vegetation; and (2) can the mapping process provide stratigraphic information for diachronic interpretation of the complex history of this and similar landscapes?
After setting the scene and describing the archaeological background of the area, the methodology section explains the ALS data processing (especially ground-point filtering), the preparation of complementary data, and the interpretation environment in GIS, as well as field visits. Based on these considerations, the interpretive mapping of Punta Križa is described, and the results are discussed in the two final sections.

2. Case Study Area at Punta Križa

The case study area, which extends to 20 hectares in area, lies on the promontory of Punta Križa at the southern end of the island of Cres (Figure 1 and Figure 2). Together with the islands of Krk, Lošinj and Rab, Cres belongs to the most northern group of the Croatian islands. Located in Kvarner Bay, a semi-enclosed basin between the Istria peninsula and the Vinodol–Velebit coast, the islands are typical of the Dalmatian coast, e.g., [24]. This is a tectonically active region dominated by Cretaceous carbonate sediments and is a typically Dinaric karst landscape [25] characterised by dry valleys, dolines and fluted rocks [26]. Quaternary sediment cover is quite thin [27] giving the landscape a heavily eroded character. Isostatic rise of about 1.0 to 1.5 m since Roman times is estimated for the Northern Adriatic [28,29], see also discussion in [30], while cores from submerged dolines allow a general reconstruction of −3 m for sea level at ca. 4300 BC [31].
The name Punta Križa is today used not only for the peninsula itself but also for its largest settlement and is applied in the naming of small topographical forms along the Croatian coast such as Cape Punta Križa (Italian: Punta Croce). Its meaning is suggested to relate to ancient maritime traditions whereby wooden crosses (Croat: križ) were used to mark safe harbours [32] (p. 5) before lighthouses and other forms of signal lights became widespread to support navigation.
The history of Punta Križa has left fragmentary evidence in archaeological and historical archives. The general archaeological context is rich, including evidence for Mesolithic/Neolithic settlements [33,34] and Bronze and Iron Age hilltop settlements and tumuli [34,35]. From the Late Bronze Age, Punta Križa entered the sphere of influence of the ancient town of Osor, which borders the peninsula just to the north (Figure 2a). Osor developed the attributes of a town (e.g., “Cyclopean” fortification walls) by the Iron Age at the latest [36,37] and passed into the Roman economic area of influence from the second century BC. Unlike Osor, where archaeological research over 50 years has taken up topics from Roman architecture [38] and fortification walls [39] to the city layout [40], Punta Križa in the Roman period remains unexplored. The extent to which Roman agriculture left its traces is not yet known, and until recently only a single Roman villa was known (site of Sv. Platon, cf. [41]). The only systematic archaeological excavations in recent decades at Punta Križa are on the remains of late antique and early medieval ecclesiastical architecture at Martinšćica, during which a second Roman villa was discovered [42].
Byzantine, Croatian and Venetian rule over the region has mainly been studied from historical documents. These sources provide insights not only into the development of rural island society, especially between the 12th and 18th centuries, but also indirectly into the history of cultivation and land use in Punta Križa. Viticulture, animal husbandry (sheep breeding), forest exploitation and logging, and lime production provided meagre food and some income for the local population for centuries [43]. This economic system can be recognised in the landscape in two ways. Firstly, the remains of farms, so-called “ pastirski stanovi” (shepherd’s dwellings), reflect the organisation of agriculture since the 15th century at the latest (Figure 3a). These farms not only consisted of residential buildings for temporary labourers, but also agricultural land (fields, pastures, vineyards, etc.), which was initially cultivated for noble landowners [43,44,45]. Secondly, the peninsula was probably covered with a network of dry stone walls by the Middle Ages at the latest (Figure 4), reflecting the complex structure of land use rights and obligations as well as different agricultural practices, as can be seen in the Statute of Cres and Osor from 1441 [46] (1051 ff.).
The first accurate maps date to the 19th century, the earliest of which is the Franciscan Cadastral Map of 1821 (Figure 5) which contains precise land use information [48]. This map shows that large parts of Punta Križa were overgrown with shrubs and that agricultural use was very limited (Figure 3b and Figure 4), which is in contrast to the levels of activity suggested by the high density of dry stone walls in the area [7] (p. 274). This contrast between extensive archaeological evidence of agricultural activity predating the early 19th century and the limited evidence for such land use from the 1821 map reflects historical events and economic changes, which have caused population fluctuations and abandonment of the land. In common with other regions of the Croatian coast, short periods of prosperity and order have alternated in tragic regularity with conflict and/or serious epidemics (see the discussion in [43]).
Since the 19th century, the island of Cres has seen French, Habsburg and Italian rule, becoming part of Yugoslavia after 1945 and of Croatia in 1991. Consequently, the 20th century, with the two world wars, also resulted in the local population abandoning Punta Križa, and with it the use of the land. In the only village on the peninsula bearing the same name, Punta Križa, 47 people were resident in the census of 2021 [49]. Today, most residents depend on the tourism industry for their living and use of the peninsula is limited to a few small agricultural farms, leaving Punta Križa almost completely covered with dense, mostly evergreen shrubbery (maquis), an anthropogenically induced vegetation that testifies to intensive past cultivation of the area (Figure 3 and Figure 4).
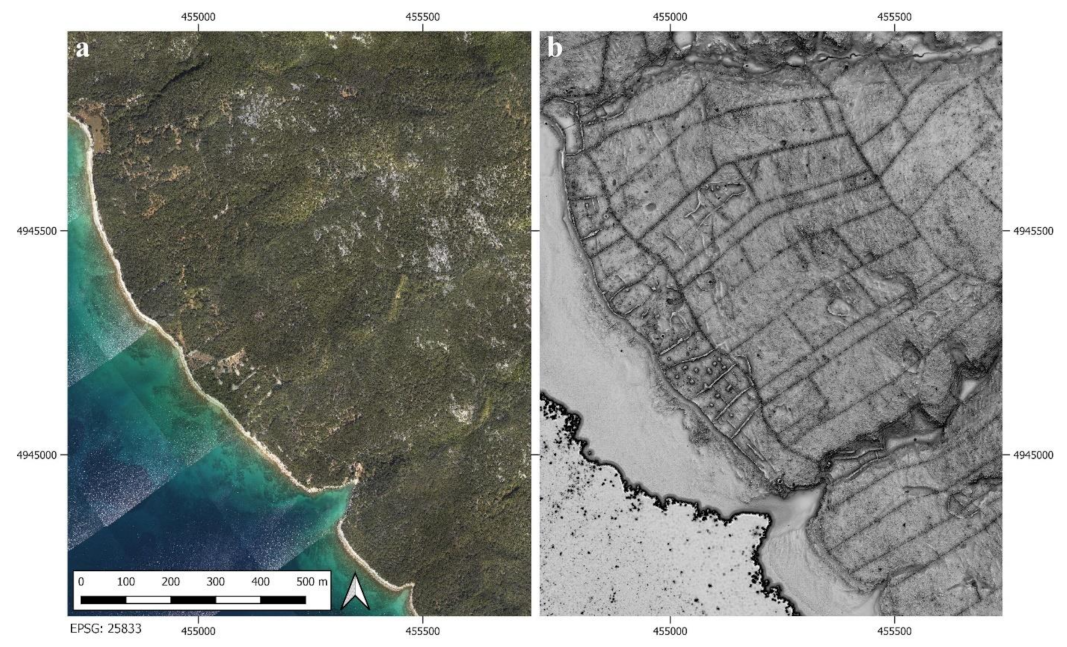
Some 30 km2 of Punta Križa were documented with ALS (Figure 2a), from which a small area of some 550 m by 350 m (20 hectares) was chosen for this case study. In this area, the terrain rises from an indented coastline up a slope of five degrees to a maximum height above the current sea level of 25 m (Figure 2c). Approximately at the centre, there is a dry valley 3 m deep, measuring 16 m across in its upper reaches and broadening to about 30 m at the coast where it extends to form a small bay (Figure 2b). At first sight, the ALS-derived view shows what appears to be a relatively simple network of boundaries defining an apparently coherent field system with hints of phasing (Figure 2d). However, as will be revealed in subsequent sections of this paper systematic and detailed diachronic interpretative mapping has shown considerable complexity.

3. Source Datasets

Any interpretation of ALS-based data (as is the case for any other prospection method) will benefit from integration with other types of information, which may provide all-important context. This can be obtained from a range of sources, including information from archives, excavations, field surveys, thematic maps, and other remote sensing data or geophysical results, to mention only the most common. For our case study area an ALS point cloud, aerial photographs and map datasets were available, and these are described in turn.

3.1. ALS Dataset

The ALS data for our case study area are a small part of a larger laser scanning campaign (Figure 2a) conducted in March 2012 across sample areas of the Cres/Lošinj archipelago to test the archaeological potential of a green laser [50]. For this reason, the VQ-820-G hydrographic laser scanner (RIEGL Laser Measurement Systems GmbH) operated by Airborne Technologies was used, providing ground sampling distances of less than 0.5 m. The setup included very short laser pulses (1 ns) with small footprints (0.45 m at 450 m flying height) and a high effective measurement rate (c. 200 kHz). The scan angle was set to the full field of view of the instrument (60 degrees). The most important parameters are listed in Table 1.
The laser scanner and its settings define the characteristics of the data. In this case, the primary purpose of the airborne laser scan was to test for the first time a green laser for archaeological applications in shallow water. The ALS data have an overall mean laser pulse density of 16 shots per m2, though the scan strips overlap of 70% means that this is not uniform as areas may receive laser pulses from one (along the border of the scanned area) to four strips (overlap of three strips plus a cross strip). Due to the varied vegetation cover, the classification of the point cloud resulted in an uneven distribution of ground points (Figure 6a) with dependencies on the ground point filtering technique (below), but an average of 5.5 points/m2 classified ground points (for a discussion; see [51]).

ALS Data Processing

The first stage of data processing was carried out by the data provider using the RiPROCESS software (RIEGL, Horn, Austria), including echo detection and generation of a 3D point cloud from the scanner, GNSS, and IMU data, as well as strip adjustment and quality control. Classification of surface and off-surface points with subsequent ground point filtering, DFM interpolation and visualization was undertaken by the lead author and specifically adapted for the case study presented here.
Classification and (ground point) filtering of an ALS-derived point cloud are necessary to identify ground points and points from archaeologically relevant features such as walls and buildings, roads and earthworks [51] for use in interpolating a so-called digital feature model (DFM—see [52]). This employed the SCOP++ software (Ver. 5.4, GEO/TU Wien, Austria, and Trimble Germany) package, which uses hierarchic robust interpolation with an eccentric and asymmetrical weight function to identify ground points (see [53,54,55]). Because of the variability in vegetation density two DFMs with different parameter settings were derived: (1) a rigid ground point filter strategy that removed all vegetation (parameter setting: “dense_veg”); (2) a ground point filter that was adapted to keep dry stone walls in the resulting DFM while removing as much vegetation cover as possible (parameter setting: “stone_wall”). Both filters were developed within a hierarchical framework (Table 2; see [51] for discussion) and resulted in an average of 5.5 (stone_wall) and 5.1 (dense_veg) ground points/m2 (Figure 6a).
The final steps of both filtering strategies were the interpolation of the classified 3D ground point data into a 2.5D DFM and object-based classification. In both settings, the resulting ground point density supported a grid size of 0.5 m verified by a DFM confidence map (Figure 7) calculated using the Open LiDAR Plugin for QGIS [56]. The interpolation algorithm used in the production of a DFM is important [57] and in our case, linear prediction was applied [58]. This is similar to Kriging and seems to maintain relief features even in reduced point clouds [57,59] (p. 9994). This was significant because the distribution of ground points is, as was expected, uneven, with a standard deviation for both filter-sets of around 4 (Figure 7). Low (0–25 cm) and medium height (0.25–1 m) vegetation were of interest in the object-based classification because high point densities of those classes define areas that are difficult to survey on the ground [52,57]. Indeed, this approach shows how the case study area is surrounded by very dense low vegetation (Figure 6b) to the extent that it was impossible to approach it from the land side and necessitated the use of a boat for access.
The vegetation of Punta Križa is mostly maquis (mainly Arbutus unedo, Myrtis communis, Erica arborea, Pistacia lentiscus, Pistacia terebinthus), with a few trees (Quercetum ilicis; English holm oak), various Juniperus species (J. oxycedrus, J. macrocarpa and J. phoenicea) and other individual species such as Phyllyrea media or Laurus nobilis. This dense, low-to-ground evergreen vegetation combined with the low-energy forward-pointing green laser scanner (see [50] for a more detailed explanation) presented a specific challenge to ground-point filtering and interpolating a DFM of adequate resolution. While both SCOP++ parameter sets delivered useful and complementary results for archaeological interpretation, (modern) buildings that are surrounded by dense vegetation were not classified correctly and were not included in the DFM. This is a good example of the difficulties of filtering in challenging environments where a range of anthropogenic remains are set within areas of very variable vegetation density and height, compromising aspects of the resulting DFM. Nevertheless, this is the closest to an optimal output that can be achieved in these circumstances.
Visualizations of the DFM were subsequently calculated using the Relief Visualization Toolbox (RVT) Version 2.2.1 [47,60]. Seven visualizations were used, namely slope, multiple direction hillshade (MH), positive openness with a kernel radius of 10 pixels or 5 m: pOp(10), negative openness with a kernel radius of 10 pixels: nOp(10), simple local relief models with smoothing kernels of 20 (LRM(20)) and 50 pixels (LRM(50)), and “archaeological combined cVAT” visualization (a blend of hillshading from three directions, slope, positive openness and sky-view factor).

3.2. Aerial Photographs

Three sets of aerial photographs of different dates were used in this study. The oldest was taken in 1944 (Figure 8) at a scale of 1:50,000 and while the image quality and resolution are far from optimal, it shows important detail on land use and land division that provides dating information for some features.
The second source of aerial imagery is a Digital Orthophoto Map provided within a WebGIS Interface (https://ispu.mgipu.hr/ accessed on 15 September 2022) by the Croatian Ministry of Physical Planning, Construction and State Assets. The imagery, which covers most of Croatia at a scale of 1:5000, comprises photographs taken between 1950 and 1968 and is geolocated to an accuracy of between 5 and 10 m. The photographs covering the case study area were taken in 1953 [7] (p. 25). The black and white photographs are good enough to show small buildings and individual trees.
Finally, digital vertical aerial photographs were acquired simultaneously with the ALS data acquisition on 29 March 2012 using an IGI Digicam H-39 (39 megapixel @ 6.8 microns pixel size). The high-resolution images were ortho-rectified by the data provider using the digital surface model from the airborne laser scan, resulting in ortho-images with a ground sampling distance of 8 cm.

3.3. Historical and Thematic Maps

There is a range of available online maps for the study area spanning the period from 1821 to 2010. The earliest map is part of the Austrian Cadastral survey that covered the Habsburg Empire at a scale of 1:2880 on the initiative of Emperor Franz I (therefore, it is also known as the Franciscan Cadastral Map). It is published by the State Archives in Trieste (Archivio di Stato di Trieste) [48]. Since this map was produced for taxation purposes it mainly shows boundaries of numbered properties, and most importantly over 40 types of land use in six main categories [61]. However, the map does not contain topographical information.
The Third Military Survey of the Habsburg Empire, the so-called Franzisco-Josephinische Landesaufnahme [62,63], was the third in a series of military surveys and the first to include the study area. It was produced between 1869 and 1887 at a scale of 1:25,000. It is a topographical map that includes for the first time contour lines at intervals of 20 m and hachures to depict topography [61] (p. 34).
The 1:5000 scale Croatian Base Map (Hrvatska osnovna karta—HOK), which was first produced in 1954 and last updated in 2010, shows recent land divisions and dry stone walls [64]. The dates of map production for the case study area are 1979, 1986 and 1988 [7] (p. 26). The modern cadastral map [65] depicts contemporary land parcels. A geological map at a scale of 1:50,000 [27] is not detailed enough to allow an interpretation of karstic features but provides a good overview of the geological setting.

4. Methods

4.1. Preparation of Data for GIS-Based Interpretative Mapping

The creation of a GIS environment for mapping combined the ALS-derived dataset (DFMs and visualizations), the Croatian 1:5000 base map (as a Web Map Service (WMS) layer), the 1953 Orthophoto map and the 1944 aerial photograph. The historical maps, the 1953 Orthophoto Map and the 1944 aerial photograph required rectification and georeferencing, for which a plane-rectification applying a Helmert transformation and well-distributed control points from modern maps were used. Given that the topography of the case study area is not a plane the transformation of the 1944 aerial photograph is of course not accurate but proved adequate for the purposes of comparing mapped features and those on the source image.

4.2. GIS-Based Interpretative Mapping and Harris Matrix

While an interpretation in a full 3D setting is desirable [66], archaeological interpretative mapping typically takes place in a 2.5D GIS-based environment working in a spatial database that combines polygonised mapping supported by attribute data (Table 3). The definition of attributes that underpin the interpretative mapping is important and must reflect the research questions—though few papers specify the structures of such attribute tables see [52] (p. 15).
Other authors have suggested additional attributes, including geometric properties (coordinates, area, perimeter), average height or depth of the feature, or low vegetation density above the feature [67] (pp. 15–16), [68,69]. However, because such attributes can easily be calculated in an automated process at a later point it is inefficient to fill them in during interpretative mapping. Information about the interpretation rationale is not part of our spatial database but rather is explained in the accompanying textual description which we believe is a necessary part of any interpretation.
The present-day terrain of the Earth is composed of many distinct and discernible surfaces, which are the results of events and formation processes either from direct human action (e.g., built dry stone walls, stone clearance, planting trees), their indirect consequences (e.g., erosion or accumulation events), or animal activities and natural formation processes. These actions, events and processes interact in a complex way and may be superimposed on each other—that is to say, they are stratified. Consequently, a diachronic interpretation approach is needed that isolates and defines periods of construction, use and re-use to create an understanding of the chronological development of the landscape we observe. Therefore, the observation of topological relationships between features is especially important. These are mainly stratigraphic relationships that can be identified on site and in ALS-based DFMs (for a fundamental discussion, see [70,71]). If the distinct features mapped during interpretation are in a direct superposition, their stratigraphic position (above or below) can be determined, and a stratigraphic sequence is established. This relative chronological model can be depicted in a Harris Matrix [72]. The use of a Harris Matrix has, besides the graphical processing of the stratigraphic sequence, also a function to check the identified stratigraphic relations for their logical correctness. If a logical error is detected during the validation (e.g., feature “a” lies above feature “b”, which lies above feature “a”), an error message would be triggered.
As will be detailed below, the mapping procedure followed a stratigraphic approach whereby apparently recent features were drawn first (e.g., recent dry stone walls mapped on the Croatian Base Map), with identifiably earlier objects drawn subsequently. While this was quite straightforward for modern dry stone walls and roads, it was difficult to put into practice with more complex areas. In such areas, there are relationships that can only be brought into chronological order with the help of the Harris Matrix after they had been mapped. As features were drawn, their SU-number was input to a Harris Matrix using the “Harris Matrix Composer (HMC)” software (Ver. 2.0b, Imagination Computer Services, Vienna, Austria) [73], identifying stratigraphic relations in the fields “is Above” and “is Below” (see Table 3). One of the main difficulties is that long-lived dry stone walls used over several phases cannot be represented as such in the Harris Matrix. The Harris Matrix, while providing a coherent stratigraphic sequence, does not show the duration of individual deposits or surfaces. This is shown, for example, by the enclosure wall which existed in 1821 (Phase 3, see Section 5.1.3.) and is still “functional” today. In the matrix, the vertical (chronological) position of such objects is not fixed, i.e., they are assigned to one of the three possible phases in this case. To get around this, the stratigraphic units of the dry stone walls were defined for each phase in the HMC and given the suffixes “a”, “b”, “c”. It is also worth noting that some types of features may be the product of long-term processes, rather than ‘events’. Thus, while the enclosure wall may have been built during a short period of time (i.e., an event), many stone clearance deposits (see Section 5.1.2) are produced by an ongoing process of clearing cultivated ground and as features that are formed by aggregative processes may obscure aspects of their chronology.
The interpretation of archaeologically relevant features of variable size required working at different map scales. Zoomed-out views allow context to be understood but would not resolve detail to allow interpretation and accurate mapping. Therefore, mapping was often done in two steps beginning with a sketch drawing of an object (using a scratch layer) at a viewing scale of between 1:10,000 and 1:3000 and then completing a detailed drawing using a viewing scale of +/− 1:600. Drawing was in most cases based on visualizations that are not subject to directional bias and horizontal relief displacement (below). Local relief models were useful to measure the height and depth of structures relative to the surrounding terrain (see also [74]).

4.3. On-Site Visits

Field visits to the study area took place in early September 2021 and mid-April 2022. In preparation, the areas to be visited were marked in a separate shapefile during the interpretation and added with a comment detailing the reason for a field visit and the questions to be addressed. Due to the difficulties resulting from the dense vegetation cover, the most important areas that would give the information needed for our research were selected for visiting. The visits concentrated on the western part of the case study area. Our approach was qualitative, i.e., we identified “matches” and “differences” between desk-based interpretation and field observation and observed additional information, which was recorded in order to develop an interpretation key and to provide important feedback for desk-based work, obliging us to rethink and reshape some interpretations (see also below). The approach, however, did not generate enough ‘points’ for statistical analysis showing a quantifiable success or error rate.
For example, identifying the wall type (see below) from the ALS-derived DFMs was not always straightforward as the ground point filtering process might slightly change the height and maybe even the thickness of features (especially thinner structures). Field visits helped to correct false identifications, though only a small proportion of walls could be inspected on the ground. Nevertheless, the information from ground observation added confidence to subsequent desk-based (re-)interpretations. As well as providing knowledge of how features on the ALS looked on site, the field visits were also important to explore details not visible in the DFM. These included examining stratigraphic relationships (e.g., about wall joints or variable stone sizes), the value of which was demonstrated by the need to partly revise and update mapping after the field visits.
For the site visits, all necessary data were carried on a mobile data collection device connected to a GPS antenna, in this case, a tablet device (Samsung Galaxy Tab Active Pro T540) running mobile GIS QField (Ver. 1.10, OPENGIS.ch, Laax, Switzerland) [75] software (Figure 9). The tablet was easy to carry while the 10″ monitor was large enough to view orthophotographs and visualizations of the DFM. The built-in GPS proved sensitive enough to give relatively reliable location information even in dense undergrowth and was indispensable for orientation. Field observations were mapped into QField for subsequent assimilation into the master QGIS project. On-site photographs were taken using a DSLR camera with attached GPS, which allowed their location and orientation to be imported into QGIS using the plugin “Import Photos”.

5. Results

5.1. Interpretative Mapping of the Case Study Area

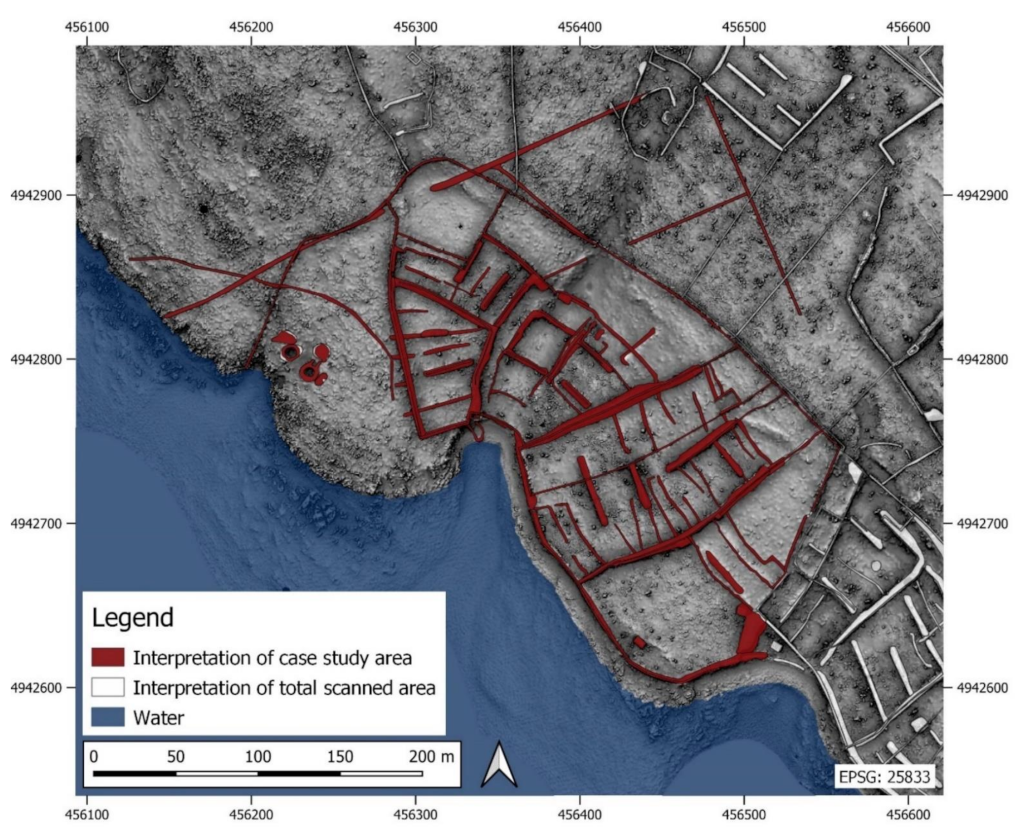
As outlined above the interpretative mapping process followed a stratigraphic approach, with those features that appeared to be most recent drawn first and objects intersected by these features drawn subsequently. Each feature was provided with an individual stratigraphic unit number (SU), with the SU numbers of overlying (above) and cut (below) features stored in the spatial database. In a further step, SU-number and stratigraphic relations were input into the Harris Matrix.
In very simple terms, the interpretative map of the study area (Figure 10) shows remains relating to agricultural or horticultural production (field boundaries) and industrial processes (lime kilns). The Harris Matrix (Figure 11) shows at least five phases of use identified from the mapped features and their stratigraphic relationships, allowing the interpretative mapping to be clearly presented according to these phases.
In the following sections, these phases will be described in detail. While it is common for archaeological phases of landscapes and sites to be presented beginning with the earliest and progressing to the most recent; in this case, these results are presented beginning with the most recent. This rationale of the presentation was chosen as it follows our mapping methodology and allows the argumentation for the chronological classification of individual features to be presented clearly. It also demonstrates that the present-day landscape matters for the interpretation of past landscapes—a fact that is all too often ignored in the practice of landscape archaeology. Regardless of how such results are ultimately presented, we recommend this retrogressive approach at least during interpretative mapping as it follows the logic of the interpretative and mapping process (for a discussion, see [71,76]).

5.1.1. Phase 1: Youngest Dry Stone Walls

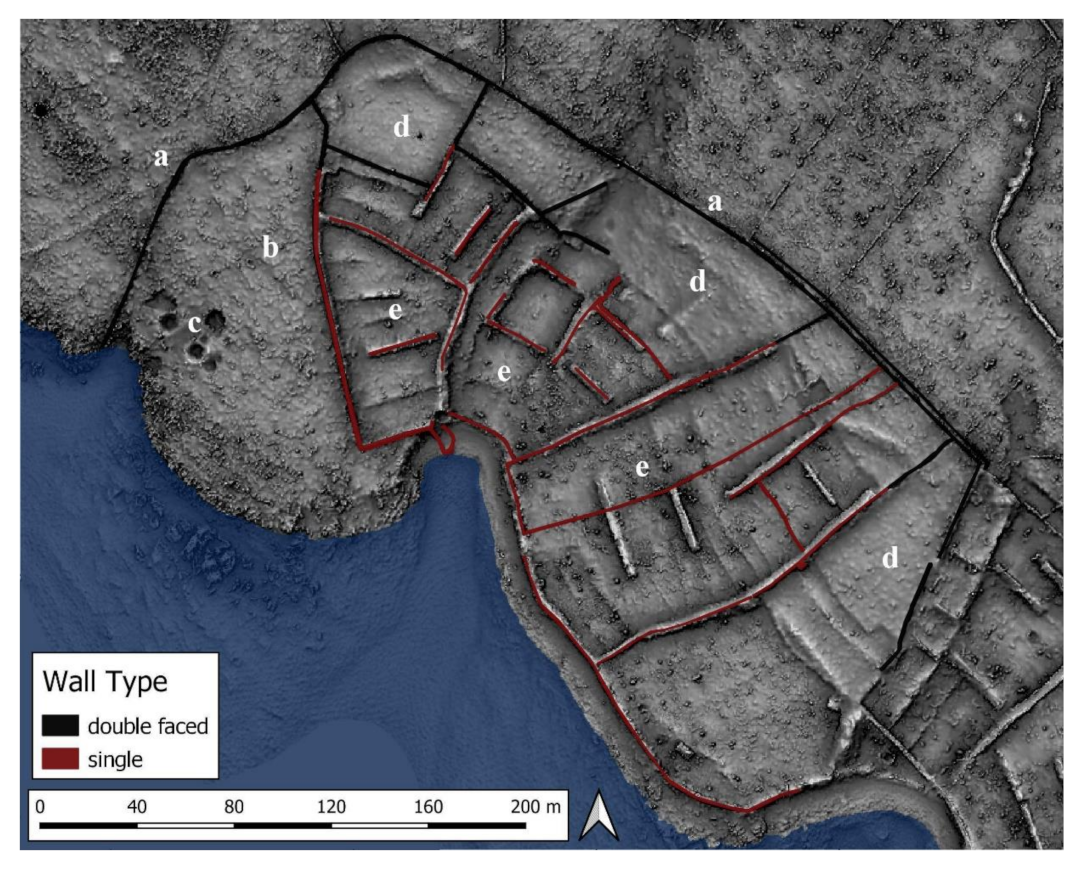
The most recent features of preserved dry stone walls were mapped first. Where they are not covered by vegetation they appear to be in good condition, as can be seen on the orthophotographs (Figure 12a). However, in some areas, field inspections showed that they are partly collapsed. Under vegetation, they can be clearly identified in the MH and pOp visualizations of the DFM from the “stone_wall” filter (Figure 12b). Because of their clear signature, delineating the boundaries of the dry stone walls was straightforward using a combination of MH, pOp(10) and LRM(20) or using cVAT.
Field visits showed that they are either single dry stone walls (Croat: unjule—black arrows in Figure 12b,c) or double walls (double faced, Croat: duplice—white arrows in Figure 12b,d). This distinction is not entirely clear in the visualizations due to the cell size of 0.5 m. It seems that the single stone thickness walls are consistently built on top of stone deposits (see next section). The double walls are usually built within a shallow foundation trench [7] (p. 49) as could also be observed on site. The dry stone walls are between 0.5 (single) and 1.2 m (double) thick and where they are better preserved between 1 and 2 m high (with a few exceptions, where the walls are very low).
The walls form a system extending across an area of 350 × 150 m, enclosed by a bounding wall (Figure 13a) and bordered on the south by the coastline. This system is attached to other enclosed fields, especially to the south-east and north. Inside the bounding wall, two different areas can be identified comprising: (1) a roughly triangular area of 150 × 100 m in the west (Figure 13b) with remains of lime kilns; and (2) a system of smaller enclosed areas in the remaining area. There are noticeable variations in the texture of the visualised surfaces, which vary from smoother patches (i.e., Figure 13d) to apparently rougher ground (e.g., Figure 13b). Some of these differences relate to real variation in ground conditions, while others are a product of vegetation conditions and the effectiveness of filtering. With reference to the orthophotograph, some differences in ground surface texture can be seen to relate to different tree species, with holm oaks in the areas of smoother surface texture (Figure 13d and Figure 18). However, the impression of smooth ground in the northern holm oak-covered area is deceptive, as it is a product of the dense canopy of the holm oaks limiting undergrowth and so results in better ground-point filtering and ultimately in a smoother DFM. Field visits showed that this area is covered by a lot of small stones and some larger stones (see below, Figure 18), while the area enclosed by the recent single walls (and as will be shown in the next section, by the massive clearance deposits—Figure 13e) contains apparently deeper soils cleared of larger stones and covered with many small stones (a few cm in diameter—see below, Figure 23a). Finally, the triangular area (Figure 13b) does not appear to have been cleared of stones at all. This is a reminder of the need not to take the visualizations at face value, and of the ongoing processes, such as disturbance of the ground surface and stone clearance, that dominate agricultural landscapes but are less immediately evident than ‘events’ such as wall building and difficult to incorporate in landscape narratives.
The dry stone walls are not cut by any features except for a pathway that runs through a break in the wall and is therefore clearly younger (see the white circle in Figure 12a). The stone walls are only partly depicted on the modern cadastral map but are mapped on the Croatian Base Map produced between 1979 and 1988. Overlaying the interpretation shows good correspondence, although a few walls which were interpreted as part of these modern walls are not depicted on the base map. This might be due to their collapsed state or being obscured by the canopy at the time of mapping. Most of the recent walls can also be identified on the 1953 Digital Orthophoto Map providing a terminus ante quem for their construction. The low resolution of the 1944 photograph does not allow identification of possible single walls on top of the stone deposits. The walls can be interpreted as recent land enclosures and divisions based on their stratigraphic position, and partly well-maintained shape and layout, which must have been left uncultivated since the 1960s (or slightly earlier) to judge by the extent of vegetation growth.

5.1.2. Phase 2: Clearance Deposits

Keeping the discipline of dealing with features from the most recent to older, a group of massive linear stone deposits was next to be mapped, as they seem to be directly overlain by the single dry stone walls (Figure 12a). The stone deposits are readily visible in the nOp(10) visualization, and they were mapped using a combination of MH, pOp(10), and LRM(20) as these provided the best delineation of their extents. The visualizations were calculated from the “stone_wall” filter output as this was shown to have the least impact on their visibility by comparing the orthophotograph and DFMs in less overgrown areas. While the deposits were also visible in the “dense_veg” dataset, their shape is altered by the more rigid ground-point filtering.
While in most cases delineation of the stone clearance deposits was quite straightforward, in some areas this was more challenging and required careful use of visualizations. Occasionally, the LRM proved misleading, appearing to show large, raised linear features, when the slope visualizations and cross sections demonstrate that on some occasions they were actually natural slopes (Figure 14).
On first impression, the mapping of the clearance deposits (Figure 15b) seems to form an enclosure system almost identical to the system of the recent walls (compare Figure 13 and Figure 15). However, the stone deposits do not extend to the bounding wall and the area characterized by smooth surface texture (compare Figure 13d) does not contain any of these deposits, suggesting different functions between areas.
The clearance deposits are between 4 and 7 m across and their edges are well defined, giving the impression of massive stone walls (see also their appearance in Figure 12a,c). Using the profile tool, it becomes evident that the deposits oriented along the slope can be interpreted in connection with terrace walls with heights ranging between 0.2 (upslope) and 1 m (downslope). This was confirmed by field observation.
The ALS-based interpretation indicates that these deposits were piled up during clearance activities. Field visits confirmed this interpretation, with the deposits marked as terraces overlying older terraces. The deposits running across the slope were heaped up beside double dry stone walls (white arrows in Figure 15b), or seem to overlie them completely (black arrows in Figure 15b and on site photograph in Figure 15d). Structures such as those present here are referred to as barbakan and menik, two terms that are sometimes used interchangeably [7] (p. 55). They are results of clearance activities connected with vineyards or horticulture.
This could also be the case here. The area occupied by the large clearance deposits is an olive plantation according to the 1953 Orthophoto Map, with trees mostly planted in rows 6–8 m apart (Figure 16A–D). Indeed, some olive trees can be still found at the centre of the case study area (Figure 16E). Here there is a cluster of 14 ‘platforms’, each measuring about 8 m square (Figure 16B), arranged in a rough grid crossing two terraces on the hillside. There are no stratigraphic relationships, though the layout suggests that the terraces belong to a system and may be related to the large terrace walls. From the 1953 Digital Orthophoto Map it appears that there is a tree on each ‘platform’, which suggests that they were deliberately planted.
The relative chronological position of the deposits seems to be clear in the Harris Matrix (Figure 11) and was confirmed during on-site observations, with the single stone walls built on top of double walls (see below) and the stone deposits. However, it is worth noting that while the stone deposits have been mapped as linear features, stone clearance is typically an ongoing process that may see such deposits built up over long periods of time. As such they are a product of processes of stone clearance, themselves driven or prompted by ongoing disturbance of the soil which produces more stone to be cleared. Thus, while the building of a stone wall can very often be seen an as an event, the creation of the stone deposits is more properly characterized as a process—and while that process may occur over a defined period of time, it may also be a composite product of chronologically discrete or dispersed events, as, e.g., an initial major clearance and ongoing, perhaps intermittent, accumulations of stones as they appear on the surface. It can therefore not be ruled out that clearance activities were also carried out during the existence of the single walls and that phases 1 and 2, therefore, overlap to a certain extent.
Keeping in mind this caveat, while providing absolute dates is problematic, there are a few indicators of chronological context. The Franciscan Cadastral Map [77] is not helpful for dating the clearance walls, as it only shows the boundaries between parcels and does not differentiate wall types. All boundaries are drawn with the same thin line, and we cannot be certain whether the stone deposits already existed in 1821. Most of the single stone walls are built on top of the clearance deposits, often, if not always, accentuating one of the edges of the deposits (as in Figure 12c). However, this could also be due to the expedient reuse of an earlier feature, so it is not possible to establish their date beyond noting that their construction must predate 1953 (Figure 15c) as they are present on the Digital Orthophoto Map. It is also noted that one stone deposit is piled against the wall of a building to a height of 1.8 m (Figure 17), and therefore must be later than the construction of the building. This building is shown on the Franciscan Cadastral Map and must therefore be older than 1821. However, it does not provide a date for when the clearance activities actually started.
In summary, the massive stone deposits seem to belong together as a product of clearance activities within a defined area. They seem to be a result of a long-lasting process that had started at least by 1821 and may have earlier origins as an expression of ongoing clearance of stone. The deposits delimit different areas of land use. Within the areas bounded by the deposits, the ground is free from larger stones, while the area to the north is covered by a lot of small stones and some larger stones and is densely forested with holm oaks (Figure 18).

5.1.3. Phase 3: Construction of Double Walls

During the first interpretation of the ALS-based DFM, the difference between single and double walls was not clear, and it required field visits to clearly distinguish the wall types from the DFM and to develop an interpretation key for desk-based re-interpretation. Field observation also made it clear that some of the massive stone deposits are built up against double stone walls and therefore must be younger (Figure 12c and Figure 15b), while keeping in mind the possibility that stone clearance deposits can grow up over time allowing a range of relationships with other structures.
On balance, however, this means that before the intensive clearance activity that produced the massive stone deposits there was a phase during which double stone walls were built. These are built within a shallow foundation trench [7] (p. 49) and some have clearly been maintained until recently. They are mapped among the recent walls (walls with black signatures in Figure 13), and there is evidence that some of these double walls are of older origin. One of these walls (Figure 19a and Figure 20a) is the continuation of the outer wall against which the clearance stones were piled (Figure 19b and Figure 20b) and therefore predates the clearance deposits. Other evidence relies heavily on the 1821 Franciscan Cadastral Map, which shows a vineyard almost exactly 0.8 hectares in extent (red coloured fields in Figure 21). Only a few of the field boundaries shown on this map are visible as dry stone walls or clearance deposits in the ALS-based DFMs. Some of the clearance deposits (e.g., ids: 4253, 4269, 4271, 4275, 4286, and 4282 in Figure 21) correspond to field boundaries shown on the Franciscan map and might have been constructed on top of former dry stone walls that consequently would originate in the period around 1821 or earlier. The enclosing wall (Figure 19c) must predate 1821 as it is on the Franciscan map. Additionally, it is possible that a double wall (Figure 19f) is buried below one of the massive stone deposits (Figure 19d), in a similar arrangement seen to the west (Figure 19a,b). This deposit follows a boundary shown on the Franciscan map. Finally, one wall (Figure 19e) is mapped as a field boundary on the Franciscan map but is older on the basis of field observation and ALS-based interpretation (see Section 5.1.5 “Phase 5: Stratigraphically Oldest Features”).
Furthermore, dating at least from 1821 are the remains of a building measuring 6 × 4 m located in the south next to the sea. Its shape is distorted in both versions of the ground-point filtered DFMs, so the orthophotograph was used for mapping. The building itself is depicted on the Franciscan Cadastral Map, which means that it was built before 1821. It is still roofed on the 1953 Digital Orthophoto Map but is ruined at present (Figure 22, for on-site photographs, see Figure 17). On the other hand, several boundaries mapped in the Franciscan Cadastral Map do not have corresponding features in the ALS-derived terrain model. Either these field boundaries were not manifested in the landscape by dry stone walls or were dismantled after 1821. Which of these assumptions is correct cannot be clarified with the available information.
This body of evidence suggests that the 1821 Austrian Cadastral survey provides a terminus ante quem for the construction of the double walls (Figure 19). The origins of the vineyard shown in the Franciscan Cadastral Map (Figure 21), however, cannot be decided on from the available data.

5.1.4. Phase 4: Terrace Features

Above we have described many massive stone clearance deposits (Croatian: gomile, menici or barbakani) and interpreted at least those that run across the slope as terrace walls. In addition, there are other less pronounced terraces formed by 0.5 to 1 m high terrace risers of large stones. These are stratigraphically below the stone deposits (Figure 23b).
In contrast to the massive stone clearance deposits which are clearly visible on the 1953 Digital Orthophoto Map and the 2012 orthophoto (Figure 12 and Figure 15), the identification of the terrace risers requires the use of surface profiles to distinguish the stone deposits from the terraces (Figure 24).
Mapping of the terrace risers mainly used slope visualizations, with a combination of slope and LRM(20) when the terrace slopes were heavily eroded. The mapping shows that terraces seem to form a coherent system mainly confined to the same area as the massive stone deposits (i.e., outside the forested area discussed above). Their orientation is mainly along the slope and parallel to the coastline, with a few lying perpendicular to the coast (Figure 25) beside an erosion gully that leads to the small bay on the coast.
While all the mapped terraces seem to form a coherent system and may thus be of similar age, one terrace line (4305) is stratigraphically younger (Figure 26) as it cuts another terrace (4312). This more recent terrace runs along the edge of the forest and may have formed due to different erosion regimes in the densely forested area to the north and the horticultural area to the south. While it seems to be a single discordant later terrace it could be an indication that the dense forest is younger than the terraces, though there is no certain way of establishing that relationship. This example is also a warning against a simplistic correlation between the form of features (e.g., terraces, stone clearance deposits) and chronological associations.
The double wall that runs across the slope and borders the terraced area to the west (Figure 19b) overlies some of the terrace slopes (Figure 27) and must therefore be younger. While the visualization of the ALS-based DFM seems to support this observation, this could not be confirmed by an on-site visit because the surface conditions in the triangular area to the west (Figure 13b) are very uneven and littered with large stones. Combined with the dense vegetation this prevented clear observation. Anyway, this is the only stratigraphic indication of an older age of these terraces. Otherwise, they would fit well into the system of stone deposits and modern single walls. In this context, however, it must be noted that the area of the terraces is annotated on the 1821 Franciscan map as shrubbery. As the terraces are definitely older than the clearance deposits, this is another indication that they predate 1821 and possibly also the double walls.
These observations suggest that the terraces are earlier in date than the vineyard (i.e., earlier than the 19th century), and may already have been in use before 1821. They seem to be partly rebuilt or reinforced during clearance activities after 1821 for unknown reasons. This chronological hypothesis cannot be verified by available sources such as the maps because of selective depiction, but provide a clear question that could be tested, for example by excavation and OSL profiling [78].

5.1.5. Phase 5: Stratigraphically Oldest Features

In the north-western corner of the case study area, there is a straight linear raised feature, which is best recognized in LRM(50) from the DFM filtered with the “dense_veg” setting combined with MH calculated from the DFM filtered with the “stone_wall” setting. Its straightness over a long distance makes it stand out from the other banks (Figure 28). It underlies, and thus predates, all other features it intersects.
The structure comprises a bank some 3–5 m across, which rises to 0.1–0.5 m above the surrounding terrain. It extends from the intertidal zone of the coastline and runs straight on an orientation from south-west to north-east and roughly 60° to the coastline for 600 m with several short breaks (Figure 28). Extending the projected line to the north-east beyond the limits of Figure 28 there are other elements of what appears to be the same bank up to a distance of about 1000 m. Field observation at the shore confirmed that it was a bank built of stones, while further inland it is a largely eroded bank covered by soil (Figure 29a,b).
Some 75 m to the south-east there is a second bank about 1.5 m across that runs for 140 m in a line parallel to the long bank (Figure 29c). A 30 m length of it can be followed on site as a largely collapsed double dry stone wall, which coincides with a parcel boundary of the 19th century date shown on the Franciscan Cadastral Map (Figure 30). In addition, it could be determined on site that it is stratigraphically older than the enclosure wall (also shown on the 1821 map) as there is a clear wall joint on the enclosure wall at the crossing point, as well as signs that the wall also continued beyond the enclosure wall (Figure 31).
The ephemeral traces of another linear feature can be observed running north-west to south-east for a distance of 160 m at right angles to the first bank (Figure 29c,d). Together, these banks suggest a rectangular boundary system dating to an earlier period than any other landscape features, though ground inspection is necessary to further elucidate these features and their significance.
In stratigraphic terms, the remains of the stone walls arranged in a rectangular pattern discussed above are cut by all other features that they intersect and are therefore the oldest features seen in the case study area. However, the actual age of this system cannot be decided from the ALS-derived models and the Harris Matrix, although similar features can be observed in the wider surroundings of the case study area. Six similar lines extend over distances of up to 1000 m from the coastline and are set between 683 and 714 m apart in five cases, and 352 m from its neighbour in one instance (see Section 5.2.1).

5.1.6. Other Features of Unknown Stratigraphic Phase

Not all mapped features can be placed in a direct stratigraphic position relative to other ones. Such features with no evident stratigraphic interrelationships include a group of five pits west of the case study area (cf. Figure 13c). These were mapped using a combination of MH, nOp(10), and LRM(20) using the “stone_wall” setting filtered DFM. Two are circular, measuring 6 m in diameter, and are surrounded by a 0.5 m high bank. According to the LRM(20), they are 1 m in depth. The other pits are less regular and at best roughly circular with depths between 0.5 and 1.5 m (Figure 32).
These features can be interpreted as lime kilns and extraction pits, which are very common along the coastline in locations close to the raw material, firewood and the sea, for reasons of easy transport [79] (p. 7). In our ALS-derived DFMs, similar features can be found all along the coastline between Osor and the tip of Punta Križa, in most cases located directly at the coast. In some areas (e.g., around Martinšćica, see Figure 33), their distribution is quite dense with kilns lying between 70 and 200 m apart.
As well as not having any stratigraphic relationships with other features, there is no information about them on historic or modern maps. In chronological terms, lime production can be traced back at least to medieval times and lasted until the first half of the 20th century [79] (p. 11). In our case, the kilns are clearly overgrown by shrub vegetation in the 1944 aerial photograph which provides at least a terminus ante quem. The use of lime to prevent downy mildew on grape vines might hint at a potential temporal position of the kilns in Phase 3—this remains highly speculative, however.
Another feature that is observed in many locations on Punta Križa is a rectangular sunken area measuring 8 by 15 m, enclosed on three sides by single-face stone walls (Figure 34). It cuts one of the terrace features and is partly overbuilt by a recent single dry stone wall. Therefore, stratigraphically, the feature in our case study area seems to be younger than the terraces and older than the modern walls. However, there are no depictions on any of the historical maps, and it is not visible on the 1953 or 2012 orthophotographs as t is obscured by vegetation. Their function is so far unclear.

5.2. Results: Putting Things in Context

The 20-hectare section of the Punta Križa peninsula which has been described in detail above reflects in its complexity the economy of the island in past centuries. Exact dating and clear functional assignment of individual structures seem difficult, but some clues have emerged in the presentation so far. The stratigraphic sequencing has revealed five different phases, which are presented in this section and embedded in their historical context. In contrast to the previous section, which foregrounded the diachronic interpretative process, the presentation below follows the common archaeological narrative beginning with the earliest phase while retaining the numbering of preceding sections. As might be expected, some of the dry stone walls cannot be dated, and those that have represent the 20-hectare case study area rather than a coherent agricultural or geographical unit.

5.2.1. Phase 5

The oldest identifiable phase is represented by a 600 m long straight bank oriented north-east to south-west and roughly 60° to the direction of the coastline (Figure 28 and Figure 29), which might extend to a distance of at least 1000 m. On its own, the feature cannot be dated based on currently available data. However, elsewhere in the Punta Križa area recorded using ALS there are other banks that suggest a larger system. Over 9 km extending from south of the village of Osor to the southern tip of Punta Križa (Figure 2a), several comparable dry stone walls can be identified running parallel to each other at regular distances of about 700 m or multiples thereof.
Some of these seem to cross the entire peninsula. The separation of 700 m invites interpretation as a Roman land division, corresponding to the basic unit of division of a centuria (a square area measuring 710 m square). Roman land division of this kind has been documented along the Croatian coast from Istria to Dalmatia [19,20,80,81,82]. In the case of the island of Cres, so far, no evidence of centuriae is known, nor were they expected. The Roman town of Osor, to which the territory of Punta Križa belonged, was not raised to the rank of a colonia [83] (pp. 79–80) and the associated right to organize and divide the land in the form of a centuriation is not known to have been given.
However, research into Roman land division on the Croatian coast was not only stimulated but also strongly influenced by aerial archaeology as exemplified by John Bradford’s “Ancient landscapes” [20]. His discoveries of Roman centuriae are primarily linked to particular types of landscapes, namely those that have been cultivated on a more or less continuous basis since Roman times, with the Roman dry stone walls integrated into subsequent agricultural boundaries. Visibility and continual use are inextricably linked, as the use of dry stone walls through the centuries has also ensured their survival through maintenance and clearing of vegetation. Such landscapes [20] (Figure 40) [42,47] therefore offer good conditions for an aerial archaeological approach to researching centuriated landscapes. These patterns of survival and visibility have undoubtedly influenced expectations of how the general Roman land division should look like, and in which ways it could be recognised in the landscape.
Such a view is unsustainable for two reasons. Firstly, the visibility of dry stone walls in a region has an influence on perceptions and archaeological interpretation. For example, in Istria centuriae are recognizable from the 1:5000 scale Croatian Base Map as they are still elements of the modern landscape. In contrast, on Punta Križa progressive abandonment of agriculture has seen the neglect of the dry stone wall systems and the advance of secondary vegetation. In such a context, the Croatian Base Map shows only some of the dry stone walls, as only a few can be regarded as features relevant to the contemporary landscape, and the heavily eroded oldest dry walls are not mapped at all. This highlights the importance of an appropriate archaeological methodology to explore such landscapes. Without ALS it would not have been possible to identify the oldest, probably Roman phase on Punta Križa, and an approach based on an examination of the Croatian Base Map, as has long been common in archaeological research (see, e.g., [84]), would not yield results. Secondly, Roman land division has left many traces, centuriation being only one of them. Recognition of the limites (lines of division), as they are present in Punta Križa, can be perhaps traced back to other forms of land ownership or the extent of the Roman surveying [85]. Even if the Roman city of Osor did not have the rank of a colonia and the right to divide the land in the form of a centuriation, there is nothing to suggest that its territory was not surveyed. The complexity of this question will be explored in a future publication.

5.2.2. Phase 4

The structures of the succeeding phase divide the study area into two areas (Figure 25). The southern area extends from the sea to about 100 m inland and is characterised by numerous terraces, most of which run along the slope parallel to the coast. Some of these also relate to the dry valley in the middle of the study area and thus lie at right angles to the other terraces. No terracing is found in the northern area, although the terrain continues to rise to the northeast at the same rate. Moreover, the triangular block at the western edge of the study area where the lime kilns are located is also devoid of terraces. This indicates different agricultural regimes. The terraces form a coherent system, with the individual terrace areas ranging between 300 and 900 m2 in extent and were presumably for the cultivation of olives or vines.
The first concrete information about the economy of the island can be found in the Statute of Cres and Osor dating to the first half of the 15th century [43] (p. 140) [46]. As the Statute mentions shepherd’s dwellings, agriculture and animal husbandry (sheep breeding) may have been the cornerstones of the local economy much earlier, though they are first attested in Venetian documents from the 16th century onwards. According to Stražičić [43], there is no information about the exact size and location of vineyards and olive groves during Venetian rule on Cres or Punta Križa. Even though most of the cultivated land may have been near the town of Cres, as early as 1666 vineyards are also mentioned in the “southern part of the island (where) today only the forest grows” [43] (p. 142).
The 1821 Franciscan Cadastral Map (Figure 21) provides the first clue to the dating of the terraces. It shows that one part of the terraces were planted with vines, while another was overgrown with maquis. As maquis is secondary vegetation, this indicates that the terraces may have been used at least in the 18th century. It is no longer possible to determine what the original form of cultivation was, but both olive trees and vines are possible, separately or in combination. Land use after 1821, on the other hand, is easier to reconstruct, as vine cultivation on the Croatian coast, as well as on the European mainland, was hit hard by vine diseases in the 19th century. After the damage caused by powdery mildew of grape (Oidium tuckery) following 1852, viticulture on Cres recovered between 1870 and 1890, leading to the increased planting of vineyards also on Punta Križa [43] (p. 204). However, already in 1885, a new vine disease (Plasmospora viticola) reached the island, and the sale of local wines became increasingly difficult as Austrian markets were opened to Italian wines in 1892. However, the complete decline of viticulture on Cres between 1890 and the First World War can be attributed to the vine disease Phylloxera vastatrix, which put an end to viticulture on Punta Križa, as confirmed by contemporary witnesses [43] (p. 205, footnote 136).
The northern part of our case study area appears to have changed little through time and has been characterised by woodland (holm oaks) since at least the 1940s. It may therefore be possible that this area was already designated as woodland from Phase 4 onwards. The very hard wood of the holm oak is suitable for firewood and may have been used for the numerous lime kilns (Figure 33). In this context, it is worth mentioning that lime was used to prevent downy mildew on grape vines. The location of the trees north of the terraces might additionally have functioned as a shelter for growing vines against the strong northern wind (Croat: bura).

5.2.3. Phase 3

In the southwest of the case study area, some of the terraces seem to be built over by a double dry stone wall and must be of older age (Figure 27), though this stratigraphic observation could not be verified during field visits. Therefore, the double walls from the next youngest phase could be directly related to the terraced area, as they are enclosed as well as the woodland in the north. Kremenić [7] (p. 49) points out that double walls, due to their stable construction, were popular for fixed and permanent boundaries of, among other things, plots of land and agricultural areas and mentions low double walls as “indicators of grapevine cultivation” [7] (p. 194). This would be consistent with the 1821 Franciscan Cadastral Map which shows a vine-growing area. Enclosing a forest area as well as a vineyard with solid double dry stone walls would also provide protection against free-roaming animals such as wild boar.
Some of the walls mapped in 1821 can be traced in the DFM and as collapsed stone walls on site. Some of the walls were re-used afterward. The bounding wall (Figure 13a) has survived to the present (for an on-site photograph, see Figure 35). To this phase belongs also a building directly at the coast that was first mapped in 1821; it is visibly still roofed in the 1953 orthophotograph and is in ruins today.

5.2.4. Phase 2

Phase 2 is characterized by massive stone deposits resulting from clearance activities confined to the terraced southern part of the case study area (Figure 15b). Stratigraphically, these overlie both double dry stone walls and terraces. However, we have no indication of the period of time between the building of the double walls and the first clearance activity, which might have been short. Since clearance is an ongoing process, the creation of these massive deposits may be the culmination of long periods of activity and/or discrete episodes interspersed across time.
Clearance activities might be seen in connection with wine growing and the arrival of phylloxera, which made changes in agricultural practices necessary. In the first half of the 20th century, for example, new wine varieties from the USA were introduced as an attempt to save viticulture. This introduced variety required deeper soils and this would have led to increased clearance activities, which may also apply to Punta Križa. Although this is not documented for the study area, records from other island regions show that the effort did not yield the intended outcome. “The American” was too demanding in terms of soil conditions and care, for which the necessary labour force was not available due to emigration [43] (p. 204). In the long term, therefore, viticulture was abandoned or replaced by olive groves.
The 1944 aerial photograph, and much more clearly the 1953 orthophoto, shows a plantation of olive trees set in rows spaced between 5 m and 8 m apart that extended over the entire area of the terraces and thus also occupied the vineyard area of 1821. Some of the olive trees still survive today (Figure 16E). It seems, therefore, that also in Punta Križa in response to phylloxera, vines were abandoned and replaced by olive trees. Cres was well known for its olive oil, which was regarded as being of the highest quality [9] (p. 9). Both photographs also show the densely forested holm oak area in the north that still exists today.

5.2.5. Phase 1

The most recent phase is represented by modern single-faced dry stone walls seemingly built on top of the massive stone deposits surrounding the olive tree plantation, while double walls enclose the area of the holm oaks. They might indicate a change of a previously only agrarian land into agro-pastoral use. These thin walls still stand to heights of between approx. 0.5 m and 2 m. They are mapped on the Croatian Base Map (produced after 1954 with a recent update in 2010) and are seen as an indicator for sheep farming [7] (p. 49). Keeping sheep within an olive tree plantation is known from the 1920s on the island of Cres, and recognised as beneficial being introduced around the city of Cres in 1956 [9] (p. 7). The single walls on top of the massive clearance deposits might therefore hint at this kind of agro-pastoral use. The rectangular 8 by 15 m structure (Figure 34) might be seen as a sheep shelter in connection with this phase. However, it is not located at the corner of the parcel as would be usual. Today, with the exception of the holm oaks in the north, the area is covered by secondary vegetation caused by several decades of agricultural abandonment.

6. Discussion

The results presented above show a complex, multi-layered landscape, albeit a discrete area. Despite the fact their material basis is long-lasting, dry stone structures are often subject to decay, robbing, rebuilding, and reshaping. This is especially true of field systems, whose material remains are usually highly complex aggregations of events and processes of which only aspects are observable archaeologically. It is thus unsurprising if such landscape remains are inherently chaotic. The challenge presented by this inherent characteristic of the field remains is magnified many times if overgrown by dense vegetation and difficult to access and investigate.
Fortunately, we can document this kind of landscape with airborne laser scanning, providing detailed digital feature models that provide a representation of the terrain, whether archaeological in origin or not. These DFMs can be visualized using a variety of techniques resulting in informative and aesthetically appealing images, with the cVAT visualization in Figure 2d, for example, extremely useful and easily understood. However, these visualizations do not stand by themselves. Where the objective is to develop detailed landscape understanding, the data need to be interpreted by knowledgeable persons with expertise in the relevant field of research, as it is only such detailed examination of the data that provide the requisite information.
Underpinning this approach is a thorough understanding of data characteristics and methods, aspects of which are often a black box of unstated assumptions. Obtaining an optimal dataset in a challenging landscape as is presented here (coastal area and dense, evergreen vegetation) is difficult, if not unrealistic. The green laser is not ideal for scanning through the dense vegetation on land. Firstly, a green laser with a small footprint can only be operated with low energy due to eye safety risks, and secondly, the laser is tilted forward by 20° to the direction of flight. Neither characteristic is ideal when it comes to penetrating dense vegetation (see [59] (p. 9972)), though useable data was nevertheless produced. However, it has been applied during a methodological study to document both terrestrial and submerged archaeological terrain structures in high detail in 3D. This allows for the inclusion of shallow-water zones into our interpretation, which is important as the case study area is in a coastal setting. Even though our case study did not contain any submerged structures, numerous traces can be found further along the coast [50]. Ideally, the area should be documented with both a green and an infrared laser, but this would have been beyond our financial reach. For our interpretation, we had to use available data—a ‘real world’ scenario rather than an ideal one. Still, the crucial issue here is to understand the character of the datasets and so assess potential impacts on interpretation; see also [86,87].
When working with ALS it is important to understand that any classification of a point cloud and the subsequent ground point filtering is based on custom specifications and processed using specific algorithms and settings. Any DFM is therefore the result of interpolation of a filtered point cloud, which may have a highly uneven point distribution (e.g., see Figure 6a). Therefore, the shape of objects is to a certain extent incompletely captured and thus the feature “model” may not directly represent reality (it is a “model” after all). For example, terrace risers are vertical features and should appear in any visualization without horizontal displacement as steps. Due to the relatively low point density and the resulting DFM with a ground sampling distance of 0.5 m, terrace risers appear as low embankments, as can be seen in a cross-section (Figure 24a) and are therefore mapped as polygons instead of linear features (Figure 25). In very densely overgrown areas, where ground point filtering becomes extremely difficult, the shape of objects may be distorted (e.g., the 6 m × 4 m rectangular ruined building in Figure 22d) or they may be entirely missing. Furthermore, the shapes of objects may appear differently in various visualizations and the final mapping may differ slightly depending on the visualization or combination of visualizations used. This shows that, just as a DFM is only one of many possible models of terrain, an interpretative mapping is essentially a model of reality. The robustness of that model will reflect the care taken to understand issues such as the parameters for data processing and other aspects of the workflow, a key point that lies behind the stepwise explicit approach described above.
In this context, it is important to recognize the strength and weaknesses of particular data sources or approaches to interpretative mapping. Thus, while desk-based interpretation of DFM-derived visualizations allows the user to view the landscape in a multitude of ways that cannot be achieved on the ground, field observation introduces bodily engagement with the remains and the capacity to examine matters of detail. This highlights the importance of recognizing that any archaeological interpretation of prospection data is an iterative process that is at its most effective when it generates both questions and answers. This should be a key contribution to archaeological prospection—that interpretative mapping and understanding is a prerequisite to formulating competent research questions that may be addressed by other techniques (e.g., excavation). In this position, the contingency of an interpretation is recognized as a statement of current knowledge based on methodology and technology. Thus, to a certain extent, what we map is provisional but should also be regarded as a rigorously developed hypothesis of the landscape evolution of the case study area built on archaeological interpretation and placed in a historical context. This presents a general narrative that advances landscape understanding but also serves as a basis for formulating further research questions. Crucially, by applying the methods described above, an interpretation is transparent and repeatable, and can be challenged, modified, discarded or verified as new evidence comes to light.
The case study presented here is based on a stratigraphic analysis of dry stone structures in a specific landscape type, in which interpretation and mapping are very challenging. Nevertheless, the complexity of numerous overlapping and temporally staggered features can be interpreted archaeologically through an appropriate methodological approach. To do this, in addition to mapping the individual features in a spatial database, it is necessary to represent their temporal dimension, in this case by using a Harris Matrix. The capacity to resolve overlapping objects stratigraphically in a DFM is essential for diachronic interpretation.
The stratigraphic sequence developed has to be regarded as a (logically correct) model that is being proposed and reviewed in the field. Although confirmation is not always possible using our non-invasive approach, our proposed model is an evidence-based, coherent narrative governed by (stratigraphic) rules. In our case study, the evidence could be chronologically divided into five phases that can be translated into a historical narrative, albeit the division of phases or time periods is simplified and idealised in many respects. While this simplification is essential to rationalising this complex dry stone wall landscape, the reality is certainly even more complicated. Individual objects may not have been present throughout the entire phase, may have been altered, or may have overlapped with the preceding or subsequent period. Thus, the division into phases made here can encourage thinking that does limited justice to the complexity of processes in the landscape over time and across space. Even with clues to a more detailed chronological classification of individual phases, dating of landscape features is complex and may rarely provide ‘absolute dates’—especially when the process-driven elements of the landscape (soils, terraces, stone clearance) by definition may mix material from many periods and can aggregate in deposits that might be judged to be a ‘phase’; see also [78].
In exploring such landscapes, field observation was crucial, and without it, our interpretation would have looked quite different. The type of dry stone walls (e.g., single or double), for example, would have been difficult to distinguish without interpretation keys collected during field observation, while stratigraphic evidence in the form of wall joints or different stone material can only be observed on site. Due to the difficulty of the terrain, the entire area could not be studied in detail on site. Thus, field visits initially concentrated on the western part of the case study area, where most of the stratigraphic interrelationships were already identified during the desk-based interpretation. So, while additional field observation would have been helpful in some cases, for the most part, the combination of desk-based mapping and targeted field observation to address specific questions worked effectively. The 10-year gap between the acquisition of the laser data and the field visits did not appear to have had much impact. No major alterations in terrain were detected, and we did not observe any instances where changes in individual features (e.g., the collapse of drystone walls) would have affected our interpretation.
As with all other prospection techniques, thorough interpretation of ALS-based DFMs requires contextual information provided by contemporary and historical aerial photographs, thematic and historical maps as well as ground visits. A source critical approach has been taken to all these sources (see also [88]), for example in acknowledging the implications that historical maps are interpretative and selective representations of the world mediated through the lens of the context in which they were created and the objectives of mapping [89]. They will only show features relevant to the original mapping purpose. The Croatian Base Map, for example, does not show the entirety of dry stone walls. Decayed walls and walls difficult to see and access under dense canopy seem to be missing. The Franciscan Cadastral Map only depicts land use that was relevant for taxation purposes. The cadastral boundaries are mapped as lines without any specific signature that might give a clue on their physical manifestation (e.g., fence, dry stone wall). There is no topographic information nor a hint of the terracing of a field. It is also important to understand that if an object (e.g., a hollow way or path) does not show up on a map, it does not necessarily imply that it was not present at the time of mapping. If it is depicted, it was present, probably in use, and fell within the scope of the mapping. If such an object can be identified in our ALS-based DFM, it provides a temporal anchor both in the GIS map and in the Harris Matrix.

7. Conclusions

The case study described above clearly demonstrates the value of airborne laser scanning for landscape archaeology, providing a detailed understanding of a complex suite of remains. While the remains mapped across the study area do not conform to some concepts of traditional archaeological ‘sites’, interpretative mapping has provided extensive archaeological information for at least five phases of agricultural and industrial use of what might be characterized as “non-site” areas. The development of a coherent and explicit narrative has been built on the understanding of issues such as the characteristics of the terrain model and its derivatives, considerations of scale and levels of detail, and selectivity about what to interpret. A fundamental point is that the mapping has benefited from a decision to proceed stratigraphically, as far as possible, by first mapping the youngest (recent) objects and progressively older structures intersected by them. Validation of the procedure is provided by a simultaneously edited Harris Matrix, which allows spatially disparate features to be articulated in a common framework and immediately shows possible stratigraphic misinterpretations. Such an approach requires a good understanding of a feature’s context and temporal sequence before mapping it which is based on indispensable additional data sources such as modern and historic orthophotos and maps. Throughout, a source-critical approach is required, as exemplified in this case study by the attention paid to this issue with respect to the ALS dataset.
The landscape of Punta Križa is without question complex and undoubtedly messy [90], but it is also rich in information about its past. While such landscapes are challenging to interpret, the application of the concepts and methods described above provides an explicit and accountable approach to identifying the order and patterning that is evident and placing what can otherwise appear chaotic in a broad framework that supports further exploration. In this respect, the multitude of features mapped in a postage stamp-sized study area of only 20 hectares on the Croatian coast brings to light a multi-layered archaeological landscape that has the potential to change our view of the region. Moreover, the approach applied has clear relevance to the challenges of dealing with such complexity in landscapes wherever it may occur.

Author Contributions

M.D.: conceptualization, data curation (processing of DFM, archaeological interpretation), investigation, methodology, fieldwork, illustrations, writing—original draft. N.D.: project administration, conceptualization, fieldwork, writing, review, and editing. D.C.: methodology, writing, review, and editing. All authors have read and agreed to the published version of the manuscript.

Funding

The airborne laser scan was funded by RGZM Mainz, Germany during the project “Harbors and landing places on the Balkan coasts of Byzantine empire (4th–12th century). Technology and monuments, economy and communication” (DFG SPP 1630).

Data Availability Statement

The data presented in this study are available on request from the corresponding author. The data are not publicly available for copyright reasons.

Acknowledgments

The authors thank to Tanja Kremenić for discussion on the agro-pastoral cultural landscapes of the island of Cres. We also thank Zrinka Ettinger-Starčić, Neno Starčić and Igor Miholjek for sharing their expertise about the Cres-Lošinj archipelago and their friendly support during the underwater and terrestrial survey. Special thanks also go to Franz David Eschner for his support during the field visits in the maquis of Punta Križa. Our thanks also go to our reviewers for their constructive comments.

Conflicts of Interest

The authors declare no conflict of interest.

References

  1. Lewis, P.F. Axioms for Reading the Landscape: Some Guides to the American Scene. In The Interpretation of Ordinary Landscapes; Meinig, D.W., Ed.; Oxford University Press: New York, NY, USA, 1979; pp. 11–32. ISBN 0-19-502536-9. [Google Scholar]
  2. Rossignol, J.; Wandsnider, L. (Eds.) Space, Time, and Archaeological Landscapes; Springer: Boston, MA, USA, 1992. [Google Scholar]
  3. Neustupný, E. (Ed.) Space in Prehistoric Bohemia; Institute of Archaeology: Praha, Czech Republic, 1998; ISBN 8086124096. [Google Scholar]
  4. Banning, E.B. Archaeological Survey; Kluwer Academic/Plenum Publishing: New York, NY, USA, 2002. [Google Scholar]
  5. Bintliff, J.L. The concepts of ‘site’ and ‘off-site’ archaeology in surface artefact survey. In Non-Destructive Techniques Applied to Landscape Archaeology; Pasquinucci, M., Trément, F., Eds.; Oxbow Books: Oxford, UK, 2000; pp. 200–215. ISBN 978-1900188746. [Google Scholar]
  6. Varotto, M. (Ed.) World Terraced Landscapes; Springer: Cham, Switzerland, 2019; ISBN 978-3-319-96815-5. [Google Scholar]
  7. Kremenić, T. Valorisation of the Dry Stone Wall Heritage of the Cres-Lošinj Archipelago. Ph.D. Thesis, University of Padova, Padova, Italy, 2022. [Google Scholar]
  8. UNESCO. Art of Dry Stone Walling, Knowledge and Techniques. Available online: https://ich.unesco.org/en/RL/art-of-dry-stone-walling-knowledge-and-techniques-01393 (accessed on 15 September 2022).
  9. Kremenić, T.; Andlar, G.; Varotto, M. How Did Sheep Save the Day? The Role of Dry Stone Wall Heritage and Agropastorality in Historical Landscape Preservation. A Case-Study of the Town of Cres Olive Grove. Land 2021, 10, 978. [Google Scholar] [CrossRef]
  10. 4 Grada—Dragodid. O Suhozidnoj Baštini i Vještini Gradnje/about Dry Stone Heritage and Construction Skills. Available online: http://www.dragodid.org/ (accessed on 15 September 2022).
  11. Suhozid.hr. Open Public Inventory of the Croatian Dry Stone Heritage. Available online: www.suhozid.hr (accessed on 15 September 2022).
  12. Marijanović, B. Pokrovnik—Primjer ograđenoga neolitičkog naselja/Pokrovnik—An Example of an Enclosed Neolithic Settlement. Pril. Inst. Arheol. Zagreb. 2017, 34, 5–44. [Google Scholar]
  13. Moore, A.M.T. Early Farming in Dalmatia: Pokrovnik and Danilo Bitinj: Two Neolithic Villages in Southeast Europe; Archaeopress Publishing Ltd.: Oxford, UK, 2019; ISBN 978-1-78969-158-0. [Google Scholar]
  14. Chapman, J.; Shiel, R.; Batović, Š. The Changing Face of Dalmatia: Archaeological and Ecological Studies in a Mediterranean Landscape; Leicester Univ. Press: London, UK, 1996; ISBN 0718500482. [Google Scholar]
  15. Buršić-Matijašić, K. Gradinska Naselja: Gradine Istre u Vremenu i Prostoru/Klara Buršić-Matijašić; Leykam International: Zagreb, Croatia, 2008; ISBN 978-953-7534-20-2. [Google Scholar]
  16. Batovič, Š. Benkovački Kraj u Prapovijesti; Matica Hrvatska: Zadar, Croatia, 2004; ISBN 9536419343. [Google Scholar]
  17. Sirovica, F. Pod near Bruška—Site analysis with a view on prehistoric drywall architecture. Opusc. Archaeol. 2014, 37–38, 50–93. [Google Scholar] [CrossRef]
  18. Čavić, A. Starogradsko polje kao kultivirani poljoprivredni krajolik kroz povijest (The Field of Stari Grad as a Cultivated Agricultural Landscape Through History). Pril. Povij. Otoka Hvar. 2017, 13, 29–42. [Google Scholar]
  19. Popović, S.; Bulić, D.; Matijašić, R.; Gerometta, K.; Boschian, G. Roman land division in Istria, Croatia: Historiography, lidar, structural survey and excavations. Mediterr. Archaeol. Archaeom. 2021, 21, 165–178. [Google Scholar] [CrossRef]
  20. Bradford, J. Ancient Landscapes: Studies in Field Archaeology; Bell & Sons: London, UK, 1957. [Google Scholar]
  21. Vinci, G.; Bernardini, F.; Furlani, S. Geo-archaeology of the Grozzana area (N–E Italy). J. Maps 2019, 15, 697–707. [Google Scholar] [CrossRef]
  22. Andlar, G.; Šrajer, F.; Trojanović, A. Classifying the Mediterranean terraced landscape: The case of Adriatic Croatia. Acta Geogr. Slov. 2017, 57, 111–129. [Google Scholar] [CrossRef]
  23. Andlar, G.; Šrajer, F.; Trojanović, A. Discovering Cultural Landscape in Croatia: History and Classification of Croatian Adriatic Enclosed Landscape. Ann. Ser. Hist. Sociol. 2018, 28, 759–778. [Google Scholar] [CrossRef]
  24. Benac, Č.; Juračić, M.; Matičec, D.; Ružić, I.; Pikelj, K. Fluviokarst and classical karst: Examples from the Dinarics (Krk Island, Northern Adriatic, Croatia). Geomorphology 2013, 184, 64–73. [Google Scholar] [CrossRef]
  25. Bognar, A.; Faivre, S.; Buzjak, N.; Pahernik, M.; Bočić, N. Recent Landform Evolution in the Dinaric and Pannonian Regions of Croatia. In Recent Landform Evolution: The Carpatho-Balkan-Dinaric Region; Lóczy, D., Stankoviansky, M., Kotarba, A., Eds.; Springer: Dordrecht, The Netherlands, 2012; pp. 313–344. ISBN 978-94-007-2448-8. [Google Scholar]
  26. Ford, D.C.; Williams, P.W. Karst Hydrogeology and Geomorphology, Rev. ed.; John Wiley & Sons: Chichester, UK; Hoboken, NJ, USA, 2007; ISBN 9780470849965. [Google Scholar]
  27. Fuček, L.; Matiček, D.; Vlahović, I.; Oštrić, N.; Prtoljan, B.; Korbar, T.; Husinec, A. Basic Geological Map of the Republic of Croatia, Scale 1:50,000: Sheet Cres 2, (417/2); 1 sheet; Croatian Geological Survey (Department of Geology): Zagreb, Croatia, 2014; ISBN 978-953-6907-26-7. [Google Scholar]
  28. Lambeck, K.; Anzidei, M.; Antonioli, F.; Benini, A.; Esposito, A. Sea level in Roman time in the Central Mediterranean and implications for recent change. Earth Planet. Sci. Lett. 2004, 224, 563–575. [Google Scholar]
  29. Faivre, S.; Fouache, E.; Kovačić, V.; Glušćević, S. Geomorphological and archaeological indicators of Croatian shoreline evolution over the last two thousand years. GeoActa Spec. Publ. 2010, 3, 125–133. [Google Scholar]
  30. Draganits, E.; Gier, S.; Doneus, N.; Doneus, M. Geoarchaeological evaluation of the Roman topography and accessibility by sea of ancient Osor (Cres Island, Croatia). Austrian J. Earth Sci. 2019, 112, 1–19. [Google Scholar] [CrossRef]
  31. Brunović, D.; Miko, S.; Hasan, O.; Papatheodorou, G.; Ilijanić, N.; Miserocchi, S.; Correggiari, A.; Geraga, M. Late Pleistocene and Holocene paleoenvironmental reconstruction of a drowned karst isolation basin (Lošinj Channel, NE Adriatic Sea). Palaeogeogr. Palaeoclimatol. Palaeoecol. 2020, 544, 109587. [Google Scholar] [CrossRef]
  32. Dlaka, I.; Križa, P. Prostor, vrijeme ljudi. In Punta Križa. Exhibition Catalog; Lošinjski Muzej, Ed.; Sveučilišne Knjižnice Rijek: Rijeka, Croatia, 2011; pp. 5–17. ISBN 978-953-55837-4-5. [Google Scholar]
  33. Mirosavljević, V. Jama na Sredi. Arheol. Rad. Raspr. 1959, 1, 131–169. [Google Scholar]
  34. Starac, R. Arheološka Baština Punte Križe; Exhibition Catalogue Punta Križa; Arheoloski Muzej: Mali Losinj, Croatia, 2011; pp. 19–35. [Google Scholar]
  35. Ćus-Rukonić, J. Arheološka Topografija Otoka Cresa i Lošinja (Archaeological Topography of the islands of Cres and Lošinj); Izdanja HAD; Hrvatsko Arheolosko Drustvo: Zagreb, Croatia, 1982; Volume 7, pp. 9–17. [Google Scholar]
  36. Blečić Kavur, M. Get the Balance Right! Osor in Balance of European Cultures and Civilizations in the Last Centuries BC; University of Primorska Press: Koper, Slovenia, 2014; ISBN 978-961-6832-84-7. [Google Scholar]
  37. Blečić Kavur, M. A Coherence of Perspective: Osor in Cultural Contacts during the Late Iron Age; University of Primorska Press: Koper, Slovenia; Mali Lošinj, Croatia, 2015. [Google Scholar]
  38. Mohorovičić, A. Pregled i analiza novootkrivenih objekata historijske arhitekture na području grada Osora. Bull. Razreda Likovne Umjet. Jugosl. Akad. Znan. Umjet. 1953, 1–2, 10–16. [Google Scholar]
  39. Faber, A. Osor-Apsorus iz aspekta antičkog pomorstva. Diadora 1980, 9, 289–317. [Google Scholar]
  40. Doneus, N.; Doneus, M.; Ettiner-Starčić, Z. The ancient city of Osor, northern Adriatic, in integrated archaeological prospection. Hortus Artium Mediev. 2017, 23, 761–775. [Google Scholar] [CrossRef] [Green Version]
  41. Čaušević-Bully, M.; Bully, S. Esquisse d’un paysage monastique insulaire dans le nord de l’Adriatique: L’archipel du Kvarner (Croatie). Hortus Artium Mediev. 2013, 19, 167–182. [Google Scholar] [CrossRef]
  42. Čaušević-Bully, M.; Bully, S.; Delliste, A.; Lefebvre, S.; Mureau, C. Les sites ecclésiaux et monastiques de l’archipel du Kvarner (Croatie), campagne 2019: Martinšćica (île de Cres). Bull. Archéol. Éc. Fr. L’étrang. 2021, 1–47. [Google Scholar] [CrossRef]
  43. Stražičić, N. Otok Cres. Prilog Poznavanju Geografije Naših Otoka; Otokar Keršovani: Pula, Croatia, 1981. [Google Scholar]
  44. Gović, V. Povijesne odrednice Puntarskog gospodarstva. In Punta Križa. Exhibition Catalog, Lošinjski Muzej, ed.; Sveučilišne Knjižnice Rijeka: Rijeka, Croatia, 2011; pp. 51–59. ISBN 978-953-55837-4-5. [Google Scholar]
  45. Gović, V. Organizacija i prostorno oblikovanje pastirskih stanova. In Punta Križa Exhibition Catalog; Lošinjski Muzej, Ed.; Sveučilišne Knjižnice Rijeka: Rijeka, Croatia, 2011; pp. 60–69. ISBN 978-953-55837-4-5. [Google Scholar]
  46. Margetić, L. Srednjovjekovni Zakoni i Opći Akti na Kvarneru; Nakladni Zavod Globus, Naklada Kvarner, Pravni Fakultet Sveučilišta u Rijeci: Zagreb, Croatia; Rijeka, Croatia, 2012; ISBN 978-953-167-212-2. [Google Scholar]
  47. Kokalj, Ž.; Somrak, M. Why Not a Single Image? Combining Visualizations to Facilitate Fieldwork and On-Screen Mapping. Remote Sens. 2019, 11, 747. [Google Scholar] [CrossRef]
  48. Archivio di Stato di Trieste. Catasto di Trieste/Catasto Franceschino/Serie “Mappe des Catasro Franceschino”/Sottoserie—Distritto di Cherso/Sotto-Sottoserie—Commune di Punta Croce. Available online: https://a4view.archiviodistatotrieste.it/patrimonio/2df6e5d3-f760-47c0-b917-1e1a477b2087/sotto-sottoserie-comune-di-punta-croce (accessed on 15 September 2022).
  49. Državni Zavod za Statistiku. Popis. 2021. Available online: https://popis2021.hr/ (accessed on 15 September 2022).
  50. Doneus, M.; Doneus, N.; Briese, C.; Pregesbauer, M.; Mandlburger, G.; Verhoeven, G. Airborne Laser Bathymetry—Detecting and recording submerged archaeological sites from the air. J. Archaeol. Sci. 2013, 40, 2136–2151. [Google Scholar] [CrossRef]
  51. Doneus, M.; Mandlburger, G.; Doneus, N. Archaeological Ground Point Filtering of Airborne Laser Scan Derived Point-Clouds in a Difficult Mediterranean Environment. J. Comput. Appl. Archaeol. 2020, 3, 92–108. [Google Scholar] [CrossRef]
  52. Lozić, E.; Štular, B. Documentation of Archaeology-Specific Workflow for Airborne LiDAR Data Processing. Geosciences 2021, 11, 26. [Google Scholar] [CrossRef]
  53. Doneus, M.; Briese, C.; Fera, M.; Janner, M. Archaeological prospection of forested areas using full-waveform airborne laser scanning. J. Archaeol. Sci. 2008, 35, 882–893. [Google Scholar] [CrossRef]
  54. Kraus, K.; Pfeifer, N. Determination of terrain models in wooded areas with airborne laser scanner data. ISPRS J. Photogramm. Remote Sens. 1998, 53, 193–203. [Google Scholar] [CrossRef]
  55. Pfeifer, N.; Stadler, P.; Briese, C. Derivation of digital terrain models in the SCOP++ environment. In Proceedings of the OEEPE Workshop on Airborne Laserscanning and Inferometric SAR for Detailed Digital Terrain Models, Stockholm, Sweden, 1–3 March 2001; OEEPE: Stockholm, Sweden, 2001. [Google Scholar]
  56. Štular, B.; Lozić, E.; Eichert, S. Airborne LiDAR-Derived Digital Elevation Model for Archaeology. Remote Sens. 2021, 13, 1855. [Google Scholar] [CrossRef]
  57. Štular, B.; Eichert, S.; Lozić, E. Airborne LiDAR Point Cloud Processing for Archaeology. Pipeline and QGIS Toolbox. Remote Sens. 2021, 13, 3225. [Google Scholar] [CrossRef]
  58. Kraus, K. Interpolation nach kleinsten Quadraten versus Krige-Schätzer. Österr. Zeitschr. Vermess. Geoinf. 1998, 86, 45–48. [Google Scholar]
  59. Fernandez-Diaz, J.; Carter, W.; Shrestha, R.; Glennie, C. Now You See It… Now You Don’t: Understanding Airborne Mapping LiDAR Collection and Data Product Generation for Archaeological Research in Mesoamerica. Remote Sens. 2014, 6, 9951–10001. [Google Scholar] [CrossRef]
  60. Zakšek, K.; Oštir, K.; Kokalj, Ž. Sky-View Factor as a Relief Visualization Technique. Remote Sens. Environ. 2011, 3, 398–415. [Google Scholar] [CrossRef]
  61. Fuhrmann, S. Digitale Historische Geobasisdaten im Bundesamt für Eich- und Vermessungswesen (BEV). Die Urmappe des Franziszeischen Kataster. Vermess. Geoinf. 2007, 95, 24–35. [Google Scholar]
  62. Timár, G.; Biszak, S.; Székely, B.; Molnár, G. Digitized Maps of the Habsburg Military Surveys—Overview of the Project of ARCANUM Ltd. (Hungary). In Preservation in Digital Cartography: Archiving Aspects, 1st ed.; Jobst, M., Ed.; Springer: Berlin, Germany, 2010; pp. 273–283. ISBN 978-3-642-12733-5. [Google Scholar]
  63. Third Military Survey of the Habsburg Empire. Available online: https://maps.arcanum.com/de/map/europe-19century-thirdsurvey (accessed on 15 September 2022).
  64. Državna Geodetska Uprava. Croatian Base Map 1:5000. Available online: https://geoportal.dgu.hr/metadataeditor/apps/metadataui/print.html?uuid=21cededd-5101-4f28-ad57-f08fcf7c491a&currTab=simple&hl=hrv (accessed on 15 September 2022).
  65. ARKOD. Agencija za Plaćanja u Poljoprivredi, Ribarstvu i Ruralnom Razvoju. Available online: http://preglednik.arkod.hr/ (accessed on 10 February 2021).
  66. Verhoeven, G.J. Mesh Is More—Using All Geometric Dimensions for the Archaeological Analysis and Interpretative Mapping of 3D Surfaces. J. Archaeol. Method Theory 2017, 24, 999–1033. [Google Scholar] [CrossRef]
  67. Štular, B.; Lozić, E. Comparison of Filters for Archaeology-Specific Ground Extraction from Airborne LiDAR Point Clouds. Remote Sens. 2020, 12, 3025. [Google Scholar] [CrossRef]
  68. Grammer, B.; Draganits, E.; Gretscher, M.; Muss, U. LiDAR-guided Archaeological Survey of a Mediterranean Landscape: Lessons from the Ancient Greek Polis of Kolophon (Ionia, Western Anatolia). Archaeol. Prospect. 2017, 24, 311–333. [Google Scholar] [CrossRef]
  69. Doneus, M.; Briese, C. Airborne Laser Scanning in Forested Areas—Potential and Limitations of an Archaeological Prospection Technique. In Remote Sensing for Archaeological Heritage Management, Proceedings of the 11th EAC Heritage Management Symposium, Reykjavik, Iceland, 25–27 March 2010; Cowley, D., Ed.; Archaeolingua, EAC: Budapest, Hungary, 2011; pp. 53–76. ISBN 978-963-9911-20-8. [Google Scholar]
  70. Neubauer, W.; Traxler, C.; Bornik, A.; Lenzhofer, A. Stratigraphy from topography I: Theoretical and practical considerations for the application of the Harris Matrix for the GIS-based spatio-temporal archaeological interpretation of topographical data. Archaeol. Austriaca 2022, 106. in print. [Google Scholar]
  71. Doneus, M.; Neubauer, W.; Filzwieser, R.; Sevara, C. Stratigraphy from Topography II—The practical application of the Harris Matrix for the GIS-based spatio-temporal archaeological interpretation of topographical data. Archaeol. Austriaca 2022, 106. in print. [Google Scholar]
  72. Harris, E.C. Principles of Archaeological Stratigraphy, 2nd ed.; Academic Press: London, UK, 1989. [Google Scholar]
  73. Traxler, C.; Neubauer, W. The Harris Matrix Composer—A New Tool to Manage Archaeological Stratigraphy. In Digital Heritage, Proceedings of the 14th International Conference on Virtual Systems and Multimedia, Limassol, Cyprus, 20–25 October 2008; Ioannides, M., Ed.; Archaeolingua: Budapest, Hungary, 2008; pp. 13–20. ISBN 978-963-9911-00-0. [Google Scholar]
  74. Hesse, R. LiDAR-derived Local Relief Models—A new tool for archaeological prospection. Archaeol. Prospect. 2010, 17, 67–72. [Google Scholar] [CrossRef]
  75. Software: QField; The QField Project/OPENGIS.ch. 2019. Available online: https://qfield.org/ (accessed on 15 September 2022).
  76. Antonson, H. Revisiting the “Reading Landscape Backwards” Approach: Advantages, Disadvantages, and Use of the Retrogressive Method. Rural. Landsc. Soc. Environ. Hist. 2018, 5, 4. [Google Scholar] [CrossRef]
  77. Archivio di Stato di Trieste. Serie—“Mappe del Catasto Franceschino”. Available online: https://a4view.archiviodistatotrieste.it/patrimonio/85ea26bb-a430-4ac7-b9c4-1019f2bfea90/383-b-14-mappa-catastale-del-comune-di-punta-croce-foglio-xii-sezione-xiv-1821-sec-xix-primo-quarto (accessed on 15 September 2022).
  78. Turner, S.; Kinnaird, T.; Varinlioğlu, G.; Şerifoğlu, T.; Koparal, E.; Demirciler, V.; Athanassoulis, D.; Ødegård, K.; Crow, J.; Jackson, M.J.B.; et al. Agricultural terraces in the Mediterranean: Intensive construction during the later Middle Ages revealed by landscape analysis with OSL profiling and dating. Antiquity 2021, 95, 773–790. [Google Scholar] [CrossRef]
  79. Faričić, J.; Juran, K. Human Footprints in the Karst Landscape: The Influence of Lime Production on the Landscape of the Northern Dalmatian Islands (Croatia). Geosciences 2021, 11, 303. [Google Scholar] [CrossRef]
  80. Bulić, D. Rimska centurijacija Istre. Tabula 2012, 10, 50–74. [Google Scholar] [CrossRef] [Green Version]
  81. Marchiori, A. Infrastrutture Territoriale e Strutture Insediamente Dell’Istria Romana: La Divisione Centuriale di Pola e Parenzo in Rapporto ai Grandi Complessi Costieri Istriani. Il Caso Nord Parentino. Ph.D. Thesis, Università degli Studi di Padova, Padova, Italy, 2010. [Google Scholar]
  82. Suić, M. Limitacija agera rimskih kolonija na istočnoj jadranskoj obali. Zb. Rad. Inst. Hist. Nauk. Zadru 1955, 1, 1–36. [Google Scholar]
  83. Starac, A. Rimsko Vladanje u Histriji i Liburniji II.: Društveno i Pravno Uredenje Prema Literarnoj Natpisnoj i Arheološkoj Gradi; Arheološki Muzej Istre: Pula, Croatia, 2000; ISBN 9536153114. [Google Scholar]
  84. Kadi, M. Centurijacija kopnenog dijela agera rimske kolonije Jadera (Zadar). Rimski katastar. (Centuriation of Continental Part of Iader (Zadar) Roman Colony. Ager Roman cadastre.). Kartogr. Geoinf. 2020, 19, 106–111. [Google Scholar]
  85. Campbell, B. Shaping the Rural Environment: Surveyors in Ancient Rome. J. Rom. Stud. 1996, 86, 74–99. [Google Scholar] [CrossRef]
  86. Banaszek, Ł.; Cowley, D.; Middleton, M. Towards National Archaeological Mapping. Assessing Source Data and Methodology—A Case Study from Scotland. Geosciences 2018, 8, 272. [Google Scholar] [CrossRef]
  87. Cowley, D.; Banaszek, Ł.; Geddes, G.; Gannon, A.R.; Middleton, M.; Millican, K. Making LiGHT Work of Large Area Survey? Developing Approaches to Rapid Archaeological Mapping and the Creation of Systematic National-scaled Heritage Data. J. Comput. Appl. Archaeol. 2020, 3, 109–121. [Google Scholar] [CrossRef] [Green Version]
  88. Cowley, D. What do the patterns mean? Archaeological distributions and bias in survey data. In Digital Methods and Remote Sensing in Archaeology: Archaeology in the Age of Sensing; Forte, M., Campana, S., Eds.; Springer International Publishing: Cham, Switzerland, 2017; pp. 147–170. ISBN 9783319406589. [Google Scholar]
  89. Cosgrove, D. Geography and Vision: Seeing, Imagining and Representing the World; I.B. Tauris: London, UK, 2008; ISBN 9781850438465. [Google Scholar]
  90. Mlekuž, D. Messy landscapes: Lidar and the practices of landscaping. In Interpreting Archaeological Topography: Airborne Laser Scanning, 3D Data and Ground Observation; Opitz, R.S., Cowley, D., Eds.; Oxbow Books: Oxford, UK, 2013; pp. 88–99. ISBN 978-1-84217-516-3. [Google Scholar]
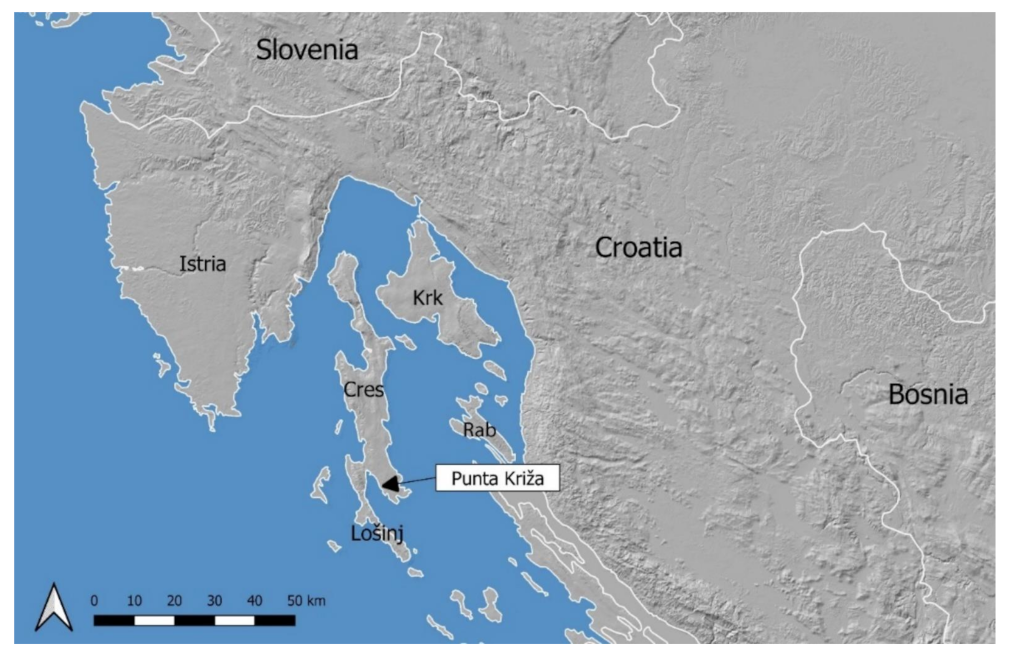
Figure 1. Map of the northern Adriatic indicating the location of the case study area on Punta Križa (at the tip of the arrow).
Land 11 01672 g001
Figure 2. (a) Map of the total area of ALS data capture and the case study area (red box). (b) Orthophotograph of the case study area produced simultaneously with ALS data acquisition (March 2012). (c) Contour lines at 5 m intervals calculated based on low pass filtered digital feature model (DFM; r = 20 m). The zero-contour marks the coastline. (d) Filtered DFM (visualization: cVAT).
Land 11 01672 g002
Figure 3. Oblique aerial photographs. (a) Active agricultural area near Sv. Andrija with olive groves and maintained dry stone walled agricultural fields. (b) Disused agricultural area near Sv. Platon covered by maquis. (Photographs: M. Doneus).
Land 11 01672 g003
Figure 4. (a) Orthophotograph of a part of Punta Križa showing the extent of maquis, where agricultural use has almost stopped. The photograph was produced simultaneously with ALS data acquisition (March 2012). (b) The digital terrain model of the same area reveals a network of dry stone walls that evidence intensive former use. Note that the green laser penetrated the water to a depth of 10 m allowing the sub-surface terrain to be modelled to this depth (visualization: cVAT, i.e., hillshading from three directions, slope, positive openness and sky-view factor—see [47]).
Land 11 01672 g004
Figure 5. 1821 Franciscan Cadastral Map showing the case study area (source: Archivio di Stato di Trieste—Catasto franceschino/Distretto di Cherso/Comune di Punta Croce/mappa XVI, unità archivistica 383 b 14).
Land 11 01672 g005
Figure 6. (a) Map showing the density of ground points after ground point filtering using the “stone wall” setting. Red colours indicate densely vegetated areas with low penetration rates. (b) A point density map of low and medium height vegetation (0–1 m) provides a good estimate of accessibility for ground observation. The red dots show the locations of ground photographs. Nr. 1: Figure 18, Nr. 2: Figure 16E.
Land 11 01672 g006
Figure 7. DFM confidence map showing the suitability of the ground point distribution for a DFM grid size of 0.5 m after classification using the “stone_wall” setting. Almost the entire area shows classes ranging from 4 to 6, which is adequate for interpolation using a 0.5 m grid.
Land 11 01672 g007
Figure 8. Second World War reconnaissance photograph taken on 28 April 1944 covering the southern part of the island of Cres between Osor (top) and Punta Križa (bottom of overview image). The arrow identifies the case study area. Copyright: NCAP/ncap.org.uk. (Frame number 5039, sortie 60PR/0366, 28 April 1944).
Land 11 01672 g008
Figure 9. The tablet device in the field. QField was used to view and edit GIS layers in the field, with the current GPS position visible on the screen (the small white dot in the centre of the tablet). (Photo: M. Doneus, 1 September 2021).
Land 11 01672 g009
Figure 10. Interpretative mapping of the case study area (red polygons) which is a small part of the archaeological interpretation of the entire laser scan (white polygons). (Visualization: cVAT).
Land 11 01672 g010
Figure 11. Final Harris Matrix of features in the case study area.
Land 11 01672 g011
Figure 12. (a) Orthophotograph produced simultaneously with the ALS data acquisition in March 2012. As on-site stratigraphical observations show, the recent dry stone wall is built on top of a stone deposit 6 m across. Both are interrupted by a recent path (white circle). (b) Positive Openness and Multiple hillshade showing the clear signature of modern dry stone walls (DFM filtered with “stone_wall” setting). Black arrows point at single, white arrows point at double walls. (c) Single wall on top of massive stone deposit. (d) Double wall (Photo: M. Doneus, 13 April 2022).
Land 11 01672 g012
Figure 13. Interpretative map of recent dry stone walls. (a) bounding wall, (b) area with a rough surface texture containing (c) lime kilns, (d) area covered with many small and some larger stones, (e) area cleared of larger stones (visualization: cVAT).
Land 11 01672 g013
Figure 14. (a) The slope map shows a 8 m wide slope with a gradient of 25°. The edges of the slope are marked with pecked lines. (b) In the LRM (here a combination of LRM(20) and MH), features “1” and “2” have similar signatures, which suggests that they are raised areas that might be interpreted as banks. However, feature “1” is part of the slope (indicated by the pecked lines), rather than a bank and ditch as implied by the LRM.
Land 11 01672 g014
Figure 15. (a) The massive stone clearance deposits have a clear signature in the Negative Openness (r = 10) from the DFM filtered with “stone_wall” setting. (b) Interpretation map of massive stone deposits. White arrows point to deposits heaped up against double dry stone walls; black arrows, where deposits might overlie earlier double dry stone walls (Visualization: cVAT). (c) 1953 Digital Orthophoto Map (source: State Geodetic Administration Geoportal/Geoportal Državne geodetske uprave—geoportal.dgu.hr). The massive stone deposits are clearly visible. The area occupied by the deposits is characterized by horticulture. (d) On-site photograph of stone deposit. The black arrow on (c) shows the position and viewing direction (Photo: M. Doneus, 13 April 2022).
Land 11 01672 g015
Figure 16. (AC) Grid of platforms measuring 8 by 8 m as seen in the dense_veg filtered DFM (visualization: slope). (D) Overlying the outline of the platforms with the 1953 Digital Orthophoto Map shows a tree on each platform (source: State Geodetic Administration Geoportal/Geoportal Državne geodetske uprave—geoportal.dgu.hr). (E) A live tree in this area (Photo: M. Doneus, 2 September 2021).
Land 11 01672 g016
Figure 17. Stone deposit 4359 (1) is heaped up against the north face of the building (2) and therefore must be later than the construction of the building. (a) View direction south showing the north face of the building. (b) View direction east with a view of the west face of the building (Photos: M. Doneus, 13 April 2022).
Land 11 01672 g017
Figure 18. Holm oaks in the area along the bounding wall towards the north (see Figure 13d).
Land 11 01672 g018
Figure 19. Map of double dry stone walls and stone deposits. The arrow points to the location of Figure 20 (visualization: cVAT). (a,b) continuation of the outer wall against which the clearance stones were piled, (c) enclosing wall, (d) massive stone deposit maybe burying double walls, (e) eroded wall older than 1821, (f) double wall partly buried by massive stone deposit. See text for further explanation.
Land 11 01672 g019
Figure 20. (a) Double dry stone wall against which (b) clearance stones are piled. The double wall extends to the north, while the clearance stones in the photograph are the northern end of a massive stone deposit continuing to the south. The position of this photograph is marked by the white arrow in Figure 19. (Photo: M. Doneus, 13 April 2022).
Land 11 01672 g020
Figure 21. Transcription of the 1821 Franciscan Cadastral Map (source: Archivio di Stato di Trieste—Catasto franceschino/Distretto di Cherso/Comune di Punta Croce/mappa XVI, unità archivistica 383 b 14) with ALS-based features. The red colour fields indicate the vineyard. The arrow indicates the building shown in Figure 22 (background visualization: cVAT). For explanation, see the text.
Land 11 01672 g021
Figure 22. Remains of a building. (a) Transcription of the 1821 Franciscan Cadastral Map (source: Archivio di Stato di Trieste—Catasto franceschino/Distretto di Cherso/Comune di Punta Croce/mappa XVI, unità archivistica 383 b 14), (b) Digital Orthophoto Map from 1953 (source: State Geodetic Administration Geoportal/Geoportal Državne geodetske uprave—geoportal.dgu.hr), (c) orthophotograph from 2012, (d) DFM based on stone_wall settings (visualization: pOp(10) and MH).
Land 11 01672 g022
Figure 23. (a) Terrace riser running along the slope (b) Terrace riser (1) covered by a massive stone clearance deposit (2). (Photos: M. Doneus, 13 April 2022).
Land 11 01672 g023
Figure 24. Screenshots of a QGIS session using the profile tool. (a) Surface profiles help to distinguish terrace slopes (b) from slopes that are overlain by a stone deposit (visualization: slope).
Land 11 01672 g024
Figure 25. Interpretative mapping of terrace slopes (visualization: combination of slope, hillshade, and Negative Openness (r = 10)).
Land 11 01672 g025
Figure 26. A stratigraphically younger terrace slope (see arrows) runs along the south-west edge of the forest (compare Figure 13d and Figure 15c). Visualization: (a) MH based on dense_veg filter setting, (b) pOp(10).
Land 11 01672 g026
Figure 27. (a) Double wall that runs across the slope and borders the terraced area to the west seems to overlie some of the terrace slopes. (b) The pecked lines indicate terrace slopes that are overlain by the massive wall that borders the terraced area to the west (visualization: pOp(10)).
Land 11 01672 g027
Figure 28. Section of a straight bank (arrows) that may extend to a total length of about 1.000 m shown in the LRM (r = 50) (DFM filtered with “dense_veg” setting) combined with MH (DFM filtered with “stone_wall” setting).
Land 11 01672 g028
Figure 29. The long straight bank (a) in the inland area where it is heavily eroded and (b) at the shore where it comprises a bank built of stones indicated by the arrow (collapsed dry stone wall?). (c) What may be a regular system of field boundaries is evidenced by both well-defined banks (solid white lines) (d) and very ephemeral remains (pecked lines) (visualization: LRM(20) and cVAT).
Land 11 01672 g029
Figure 30. The wall indicated as a white linear signature in the pOp(10) visualization (a) must be of older date as it is marked on the transcription of the 1821 Franciscan Cadastral Map (source: Archivio di Stato di Trieste—Catasto franceschino/Distretto di Cherso/Comune di Punta Croce/mappa XVI, unità archivistica 383 b 14) from (b) and is stratigraphically older than the enclosure wall (Figure 31). (c) Remains of the dry stone wall as observed on site (Photo: M. Doneus, 13 April 2022).
Land 11 01672 g030
Figure 31. Wall joint on the enclosure wall at the intersection with the earlier wall in Figure 29a. (a) View looking north and (b) view looking south. (Photographs: M. Doneus 13 April 2022).
Land 11 01672 g031
Figure 32. A group of pits interpreted as lime kilns and extraction pits (visualization: slope and MH (DFM filtered with “dense_veg” setting) combined with LRM(20) (DFM filtered with “stone_wall” setting)).
Land 11 01672 g032
Figure 33. Distribution of lime kilns around the archaeological site of Martinšćica. The western most symbol marks the site of our case study area, which is outlined in black (visualization: cVAT).
Land 11 01672 g033
Figure 34. The green structure outlines the rectangular enclosure—see text for further detail (visualization: LRM(20) and cVAT).
Land 11 01672 g034
Figure 35. Bounding wall photographed at the point where it meets the coastline. The wall is depicted on the 1821 Franciscan map and remained in use until recently (Photo: M. Doneus, 1 September 2021).
Land 11 01672 g035
Table 1. Parameters of ALS data acquisition and processing.
TitleHarbours and Landing Places on the Balkan Coasts of Byzantine Empire (4th to 12th Centuries). Technology and Monuments, Economic and Communication.
PurposeArchaeology (combined land and underwater survey)
Date29 March 2012
OperatorAirborne Technologies
Scanner typeFull-waveform with online waveform processing
InstrumentRIEGL VQ-820-G
Pulse repetition rate200 kHz
Wavelength532 nm
Scanning angle60°
Additional sensorsIGI Digicam H-39
Altitude above ground450 m
Flight strip overlap70%
Footprint diameter0.45 m
Average laser pulse density per m216
Average ground points per m25.1 (“dense_veg.”)–5.5 (“stone_wall”)
LAS format1.2
Coordinate SystemEPSG:25833–ETRS89/UTM zone 33N
Strip AdjustmentYes, using OPALS
Ground-point filteringSCOP++
Table 2. Filter steps and relevant parameters for both filter strategies defined within the framework of SCOP++.
StepsStep NameParameters“stone_wall”“dense_veg”
1Step 1ThinOutCell size:23
Thinning methodlowestk-th lowest
Level k:--3
Step 2FilterLower branch0.35; 0.35; 1.00.35; 0.35; 1.0
Upper branch:0.1; 0.3; 0.60.05; 0.05; 0.1
TrendOnbelow
Predictionbelowbelow
Penetration rate20%40%
InterpolationGrid width: 0.5 m CU:20 Covariance function: bell curveGrid width: 1.5 m CU:20 Covariance function: bell curve
Step 3SortOutUpper distance1.63.0
Lower distancenone3.0
Slope dependencynone2.0
2Step 4ThinOutCell size:0.31.5
Thinning methodlowestk-th lowest
Level k:--2
Step 5FilterLower branch0.35; 0.35; 1.00.35; 0.35; 1.0
Upper branch:0.1; 0.3; 0.60.05; 0.05; 0.1
TrendOnBelow
PredictionBelowBelow
Penetration rate20%40%
InterpolationGrid width: 0.25 CU:20 CF: bell curveGrid width: 0.7 CU:20
CF: bell curve
Step 6SortOutUpper distance--1.0
Lower distance--3.0
Slope dependency--2.0
3Step 7ThinOutCell size:--0.5
Thinning method--lowest
Step 8FilterLower branch--0.35; 0.35; 1.0
Upper branch:--0.05; 0.05; 0.1
Trend--Below
Prediction--Below
Penetration rate--40%
Interpolation--Grid width: 0.25 CU:20
CF: bell curve
Step 9Fill Void AreasSampling Interval--2.0
Filling Method--Linear Prediction
Bridging Distance--42.0
Step 10InterpolateGrid width:0.50.5
CU:2525
Covariance function:adaptingadapting
5 Step 11ClassifyOutput formatlaslas
High vegetation5.05.0
Medium vegetation1.01.0
Low vegetation0.250.25
ground
Below DTM−0.25−0.25
Slope dependency----
Table 3. Fields in the spatial database used for the GIS-based interpretation.
Field Name Description
SUStratigraphic Unit—unique identifier that also linked to the stratigraphic unit of the Harris Matrix Composer.
Descriptiondrop-down list with a descriptive parameter, including sunken feature, wall, slope, mound, bank, deposit
Interpretationfunctional classification, as, e.g., agricultural boundary, enclosure, building, kiln, path.
Wall typecharacterization of the type of a dry stone wall
Groupname of grouped features assigned during interpretation
Phasechronological phase (a field filled at a late stage in mapping when phasing has been completed.
Basemap/Fr. Cad. Map/1953Boolean fields specifying visibility of features on respective sources.
ConfidenceSubjective value indicating the confidence of the interpretation (Values 1–3, where 1 = questionable; 2 = likely; 3 = confident).
Visualizationthe source visualization(s) from which a feature was mapped
Commentfree text field for additional information
Is AboveSU-identifier of all features that are cut by the current feature.
Is BelowSU-identifier of all features that overlie the current feature.
Publisher’s Note: MDPI stays neutral with regard to jurisdictional claims in published maps and institutional affiliations.