Article

Distribution Characteristics and Drivers of Soil Carbon and Nitrogen in the Drylands of Central Asia

1
Xinjiang Institute of Ecology and Geography Chinese Academy of Sciences, Urumqi 830011, China
2
University of Chinese Academy of Sciences, Beijing 100049, China
3
National Engineering Technology Research Center for Desert-Oasis Ecological Construction, Urumqi 830011, China
4
State Key Laboratory of Desert and Oasis Ecology, Urumqi 830011, China
*
Author to whom correspondence should be addressed.
These authors contributed equally to this work.
Land 2022, 11(10), 1723; https://doi.org/10.3390/land11101723
Submission received: 2 September 2022 / Revised: 18 September 2022 / Accepted: 28 September 2022 / Published: 5 October 2022

Abstract

:
Soil organic carbon (C) and soil total nitrogen (N) show different degrees of spatial variability at different scales. Both are important components of soil nutrients and essential elements for plant growth and development, and are closely related to biogeochemical cycles. However, there is limited information on the regional spatial validity of SOC and TN and the associated drivers at the scale of the Central Asian drylands. Therefore, this study uses the ISRIC-WISE (International Soil Reference and Information Centre-Word Inventory of Soil Property Estimates) database to conduct soil sampling at the raster level, combined with relevant climatic and environmental datasets, to investigate the spatial distribution characteristics and drivers of soil C and N in the drylands of Central Asia using classical geostatistical methods and structural equation modelling (SEM). The results of this study show that the distributions of soil C and N contents in the dry zone of Central Asia have greater similarity, with C content mainly concentrated in the ranges of 0–5.5 g/kg and 11.1–15.9 g/kg; soil N content mainly concentrated in the range of 0.4–1.1 g/kg, and the soil C:N ratio mainly concentrated in the range of 12.2–28.9. Structural equation modelling showed that the main driver of soil C change was Aridity (−0.51); the main driver of soil N change was Mean Annual Temperature (MAT) (−0.44); and soil C:N change was most influenced by Aboveground biomass (AGB) (−0.25). An analysis of the relative importance contribution showed that Aridity had the highest relative importance with regard to the change in C (32%); MAT had the highest relative importance with regard to the changes in N and C:N (29% and 40%, respectively). The above findings provide a reference for the use of soil resources in drylands and provide a scientific basis for regional differences in the response of arid ecosystems to climate change.

1. Preface

Drylands, areas characterized by aridity index (AI; mean annual precipitation/mean annual potential evapotranspiration) values < 0.65, cover 41% of the global land surface [1] (and include 35% and 20% of global diversity and plant diversity hotspots, respectively [2,3]) and are inhabited by 2 billion people, approximately 90% of which are in developing countries [4]. Huang et al. (2016) predicted that, by 2025, drylands could occupy 48% of the global land surface and sustain 51% of global population growth between 2000 and 2025, with 50% of this occurring in developing countries compared with1% in developed countries. Arid ecologies are more vulnerable, and more extreme climatic conditions will make arid and semi-arid ecosystems more vulnerable to increased drought risk and increased probability of heavy rainfall [5]. Therefore, as climate change and human activities intensify, changes and service functions in drylands are of increasing concern to governments and scientists.
Soil nutrient status is an important indicator of fertility as it not only coordinates and supplies the nutrients required for plant growth, but also facilitates the decomposition of soil humus and biogeochemical cycles [6]. Soil nutrients also play an irreplaceable and important role in plant growth and various physiological activities [7]. Soil organic carbon (C) and nitrogen (N) are important components of soil nutrients [8] and essential elements for plant growth and development [9,10]. C and N are essential nutrients for plant growth and are also important components of the soil carbon and nitrogen pool. Changes in their quantity and quality directly affect soil’s physicochemical properties and soil fertility, which in turn affects ecosystem productivity and community structure [11,12,13,14], which affects the quality of the terrestrial ecosystem. Soil C:N ratio (C:N) is often considered to be a marker of soil nitrogen mineralization capacity [15,16]. A suitable C:N ratio can coordinate the release of nutrients from soil organic matter and maintain high soil microbial activity; the C:N ratio can also affect the carbon and nitrogen sequestration capacity of soils [17]; C:N, as an indicator of the relationship between C and N, changes can more comprehensively represent the changing characteristics of soil quality (C:N, as an indicator of the relationship between C and N, is a more comprehensive indicator of changes in soil quality [14], and soil C:N is often considered to be a marker of soil nitrogen mineralization capacity [11,12], which can influence soil microbial activity and mineralization rates, thereby regulating soil quality and C and N cycling). It has been shown that soil N availability determines plant growth and significantly influences ecological processes, and that soil C:N drives soil N autotrophic nitrification rates and increases N utilization by plants. Exploring the spatial distribution of C, N and C:N ratios in soils can therefore help to enhance people’s management and use of land resources.
In general, soil C:N is relatively stable in natural ecosystems (Zhang et al., 2014), but dryland ecosystems are more fragile [18] and soil C and N contents are vulnerable to environmental changes. For example, it has been shown that precipitation and temperature affect vegetation cover, plant apoplankton quality and soil biota, soil physicochemical properties and thus soil C:N (Qin et al., 2016); related studies have shown that soil C:N in drylands may be more influenced by climatic factors (precipitation, temperature, wind speed, solar radiation, etc.) and soil conditions (soil moisture, pH, and soil temperature) [5,19]. Cools et al. (2014) found that soil C:N was negatively correlated with temperature and positively correlated with precipitation. Therefore, exploring the drivers of C, N and C:N in dryland soils and their spatial variability to better optimize environmental resource allocation provides a scientific basis for understanding regional differences in the response to climate change in the drylands of Central Asia.
Therefore, based on the high level of drought and the wide variation in precipitation and temperature in Central Asia, this study attempts to answer the following questions:
(1)
Is there a large spatial heterogeneity in soil C, N and C:N in the dry zone of Central Asia? What are the characteristics of this variability?
(2)
What are the most important drivers of spatial variability in soil C, N and C:N in the study area, among the many factors influencing spatial variability, climate, soil environment and vegetation?

2. Materials and Methods

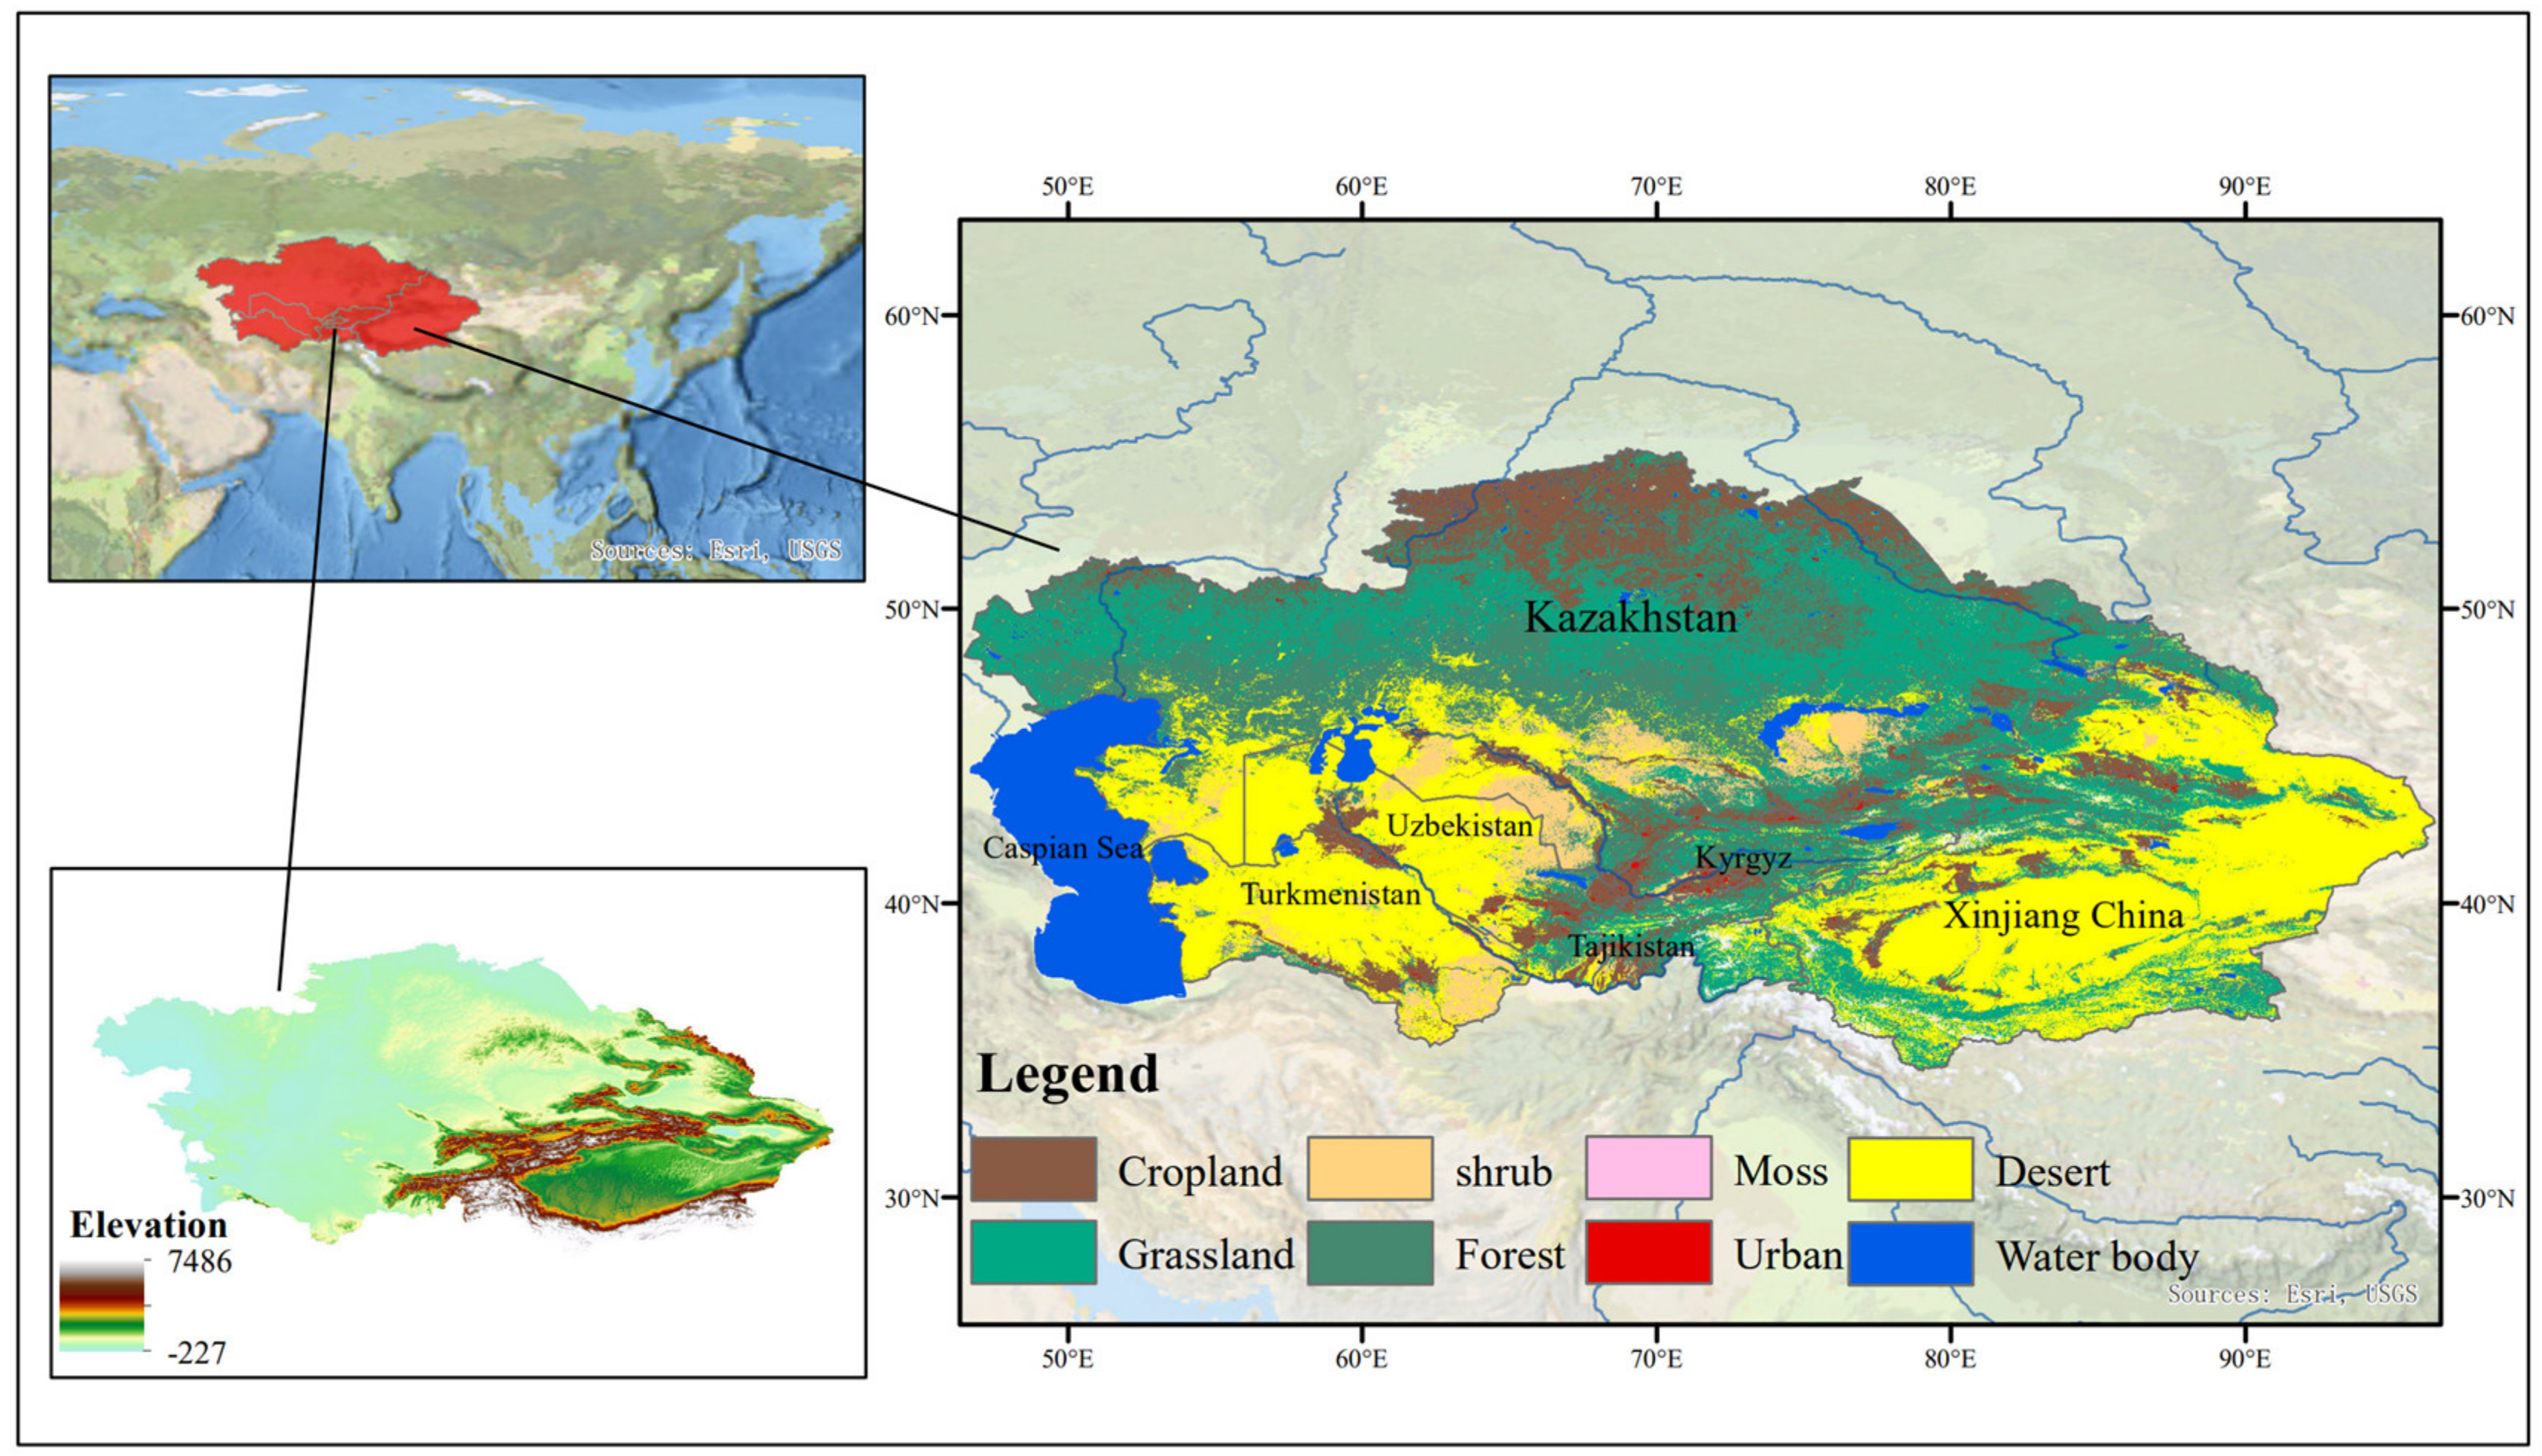
2.1. Overview of the Study Area

This paper takes Central Asia as a study area, located north of the Pamir–Tibet Plateau, south of the Altai Mountains, east of the Caspian Sea and the Volga River, and west of the Xingxing Gorge (Figure 1), at the center of the Asia–Europe continent. The study area includes five Central Asian countries (Kazakhstan, Tajikistan, Turkmenistan, Kyrgyzstan and Uzbekistan) and the Xinjiang region of China, geographically located at 35°–53° N, 40°–112° E, spanning 70 longitude [20] and covering an area of more than 6.0 × 10⁶ km2 [21]. With an average annual precipitation of less than 150 mm, it is the world’s widest arid zone, spanning the northern hemisphere of Earth’s land mass.
The climate in Central Asia is dry, with water vapor mainly coming from the Atlantic and Arctic oceans under the control of the westerly circulation [20], and the land cover is mainly desert and steppe, with a small amount of arable land in northern Kazakhstan, along the Tianshan Mountains and near important rivers such as the Amu Darya and SYR Darya. The study area is home to some of the world’s most famous mountain ranges, such as the Tian Shan Mountain system and the Kunlun Mountains, with a low–high–low altitude trend from west to east, with the highest elevations exceeding 7000 m. High mountain glaciers and snow melt are important water recharges for many of Central Asia’s major rivers and for agropastoralism.

2.2. Data Sources

The Terra Climate dataset is a global monthly average land surface climate and climate water balance dataset from the University of Idaho, containing global climate water balance and monthly land surface climate data. It includes information on solar radiation, temperature, precipitation, wind speed. In addition, the ISRIC-World database, with a spatial resolution of 250 m, was used for SOC, TN, soil pH. Quantification of prediction uncertainty at pixel level with the 90% prediction interval using Quantile Random Forest, and Improved model calibration and cross-validation procedure to better take into account the uneven spatial distribution of data points across the world. The GEE cloud platform was used to download the above data for reprojection cropping operations, whereas the drought index (AI) was obtained from the CGIAR-CSI (Consortium for Spatial Information) International Agricultural Research CGIAR-CSI (Consortium for Spatial Information) website. Specific data are shown in Table 1.

2.3. Statistical Analysis Methods

First, Arcgis (version 9.1) was used to map the spatial distribution of C, N and C:N in surface soils across the dry zone of Central Asia; Origin (version 2020) was used to plot a linear fit between C, N and C:N in soils; the “ggRandomForests” package in R (version 4.1.1) was used to rank the relative importance of environmental factors. The “ggRandomForests” package in R (version 4.1.1) was used to rank the relative importance of environmental factors in a random forest and to calculate the relative importance of each environmental factor in the spatial variation of C, N and C:N. The “lavaan” package in R was used to produce a structural equation model (SEM) to investigate the main drivers of the spatial variation of soil C, N and C:N. The main drivers of spatial variation in soil C, N and C:N were investigated using the “lavaan” package in R.

3. Results and Analysis

3.1. Spatial Distribution of Soil C, N and C:N in the Dry Zone of Central Asia

Soil C and N contents and C:N ratios in the Central Asian dry zone showed large spatial heterogeneity (Figure 2). The C content in the Central Asian drylands was mainly concentrated in the interval ranges of 0–5.5 g/kg and 11.1–15.9 g/kg, accounting for 49% and 17% of the total area, respectively. The spatial distribution pattern of soil N content is more consistent with the distribution of soil C content. The N content in the Central Asian dry zone was mainly concentrated in the range of 0.4–1.1 g/kg, accounting for 61% of the total dry zone area. The soil C:N ratio was mainly concentrated in the range of 9 to 12, and its area accounted for about 36% of the whole dry zone area.

3.2. Relationships between Soil C, N and C:N and Environmental Factors in the Dry Zone of Central Asia

Heat maps of correlations between soil C, N and C: N and environmental factors showed significant correlations between aboveground biomass (AGB) and soil C: N, elevation (Ele) and soil C and N contents, and soil C, N and C:N (Figure 3). Among them, pH, Aridity, MAT and soil C, N and C:N all showed significant negative correlations (p < 0.05); MAP, AGB and soil C, N and C:N mainly showed significant negative correlations (p < 0.05).
Climate, Soil, and Vegetation jointly explained 47.0%, 54.1%, and 27.7% of soil SOC, TN content, and C:N ratio in the study area (Figure 4), with the independent effect of Climate (a) contributing the most to SOC, TN, and C:N variability, explaining 18.6%, 25.7%, and 10.0%, respectively, suggesting that climate change better explains the variability in soil C:N content in Central Asia. In contrast, the independent effects of Soil and Vegetation were less prominent, with Soil contributing 7.1%, 6.9%, and 3.5%, respectively, to the changes in SOC, TN, and C:N. The interaction of vegetation contributed 11.4%, 5.8%, and 4.1%, respectively, to the changes in SOC, TN, and C:N ratios. The relationship between climate and vegetation contributed 2.8%, 2.3%, and 0.9%, respectively, to the variations in SOC, TN, and C:N ratios.
SEM model analysis showed that the model explained 28%, 37% and 16% of C, N and C:N, respectively (Figure 5). In the model for C, the change in C was most influenced by Aridity, with a load of −0.51, followed by MAT (−0.32). The direct effect of Ele on the change in C was not significant, but Ele could indirectly influence the change in C by significantly influencing factors such as Aridity. In the model for N, the change in N was most affected by MAT with a load of −0.44, followed by MAT (−0.31) and AGB (0.30), respectively. The direct effect of Ele on the change in N was not significant, but Ele could indirectly affect the change in N by significantly affecting factors such as pH. In the model for C:N, the change in C:N was most influenced by AGB with a load of −0.25, followed by Aridity (−0.22) and MAP (0.21), respectively.
The ranking of the importance of environmental variables on the change in C shows (Figure 5a) that Aridity has the highest relative importance with regard to the change in C (31.7%); Ele has a lower relative importance concerning the change in C (2.7%). The ranking of the importance of environmental variables on N change showed (Figure 5c) that MAT had the highest relative importance with regard to N change (28.6%); similarly, Ele had a lower relative importance in terms of N change (1.1%). The ranking of the importance of environmental variables on changes in C:N indicated (Figure 5e) that MAT had the highest relative importance with regard to changes in C:N (39.8%); similarly, Ele had less relative importance with regard to changes in C:N (2.8%).

4. Discussion

4.1. Spatial Variability Characteristics of Soil C, N and C:N

The dynamics and spatial distribution of carbon and nitrogen in soils are important indicators of soil quality, and as the largest carbon pool in terrestrial ecosystems, soil carbon pools play a huge role in regulating global climate change [8]; thus, it is important to clarify the spatial distribution of soil C, N and C:N in the drylands of Central Asia for local resource use and development. The spatial distribution of soil C, N and C:N in the drylands of Central Asia is therefore of great importance for local soil resource use and development. The present study found large spatial heterogeneity with regard to soil C, N and C:N in the dry zone of Central Asia, which is consistent with hypothesis (1). Geographically, soil C content is higher in the Kazakh steppe in northern Kazakhstan and the Pontic steppe in the northwest and in the Tianshan and Altai Mountain ranges in the center, whereas soil C content is lower in south-central Kazakhstan, Uzbekistan, Turkmenistan and parts of the Taklamakan and Gurbantungut deserts in China. The spatial distribution pattern of soil N content is generally consistent with the distribution of soil C content. Soil N content is higher in the Kazakh steppe in the north and the Pontic steppe in the northwest of Kazakhstan and in the Tianshan and Altai Mountain ranges in the center, and lower in south-central Kazakhstan, Uzbekistan, Turkmenistan and parts of the Taklamakan and Gurbantungut deserts in China. The spatial pattern of soil C:N ratios is slightly less regular, but generally shows a high soil C:N ratio in the steppe areas of north-western Kazakhstan and along the Tien Shan and Altai Mountain ranges, and a low–high–low C:N ratio throughout Central Asia south of the Kazakh steppe from east to west.

4.2. Drivers of Spatial Variability in Soil C, N and C:N

The SEM model and relative importance analysis showed that the spatial variation of soil C, N and C:N was mainly driven by MAT and Aridity, and other environmental factors also had an important role in the spatial variation of soil C, N and C:N, which is consistent with hypothesis (2). It is known that due to water stress in drylands, microbial activity decreases accordingly with increasing drought [22]. Soil microorganisms can survive desiccation as dormant inoculum by accumulating solutes requiring C and N in their cells to reduce water potential and maintain hydration [23], thus slowing down the transformation of components such as carbon and nitrogen in the soil, resulting in a lower soil carbon and nitrogen content. Additionally, in desert areas with higher Aridity, vegetation is generally smaller in size due to nutrient and water limitations. In contrast, shorter vascular and non-vascular plants (e.g., short grasses and mosses) will be active for shorter periods of time in response to low water availability, thereby fixing less atmospheric C [24], thereby reducing soil C content. Therefore, aridity had a highly significant negative effect on the variation of soil C content (p < 0.001), and Maestre et al. (2021) showed that drought significantly reduced soil C content, which is consistent with the results of this study [25]. Aridity can have a corresponding effect on soil C and N balance by altering soil microbial composition and enzyme activity [26,27]. Increased aridity generally reduces soil microbial activity and therefore soil nutrient availability is reduced under high-aridity conditions [28], thereby reducing soil C content (biodiversity).
Similarly, aridity had a highly significant negative effect on changes in soil N content (p < 0.001), and dry drought significantly reduced soil N content. Increasingly, drought has been shown to reduce the effectiveness of soil N in drylands globally and to reduce the organic N pool in these ecosystems [28,29]. Drought may reduce the ability to replenish and distribute added N to the soil, resulting in a reduction in soil N [30]. Additionally, increased drought may negatively affect plant growth in drylands [28,31], thus reducing the input of organic N into these ecosystems, resulting in a reduction in soil N content in drylands. Aridity also had a significant negative effect on soil C:N (p < 0.05). Aridity also had a significant negative effect on soil C:N (p < 0.05). This paper speculates that because Aridity has a greater effect on soil C than N, it may be due to the fact that with increasing aridity, which is not conducive to vegetation survival, vegetation absorbs less fast-acting nutrients from the soil [32], resulting in a significant decrease in C:N with increasing Aridity.
Temperature had a significant negative correlation with soil C content (p < 0.001). Increased temperature directly accelerates microbial processes and turnover rates, altering water and nutrient availability and extending the plant-growing season [30]. Hobbie et al. (2022) found that climate warming decomposes a large amount of organic carbon present in soils at high latitudes (positive feedback to climate warming) [33], which will result in a large release of carbon into the atmosphere in the form of gases. Therefore, the level of C in soils will decrease. Soil extracellular enzymes catalyze the rate-limiting step of soil organic carbon decomposition, and their rates of catalysis, production and degradation are regulated by temperature [34], which may promote soil extracellular enzyme activity when the temperature increases appropriately, possibly facilitating soil organic carbon decomposition and thus reducing soil SOC stocks. Therefore, MAT showed a highly significant negative correlation with SOC, which is consistent with the findings of this study. Soil MAT was the main driver of soil N spatial variability in this study, with a highly significant negative correlation (p < 0.001). The increase in temperature increased the activity of nitrifying and denitrifying bacteria in the soil, thus promoting nitrification and denitrification and producing more N2O excluded from the soil [35], resulting in a decrease in soil N content. At the same time, increased temperature increased the rate of total N mineralization [36], which led to a decrease in total N content. In summary, increasing temperature decreased the source of total N (increased N mineralization) and increased the route of departure (increased N2O emissions), thus MAT showed a significant negative correlation with soil N [18].
MAP has a significant positive effect on changes in soil C and N contents and C:N. In dry areas, reduced precipitation adversely affects the growth and nutrient diffusion of soil microorganisms [37,38], reducing the metabolic activity of soil microorganisms. Conversely, with increased precipitation in drier environments, available water in the soil increases, greatly promoting plant and soil microbial activities and increasing soil nutrients such as C and N. Therefore, MAP showed a highly significant positive correlation with C and N in the dry zone (p < 0.01). It has been shown that the soil C:N ratio is positively correlated with precipitation and negatively correlated with temperature over a range of regions [39]. This is consistent with the findings of the present study.
Soil pH is one of the main factors influencing soil processes and properties, including those that are chemical, physical and biological [40]. It is an important indicator of soil and one of the determinants of soil nutrient transformation and effectiveness [41], and it also directly or indirectly affects soil nutrients. The mean soil pH in this study area was 8.3, and as soil pH increased, soil alkalinity increased to the detriment of plants due to aluminum toxicity and the poor availability of some nutrients, or pH was too high due to the poor solubility of some essential elements [42]. Soil pH therefore showed a negative correlation with C, N and C:N (p < 0.01).
In this study, AGB was found to have a significant contribution to soil C, N and C:N changes. This may be due to the fact that nitrogen-fixing microorganisms within the soil can turn nitrogen from the air into nitrogen available for plant uptake [43], and the decomposition of plant residues after plant death can result in a significant increase in soil C and N and other nutrient contents.

5. Conclusions

In this study, the current status and regional spatial variability of C and N were analyzed using soil C and N data from the ISRIC-WISE database. The results show that soil C and N contents and C:N ratios in the Central Asian drylands have large spatial heterogeneity. In the Central Asian drylands, the C content of the Central Asian drylands was mainly concentrated in the interval ranges of 0–5.5 g/kg and 11.1–15.9 g/kg, accounting for 49% and 17% of the total area, respectively. The spatial distribution pattern of soil N content is largely consistent with the distribution of soil C content. The N content in the dry zone of Central Asia was mainly concentrated in the range of 0.4–1.1 g/kg, accounting for 61% of the total dry zone area. The soil C:N ratio was mainly concentrated in the range of 12.2 to 28.9, and its area accounted for about 60% of the whole dry zone area. Correlation analysis showed that there were mostly significant correlations between environmental factors and soil C, N and C:N. SEM models indicated that the main driver of soil C change was Aridity (−0.51), the main driver of soil N change was MAT (−0.44), and soil C:N change was most influenced by AGB (−0.25). Analysis of the relative importance showed that Aridity had the highest relative importance regarding changes in C (32%), MAT had the highest relative importance with regard to changes in N and C:N (29% and 40%, respectively), and ele had the lowest relative importance with regard to C, N and C:N.

Author Contributions

Y.C. and S.Z. were the main contributors to this work. Y.C. and S.Z. are the co-first authors of this article. Y.C.: Data curation; Conceptualization; Supervision; Formal analysis. S.Z.: Validation; Software. Y.W.: Funding acquisition; Investigation. All authors commented on previous versions of the manuscript. All authors have read and agreed to the published version of the manuscript.

Funding

This work was supported by the Strategic priority research project of Chinese Academy of Sciences (Grant number [XDA20030102]) and The Key Technical Talent Project of Chinese Academy of Sciences (Research on desertification technology along the “Belt and Road”). The author Yusen Chen received research support from Xinjiang Institute of Ecology and Geography Chinese Academy of Sciences.

Data Availability Statement

The Meteorological data were obtained from the Terra Climate dataset published by the University of Iowa (https://doi:10.1038/sdata.2017.191, accessed on 16 June 2022), which h includes global land surface, monthly mean climate, and climate water balance datasets, in addition to climate data such as Srad, PET, VS, MAP, VPD and actual evapotranspiration. Land cover data were obtained from ESA’s global land cover database with coverage at 300 m spatial resolution from 1992 to 2020 (https://cds.climate.copernicus.eu/cdsapp#!/dataset/satellite-land-cover, accessed on 16 June 2022), which classifies the global land surface into 22 categories based on the UN FAO Land Cover Classification System (LCCS).

Conflicts of Interest

The authors declare no conflict of interest.

References

  1. Cherlet, M.; Hutchinson, C.; Reynolds, J.; Hill, J.; Sommer, S.; Von Maltitz, G. World Atlas of Desertification Rethinking Land Degradation and Sustainable Land Management; Publication Office of the European Union: Luxembourg, 2018. [Google Scholar]
  2. White, R.P.; Nackoney, J. Drylands, People, and Ecosystem Goods and Services: A Web-Based Geospatial Analysis. World Resources Institute: Washington, DC, USA, 2003. [Google Scholar]
  3. Davies, J.; Poulsen, L.; Schulte-Herbruggen, B.; Mackinnon, K.; Gudka, M. Conserving Drylands Biodiversity; IUCN: Gland, Switzerland, 2012. [Google Scholar]
  4. Reid, W.V.; Mooney, H.A.; Cropper, A.; Capistrano, D.; Carpenter, S.R.; Chopra, K.; Dasgupta, P.; Dietz, T.; Duraiappah, A.K.; Hassan, R. Ecosystems and Human Well-Being-Synthesis: A Report of the Millennium Ecosystem Assessment; Island Press: Washington, DC, USA, 2005; ISBN 1597260401. [Google Scholar]
  5. Wang, C.; Wang, X.; Liu, D.; Wu, H.; Lu, X.; Fang, Y.; Cheng, W.; Luo, W.; Jiang, P.; Shi, J.; et al. Aridity threshold in controlling ecosystem nitrogen cycling in arid and semi-arid grasslands. Nat. Commun. 2014, 5, 4799. [Google Scholar] [CrossRef] [PubMed] [Green Version]
  6. Condit, R.; Engelbrecht, B.M.J.; Pino, D.; Pérez, R.; Turner, B.L. Species distributions in response to individual soil nutrients and seasonal drought across a community of tropical trees. Proc. Natl. Acad. Sci. USA 2013, 110, 5064–5068. [Google Scholar] [CrossRef] [Green Version]
  7. Tian, D.; Reich, P.B.; Chen, H.Y.H.; Xiang, Y.; Luo, Y.; Shen, Y.; Meng, C.; Han, W.; Niu, S. Global changes alter plant multi-element stoichiometric coupling. New Phytol. 2018, 221, 807–817. [Google Scholar] [CrossRef] [PubMed]
  8. Lin, L.; Zhang, F.W.; Li, Y.K.; Han, D.R.; Guo, X.W.; Cao, G.M. The Soil Carbon and Nitrogen Storage and C/N Metrological Characteristics of Chemistry in Kobresia Humilis Meadow in Degradation Succession Stage. Chin. J. Grassl. 2012, 34, 42–47. [Google Scholar]
  9. Qiao, Y.; Wang, Z.; Duan, Z. Effects of Different Land-Use Types on Soil Carbon and Nitrogen Contents in the Northern Region of Qinghai Lake. Acta Prataculturae Sin. 2009, 18, 105–112. [Google Scholar]
  10. Wu, J.; Han, M.; Chang, W. The Mineralization of Soil Nitrogen and Its Influenced Factors under Alpine Meadows in Qilian Mountains. Acta Prataculturae Sin. 2007, 16, 39. [Google Scholar]
  11. Ning, Z.Y.; Li, Y.L.; Yang, H.L.; Zhang, Z.Q.; Zhang, J.P. Stoichiometry and Effects of Carbon, Nitrogen, and Phosphorus in Soil of Desertified Grasslands on Community Productivity and Species Diversity. Acta Ecol. Sin. 2019, 39, 1–10. [Google Scholar]
  12. Zhang, Y.; Song, C.; Zhang, K.; Cheng, X.; Band, L.E.; Zhang, Q. Effects of land use/land cover and climate changes on terrestrial net primary productivity in the Yangtze River Basin, China, from 2001 to 2010. J. Geophys. Res. Biogeosci. 2014, 119, 1092–1109. [Google Scholar] [CrossRef]
  13. Brevik, E.C.; Cerdà, A.; Mataix-Solera, J.; Pereg, L.; Quinton, J.N.; Six, J.; Van Oost, K. The interdisciplinary nature of SOIL. Soil 2015, 1, 117–129. [Google Scholar] [CrossRef] [Green Version]
  14. Luo, Y.-L.; Li, Q.-Q.; Wang, C.-Q.; Zhang, W.; Zhang, H.; Li, L.-X.; Chen, J.-W.; Ma, Y. Spatial Variability of Soil C/N Ratio and Its Influence Factors at a County Scale in Hilly Area of Mid-Sichuan Basin, Southwest China. Yingyong Shengtai Xuebao 2015, 26, 177–185. [Google Scholar]
  15. Zhang, L.-X.; Bai, Y.-F.; Han., X.-G. Application of N: P Stoichiometry to Ecology Studies. J. Integr. Plant Biol. 2003, 45, 1009. [Google Scholar]
  16. Yu, X.; Gaodi, X.; Kai, A.N. The Function and Economic Value of Soil Conservation of Ecosystems in Qinghai-Tibet Plateau. Acta Ecol. Sin. 2003, 23, 2367–2378. [Google Scholar]
  17. Zhang, Y.; Zhang, C.; Wang, Z.; Chen, Y.; Gang, C.; An, R.; Li, J. Vegetation dynamics and its driving forces from climate change and human activities in the Three-River Source Region, China from 1982 to 2012. Sci. Total Environ. 2016, 563, 210–220. [Google Scholar] [CrossRef] [PubMed]
  18. Dai, Z.; Yu, M.; Chen, H.; Zhao, H.; Huang, Y.; Su, W.; Xia, F.; Chang, S.X.; Brookes, P.C.; Dahlgren, R.A.; et al. Elevated temperature shifts soil N cycling from microbial immobilization to enhanced mineralization, nitrification and denitrification across global terrestrial ecosystems. Glob. Chang. Biol. 2020, 26, 5267–5276. [Google Scholar] [CrossRef] [PubMed]
  19. Zhang, G.; Deng, H.; Du, K.; Lin, Y.; Ma, R.; Yu, W.; Wang, D.J.; Wu, C.Z.; Hong, W. Soil Stoichiometry Characteristics at Different Elevation Gradients of a Mountain in an Area with High Frequency Debris Flow: A Case Study in Xiaojiang Watershed, Yunnan. Acta Ecol. Sin. 2016, 36, 675–687. [Google Scholar]
  20. Chen, X.; Li, B.; Li, Q.; Li, J.; Abdulla, S. Spatio-temporal pattern and changes of evapotranspiration in arid Central Asia and Xinjiang of China. J. Arid Land 2012, 4, 105–112. [Google Scholar] [CrossRef] [Green Version]
  21. Fang, J.; Yu, G.; Liu, L.; Hu, S.; Chapin, F.S. Climate change, human impacts, and carbon sequestration in China. Proc. Natl. Acad. Sci. USA 2018, 115, 4015–4020. [Google Scholar] [CrossRef] [Green Version]
  22. Maestre, F.T.; Delgado-Baquerizo, M.; Jeffries, T.C.; Eldridge, D.J.; Ochoa, V.; Gozalo, B.; Quero, J.L.; García-Gómez, M.; Gallardo, A.; Ulrich, W.; et al. Increasing aridity reduces soil microbial diversity and abundance in global drylands. Proc. Natl. Acad. Sci. USA 2015, 112, 15684–15689. [Google Scholar] [CrossRef]
  23. Schimel, J.; Balser, T.C.; Wallenstein, M. Microbial stress-response physiology and its implications for ecosystem function. Ecology 2007, 88, 1386–1394. [Google Scholar] [CrossRef]
  24. Ward, D.; Wiegand, K.; Getzin, S. Walter’s Two-Layer Hypothesis Revisited: Back to the Roots! Oecologia 2013, 172, 617–630. [Google Scholar] [CrossRef] [Green Version]
  25. Maestre, F.T.; Benito, B.M.; Berdugo, M.; Concostrina-Zubiri, L.; Delgado-Baquerizo, M.; Eldridge, D.J.; Guirado, E.; Gross, N.; Kéfi, S.; Le Bagousse-Pinguet, Y.L.; et al. Biogeography of Global Drylands. New Phytol. 2021, 231, 540–558. [Google Scholar] [CrossRef] [PubMed]
  26. Hu, Z.-Y.; Hu, R.-J.; Zhou, Q.-M.; Chen, X.; Yin, G.; Qian, J. Spatiotemporal Variation of Wetting or Drying in the Arid Regions in Central Asia. Arid Zo. Res. 2018, 35, 260–268. [Google Scholar]
  27. Zhang, C.; Ren, W. Complex climatic and CO2 controls on net primary productivity of temperate dryland ecosystems over central Asia during 1980–2014. J. Geophys. Res. Biogeosci. 2017, 122, 2356–2374. [Google Scholar] [CrossRef]
  28. Durán, J.; Delgado-Baquerizo, M.; Dougill, A.J.; Guuroh, R.T.; Linstädter, A.; Thomas, A.D.; Maestre, F.T. Temperature and aridity regulate spatial variability of soil multifunctionality in drylands across the globe. Ecology 2018, 99, 1184–1193. [Google Scholar] [CrossRef] [PubMed] [Green Version]
  29. Schlesinger, W.H.; Reynolds, J.F.; Cunningham, G.L.; Huenneke, L.F.; Jarrell, W.M.; Virginia, R.A.; Whitford, W.G. Biological Feedbacks in Global Desertification. Science 1990, 247, 1043–1048. [Google Scholar] [CrossRef] [Green Version]
  30. Fang, C.; Ye, J.-S.; Gong, Y.; Pei, J.; Yuan, Z.; Xie, C.; Zhu, Y.; Yu, Y. Seasonal responses of soil respiration to warming and nitrogen addition in a semi-arid alfalfa-pasture of the Loess Plateau, China. Sci. Total Environ. 2017, 590, 729–738. [Google Scholar] [CrossRef]
  31. Gruber, N.; Galloway, J.N. An Earth-system perspective of the global nitrogen cycle. Nature 2008, 451, 293–296. [Google Scholar] [CrossRef] [Green Version]
  32. Delgado-Baquerizo, M.; Maestre, F.T.; Gallardo, A.; Bowker, M.A.; Wallenstein, M.D.; Quero, J.L.; Ochoa, V.; Gozalo, B.; García-Gómez, M.; Soliveres, S.; et al. Decoupling of soil nutrient cycles as a function of aridity in global drylands. Nature 2013, 502, 672–676. [Google Scholar] [CrossRef]
  33. Hobbie, S.E.; Nadelhoffer, K.J.; Högberg, P. A synthesis: The role of nutrients as constraints on carbon balances in boreal and arctic regions. Plant Soil 2002, 242, 163–170. [Google Scholar] [CrossRef]
  34. Jing, X.; Wang, Y.; Chung, H.; Mi, Z.; Wang, S.; Zeng, H.; He, J.-S. No temperature acclimation of soil extracellular enzymes to experimental warming in an alpine grassland ecosystem on the Tibetan Plateau. Biogeochemistry 2014, 117, 39–54. [Google Scholar] [CrossRef]
  35. Pajares, S.; Bohannan, B.J.M. Ecology of Nitrogen Fixing, Nitrifying, and Denitrifying Microorganisms in Tropical Forest Soils. Front. Microbiol. 2016, 7, 1045. [Google Scholar] [CrossRef] [PubMed] [Green Version]
  36. Björsne, A.-K.; Rütting, T.; Ambus, P. Combined climate factors alleviate changes in gross soil nitrogen dynamics in heathlands. Biogeochemistry 2014, 120, 191–201. [Google Scholar] [CrossRef]
  37. Davidson, E.A.; Janssens, I.A. Temperature sensitivity of soil carbon decomposition and feedbacks to climate change. Nature 2006, 440, 165–173. [Google Scholar] [CrossRef] [PubMed] [Green Version]
  38. Sardans, J.; Peuelas, J.; Estiarte, M. Changes in Soil Enzymes Related to C and N Cycle and in Soil C and N Content under Prolonged Warming and Drought in a Mediterranean Shrubland. Appl. Soil Ecol. 2008, 39, 223–235. [Google Scholar] [CrossRef]
  39. Post, W.M.; Emanuel, W.R.; Zinke, P.J.; Stangenberger, A.G. Soil carbon pools and world life zones. Nature 1982, 298, 156–159. [Google Scholar] [CrossRef]
  40. Buckman, H.O.; Brady, N.C. The Nature and Properties of Soils, 7th Edition. J. Range Manag. 2002, 5, 333. [Google Scholar]
  41. Sun, X.; Liang, B.; Wang, J.; Cheng, Y.; Chang, S.X.; Cai, Z.-C.; Müller, C.; Zhang, J.-B. Soil N transformation rates are not linked to fertilizer N losses in vegetable soils with high N input. Soil Tillage Res. 2020, 202, 104651. [Google Scholar] [CrossRef]
  42. Tyler, G. Some Ecophysiological and Historical Approaches to Species Richness and Calcicole/Calcifuge Behaviour: Contribution to a Debate. Folia Geobot. 2003, 38, 419–428. [Google Scholar] [CrossRef]
  43. Santi, C.; Bogusz, D.; Franche, C. Biological nitrogen fixation in non-legume plants. Ann. Bot. 2013, 111, 743–767. [Google Scholar] [CrossRef]
Figure 1. Overview of the study area. The map is based on the standard map No. GS (2021) 5453 downloaded from the map technology review center of Ministry of natural resources. This map was not modified.
Land 11 01723 g001
Figure 2. Spatial distribution pattern of soil C, N and C:N in the dry zone of Central Asia.
Land 11 01723 g002
Figure 3. Heat map of correlations between soil C, N and C:N and different meteorological factors. Note: MAT: mean annual temperature; Srad: solar radiation; pH: soil acidity; VS: mean annual wind speed; Ele: Elevation; AGB: above-ground biomass; MAP: mean annual precipitation. Consistent with the legend below. *: p < 0.05; **: p < 0.01; *** p < 0.001.
Land 11 01723 g003
Figure 4. Variance distribution of various environmental factors (R2, %) that explain variations in soil SOC, TN, and their ratios (factors with a value of 0 are not represented in the figure). ((a,b,c) illustrate, respectively, the degree of interpretation of various environmental conditions on variations in SOC, TN, and C: N.)
Land 11 01723 g004
Figure 5. Structural equation modelling (SEM) assessment of the direct and indirect effects of environmental factors on changes in soil C, N and C:N (Figure (a,c,e) show the relative importance of environmental variables contributing to C, N and C:N, respectively). (b,d,f), respectively, illustrate the effect of various environmental conditions on the changes in SOC, TN, and C:N. Note: Mean annual temperature, MAT; Mean annual precipitation, MAP; Aridity, AI; Elevation, Ele; Soil organic carbon, SOC; Total nitrogen, TN; Aboveground biomass, AGB. ***, p < 0.001; **, p < 0.05; * p < 0.1.
Land 11 01723 g005
Table 1. Data sources and basic characteristics.
TypeVariableUniteOriginal ResolutionData Source
Mean annual temperature°C4638.3 mdoi:10.1038/sdata.2017.191, accessed on 16 June 2022
ClimateMean annual precipitationmm4638.3 mdoi:10.1038/sdata.2017.191, accessed on 16 June 2022
Aridity-4638.3 mdoi:10.1038/sdata.2017.191, accessed on 16 June 2022
ElevationElevationm4638.3 mdoi:10.1038/sdata.2017.191, accessed on 16 June 2022
Soil organic carbong/kg250 mhttps://www.isric.org/explore/soilgrids/faq-soilgrids-2017, accessed on 16 June 2022
Soil
Properties
Total nitrogeng/kg250 mhttps://www.isric.org/explore/soilgrids/faq-soilgrids-2017, accessed on 16 June 2022
Aboveground biomassMg/ha1000 mhttps://doi.org/10.3334/ORNLDAAC/2017, accessed on 16 June 2022
pH-250 mhttps://www.isric.org/explore/soilgrids/faq-soilgrids-2017, accessed on 16 June 2022
Note: Mean annual temperature, MAT; Mean annual precipitation, MAP; Aridity, AI; Elevation, Ele; Soil organic carbon, SOC; Total nitrogen, TN; Aboveground biomass, AGB.
Publisher’s Note: MDPI stays neutral with regard to jurisdictional claims in published maps and institutional affiliations.

