Abstract
Economic development often leads to the misallocation of labor resources, so reforming the way land is allocated is important for developing a strategy to address the insufficient supply and oversupply of labor in China. This paper uses panel regression analysis to quantitatively measure the effect of the market supply of construction land (MSCL) on labor resources misallocation (LMIS). The results show that LMIS decreased year-by-year during the study period. The development of the MSCL can effectively reduce LMIS. The negative effect of the MSCL in the central region is greater than that in the eastern region, and the negative effect in the western region is the smallest. There is a single-threshold effect on the impact of the MSCL on LMIS. Specifically, when the MSCL is less than 18,045 hectares, the impact effect is −0.324, and when the MSCL is higher than 18,045 hectares, the effect is not significant. Moreover, the impact of the MSCL on LMIS has a spatial spillover effect, which is greater than the direct effect. Labor resources tend to migrate to economically developed areas, not just adjacent areas. These conclusions are of great significance for reducing LMIS from the perspective of land system reform in China.
1. Introduction
To meet the needs of the rapid development of China’s modern economy, the country is gradually changing from a highly centralized planned economy to a socialist market economy. Various production factors are also now being allocated more efficiently through market mechanisms [1]. Land resources, an important source of local government revenue, are important for both urban infrastructure construction and real estate investment and financing [2]. At present, the Chinese government is reforming the mode of land supply to gradually achieve the market-oriented allocation of land resources, and some results have been achieved. The way land is allocated with a market mechanism is to distribute land resources to land users through the role of a market mechanism. The ultimate aim is to realize the optimum combination of land resources and other means of production and living. In the process of land-market-oriented allocation, the allocation of labor resources will also change accordingly [3]. Land resources and labor resources are important elements in production relations, so exploring the relationship between them is highly meaningful. In particular, how does the MSCL affect LMIS, and can effective MSCL reduce LMIS in China? Thinking about and answering this question is of great practical significance for China if the country is to formulate a scientific and reasonable land-resource allocation policy and promote the optimal allocation of resources.
Land is not only a special production factor, but also one of the indispensable resources of economic activities [4]. The former extensive way of supplying land has affected the optimal combination of resources in economic development, seriously challenging the sustainability of China’s economic growth in the process. In China, the allocation of land resources can be divided into allocated land-use rights and granted land-use rights [5]. The allocation of land-use rights refers to the government’s free allocation of land resources to land users through administrative means. China’s decades of development experience have proved that this single way of administrative allocation is inefficient and causes a huge waste of land resources [6]. Unlike the traditional ways of allocating land in China, the market supply of urban construction land in the United States is very developed [7]. Land in the United States is mainly under private ownership, and there, the owners are compensated for the use of those land resources. The government does not pay that compensation; it is derived directly from the market. Within the scope permitted by the prevailing land laws, the land can be sold and leased freely, and the price is determined by market supply and demand. The Torrens land registration system, originally initiated by Australia, is one of the most efficient land management systems in the world, and is a representative system in the field of world land management [8]. These two land systems (the U.S. system and the Torrens system) are based on market-oriented allocation. Through market competition, the law of ‘the survival of the fittest’ will inevitably concentrate capital, technology, and labor into enterprises with good management and high economic benefits, thereby optimizing the allocation of resources. The practice of various countries has proved that the market-based allocation of land is a key means to optimizing resource allocation and promoting economic growth.
Reforming the way China allocates land is important for the country’s strategy of addressing both the insufficient supply and oversupply of labor in different parts of China [9]. Land allocation is an important strategy for China, which is attempting to transform its extensive economic development mode, reform the land-market order, and alleviate the problem of resource allocation. The allocation of labor resources is also one of the main forms of resource misallocation. If resources can flow freely enough to achieve the Pareto optimal state, this is known as “effective allocation”, while “misallocation” is a deviation from this ideal state [10]. Some scholars believe that LMIS is caused by the price distortion of production factors and the friction among various production departments. The essence of LMIS is that the allocation of labor resources deviates from the Pareto optimal state due to the distortion of the socio-economic production factor market [10]. In existing research, some scholars have paid attention to LMIS in the process of social and economic development. Some of this previous research has focused on employment choice [11], physical and mental health [12], and the factors and driving mechanism that affect population flow [13]. The man–land relationship, based on regional economics, has also been examined [14].
In summary, existing research lacks any in-depth analysis of the impact of land allocation on LMIS. This paper brings land-resource allocation and the allocation of labor resources into a unified analysis framework, and reveals the mechanism of MSCL on LMIS, in order to make a positive discussion in theory. This provides a theoretical basis for China’s land-market reforms. Against this backdrop, the remainder of this paper is organized as follows: Section 2 establishes a theoretical framework of the MSCL and LMIS. Section 3 introduces the variables and methods. Section 4 presents the empirical results, Section 5 contains a detailed discussion according to the results in this paper, and the conclusion and implications are given in Section 6.
2. Theoretical Framework
The scarcity of resources reveals that one of the basic problems in economic research is resource allocation. How to use limited resources to maximize social welfare is a common concern of economists, both at home and abroad. At present, although research on the relationship between the MSCL and LMIS is extremely scarce, this study can link both from the main line of “MSCL–capital entry–labor flow–labor allocation” (Figure 1). Land has the production function, and the scarcity of land resources has also caused sensitivity in various industrial departments due to the impact of policy restrictions. Market competition will correct resource mismatch, but, conversely, industry monopoly will aggravate the degree of resource mismatch [15]. Therefore, the MSCL can provide a relatively fair competition environment for enterprises, improve the allocation efficiency of land resources, and relieve the supply and demand pressure of land resources [16].
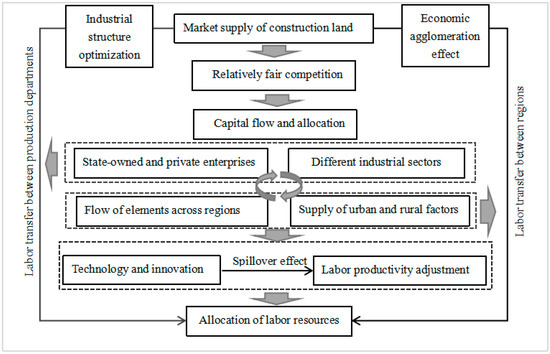
Figure 1.
Relationship between MSCL and LMIS.
The MSCL has an impact on the allocation of labor resources, mainly through the industrial structure optimization and economic agglomeration effect. Industrial structure optimization can promote the rational allocation of resources between state-owned enterprises and private enterprises [15]. The MSCL can encourage manufacturing enterprises to improve the status of the social division of labor by improving the service level, promoting enterprises to optimize the utilization efficiency of internal resources, and by improving the productivity of enterprises in the current competitive market environment. At the same time, market competition can accelerate the flow of labor factors, thereby promoting the transfer of labor resources from inefficient enterprise departments to efficient enterprise departments, and thus, optimizing the overall allocation of labor resources [17]. Although the MSCL increases the transaction cost of urban industry and commerce, it also makes investment safer, more efficient, and more effective. On the one hand, an agglomeration of advantageous enterprises means an expansion of the scale of economic agglomeration. This, in turn, leads to an expansion of the scale of the labor market and an increase in the degree of labor matching. In this process, the degree of specialization of producer services has been deepened. Allocating funds to investment projects with a high yield can expand the production scale, promote the technological change of enterprises, and then improve the allocation efficiency of the labor market. On the other hand, the development of the MSCL has redistributed land to enterprises with higher productivity, which, in turn, has enhanced the economic benefits of enterprises [18].
In areas with rapid social and economic development, the supply of urban construction land is greater. Meanwhile, in areas with both high and low economic development, the supply of urban construction land is relatively stable. Therefore, the location of construction land supply has agglomeration, and these characteristics also cause the economic agglomeration [19]. Enterprises are close to each other in certain areas, or they are in a certain link of the production chain at the same time. Additionally, the division of labor is different, thus, reducing costs (such as transportation costs, inventory costs, and transaction costs) [20,21]. According to the new trade theory, gathering in a certain region can better uncover the comparative advantages of various enterprises [22,23]. This forms vertical and horizontal cooperation, and improves the utilization efficiency of labor resources, such as in the Zhejiang Yiwu model [24] and Wenzhou model [25]. The effect of economic agglomeration on the flow of labor resources is not only reflected in the allocation of production factors in the micro region, but also in the macro region [26]. China’s three major urban agglomerations mainly rely on the development of the tertiary industry, while the northeast region mainly relies on industrial production to drive economic development. The macro-economic agglomeration has caused China’s labor transfer to display typical characteristics. China’s labor resources are being transferred from the central and western regions to the eastern regions. At the same time, the labor resources also show development characteristics regarding the transference from rural to urban areas.
Generally speaking, enterprises that obtain urban construction land through market-based competition have outstanding production technology and innovation ability. Meanwhile, economic high-tech industries have knowledge spillover and diffusion [27,28]. The higher the proportion of high-tech industries in a region and the wider their distribution is, the higher the technological level of the city is, the greater the scope of technology radiation to the city is, and the more obvious the knowledge spillover effect is. At present, China attaches great importance to the high-quality development of the economy. The service industry and the manufacturing industry both require knowledge-intensive services to be closely linked with production activities. Regions with relatively high technology levels can provide better service support facilities and technical support. This can further strengthen the impact of land-resource supply on the mismatch of labor resources. In addition, under the market environment of high-tech popularization, regions with low production efficiency are more likely to improve the productivity of their local enterprises through the technology spillover effect [29,30]. This will undoubtedly affect the allocation of labor resources.
This study analyzed the relationship between the MSCL and the allocation of labor. Attempts were also made to clarify the internal mechanism of the MSCL and LMIS. However, the impact relationship of the MSCL on LMIS is very complex; research of the relationship between the two is also very much lacking. Therefore, conducting a deep exploration on the LMIS caused by land markets is extremely necessary. Based on the current reform of China’s land-market system, this paper attempts to calculate the LMIS of each province, and quantitatively analyzes the impact of the MSCL on LMIS in different regions by using a fixed-effect model. A panel threshold model is also used to explore the threshold effect of the MSCL on LMIS. Meanwhile, a spatial Durbin model (SDM) is used to test the robustness of the regression results. According to the results of the study, some targeted suggestions will be put forward.
3. Variables and Methods
3.1. Data and Variables
3.1.1. LMIS Calculation
At present, two methods are mainly used to measure resource mismatch. One is to calculate the standard deviation of the total factor productivity (TFP) of each region based on the industrial enterprise database. The larger the standard deviation of TFP is, the more serious the resource misallocation is [31]. The other method is based on those of Hsieh and Klenow (2009) [10], Chen and Hu (2011) [32], and Ji et al. (2016) [33]. Specifically, the resource misallocation is calculated according to the GDP, employees, and capital stock of each region. The former method is widely used, but the Chinese industrial enterprise database has only been updated to 2013, thus, the database is not suitable for sustainable research. The application of the latter method has also been paid increasing attention of late. The calculation of LMIS shall be based on the capital misallocation index. Suppose that the production function is a C-D production function with constant returns to scale; the specific forms are as follows:
The logarithm of the formula is as follows:
The output variable () is the real regional GDP. The input of labor resources () is expressed by the employed population of each province. Capital input () is expressed by the fixed-capital stock of each province. The perpetual inventory method is used, and the formula is as follows:
where represents the fixed-capital stock of the current period; represents the investment in fixed assets; represents the corresponding fixed asset investment price index, and represents the depreciation rate, which is generally 9.6% in China. Due to the differences in the economic and technological levels of each province, the elasticity of capital and labor output may also be different. Therefore, using the variable coefficient panel model with variable interception and slope is more appropriate [34]. In the specific calculation process, we can introduce the interaction term between the dummy variable and the explanatory variable in the regression equation. The coefficient of the interaction term () is the capital output elasticity of the province, and is the labor output elasticity coefficient. According to the elasticity coefficient of capital and labor, the absolute distortion coefficient of factor price can be calculated as follows:
Finally, the LMIS is calculated. When the LMIS is greater than 0, this means that, compared with the whole economy, the actual allocation of production factors is lower than the theoretical proportion of effective allocation, and the allocation of resources is insufficient. When the is less than 0, this means that the allocation of resources is excessive; the absolute value of is also taken to show the LMIS. The larger the LMIS is, the more serious the LMIS is.
3.1.2. MSCL and Land-Transaction Unit Price
The term ‘MSCL’ means that land resources are traded in the form of tender-auction-listing. Specifically, the right to use state-owned land is transacted at a “conveyance price”. In China, that price is determined by closed-door negotiation, tendering, auctioning, listing, renting out, and other ways [6]. In the urban land market, tendering, auctioning, and listing are three land-supply methods, all three of which are completely market-oriented. China’s land system adheres to public ownership. For a long time, government allocation has been the main conduit of land supply, but this method of land supply is not conducive to the balanced allocation of resources among regions. Additionally, if the allocated supply is purely for public welfare and non-profit construction projects, that land is supplied free of charge [5] and is not considered in the MSCL in this paper. As the land transfer modes of bidding, auctioning, and listing are completely market-oriented transaction modes, the sum of the areas of the three transaction modes is selected in this paper to represent the market-oriented supply of land. The land-transaction unit price is the ratio of the total price of tender, auctions, and listing transfers to the total area of land-market allocation. The calculation formula is:
where and , respectively, indicate the transaction income and area of land transferred from tender; and , respectively, indicate the transaction income and area of land supplied by auction; and , respectively, indicate the transaction income and area of land supplied by listing.
3.1.3. Control Variable Selection
In order to better explore the impact of the land-market supply on the LMIS, the following control variables were selected based on the characteristics of land resources and labor resources.
Land-transaction unit price (LTUP): Generally speaking, the market price of commodities is determined by the combination of market supply and demand [35]. However, land resources are limited, and the natural supply of land resources cannot be changed. In addition, due to the public ownership of land in China, the economic supply of land will change very little in the short term. The LTUP is mainly determined by enterprises’ demand for land. At the same time, the periodic changes of land prices are affected by the prevailing economic development cycle. During the whole economic boom period, many industries prospered, and various investments expanded. Enterprises’ demand for production land also increased, leading to rising land prices [36]. Therefore, the land-market transaction price is also an important factor affecting the mismatch of labor resources.
The proportion of added value of the tertiary industry (PAVTI): Cities are often the centers of commerce, transportation, communications, finance, culture, education, science and technology, information, and other aspects of a region. The tertiary industry is also typically relatively concentrated [37]. The rise of the tertiary industry will also drive the development of transportation, post and telecommunications, financial services, and various intermediary services [38]. Simultaneously, employment opportunities will increase, as will the economic agglomeration effect.
Regional innovation potential (REP): Innovation runs through the whole social development process. Regional innovation ability refers to the ability to continuously integrate knowledge, technology, information, and other elements into the social production process on the basis of making full use of real information and communication technology in the innovation process [39]. For a region, innovation ability is a comprehensive reflection of the development of knowledge and technology in the region. Innovation ability is also an important factor in the development of social productivity. In this paper, the number of patent applications is used to represent REP.
Railway traffic volume (RTV): Railway transport is an important means of labor transfer in China. Therefore, RTV represents the population flow in a region and is an important factor affecting labor allocation.
Income gap between urban and rural areas (IGUR): The urban–rural income gap mainly refers to the ratio of urban residents’ income to rural residents’ income [40]. The difference in industrial characteristics between urban and rural areas is the objective cause of the income gap between urban and rural residents. The development of non-agricultural industries in rural areas is currently insufficient; the dominant production factors in rural areas caused by the market economy also flow to urban areas. Therefore, the income gap between urban and rural areas is an important factor of labor mobility and one of the important control variables in this study.
The data used in this paper mainly come from the China Statistical Yearbook (2006–2018), China Land and Resources Statistical Yearbook (2006–2018), and official statistical websites of local governments. The descriptive statistics of variables in this paper are shown in Table 1.

Table 1.
Descriptive statistics of variables.
3.2. Model Setting
3.2.1. Individual Fixed-Effect Model
In order to better explore the impact of land-market supply on the allocation of labor resources in various regions, this study adopts a multi-dimensional fixed-effect model [40], with the MSCL as the explanatory variable and the LMIS as the explained variable. The formula is as follows:
Here, represents the individual (province) effect, and represents other variables controlled in the model. The basic control variables in this paper are LTUP, PAVTI, REP, RTV, and IGUR, and represents the error term.
3.2.2. Panel Threshold Effect Model
The threshold effect refers to the phenomenon whereby when one economic parameter reaches a certain value, another economic parameter suddenly turns to other development forms (structural mutation). The critical value of the causal phenomenon is called the threshold value. In order to make this research more targeted and expanded, we finally chose the panel threshold effect model to test the robustness of the regression results of the MSCL on LMIS. The formula is as follows:
Here, is the threshold variable. According to the previous analysis, the MSCL is selected as the threshold variable, and is the threshold value to be estimated. The principle of estimation is based on the principle of the minimum sum of the squares of residuals [41]. In order to mitigate the impact of the possible endogeneity of variables on the results, when estimating the threshold effect, this study also simultaneously controls the individual effect, and adds the basic control variables.
3.2.3. Spatial Durbin Model
A spatial Durbin model (SDM) is a combined expansion form of a spatial lag model and a spatial error term model. A SDM can be established by adding corresponding constraints to a spatial lag model and spatial error model. A SDM is a type of SAR model (spatial autoregressive model), which is enhanced by adding spatial lag variables [42]. The formula is as follows:
Here, is the spatial correlation of dependent variables, and is the spatial correlation of independent variables; can be set as the same or different matrices; is the spatial auto correlation coefficient of the exogenous variable, and is a random perturbation term satisfying normal independent identical distribution.
4. Result
4.1. Analysis of MSCL and LMIS
As can be seen from Figure 2, from 2005 to 2017, the total area of China’s state-owned land increased. This land provided strong support for China’s urbanization and industrial development, and eased the financial pressure on local governments. Due to the demands of public interest groups, the area of allocated land-use rights did not significantly decrease from 2013 to 2017. The decrease in the area of market-oriented land supply was the main reason for the decrease in the total area of land transfer in China. The land factor has been demonstrated in practice to have a good promoting function for social and economic development. Additionally, the market supply of urban construction land can effectively improve the allocation and utilization efficiency of land resources, thus, affecting the allocation of labor resources.
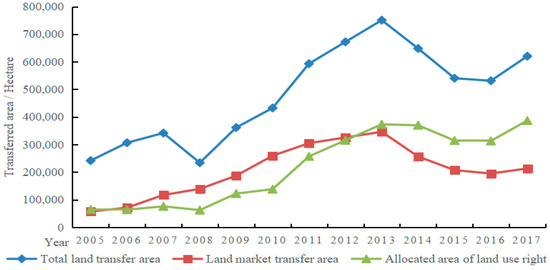
Figure 2.
China’s state-owned land transfer category and area from 2005 to 2017.
As can be seen from Figure 3, in 2005, the regions with a relatively high value of LMIS were Beijing, Tianjin, Shanghai, Guangdong, and Sichuan. The LMIS in the middle and lower reaches of the Yellow River and the northeast region was relatively low. In 2017, the value of LMIS in central China decreased. Meanwhile, the value of LMIS in Beijing, Tianjin, and Shanghai was still relatively high, and the LMIS in Xinjiang and Qinghai decreased. Due to policy support and high economic development, these regions have traditionally had a high degree of industrial transformation, and the current situation of labor allocation is not enough to further drive economic development. The allocation of labor resources in the central and western regions is redundant; very few high-tech industries are located in these regions. The comprehensive technical capability of the labor force is low, and the labor surplus has not been efficiently transformed into economic output.
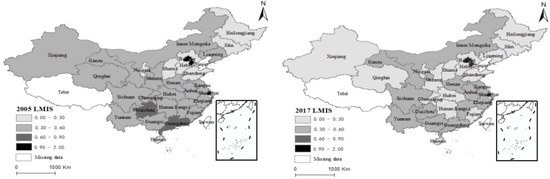
Figure 3.
Spatial layout of LMIS.
4.2. Benchmark Regression
This paper uses panel data to analyze the impact of the MSCL on LMIS. According to the results of the Hausman test, the fixed-effect model was selected (Table A1). In this way, the dynamic influence mechanism of the MSCL on LMIS can be more comprehensively explored. The regression results are shown in Table 2. One can see that the regression coefficient of the MSCL on LMIS is negative and has passed the 1% level significance test in the OLS model. This finding indicates that the MSCL has the effect of reducing LMIS. Taking the fixed-effect model for regression, the result also shows that the regression coefficient of the MSCL is negative and passes the 1% level test. Adding other control variables in the model, the regression coefficient of the MSCL on LMIS is still negative, which also shows that the MSCL plays an obvious role in reducing LMIS.
Table 2.
The estimation results of the econometric model.
The impact of the MSCL on LMIS in the three regions of eastern, central, and western China, respectively, is further studied. One can see from Table 1 that in the three major regions of China, the MSCL will reduce the level of LMIS. In eastern China, the influence coefficient of the MSCL on LMIS is −0.164, which passes the 5% significance test. For the central region, the influence coefficient of the MSCL on LMIS is −0.238, which also passes the 1% significance test. For the western region, the regression coefficient is −0.113. The regression coefficient in the central region is more significant. For each unit of land transfer area increased by bidding, auctioning, and listing, the level of LMIS will be reduced by 26.7%. During the research period, in order to give consideration to both efficiency and fairness, and to realize the coordinated and balanced development of the three regions, China has implemented the “Silk Road Economic Belt” strategies. The aim is to guide sustainable investment in the economy and technology in the central and western regions, especially with regard to the large market supply of land resources. The allocation of labor resources in the central and western regions has changed from a surplus state to a state that matches economic development. In terms of control variables, the increase in PAVTI will increase the LMIS. The development of the tertiary industry will produce an economic agglomeration effect, especially for the eastern region of China, where the economic development is far ahead of the central and western regions. This, in turn, will cause the migrant workers in the central and western regions of China to transfer to the eastern region and increase the LMIS. For the eastern region, the increase in RTV will also increase the LMIS. The increase in RTV will reduce the LMIS in the central and western regions. The railway is an important means of transportation for the transfer of labor from the central and western regions to the eastern region. With the increase in IGUR, the LMIS in the eastern region is increased, while the LMIS level in the central and western regions is reduced. However, the regression coefficient of IGUR for the LMIS in the western region is not significant.
In the fixed-effect regression, we can only find that the regression coefficients of the three major regions in China are all negative. Therefore, it is difficult to compare the influence coefficients of MSCL and LMIS in different provinces. For that reason, based on the individual fixed-effect regression, this study adopts the individual variable coefficient lone-star effect for regression. The regression results are shown in Figure 4. The regression coefficients of Beijing, Tianjin, Shanghai, Yunnan, and Guizhou are greater than 0, which indicates that the market-oriented supply of land in these areas will increase the levels of LMIS. Due to the rapid economic development of Beijing, Shanghai, Tianjin, and the small administrative area, it is difficult for the MSCL to play a role, to a certain extent. The region with a regression coefficient of between −0.1 and 0 is mainly located in the middle and lower reaches of the Yellow River. The areas with regression coefficients of less than −0.1 are mainly distributed in the middle and lower reaches of the Yangtze River.
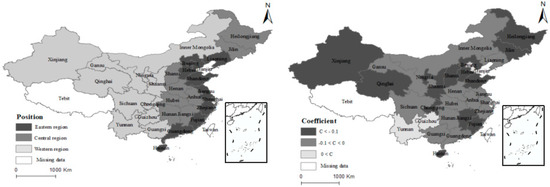
Figure 4.
Classification of the regression coefficient.
4.3. Analysis Based on the Threshold Eeffect
According to the previous analysis, the impact mechanism of the MSCL on LMIS is different in different regions. In order to further analyze the relationship between the two, a panel threshold effect model is used for regression, and the other variables are controlled. The test results of the three threshold effects are shown in Table A2. As can be seen, the MSCL only passes the single-threshold test, and the significance level is 1%. Therefore, the original hypothesis of the model is rejected, and the single-threshold effect exists. This finding indicates that the impact of the MSCL on LMIS has a single-threshold effect.
As shown in Table 3 and Table 4, the MSCL threshold value is 18,045 hectares. The consistency of the threshold value can be determined by drawing the image of the likelihood ratio function and the image under the corresponding horizontal line when a = 0.05. As can be seen from Figure 5, LR reaches the minimum when the MSCL threshold value is 18,045 hectares, thus, the threshold value is considered to be consistent.
Table 3.
Single-threshold effect test.
Table 4.
Single-threshold estimator.
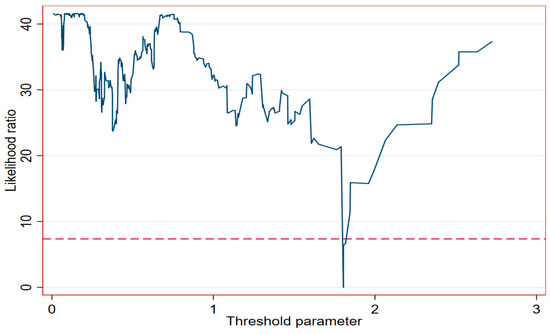
Figure 5.
Likelihood ratio test.
Table 5 shows the results of the threshold effect. When the MSCL is less than 18,045 hectares, the impact of the MSCL on LMIS is −0.324 and passes the 1% significance level test. When the MSCL is higher than 18,045 hectares, the regression coefficient of the impact of the MSCL on LMIS is −0.042 and fails to pass the significance level test. This finding shows that the MSCL strategy promoted by the government has difficulty reducing the level of LMIS when the MSCL is high. Although this study has found that land-market supply can significantly reduce the improper allocation of labor, we have also found through the threshold effect analysis that the land-market supply area is not better simply for being larger. When the MSCL exceeds 18,045 hectares, the MSCL has no significant effect on LMIS, and the regression coefficient is also at a very low level. Therefore, when the government attracts investment by supplying land resources, it should also improve the enterprises’ access conditions, attract investment in high-tech industries, and replace the traditional economic development mode of simply expanding the number of enterprises with the high-quality economic development mode dominated by technological progress. The government needs to improve production efficiency, promote the comprehensive development of the social economy, and effectively reduce the level of LMIS. Additionally, it is worth noting that after the enterprise obtains the land-use right, there is still a two-year land development period. As such, the relevant government departments should strengthen supervision in order to put the land elements and labor elements into production as soon as possible, and thereby, obtain the maximum economic benefits.
Table 5.
Regression results of the threshold effect.
During our research period, the areas where the MSCL was greater than the threshold value of 18,405 hectares included Jiangsu, Shandong, Hebei, Liaoning, and Anhui (Figure 6). The years when the MSCL of Liaoning Province reached the threshold include 2010, 2011, and 2012. Anhui Province and Hebei Province only reached the threshold value in 2013. However, both Jiangsu Province and Shandong Province continuously exceeded the threshold value from 2008 to 2017. In particular, at the end of the study period, the MSCL of Jiangsu Province was still far higher than the threshold value of 18,045 hectares. During the study period, the regional GDP of Guangdong, Jiangsu, and Shandong Provinces were always among the top three in the GDP of all provinces in China. The development of Guangdong Province has benefited from the development of economic development zones and the introduction of advanced technologies. However, Shandong and Jiangsu Provinces have not broken through the traditional situation of land transfer being the prerequisite condition for the introduction of projects. Jiangsu and Shandong Provinces still need to avoid the excessive supply of construction land. At present, the two regions should carry out market-oriented land supply for the purpose of saving land and improving land-use efficiency.
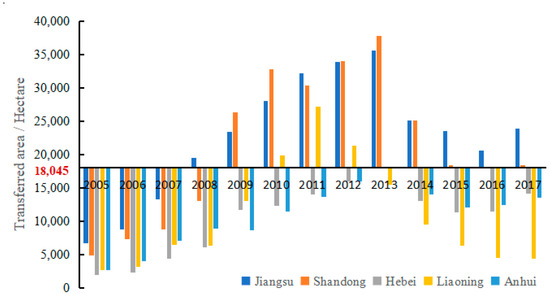
Figure 6.
Changes of the land-market supply area in four regions.
4.4. Robustness Test Analysis Based on Spatial Spillover Effects
The term ‘spatial spillover effect’ refers to the change of the explained variable in the adjacent area caused by the change of a certain characteristic (explanatory variable) in a certain area. This indirect effect is transmitted through spatial interaction and gradually declines in line with the increase in the distance between spatial units. Therefore, this study uses a SDM to explore the spatial spillover effect of land-market supply on the mismatch of labor resources. The SDM needs a scientific spatial weight matrix. When studying the phenomenon of regional economic agglomeration, in many cases, geographical proximity cannot represent the same correlation compared with the spatial weight matrix, of which is constructed on the basis of geographic information. In this paper, the per capita GDP index of each region is selected as the weight matrix of economic distance to facilitate subsequent calculation.
To carry out SDM regression, a spatial correlation analysis must first be carried out on the explained variables. Only when the LMIS has spatial correlation and has passed the significance test can it be proved that the variables in different regions have spatial correlation. In this paper, the global Moran index (Moran’s I) and the local Moran index (Geary’s C) are used to express the spatial correlation of the explained variables, as shown in Figure 7 and Table A3. With the development of time, the Moran’s I index first increases, then decreases, and finally increases again. The Geary’s C and global Moran index is opposite. The Moran index of all study years passed the significance test, which indicates that the LMIS has spatial correlation, and a SDM regression analysis can be carried out.
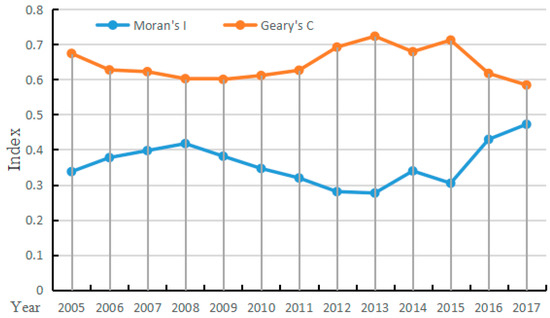
Figure 7.
Moran’s I and Geary’s C, from 2005 to 2017.
As can be seen from Table 6, the SDM has not degenerated into SAR and SES models. Therefore, this study finally chose the SDM for regression, and the regression results are shown in Table 7. The main effect of the MSCL on LMIS is −0.149, and the total impact effect is −0.340, having passed the significance test at the level of 5%. This finding indicates that the MSCL can reduce the level of LMIS, and shows that the results of this study are consistent; the research results have also passed the robustness test. Through SDM regression, the total regression effect can be decomposed into the direct effect and indirect effect. The direct effect of the MSCL on LMIS is −0.156, and the indirect effect is −0.183. Both the direct effect and indirect effect have passed the 5% significance test, indicating that the MSCL not only can reduce the level of LMIS in this region, but can also reduce the LMIS in other regions through the adjacent relationship between regions. In order to better understand the spatial spillover effect of the MSCL on LMIS, this study also established a geographical location matrix of each region and carried out regression. The total regression effect of the SDM, constructed according to the geographical location matrix, is negative, but the indirect effect is not significant. This finding shows that the impact of the MSCL on the LMIS is not one of ‘the closer the geographical distance is, the more significant is the impact effect’. Rather, the impact is closely related to the economic development of each region. The main characteristics of the migration of the Chinese labor force are not only those of moving to the neighboring areas, but also to the more economically developed areas. In particular, China has greatly increased investment in the construction of the transportation network, which makes the migration (and return) of labor resources more convenient.
Table 6.
Spatial spillover effect test and model selection.
Table 7.
Regression results of SDM.
5. Discussion
Effectively and efficiently allocating resources among regions has been a focus of scholars in China and around the world [43]. The balanced allocation of resources is related to fairness and efficiency and is an important issue of sustainable development throughout the world. Existing research on the issue of LMIS is mainly from the perspective of economics and demography [10,44]. This limited perspective, to a certain extent, ignores the allocation of production factors caused by the transformation of land function.
Through the research of this paper, we have come to the extremely important conclusion that the MSCL can effectively reduce the level of LMIS. This finding is consistent with the view mentioned in the capital that “the market determining the allocation of resources is the general law of market economy” [45,46]. This theory holds that, in the process of the market determining the allocation of resources, the competition mechanism causes the supply and demand mechanism to play a role, and thus, determines the direction of the rational allocation of resources. The price mechanism determines the flow of resource allocation in different industries, different regions, and different enterprises [47]. This view is also consistent with our constructed theoretical framework. At present, the market-oriented reform of land elements by the Chinese government is still a work in progress. Although the MSCL in China gradually decreased in 2013, this does not mean that the speed of the market-oriented reform of land has slowed down. At present, the primary task of the market-oriented land reform is to ensure that there is a complete set of standard procedures to provide support and guidance so that enterprises bidding for urban construction land can participate in the process of the occupation and use-of-land elements in a fair and just manner.
This study also found that the MSCL in the middle and lower reaches of the Yellow River has a greater impact on the LMIS than in the middle and lower reaches of the Yangtze River. The Yangtze River Economic Belt is one of the most important industrial corridors in China. Most of China’s modern core industries, such as steel, automobiles, electronics, and petrochemicals, are gathered here [48], thus, indicating that there are a large number of high-energy, high-tech industrial industries and super large enterprises in this corridor. During the study period, the market-oriented mechanism of land resources in the region was relatively mature, and the employment capacity was basically stable. For a long time, most of the middle and lower reaches of the Yellow River have been dominated by traditional agriculture and manufacturing industries [49]. At this new stage of development, however, the Chinese government is attracting high-tech enterprises to enter through land transfer. This is the support offered to attract investment, and to accelerate the industrial development in the Bohai Rim region and the “Beijing–Tianjin–Hebei” region. During the research period, the MSCL achieved certain results and greatly reduced the level of LMIS.
There is a threshold effect of the MSCL on LMIS. When the MSCL reaches 18,405 hectares, the effect of the MSCL on LMIS is not significant. Objectively, there is no doubt that the law of diminishing marginal utility exists; in addition, it is precisely because of the diminishing marginal utility that there is the problem of how to realize the rational allocation of scarce resources. The MSCL can indeed reduce LMIS, but this does not mean that more MSCL is better. Land-production efficiency is also an important factor affecting the allocation of labor resources [50]. For Shandong Province and Jiangsu Province, the MSCL in most years during the study period exceeded 18,405 hectares, and the marginal decline of land resources was very obvious. Both Shandong and Jiangsu are provinces with a high economic aggregate in China. The traditional land-supply mode should be changed. The land-supply target should be the introduction of high-tech enterprises and high-quality economic development.
This study also made a robust analysis of the main research conclusions. It should be noted that there is a spatial spillover effect of the MSCL on LMIS, and the indirect effect is greater than the direct effect. The results are consistent with the current situation of China’s labor resources. In 2021, the total number of migrant workers in China was about 300 million, of which 71.3 million will have flowed across provinces. From the perspective of the output areas, the inter-provincial migrant workers in the central region accounted for 56.6% of the migrant workers who went out; the western region accounted for 47.8%, and the migrant workers in the eastern region mainly flowed within the province. We also indirectly confirmed the fact that labor resources tend to migrate to economically developed areas, and not just to adjacent areas. This was done by comparing the regression results based on different spatial adjacency matrices [51].
6. Conclusions and Implications
The development of China’s economy has entered a transition period, and the allocation of land resources is having an increasingly important impact on the social relations of production. At present, with the reform of the state-owned construction land-supply mode in China, the level of resource allocation is also undergoing important changes. This study uses panel regression analysis to quantitatively measure the effect of the MSCL on LMIS. The threshold effect and spatial spillover effect of the MSCL on LMIS are also analyzed.
During the study period, the LMIS gradually decreased. The development of the MSCL can effectively reduce the level of LMIS. With regard to the effect of influence and the central region > the eastern region > the western region. Through threshold-effect regression, one can see that there is a single threshold for the effect of the MSCL on LMIS, When the MSCL is less than 18,045 hectares, the impact of the MSCL on the LMIS is −0.324 and passes the 1% significance level test. When the MSCL is higher than 18,045 hectares, the regression coefficient of the impact of the MSCL on the LMIS is −0.042 and fails to pass the significance level test. During most of years of the study period, Shandong Province and Jiangsu Province exceeded the threshold. We also found that there is a spatial spillover effect on the impact of the MSCL on LMIS.
The key path for the market-oriented reform of land elements is still the rational definition of the relationship between government regulation and market allocation. On the one hand, government departments must formulate scientific land-market reform strategies to effectively allocate state-owned land. The transfer plan for state-owned construction land should be combined with the orientation of urban functional development. When bidding for the rights to use construction land, the necessary qualifications of enterprises participating in that bidding should be specified in detail. The main purpose should be the introduction of high-tech industries. The impact of land supply on LMIS has a certain lag. When enterprises obtain land-use rights according to law, the government should urge the enterprises using the land to construct infrastructure and put the land into production as soon as possible. Such steps would maximize the production efficiency of land resources. The relevant government supervision department should formulate the land-market bidding system and supervision mechanism to prevent some enterprises from damaging the principle of fair competition by the means of non-compliant bidding. On the other hand, the government’s work should change from a management function to a service function, and the abilities related to land-market-oriented allocation should be improved. The government’s land management departments cannot directly participate in land production and management, but these departments should concentrate on land-use planning and administration according to law. At the same time, the government should improve the social hearing system, innovate the open content and form of land-market allocation, and guarantee the participation and supervision rights of all bidding enterprises.
This study mainly focuses on the impact of the MSCL on LMIS between provinces in China. However, different urban agglomerations also have different characteristics, and future research should further refine the research units. At the same time, the transfer of labor between urban and rural areas is also one of the important factors affecting LMIS. Based on the market-oriented supply of land in typical case areas, this is also one of the future directions to take when studying the flow of labor resources between urban and rural areas.
Author Contributions
C.J.: Conceptualization, methodology, formal analysis, writing—original draft, data collection and editing. J.L.: Formal analysis, review and project support. All authors have read and agreed to the published version of the manuscript.
Funding
This research was funded by National Natural Science Foundation of China: 42001192; China Postdoctoral Science Foundation: 2019M662329; Ministry of Education of the People’s Republic of China: 20YJCZH070; Shandong University Youth Team Project: IFYT20004.
Data Availability Statement
The data in this paper can be downloaded at: https://data.cnki.net/Yearbook/Navi?type=type&code=A (accessed on 1 July 2022).
Conflicts of Interest
The authors declare no conflict of interest.
Appendix A
Table A1.
Fixed-effect test.
Table A1.
Fixed-effect test.
| Vars | FE | RE | (b-B)/Difference | sqrt(diag(V_b-V_B))/S.E. |
|---|---|---|---|---|
| MSCL | −0.146 | −0.150 | 0.004 | 0.009 |
| LTUP | 0.056 | 0.070 | −0.014 | 0.011 |
| AVT | 6.448 | 6.312 | 0.137 | 0.686 |
| REP | −0.286 | −0.254 | −0.032 | 0.012 |
| RTV | 0.167 | 0.164 | 0.003 | 0.025 |
| IGUR | −0.670 | −0.381 | −0.289 | 0.141 |
| Test | Ho: the difference in coefficients is not systematic | |||
| chi2(7) | 13.23 | |||
| Prob > chi2 | 0.066 | |||
Table A2.
Triple-threshold effect test.
Table A2.
Triple-threshold effect test.
| Threshold | RSS | MSE | F | Prob |
|---|---|---|---|---|
| Single | 41.9638 | 0.1113 | 42.38 | 0.0100 |
| Double | 40.7553 | 0.1081 | 11.18 | 0.3800 |
| Triple | 40.1973 | 0.1066 | 5.23 | 0.7767 |
Table A3.
Spatial correlation test.
Table A3.
Spatial correlation test.
| Year | Moran’s I | Geary’s C | ||
|---|---|---|---|---|
| I | p-Value | c | p-Value | |
| 2005 | 0.337 | 0.000 | 0.674 | 0.000 |
| 2006 | 0.377 | 0.000 | 0.627 | 0.000 |
| 2007 | 0.397 | 0.000 | 0.622 | 0.000 |
| 2008 | 0.417 | 0.000 | 0.602 | 0.000 |
| 2009 | 0.381 | 0.000 | 0.600 | 0.000 |
| 2010 | 0.346 | 0.000 | 0.611 | 0.000 |
| 2011 | 0.319 | 0.000 | 0.626 | 0.000 |
| 2012 | 0.280 | 0.000 | 0.692 | 0.001 |
| 2013 | 0.276 | 0.000 | 0.723 | 0.003 |
| 2014 | 0.339 | 0.000 | 0.679 | 0.001 |
| 2015 | 0.304 | 0.000 | 0.712 | 0.002 |
| 2016 | 0.429 | 0.000 | 0.617 | 0.000 |
| 2017 | 0.472 | 0.000 | 0.584 | 0.000 |
References
- Pu, W.F.; Zhang, A.L. Can China’s Market-Oriented Reform Improve the Efficiency of Industrial Land Use? A Panel Data Empirical Analysis at Prefecture Level From 2007–2019. Front. Environ. Sci. 2022, 10, 884958. [Google Scholar] [CrossRef]
- Cai, M.N.; Fan, J.Y.; Ye, C.H.; Zhang, Q. Government debt, land financing and distributive justice in China. Urban Stud. 2021, 58, 2329–2347. [Google Scholar] [CrossRef]
- Xie, H.L.; Lu, H. Impact of land fragmentation and non-agricultural labor supply on circulation of agricultural land management rights. Land Use Policy 2017, 68, 355–364. [Google Scholar] [CrossRef]
- Hilber, C.A.L.; Robert-Nicoud, F. On the origins of land use regulations: Theory and evidence from US metro areas. J. Urban Econ. 2013, 75, 29–43. [Google Scholar] [CrossRef]
- Wu, S.P.; Yang, Z. Informal government preferences and asymmetric land allocation in China. Land Use Policy 2020, 99, 105085. [Google Scholar] [CrossRef]
- Li, Y.H.; Li, Y.R.; Westlund, H.; Liu, Y.S. Urban-rural transformation in relation to cultivated land conversion in China: Implications for optimizing land use and balanced regional development. Land Use Policy 2015, 47, 218–224. [Google Scholar] [CrossRef]
- Park, K.S. Money, Mortgages, and the Conquest of America. Law Soc. Inq.-J. Am. Bar Found. 2016, 41, 1006–1035. [Google Scholar] [CrossRef]
- Keenan, S. From historical chains to derivative futures: Title registries as time machines. Soc. Cult. Geogr. 2019, 20, 283–303. [Google Scholar] [CrossRef]
- Mateos-Romero, L.; Salinas-Jimenez, M.D. Skills use in the workplace and its effects on wages and on job satisfaction: An application to the Spanish case. Pers. Rev. 2018, 47, 494–516. [Google Scholar] [CrossRef]
- Hsieh, C.T.; Klenow, P.J. Misallocation and manufacturing tfp in china and India. Q. J. Econ. 2009, 124, 1403–1448. [Google Scholar] [CrossRef]
- Crowley, F.; Doran, J.; McCann, P. The vulnerability of European regional labour markets to job automation: The role of agglomeration externalities. Reg. Stud. 2021, 55, 1711–1723. [Google Scholar] [CrossRef]
- Jonsson, J.; Muntaner, C.; Bodin, T.; Alderling, M.; Balogh, R.; Burstrom, B.; Davis, L.; Gunn, V.; Hemmingsson, T.; Julia, M.; et al. Low-quality employment trajectories and risk of common mental disorders, substance use disorders and suicide attempt: A longitudinal study of the Swedish workforce. Scand. J. Work. Environ. Health 2021, 47, 509–520. [Google Scholar] [CrossRef] [PubMed]
- Suwito, T. Population mobility based on social integrity factors. In Proceedings of the 1st International Conference on Geography and Education (ICGE), Malang, Indonesia, 29 October 2016; pp. 139–143. [Google Scholar]
- Luo, J.J.; Xing, X.S.; Wu, Y.Z.; Zhang, W.W.; Chen, R.S. Spatio-temporal analysis on built-up land expansion and population growth in the Yangtze River Delta Region, China: From a coordination perspective. Appl. Geogr. 2018, 96, 98–108. [Google Scholar] [CrossRef]
- Brandt, L.; Van Biesebroeck, J.; Zhang, Y. Creative accounting or creative destruction? firm-level productivity growth in Chinese manufacturing. J. Dev. Econ. 2012, 97, 339–351. [Google Scholar] [CrossRef]
- Duflo, A.B.E. Growth Theory Through the Lens of Development Economics. Soc. Sci. Electron. Publ. 2005, 1, 473–552. [Google Scholar]
- Michaelides, M. Labour market oligopsonistic competition: The effect of worker immobility on wages. Labour Econ. 2010, 17, 230–239. [Google Scholar] [CrossRef]
- Fan, X.; Qiu, S.N.; Sun, Y.K. Land finance dependence and urban land marketization in China: The perspective of strategic choice of local governments on land transfer. Land Use Policy 2020, 99, 105023. [Google Scholar] [CrossRef]
- Xiong, Y.; Chen, Y.; Peng, F.; Li, J.Z.; Yan, X.J. Analog simulation of urban construction land supply and demand in Chang-Zhu-Tan Urban Agglomeration based on land intensive use. J. Geogr. Sci. 2019, 29, 1346–1362. [Google Scholar] [CrossRef]
- Nosrat, A.H.; Jeswiet, J.; Pearce, J.M. Cleaner production via industrial symbiosis in glass and large-scale solar photovoltaic manufacturing. In Proceedings of the IEEE Toronto International Conference on Science and Technology for Humanity, Toronto, ON, Canada, 26–27 September 2009; pp. 967–970. [Google Scholar]
- Hong, H.R.; Gasparatos, A. Eco-industrial parks in China: Key institutional aspects, sustainability impacts, and implementation challenges. J. Clean. Prod. 2020, 274, 122853. [Google Scholar] [CrossRef]
- Ciuriak, D.; Lapham, B.; Wolfe, R.; Collins-Williams, T.; Curtis, J. Firms in International Trade: Trade Policy Implications of the New Trade Theory. Glob. Policy 2015, 6, 130–140. [Google Scholar] [CrossRef]
- Gabriela, R.I.; Alexandru, G. Advanced Theories in International Trade. Metal. Int. 2009, 14, 123–127. [Google Scholar]
- Wu, K.; Wang, X.N. Understanding Growth and Shrinkage Phenomena of Industrial and Trade Cities in Southeastern China: Case Study of Yiwu. J. Urban Plan. Dev. 2020, 146, 05020028. [Google Scholar] [CrossRef]
- Yan, J. Technical analysis on business model of Wenzhou. In Proceedings of the 2nd International Conference on Civil Engineering, Architecture and Building Materials (CEABM 2012), Yantai, China, 25–27 May 2012; pp. 3585–3588. [Google Scholar]
- Wang, Y.A.; Yin, S.W.; Fang, X.L.; Chen, W. Interaction of economic agglomeration, energy conservation and emission reduction: Evidence from three major urban agglomerations in China. Energy 2022, 241, 122519. [Google Scholar] [CrossRef]
- Deng, L.B.; Luo, F. An study on the technology spillover theory and the technology innovation of indigenous enterprises in China. In Proceedings of the 5th International Conference on Innovation and Management, Maastricht, The Netherlands, 10–11 December 2008; pp. 100–107. [Google Scholar]
- Wang, X.T.; Qi, Y.W. The Impact of Institutional Distance on Innovation Performance of OFDI Enterprises: Comparison of Coastal and Inland Regions in China. J. Coast. Res. 2020, 106, 166–170. [Google Scholar] [CrossRef]
- Tian, H. Innovation Research on Medium and Low-tech Traditional Industry. In Proceedings of the 4th International Conference on Applied Mechanics and Mechanical Engineering (ICAMME 2013), Singapore, 11–12 October 2013; pp. 413–417. [Google Scholar]
- Liu, G.M.; Wang, H.J.; Lang, X.; Yu, K. Hiding or sharing? Technology upgrade, technology spillover and information asymmetry. Rairo-Oper. Res. 2022, 56, 1917–1945. [Google Scholar] [CrossRef]
- Dai, X.Y.; Sun, Z. Does firm innovation improve aggregate industry productivity? Evidence from Chinese manufacturing firms. Struct. Chang. Econ. Dyn. 2021, 56, 1–9. [Google Scholar] [CrossRef]
- Chen, Y.W.; Hu, W.M. Distortions, Misallocation and Losses: Theory and Application. China Econ. Q. 2011, 10, 1401–1422. (In Chinese) [Google Scholar]
- Ji, S.H.; Zhu, Y.M.; Zhang, X. Study of Industrial Agglomeration Improving Misallocation of Resources. China Ind. Econ. 2016, 6, 73–90. (In Chinese) [Google Scholar]
- Cai, Z.W.; Chen, L.N.; Fang, Y. Semiparametric Estimation of Partially Varying-Coefficient Dynamic Panel Data Models. Econ. Rev. 2015, 34, 694–718. [Google Scholar] [CrossRef]
- Ji, C.J.; Hu, Y.J.; Tang, B.J. Research on carbon market price mechanism and influencing factors: A literature review. Nat. Hazards 2018, 92, 761–782. [Google Scholar] [CrossRef]
- Ingstrup, M.B.; Christensen, P.R. Transformation of cluster specialization in the wake of globalization. Entrep. Reg. Dev. 2017, 29, 500–516. [Google Scholar] [CrossRef]
- Xing, H.F.; Meng, Y. Revealing deep semantic commercial patterns: Insights from urban landscape depiction. Comput. Environ. Urban Syst. 2020, 79, 101404. [Google Scholar] [CrossRef]
- Guo, W.; Dai, H.J.; Liu, X.R. Impact of different types of environmental regulation on employment scale: An analysis based on perspective of provincial heterogeneity. Environ. Sci. Pollut. Res. 2020, 27, 45699–45711. [Google Scholar] [CrossRef] [PubMed]
- Svare, H.; Gausdal, A.H. Strengthening regional innovation through network-based innovation brokering. Entrep. Reg. Dev. 2015, 27, 619–643. [Google Scholar] [CrossRef]
- Jiang, C.J.; Li, J.T.; Liu, J.L. Does urbanization affect the gap between urban and rural areas? Evidence from China. Socio-Econ. Plan. Sci. 2022, 82, 101271. [Google Scholar] [CrossRef]
- Hansen, B.E. Threshold effects in non-dynamic panels: Estimation, testing, and inference. J. Econ. 1999, 93, 345–368. [Google Scholar] [CrossRef]
- Elhorst, J.P. Dynamic Spatial Panels: Models, Methods and Inferences. J. Geogr. Syst. 2012, 14, 5–18. [Google Scholar] [CrossRef]
- Li, Y.R.; Wang, J.; Liu, Y.S.; Long, H.L. Problem regions and regional problems of socioeconomic development in China: A perspective from the coordinated development of industrialization, informatization, urbanization and agricultural modernization. J. Geogr. Sci. 2014, 24, 1115–1130. [Google Scholar] [CrossRef]
- Manning, A. The Elusive Employment Effect of the Minimum Wage. J. Econ. Perspect. 2021, 35, 3–26. [Google Scholar] [CrossRef]
- Kincaid, J. Production vs. realisation: A critique of Fine and Saad-Filho on value theory. Hist. Mater.-Res. Crit. Marx. Theory 2007, 15, 137–165. [Google Scholar] [CrossRef]
- Peláez Gramajo, J.G. Inconsistencia del equilibrio parcial en la teoría del valor y su consistencia macroeconómica. Econ. Teoría Práctica 2018, 48, 9–38. [Google Scholar] [CrossRef]
- Richards, T.J.; Allender, W.J.; Hamilton, S.F. Commodity price inflation, retail pass-through and market power. Int. J. Ind. Organ. 2012, 30, 50–57. [Google Scholar] [CrossRef]
- Li, Y.-y.; Liu, L.-p.; Liu, Y.-y. Spatial Distribution Pattern and Influencing Factors of Industrial Pollution Emissions in Yangtze River Economic Belt. Huanjing Kexue 2021, 42, 3820–3828. [Google Scholar]
- Guo, X.-J.; Zhou, R.; Li, J.-Z.; Lu, C.-P. Spatial-temporal Evolution Characteristics and Influencing Factors of Agricultural Resources and Environment Efficiency in the Yellow River Basin. J. Ecol. Rural. Environ. 2021, 37, 332–340. [Google Scholar]
- Fetzel, T.; Niedertscheider, M.; Haberl, H.; Krausmann, F.; Erb, K.H. Patterns and changes of land use and land-use efficiency in Africa 1980–2005: An analysis based on the human appropriation of net primary production framework. Reg. Environ. Chang. 2016, 16, 1507–1520. [Google Scholar] [CrossRef]
- Qiao, L.Y.; Li, Y.R.; Liu, Y.S.; Yang, R. The spatio-temporal change of China’s net floating population at county scale from 2000 to 2010. Asia Pac. Viewp. 2016, 57, 365–378. [Google Scholar] [CrossRef]


Publisher’s Note: MDPI stays neutral with regard to jurisdictional claims in published maps and institutional affiliations. |
© 2022 by the authors. Licensee MDPI, Basel, Switzerland. This article is an open access article distributed under the terms and conditions of the Creative Commons Attribution (CC BY) license (https://creativecommons.org/licenses/by/4.0/).