Article

Spatial Pattern and Key Environmental Determinants of Vegetation in Sand Mining and Non-Mining Sites along the Panjkora River Basin

1
College of General Education, University of Doha for Science and Technology, Arab League Street, Doha P.O. Box 24449, Qatar
2
Department of Botany, University of Malakand, Khyber Pakhtunkhwa, Chakdara P.O. Box 18800, Pakistan
3
College of Health Sciences, University of Doha for Science and Technology, Arab League Street, Doha P.O. Box 24449, Qatar
*
Author to whom correspondence should be addressed.
Land 2022, 11(10), 1801; https://doi.org/10.3390/land11101801
Submission received: 4 September 2022 / Revised: 10 October 2022 / Accepted: 12 October 2022 / Published: 14 October 2022

Abstract

:
A specific set of environmental conditions characterizes plant species patterns and distribution on Earth. Similarly, riparian vegetation can be impacted by anthropogenic activities like mining practices involving the removal of vegetation cover, which destroys the structure and diversity of the habitat, adversely affecting the ecosystem services. In this study, we explored the role of environmental variables and biotic intervention in deriving spatial patterns and distribution of riparian vegetation at mining and non-mining sites along the most depleted Panjkora River basin in NW Pakistan. Vegetation data and its determining factors at 28 mining and non-mining sites (14 each) were sampled using 10 m × 10 m (100 m2) systematic plots at 50 m intervals along transects in a downstream direction from the upper catchments to the bottom junction with the Swat River. We recorded 186 species in both mining and non-mining sites, belonging to 70 families comprising 174 angiosperms, 3 gymnosperms, and 9 Pteridophytes. Results show that annual or perennial therophytic life forms predominated in the Panjkora River system, indicating anthropogenic disturbances. At the same time, the aggressively invasive species, such as Xanthium strumarium and Cannabis sativa, further heightened plant community disturbances. Generally, the species diversity was higher in non-mining sites and may be attributed to habitat fragmentation. Likewise, the Canonical Correspondence Analysis (CCA-ordination) revealed that geographic coordinate (i.e., latitude r = 0.80; longitude r = 0.75) and elevation (r = 0.95) were more meaningful predictors than soil texture (i.e., silt%, r = −0.30), nutrients (i.e., potassium, r = −0.35; phosphorus, r = 0.38) and soil pH (r = −0.50) in shaping the spatial pattern and vegetation structure. Our result implies that the present vegetation composition and spatial assemblages are due to heavy anthropogenic interventions, especially mining activities. Therefore, the heavily degraded fragile riparian system of the Panjkora River and its tributaries needed to be conserved and restored by predicting the composition of communities in response to changing climatic conditions.

1. Introduction

Plant species are not evenly or randomly distributed throughout the world; instead, they are distributed along distinct geographical units due to specific climatic and environmental factors [1,2]. Plant species distribution is influenced by biotic and abiotic variables, including environmental changes, soil types, species migration, habitat characteristics, terrain, hydrology, geology, tectonic plate movement, etc. Due to all of these dynamics, ancient habitat topography and climate are drastically altered, mountains are raised, and as a result, ecological factors (competition, hybridization, and pollination) significantly impact the patterns of phytogeographical distribution [3]. Its phytogeographic analysis traces specific plant species allocation, diversification, evolution, and origin [4].
Because riparian vegetation is regarded as one of the indicators to be used in management practices, ecologists and land managers are aware of the variety of ecosystem services it provides [5]. Variations in the riparian environment substantially influence the composition and diversity of plant species [6]. Plant species variety has increased significantly due to variations in the riparian ecosystem’s soil physicochemical characteristics and microclimate [7]. Natural and artificial calamities drastically destroy an area’s vegetation [8,9]. Over-exploitation is the primary factor causing the observed reduction in an area’s vegetation, which often progresses more rapidly than the pace of species regeneration and natural restoration. Numerous reasons, such as the removal of trees for use as lumber and wood, the expansion of agricultural land, the rapid spread of invasive species, and grazing pressure, contribute to the ongoing loss of species diversity in these environments [7].
The health of the local ecosystems and the protection of the streams and accompanying fauna depend on the riparian vegetation [10]. Despite their significance, anthropoid activities have fragmented these forest corridors lowering biodiversity and several ecological processes, making riparian forests one of the most degraded ecosystems in the world [10,11]. Floristic and structural studies are necessary to understand a given community better and track the profile of habitats with unique environmental features in response to human stresses [11]. When addressing abiotic elements such as edaphic attributes, these studies allow the comprehension of how these abiotic factors, in addition to floristic composition, environmental quality, vegetation structure, and history, might impact the vegetation of these sites [12]. Moreover, the formation of subgroups in vegetative forms with specific affinities and edaphic factors influences vegetation significantly at the local scale [13].
Similarly, local elements such as soil, topography, and vegetation in the region significantly influence riparian vegetation, resulting in a varied floristic composition with species characteristic of river banks and distinct phytophysiognomies [14]. Additionally, due to regular changes, mostly brought on by variations in the inundating regime and natural and human instabilities, riparian vegetation often displays substantial variety in its species structure and geographic distribution [15]. Because of the abundance of forest species, these forests are often better off in terms of vegetation than non-riparian habitats [16].
Sand mining has become a significant source of employment for a substantial number of people worldwide and has brought about harmful anthropogenic alterations in the river basins where this activity takes place [17]. River sand and gravel have long been utilized as aggregate for building and road construction, and demand for these resources is still growing. Sand is primarily obtained in Indonesia via river or stream mining [18]. The natural balance of a stream channel may be drastically altered by excessive sand removal [19]. By disrupting the subterranean bed, the procedure impacts the land, causing water imbalances and harmful environmental issues in the affected regions [20,21]. A drop in the groundwater level reduces the amount of water accessible for home and agricultural use. People relying on agricultural land for living also lose their jobs due to mining operations destroying their farmland [22]. Sand mining negatively impacts the vegetation’s structure and content and causes societal unrest [23].
Management and successful restoration efforts in susceptible areas affected by mining depend on an understanding of species composition, vegetation structure, and interactions between vegetation and edaphic components [24]. Past sand mining studies have focused on the advantages and disadvantages of sand mining methods on the environment and local people’s means of subsistence in various places. For example, the studies conducted by [20,21,22,23,24] have focused on the mining activities and their socioeconomic importance. However, these studies lack vegetation characteristics and their relationship with the corresponding environmental factors. Therefore, a detailed study was conducted to compare the riparian vegetation diversity between mining and non-mining communities along the Panjkora River basin, Khyber Pakhtunkhwa, Pakistan.
The significant environmental factors that operate in riparian vegetation were also evaluated using multivariate analysis. We hypothesized that mining had resulted in a deliberate change in habitat structure that is well evident from the floristic composition and vegetation structure of communities and its diversity and can be assessed by comparing it with control sites (non-mining sites). This research will add to our understanding of the region’s mining communities and will provide insight into how we can better manage these communities for socioeconomic benefit and conservation.

2. Materials and Methods

2.1. Study Area

The Panjkora River basin in Khyber Pakhtunkhwa, Pakistan, originates from tributaries of the eastern Hindu Kush Mountains and was the site of the current research (Figure 1) [25]. The Panjkora River begins as a torrent from the Hindukush Mountain’s enormous icecaps. It regenerates at the intersection of Barawal and Jandool streams to the east and Ushirai and Niag streams to the west. It originates in District Dir Lower, its flow travels 113 kilometres, has a catchment area of 5905 km2, and enters the Chakdara Valley before joining the Swat River near Qalangi [26]. Alternatively, it is separated from Kabul, and the Swat River basins by western and eastern mountain ranges and the extension of these mountain ranges then forms the Panjkora River basin. Geographically, the region stretches from 71°13′8′′ to 72°22′13′′ E longitude and 34°39′30′′ to 35°47′17′′ N latitude. These mountains are covered with snow and have numerous glaciers in valleys that reach above 4000 m above sea level (a.s.l.) climatically; the area under the present work has a cool to warm summer with temperatures ranging from 16 °C to 32 °C. There is a significant drop in the temperature between December and February, and is characterized by snowfall. Rainfall is reported annually and varies from 823 to 2149 mm [27].

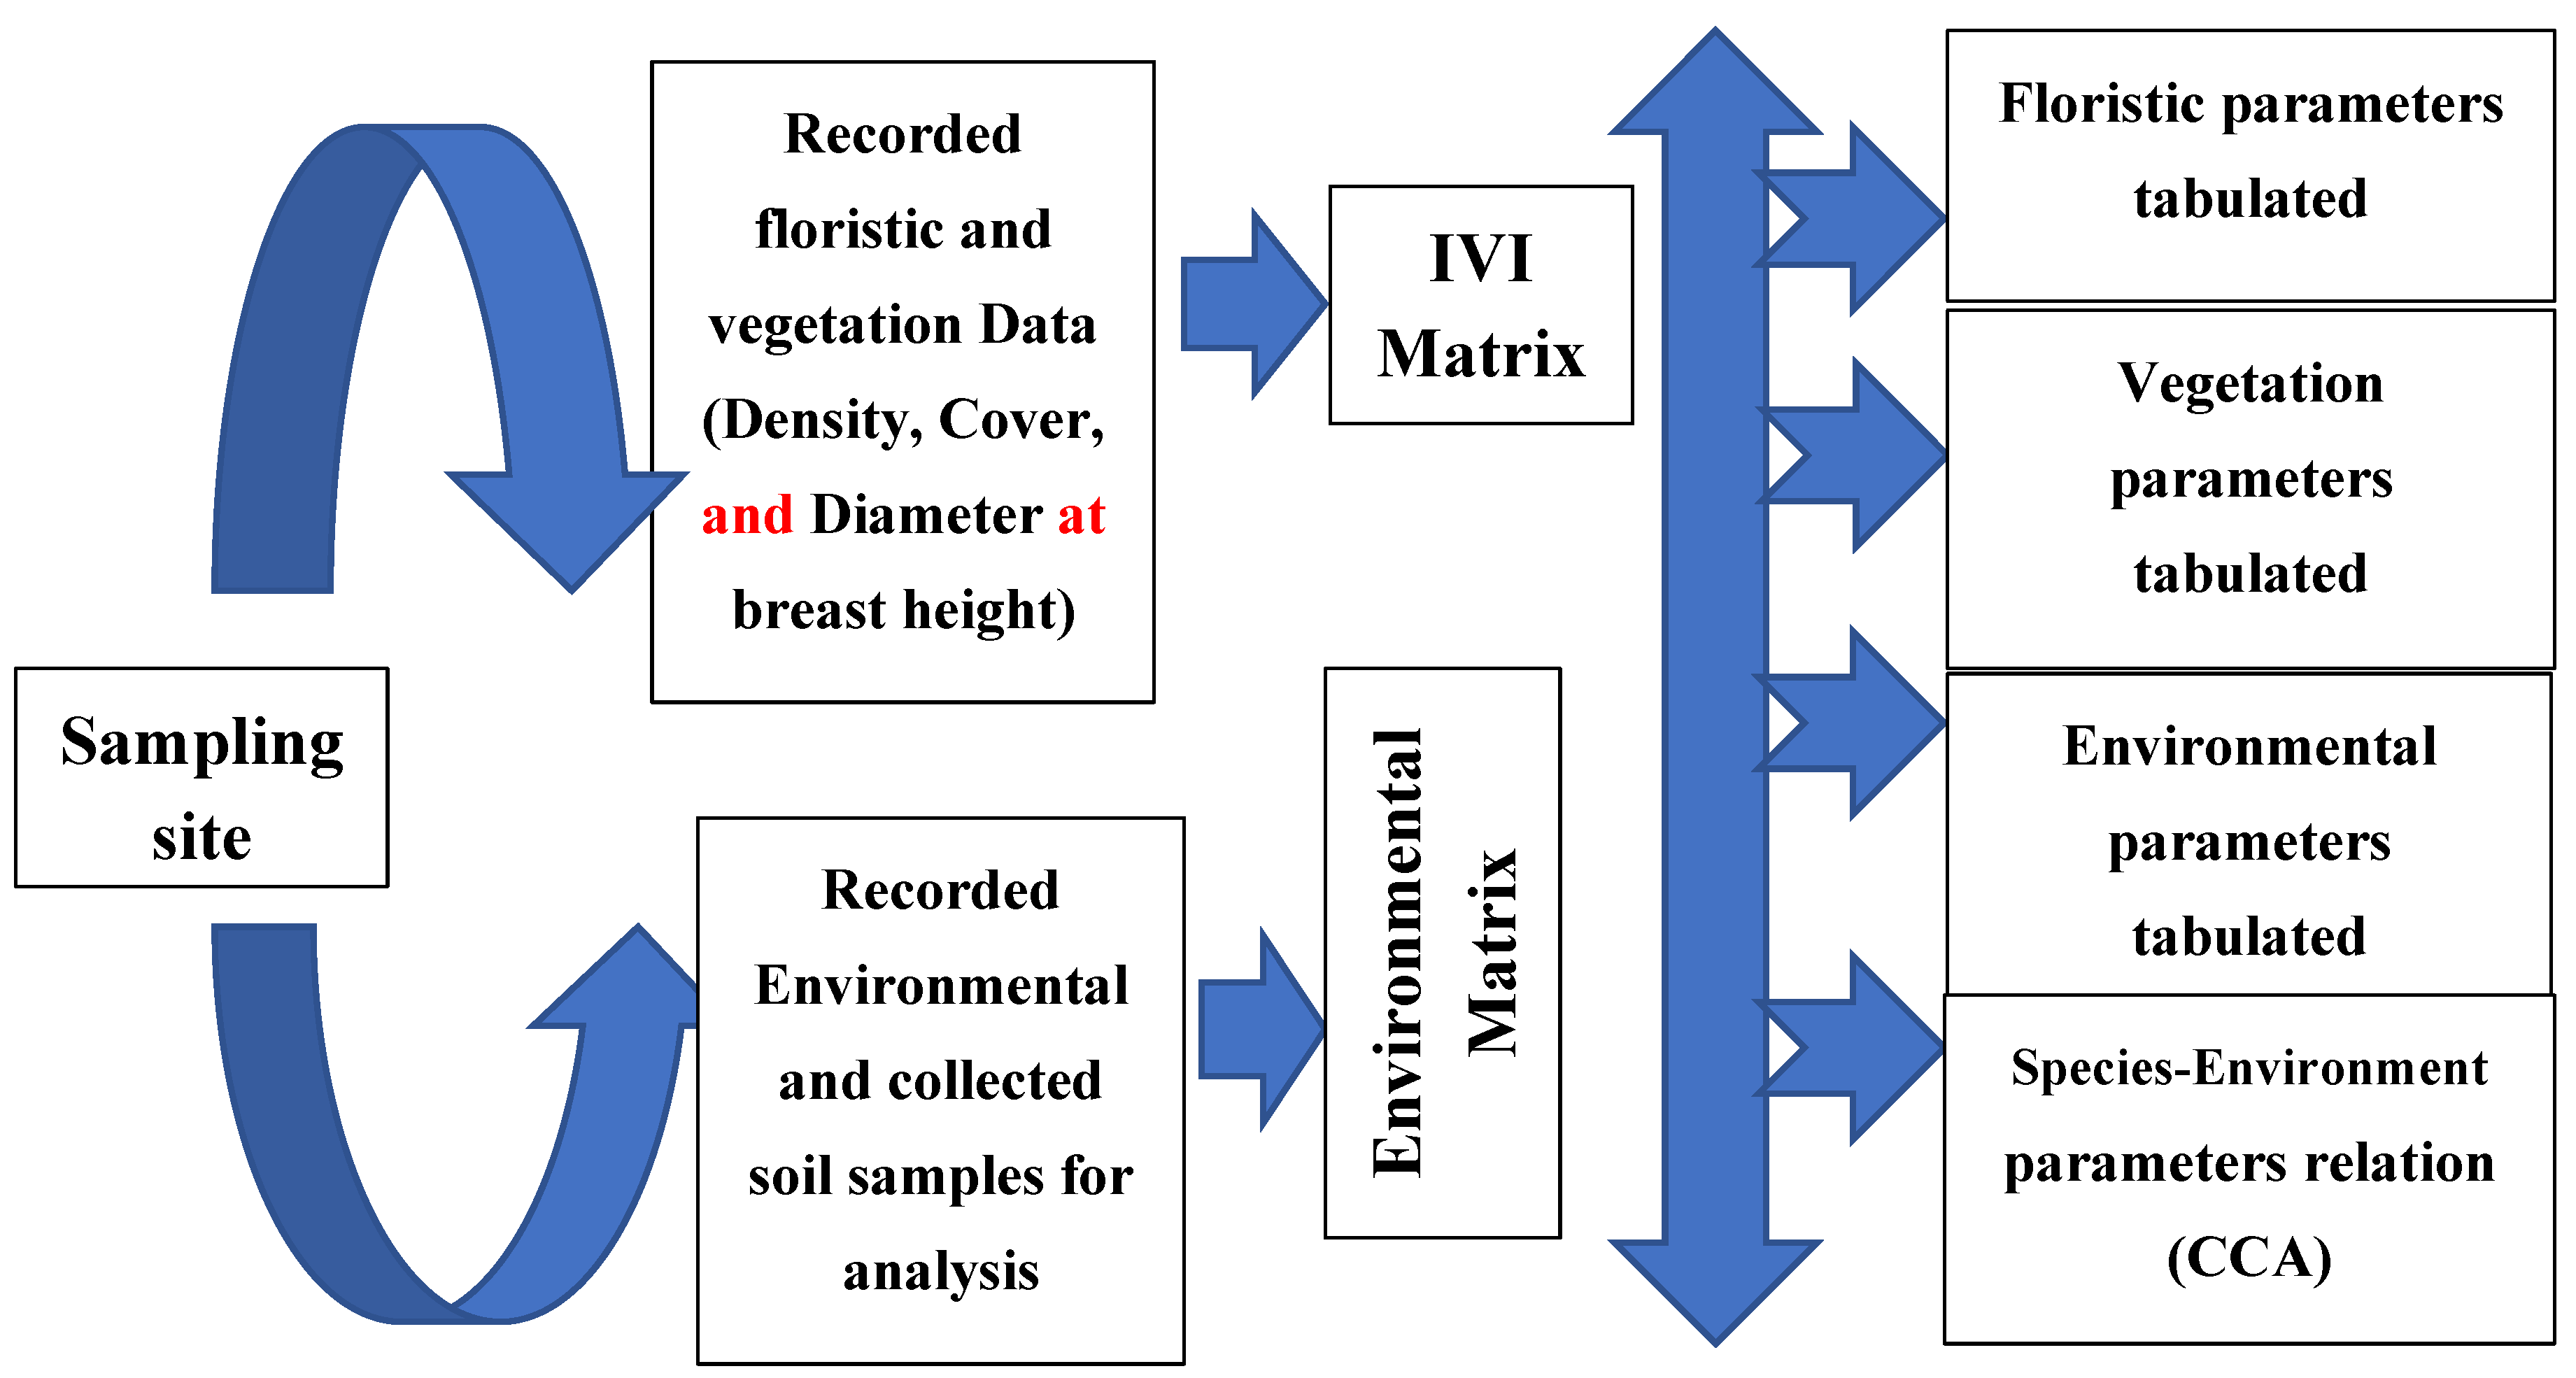
2.2. Vegetation Sampling and Diversity Indices

The phytosociological vegetation attributes were assessed in mining (Experimental) and non-mining (Control) sites during the field survey for two years starting in 2020 to 2021, along the Panjkora river basin by using the quadrat method following [24]. Vegetation was recorded using a 10 × 10 m quadrat for trees, 5 × 5 m for shrubs, and 1 × 1 m for herbs in the selected stands. A total of 60 stands and 600 quadrates, which include 30 mining and 30 non-mining sites, were selected for data collection and assessment. Various quantitative variables were used including density, frequency, height, cover, importance value (IV), and importance value index (IVI), employing techniques as described by [28], were recorded in each quadrate. Herb and shrub height and cover were recorded using a forestry tap, while tree diameter was recorded at breast height (dbh). The IV was calculated as the sum of the relative frequency, relative density, and relative cover [28]. A 10-m buffer zone was removed from the stand borders, as recommended by [29], to lessen the impact of edge effects. The plants recorded were identified using Flora of Pakistan [30,31] plant taxonomic nomenclature.
Floristic characteristics were evaluated following the Flora of Pakistan, and an inventory was compiled to record species details [30]. Dried plant specimens were stored on Herbarium vouchers at the Department of Botany at Malakand Khyber Pakhtunkhwa University in Pakistan. Following [32], species density was used to compute three main diversity indices: species richness (S), evenness index (E), and Shannon-Wiener diversity index (H’). The number of species present determines the species richness of a stand. The H′ and E indices were calculated using the following formulas:
E = H ln S
H = i = 1 S p i   ln p i
where pi = proportion of the species (i) to a total number of species, ln = natural logarithm of pi, and lnS = natural logarithm of species richness.

2.3. Environmental Variables and Soil Analysis

A 3 kg sample was taken from two opposing corners and the middle of each site using auger borings to define the soil parameters in each location. In general, the top layer of soil is nutrient-rich. As a result, samples were collected between 0 and 30 cm deep [33], bagged, and carefully mixed to minimize variability [28,34]. A digital pH meter and an EC meter were used in the field to measure electrical conductivity and soil pH in a soil-water solution (1:5). By air-drying the samples and running them through a 2 mm filter following USDA guidelines, the physiochemical makeup and textural characteristics of the soil were ascertained [35]. The Walkley–Black technique was employed to estimate organic matter, and wet combustion with chromic acid digestion followed by dry combustion was utilized to quantify Total and Organic Carbon [36]. Micro-Kjeldahl was used to measure total nitrogen, while Yadav et al. [37] methods were used to assess accessible phosphorus (P2+) and exchangeable potassium (K+). The geometric approach was used to determine lime (calcium carbonate; percent), and geometric measurement of CO2 evolution was done following [38]. Using an online calculator (https://www.nrcs.usda.gov (accessed on 20 November 2021)), we evaluated other soil properties, including field capacity (FC), available water (AW), conductivity (s/cm), wilting and saturation point (WSP), bulk density (BD), following [39]. The soil analysis was performed at the Swat Agriculture Research Institute (SARI).

2.4. Data Analysis

From the 28 stands, floral and phytosociological data and relevant environmental factors, i.e., geographic attributes, soil texture, and nutrients, were data-banked for analysis and interpretation. Following the flowchart in Figure 2, various floristic attributes, i.e., life form, leaf form, status in Pakistan, and Rainkiaer life form, were assigned to species following already published literature conducted in areas that resemble the study area [40,41]. The relative phytosociological qualities were converted into an importance value index (IVI). After numerically classifying mining and non-mining sites, each stand’s species was allocated to a phytosociological category, either mining or non-mining sites. Recent literature was consulted to determine whether a particular species may indicate a group [31,42]. The means of the environmental and topographical factors were determined using a paired t-test to identify variances.
Using canonical correspondence analysis (CCA) of species IVI, the link between mining and non-mining vegetation and environmental factors was investigated. In the ordination graph, the vectors of the significant variables were also shown. All quantitative vegetation and environmental data analyses were conducted using Graph Pad Version 7.0 and Microsoft Excel [43].

3. Results

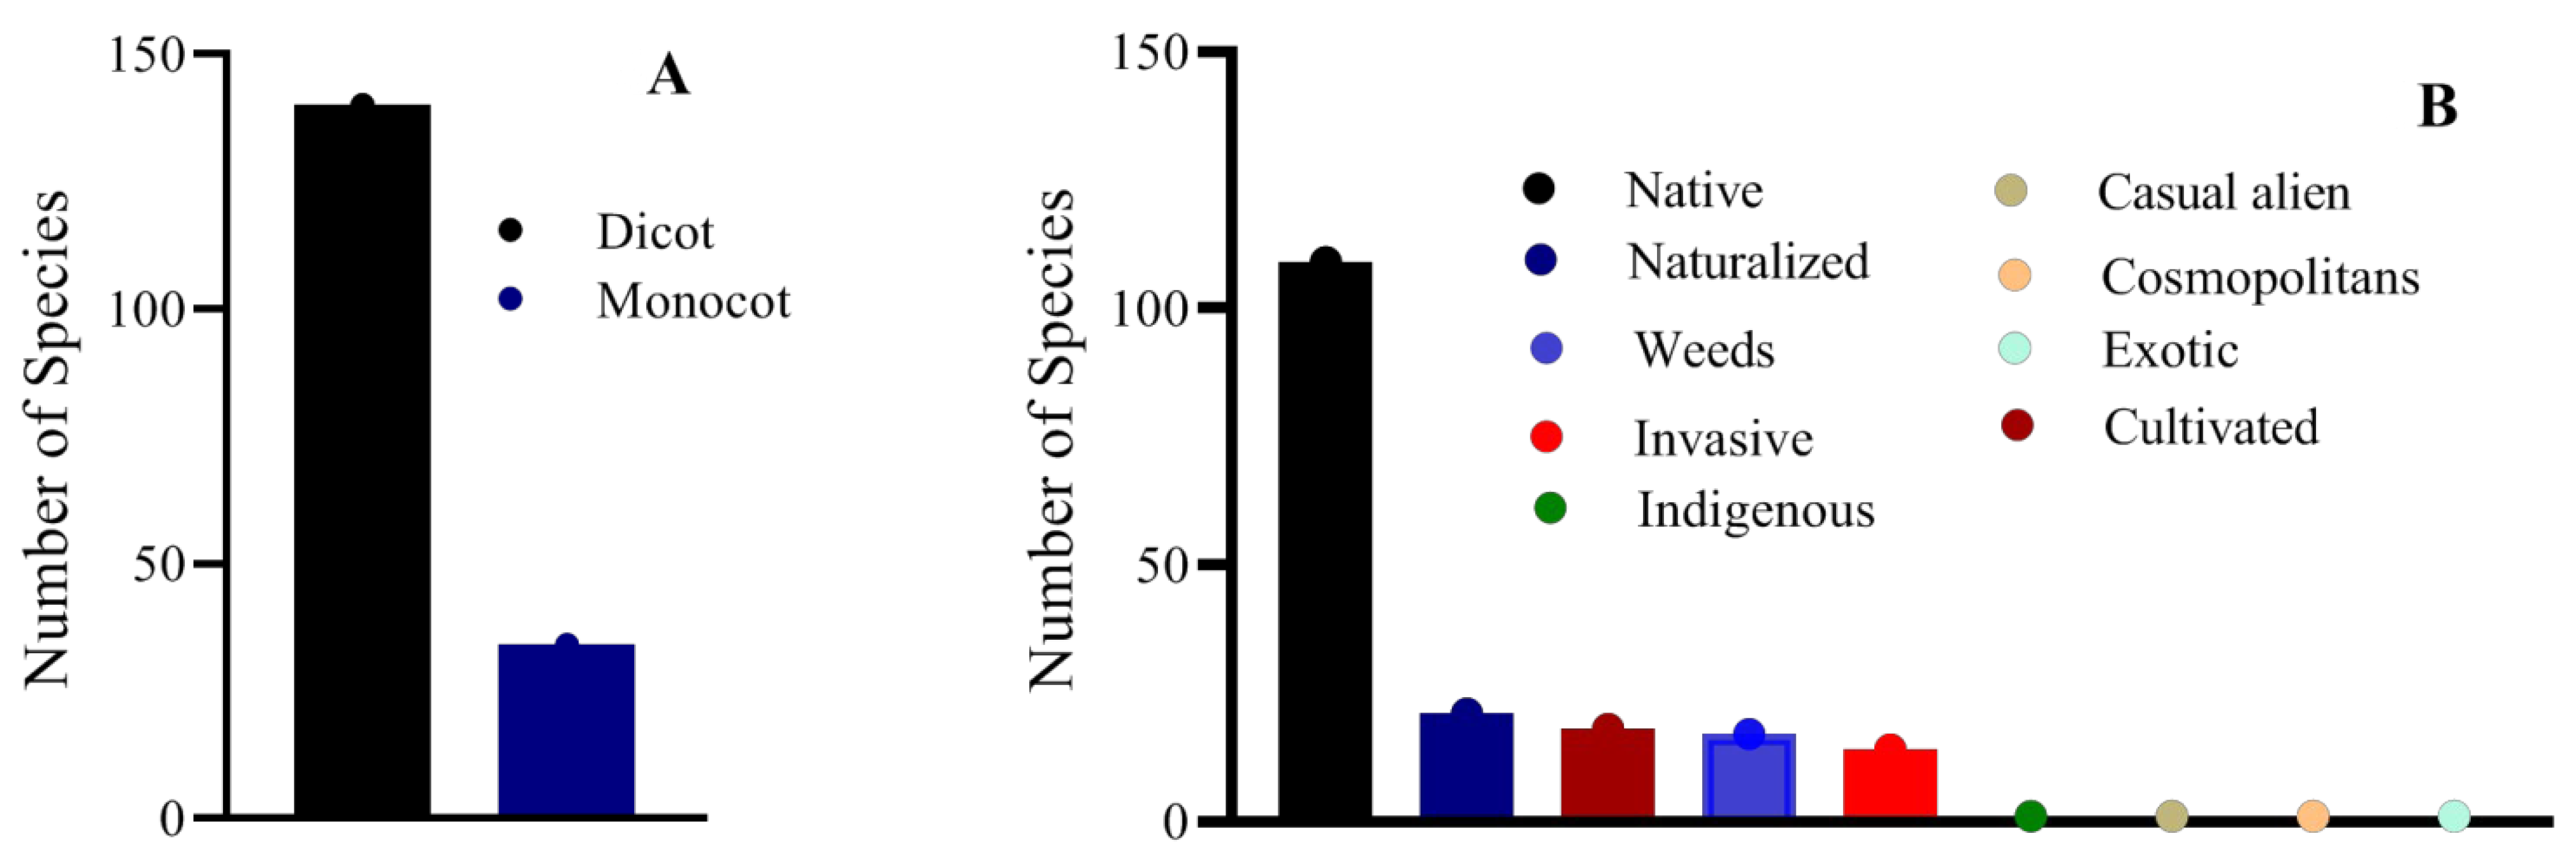
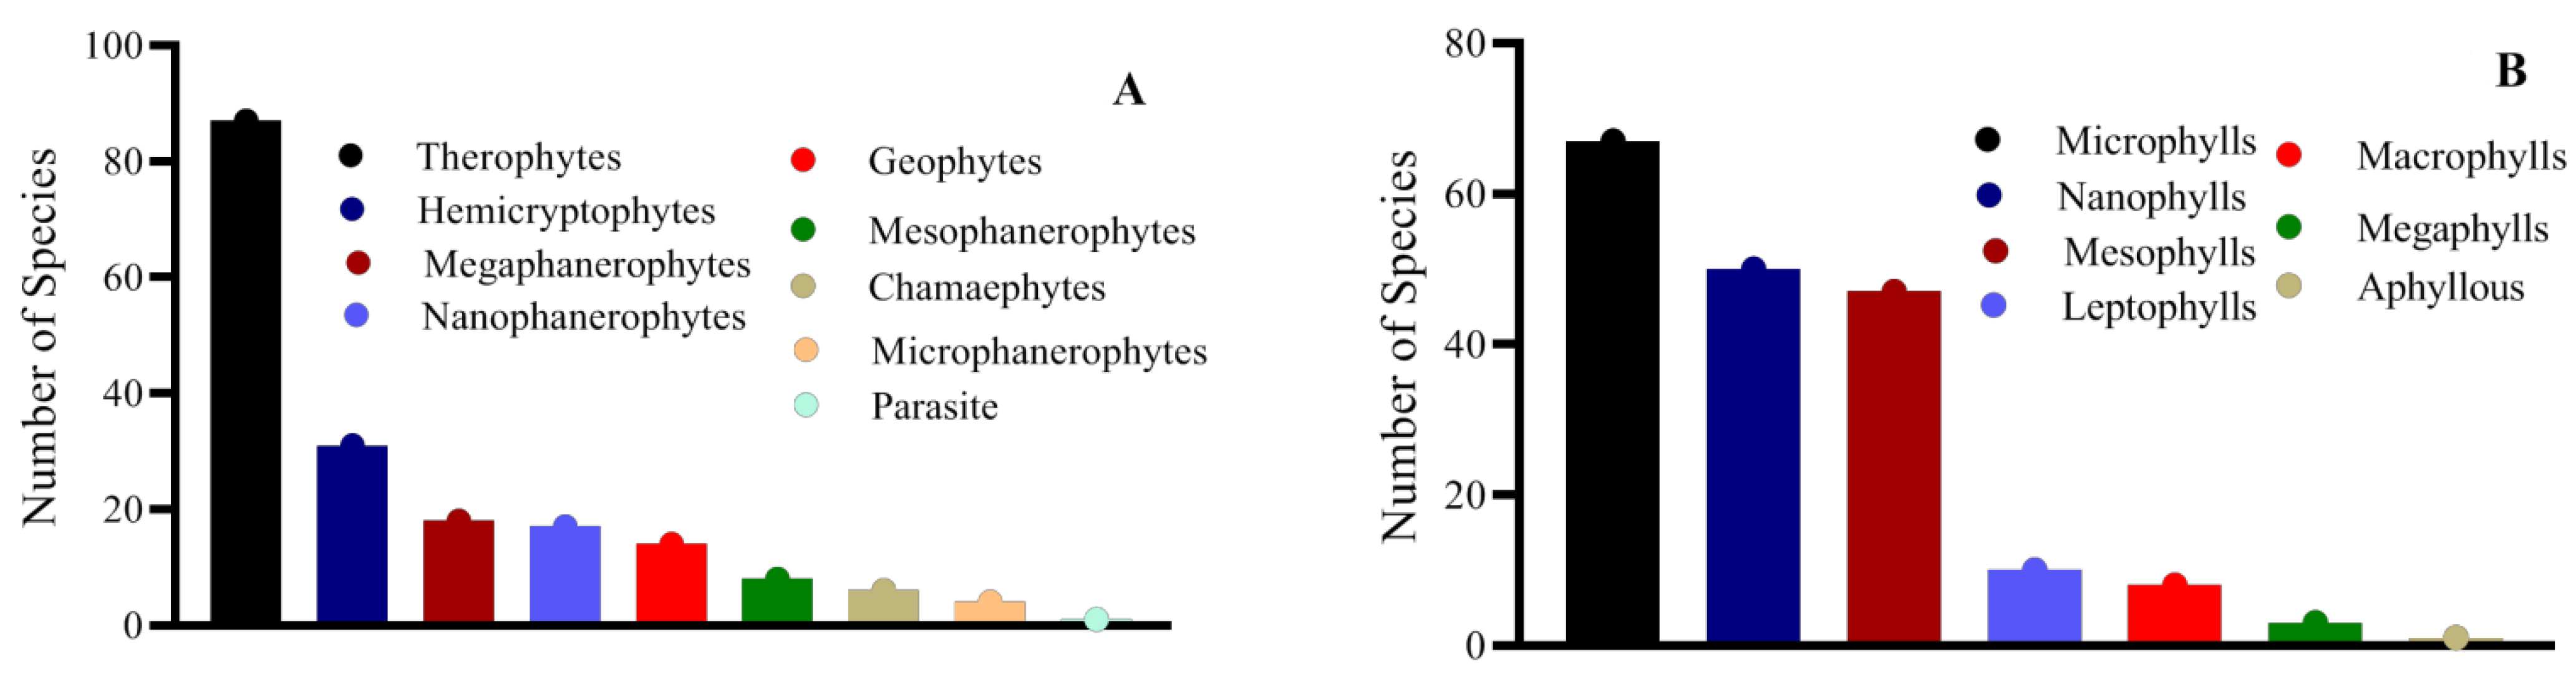
3.1. Floristic and Phytosociological Diversity

A total of 186 plants, representing 70 families of angiosperms, gymnosperms, and pteridophytes, were identified in mining and non-mining sites. The families with the highest species were Asteraceae (20), Poaceae (19), Lamiaceae (9), Amaranthaceae (8), Rosaceae (6), Brassicaceae (5 each of Cyperaceae, Cucurbitaceae, Polygonaceae, and Solanaceae), and Moraceae (4 species) (Table S1). One hundred seventy-four of the total plant species reported were angiosperms, compared to 9 pteridophytes and three gymnosperms. Based on life form, the flora was dominated by herbs 134 (72%), followed by shrubs 32 (17%), while the rest were tree species, and one was a climber (Figure 3). Based on life span (LS), perennials (P) made up the majority of the flora, accounting for 116 (62%), followed by annuals (A), 63 (34%), biennials (B), 1 (>1%), annual/perennials (A/P), 4 (2%), and annual/biennial/perennial (A/B/P), 1 (>1%).
Results revealed that in the study area, dicots dominated with 140 (75.26%), followed by monocots 34 (18.27%), while the rest were either gymnosperms or Pteridophytes. The spectrum of flora was diverse based on Status in Pakistan (SP) ranging from native to exotic: Casual (CA) 1 (>1%), Cosmopolitan (CO) 1 (>1%), Cultivated (CU) 18 (10%), Exotic (EX) 1 (>1%), Invasive (I) are 14 (8%), Indigenous (ID) 2 (1%), Introduced (IN) 2 (1%), Naturalized (N) are 21 (11%), Native (NV) 109 (59%), and Weed (W) 17 (8%) as indicated in Figure 4.
Based on Raunkiaer’s life form (Figure 5), 87 (47%) of the species were therophytes (Th), 31 (17%) were hemicryptophytes (H), 18 (10%) were megaphanerophytes (Megp), 17 (9%) were nanophanerophytes (Np), 14 (7%) were geophytes (G), 8 (4%) were mesophanerophytes (Mesp), 6 (3%) were chamaephytes (Ch), 4 (2%) were microphanerophyte (Micp) and 1 was parasite (P). The leaf size spectrum was similarly diverse, ranging from microphyllous to aphyllous, including microphyll 67 (36.02%), nanophyll 50 (26.88%), mesophyll 47 (25.26%), leptophyll 10 (5.37%), macrophyll 3 (4.30%), megaphyll 3 (1.61%), and aphyllous 1 (0.53%).
In the mining sites (Group I), the IVI means value ranges from 4.52 ± 0.70–1.02 ± 0.48 representing Cynodon dactylon and Maytenus royleanus, respectively. In mining sites, the dominant plants were Cynodon dactylon (4.52 ± 0.70), having co-dominance of invasive Xanthium strumarium (4.23 ± 1.12) and Cannabis sativa (2.7 ± 0.87), exotic Populus nigra with IVI of 3.41 ± 0.98), and native Mentha longifolia having IVI of 3.12 ± 0.91. In addition, some of the species have IVI between 3–1, like Calotropis procera, Centaurea cyanus, Chrozophora tinctoria, Citrus limon, Cirsium arvense, Corynephorus canescens, Punica granatum, Ricinus communis, Solanum surattense, Marsilea quadrifolia, Ranunculus sceleratus, Maytenus royleanus, Tagetes minuta, Withania somnifera. The IVI mean values of most plant species were less than 1, as presented in Table S2.
The non-mining sites (Group II) were diverse, with more plant species than the mining sites in Group I. The mean IVI of species ranges from 4.65 ± 1.28–0.09 ± 0.09 representing Cannabis sativa and Zea mays. At the same time, co-dominated by Pinus roxburghii with IVI of 2.86 ± 1.23, Cynodon dactylon having 2.8 ± 0.94 IVI, Dodonaea viscosa with IVI of 2.1 ± 1.43 and Olea ferruginea with IVI of 2.21 ± 1.12, belonging to native species (Table 1). Similarly, the mean IVI of most plant species was less than 1.

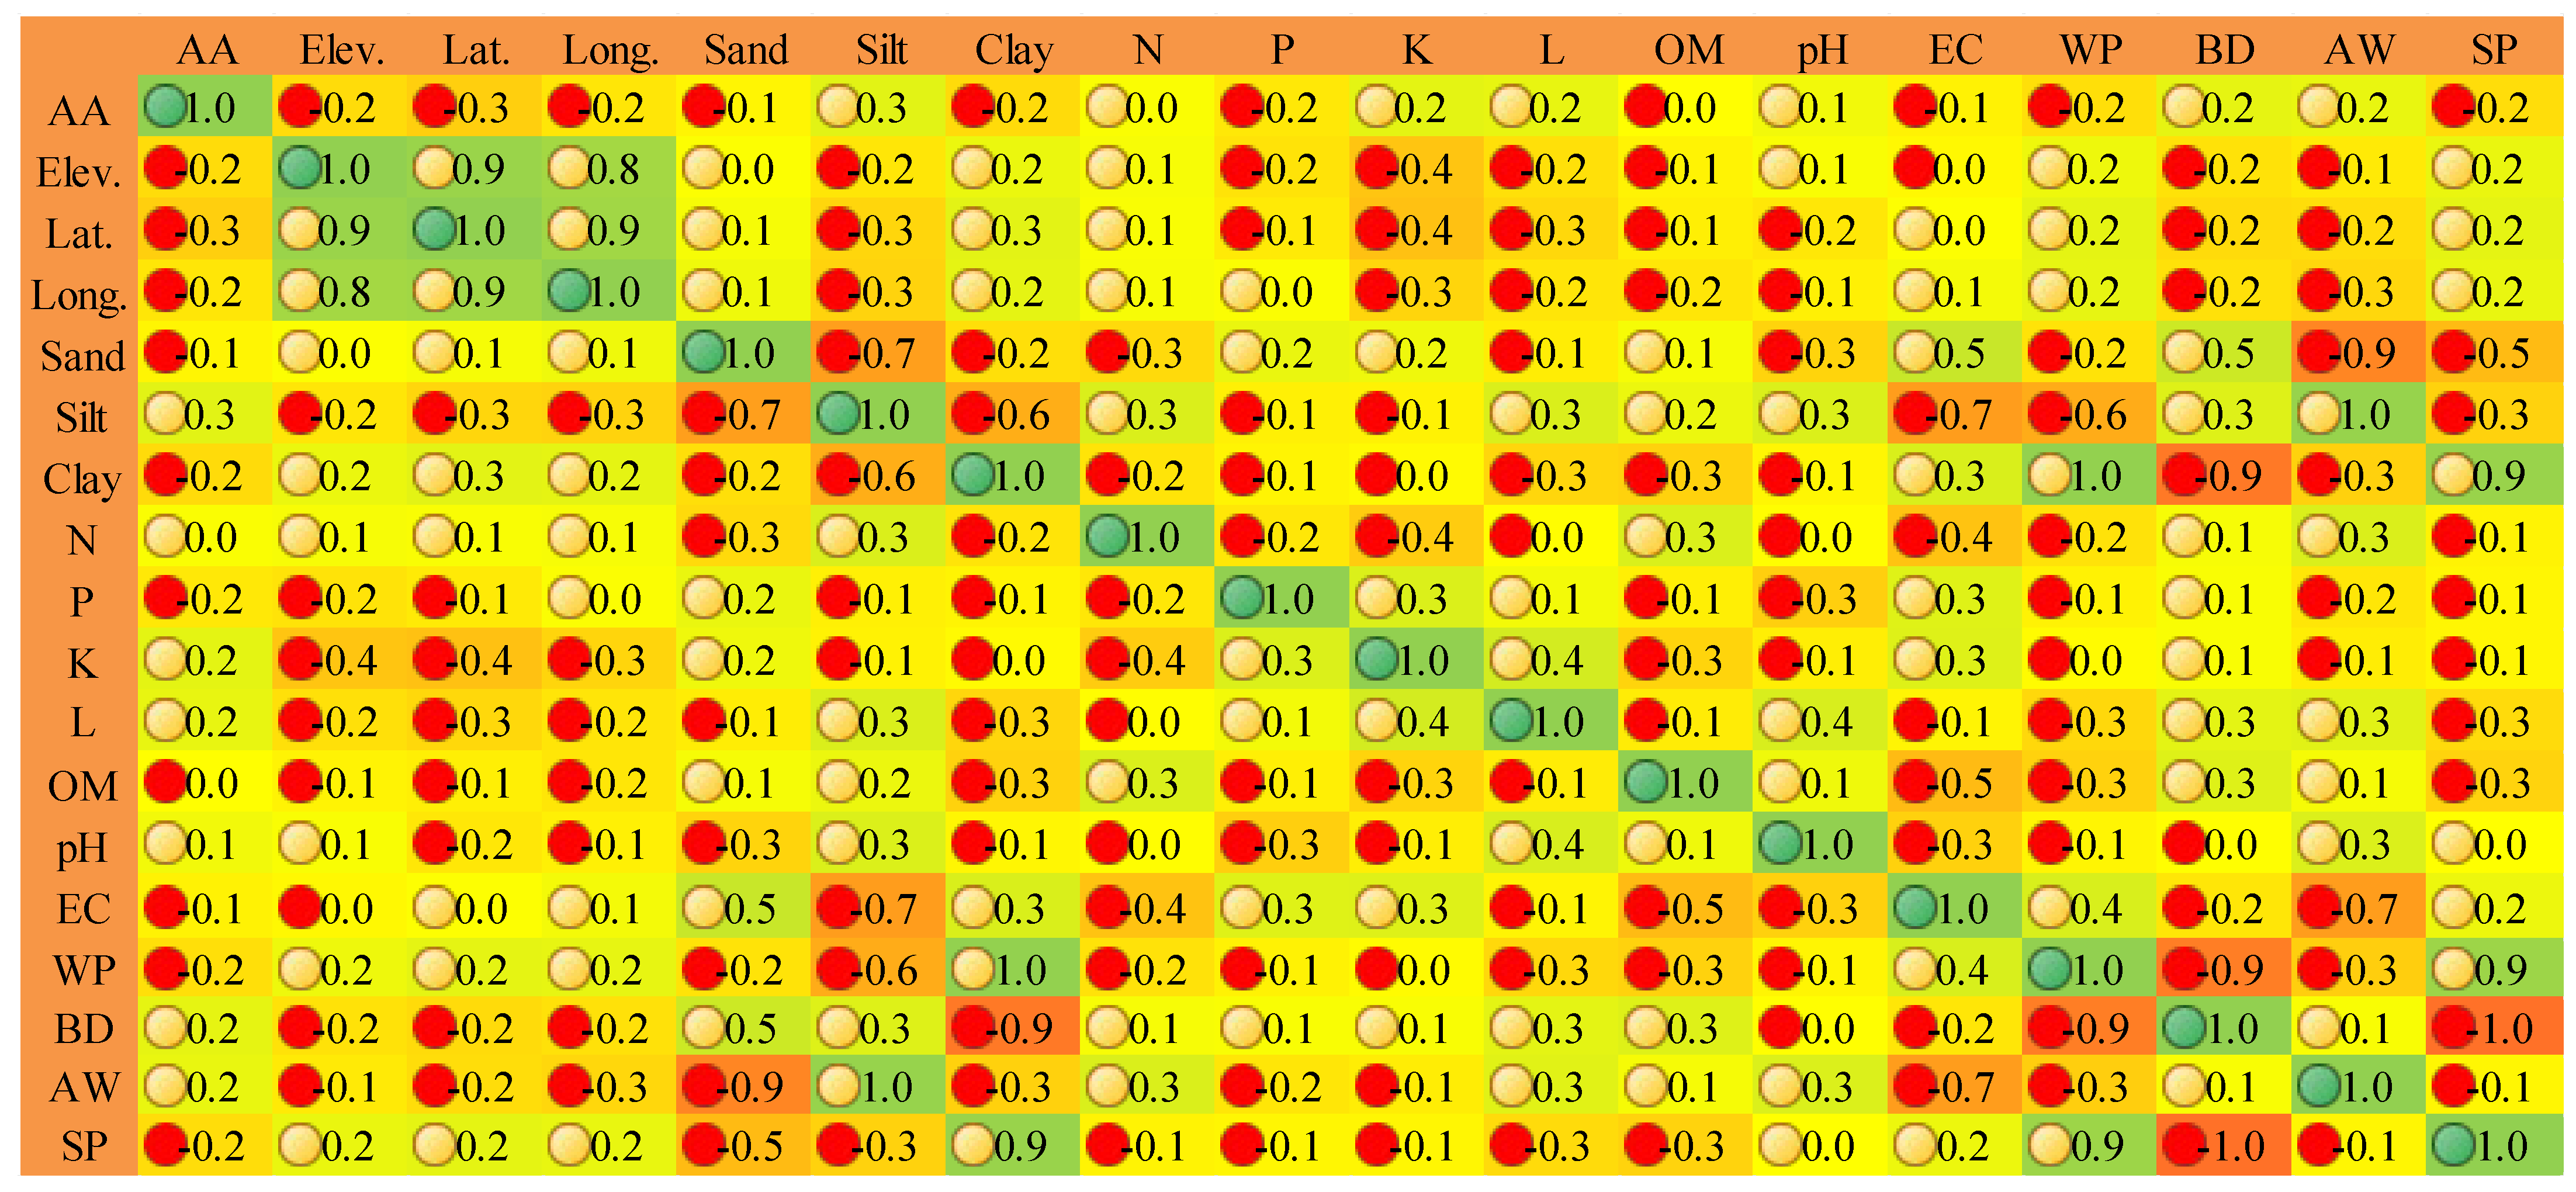
3.2. Environmental Variables and Its Influence

Table 2 shows the various environmental factors impacting non-mining and mining areas. Non-mining sites have flat to moderately sloping topography, reasonably deep soil (up to 90 cm in depth), and typically well-drained soil. The usual soil type was sandy-loam, with minor variations. All vegetation had somewhat acidic soil, likely since their parental material is comparable (igneous rocks). From species-poor (mining) to species-rich (non-mining) plant types, the value of nitrogen and phosphorus rises while that of lime, potassium, and organic matter declines. According to [1], for Dodonaea viscosa in the same location, the available phosphorus was quite high. It was never over the 2.5 mg/kg detection level in other plant natural communities. Numerous soil characteristics, such as wilting point, electric conductivity, bulk density, field capacity, and saturation point, decreased with species-rich to species-poor vegetation types and showed statistically insignificant differences (Table 2). Still, they did not affect these or other vegetation physiognomies significantly.
Elevation and latitude have a strong, significant association (p < 0.01; r = 0.93), elevation and longitude (p < 0.01; r = 0.84), whereas potassium has a weak, statistically significant relationship (p < 0.05; r = −0.41) with elevation as depicted from Figure 6. However, a weak negative correlation was shown between latitude and potassium (p < 0.05; r = −0.43), sand and silt (p < 0.01; r = −0.68), and latitude and longitude (p < 0.01; r = 0.87). In contrast, a positive association between saturation point and clay particles (p < 0.01; r = 0.94), while a significant negative correlation between clay particles and bulk density (p < 0.01; r = −0.94). The soil nutrients like potassium and nitrogen significantly correlated with electrical conductivity having p < 0.05; r = −0.36 and p < 0.05; r = −0.42, respectively. Likewise, potassium was found correlated with pH and lime, having p < 0.05; r = 0.41, and p < 0.05; r = 0.36, respectively. In addition, organic matter and electrical conductivity negatively correlated with r = −0.47; p > 0.01. Moreover, an important soil hydraulic property, i.e., wilting point, was significantly correlated with electrical conductivity (p < 0.05; r = 0.36). A negative correlation between available water and bulk density, electrical conductivity, and wilting point (p < 0.01, r = −0.69; p < 0.01, r = −0.90).

3.3. Species-Environment Correlation

Canonical correspondence analysis explains the total variance of 20.9% on the ordination axes having the highest variance on axis 1 (8.9%). Similarly, the Pearson correlation on axis 1 (0.99) is higher than on axis 2 and 3. In contrast, the Kendall correlation is greater on axis three than on axis 2 and 1 (Table 3). In the axis’s correlation, geographic variable i.e., elevation, latitude and longitude on axis 1 shows significant negative correlation (r = −0.95, r = −0.80, r = −0.75 respectively, at p < 0.01). Similarly, aspect angle, and pH shows significant negative correlation on axis 3 with p < 0.05; r = −0.33, and p < 0.01; r = −0.54, respectively. Similarly, soil nutrient i.e., Potassium (p < 0.05; r = −0.35) on axis 1 and Lime on axis 3 (p < 0.05; r = −0.25) shows significant correlation indicating that these factors plays important role in shaping the communities.
Elevation, latitude, and longitude in axis 1 have negative biplot scores of − 0.521, − 0.464, and − 0.433, respectively. The biplot shows that critical factors influencing the community structure and composition are potassium, electrical conductivity, aspect angle, pH, and silt (Figure 7).

4. Discussion

The present research analyzed the vegetation of riparian locations throughout the Panjkora River basin and compared mining and non-mining vegetation to determine the impacts of mining on the vegetation. The qualitative analysis of flora and its composition provides an important source of information on the dynamics of ecological changes on a geographical and temporal scale [44]. The biological spectrums of flora depict the climatic conditions and possible environmental influences that might alter the structure and composition of the community [45]. The vegetation was diversified with 186 plant species and a broad floristic spectrum. Similarly, 215 species in the riparian vegetation throughout the Hindu Kush Mountains Range was recorded by [4].
In contrast, 105 species from mining sites in four districts of Khyber Pakhtunkhwa, Pakistan was reported by [46]. The overall sum of species included in the study was greater than the sum of species listed by other studies; including [47] recorded 92 species from a mid-elevation forest in the Central Himalayas of India, while [48] reported 123 species from a tropical forest in Manipur, north India. Similarly, 85 species from Dulahazara Garjan, Bangladesh by [49], and investigators in tropical forests in various regions of the globe, for example, 89 species were reported by [50], 52 species were recorded by [51], and 94 species was reported by [52]. Most plant species in this research demonstrate the transmissible distribution of vegetation, which is thought to be the fundamental characteristic of natural vegetation [53].
Native species such C. dactylon, Mentha longifolia (L.) Huds, and Dodonaea viscosa (L.) Jacq predominates in the communities, whereas invasive species with greater IVI include Xanthium strumarium L. and Cannabis sativa L. The species that dominated were mostly therophytes, which make up 37.5 percent of the flora, and may damage the native plants, as revealed by [54]. The communities were also dominated by perennial and annual plant species, which is in contrast to opposing views expressed in the literature that (1) annuals, in particular, have strong effects on community homogenization [55] and (2) perennials promote community disturbance and favour alien [56,57] species, which are found in riparian communities. Smaller herb species like X. strumarium, M. longifolia, D. viscosa, and C. sativa may be at a disadvantage versus tree plant species like Populus nigra L. and Pinus roxburghii Sargent, which will eventually displace those smaller herbs [58]. This displacement eventually results in disturbed communities and will pose a risk to vegetation diversity in the future.
Understanding the ecological basis of vegetation is aided by the spectrum of diverse life forms, which depicts the physiognomy of the flora and vegetation, which is the final product of all living activities coupled with the environment [59]. According to Figure 1, therophytes, with 87 species (37.5%), predominated in the region, followed by hemicryptophytes, with 16 species (10%). The prevalence of therophytes suggests that this landform experiences frequent, minor flood disturbances and terrain modification, which has limited the occurrence of woody vegetation (phanerophytes) and forced them to relocate to riparian slopes and uplands with minimal flood disturbance. Most therophytes are annual plants that reproduce in the floodplain and marshes in the next season after surviving through the adverse season via seeds or spores. The relatively high proportion of therophytes in the riparian vegetation demonstrated that the landscape was often changed by human and natural disturbances, which encourages therophytic types of vegetation [60].
Similarly, a phytosociological study of the vegetation of Hayatabad, Peshawar conducted by [61], stated that therophytes were the leading class over others, supporting our findings. We reported therophytes followed by hemicryptophytes from the area. Because they are intimately tied to the succession pattern and life forms to the geomorphology of the river, riparian plant life forms and life history strategies are crucial to preserving these ecosystems [40]. Documenting functional vegetation’s life cycle methods is also important for the ecosystem’s non-native vegetation.
The area’s leaf size spectrum was dominated by microphyll (36.02%), followed by manophylls, and progressed gradually with a declining percentage, with only one aphyllous species. A key indicator of climate change is leaf physiology, which is strongly affected by temperature and precipitation [62]. Nanophyll was listed as the area’s major leaf size class by [63], which virtually supports our conclusion. Following our results, [64] reported that nanophylls were the dominant leaf size class, followed by Microphyll, leptophylls, and mesophyll at the University of Peshawar Botanical Garden in Azhakhel, Nowshehra. Leaf size spectra of different altitudinal zones indicated that microphylls steadily expand from lower to higher zones [65]. Similar to findings when microphylls dominate the zone at greater altitudes, nanophylls were somewhat higher in the lower zone. Microphylls were the predominant leaf size, followed by nanophylls in springs and monsoon, according to [40], who studied the leaf size spectra of Ganga Chotti and Bedori Hills. This information strengthens our current analysis since it considers the same altitudinal fluctuation. Our current results are supported by [41] study of the biological properties of plants in Tehsil Takht-e-Nasrati, which noted that microphylls were the predominant leaf size with 52.8 percent of species, followed by nanophylls (19.88 percent). The floral variety of the Frontier Region was recently explained by [66] and agreed with our results.
Species richness, which is identified as the total of various species in a particular region, is considered an important characteristic of a plant community [67]. In the mining site community in this study, the Shannon–Wiener index (H’) ranged from 2.14 to 2.87, while in the non-mining community, its value ranged from 2.72 to 3.39. In mining site communities, the equitability or evenness index (J) varied from 0.86 to 0.95, but in non-mining site communities, it ranged from 0.83 to 0.96. If the value of (H’) is high, the community should be more diverse. The H value of a community containing only one species should be zero (0) because the value of Pi should be equal to 1 and multiplied by Pi, which should equal zero (0). When the evenness is high, the H value will also be high. So, the H value not only indicates the number of species but also shows us the abundance of the species distributions in the total number of species among the whole community. Hence, the diversity index value of this study falls within the range reported for tropical forests [48,68]. Species richness along the river basin is influenced by edaphic, biotic and climatic factors [69]. Moreover, riparian forests connect different types of vegetation and adjacent flora, and soil and hydromorphic conditions create a spatial heterogeneity that favours species richness in these environments [11,70].
The link between the different vegetation indicators and the measured environmental variables was then ascertained using CCA. A permutation approach was used to assess the correlations between the canonical axes and the explanatory matrix and the importance of each species. The proposed associations between the response and explanatory factors were evaluated by normalizing the axis scores, focusing on the unit variance, and using axes scaled to best reflect each species. The findings indicate that the elements that support these communities include soil texture, potassium, aspect angle, and electrical conductivity. In both sites, the content and organization of the community were greatly influenced by the soils. The site soils were rich in organic matter, which is associated with high soil fertility. These soils also enable water and air to pass through them, allowing roots to penetrate more easily and supplying plants with nutrients and clay aggregation stability [71] revealing that the properties of the soil might explain the distribution of vegetation at local scales. The communities were found to be dominated by certain invasive generalist species, including C. sativa, X. strumarium, P. nigra, and C. dactylon, pioneer species of disturbed vegetation [72].

5. Conclusions

Riparian vegetation is considered the health indicator of aquatic vegetation along riparian corridors. The floristic diversity was dominated by perennials and therophytes that indicated the anthropogenic pressure, which mainly contributed to mining activities in the area. These floristic indicators provide baseline information for designing strategies for conserving and managing the riparian vegetation affected by the mining activities. Additionally, identifying plant communities’ particular to the various mineral zones may serve as a foundation for phytoremediation strategies for mine waste rehabilitation. The mechanisms underlying these vegetation variations would benefit from further investigation. These mechanisms may be related to the preferential uptake or tolerance of specific soil minerals, such as heavy metals, as well as variations in other soil properties such as pH, water-holding capacity, and the availability of macronutrient elements. The current research results also show that soil characteristics affect species richness, structure, dominance, and establishment patterns and that ecological character can also affect the composition. In these study regions, soil fertility and physical attributes may be limiting element that serves as an environmental filter for establishing species. To fully comprehend the relationship between riparian vegetation and its socioeconomic effect, we recommend comparing riparian vegetation’s socioeconomic impact at mining and non-mining sites with livelihood assessments of residents.

6. Limitations

The current study focuses on floristic compositions, vegetation characteristics, and their relationships with the environmental factors that play a vital role in shaping plant communities and provide baseline information for conservation and preservation. Despite the importance of the study, there are still some limitations to the current research, which can be beneficial for the development of future research in the study area. The present study lacks information about the socioeconomic impacts of the mining operations on the livelihoods of the local people, which is important aspect and, most of the time, creates hurdles in the restoration of mining vegetation. In addition, the possible restoration process and mechanism need further comprehensive evaluation for better utilization of the information in rehabilitating vegetation on the mining sites. Moreover, riparian vegetation can promote the growth of stress-resistant plants. Identifying such plants and their possible stress-resistance potential can better provide information about the utilization of mining flora for the possible remediation and accumulation of toxic pollutants.

Supplementary Materials

The following supporting information can be downloaded at: https://www.mdpi.com/article/10.3390/land11101801/s1, Table S1: Check List of plant species along with taxonomic attributes (Status in Pakistan, family, Raunkier life form and Leaf size classes); Table S2: Showing the IVI and Mean Standard error of 186 plant species found in both mining (Group I) and non-mining sites (Group II).

Author Contributions

Conceptualization, by K.A. and N.K.; methodology, by R.U.; software, by M.S.; validation and Data curation, by M.E.H.K. and M.D.; formal revision and validation, by D.A.J. All authors have read and agreed to the published version of the manuscript.

Funding

No funding was received for this research.

Institutional Review Board Statement

Not applicable.

Informed Consent Statement

Not applicable.

Data Availability Statement

All the research data are presented in the manuscript and are available.

Conflicts of Interest

The authors declare no conflict of interest.

References

  1. Khan, S.A.; Khan, S.M.; Ullah, Z.; Ahmad, Z.; Alam, N.; Shah, S.N.; Khan, R.; Zada, M. Phytogeographic classification using multivariate approach; a case study from the Jambil Valley Swat, Pakistan. Pak. J. Bot. 2020, 52, 279–290. [Google Scholar] [CrossRef]
  2. Teixeira, A.M.C.; Pinto, J.R.R.; Amaral, A.G.; Munhoz, C.B.R. Angiosperm species of “Cerrado” sensu stricto in Terra Ronca State Park, Brazil: Floristics, phytogeography and conservation. Braz. J. Bot. 2017, 40, 225–234. [Google Scholar] [CrossRef]
  3. Mota, G.S.; Luz, G.R.; Mota, N.M.; Coutinho, E.S.; Veloso, M.d.D.M.; Fernandes, G.W.; Nunes, Y.R.F. Changes in species composition, vegetation structure, and life forms along an altitudinal gradient of rupestrian grasslands in south-eastern Brazil. Flora 2018, 238, 32–42. [Google Scholar] [CrossRef]
  4. Zeb, S.A.; Khan, S.M.; Ahmad, Z. Phytogeographic elements and vegetation along the river Panjkora-Classification and ordination studies from the Hindu Kush Mountains range. Bot. Rev. 2021, 87, 518–542. [Google Scholar] [CrossRef]
  5. Gashaw, T.; Tulu, T.; Argaw, M.; Worqlul, A.W. Modeling the hydrological impacts of land use/land cover changes in the Andassa watershed, Blue Nile Basin, Ethiopia. Sci. Total Environ. 2018, 619, 1394–1408. [Google Scholar] [CrossRef]
  6. Bejarano, M.D.; Jansson, R.; Nilsson, C. The effects of hydropeaking on riverine plants: A review. Biol. Rev. 2018, 93, 658–673. [Google Scholar] [CrossRef]
  7. Meragiaw, M.; Woldu, Z.; Martinsen, V.; Singh, B.R. Woody species composition and diversity of riparian vegetation along the Walga River, Southwestern Ethiopia. PLoS ONE 2018, 13, e0204733. [Google Scholar] [CrossRef]
  8. Sunil, C.; Somashekar, R.K.; Nagaraja, B.C. Diversity and composition of riparian vegetation across forest and agro-ecosystem landscapes of river Cauvery, southern India. Trop. Ecol. 2016, 57, 343–354. [Google Scholar]
  9. Njue, N.; Koech, E.; Hitimana, J.; Sirmah, P. Influence of land use activities on riparian vegetation, soil and water quality: An indicator of biodiversity loss, South West Mau Forest, Kenya. Open J. For. 2016, 6, 373–385. [Google Scholar] [CrossRef] [Green Version]
  10. Dietrich, A.L.; Nilsson, C.; Jansson, R. Restoration effects on germination and survival of plants in the riparian zone: A phytometer study. Plant Ecol. 2015, 216, 465–477. [Google Scholar] [CrossRef]
  11. Corenblit, D.; Davies, N.S.; Steiger, J.; Gibling, M.R.; Bornette, G. Considering river structure and stability in the light of evolution: Feedbacks between riparian vegetation and hydrogeomorphology. Earth Surf. Process. Landf. 2015, 40, 189–207. [Google Scholar] [CrossRef]
  12. Caiafa, A.N.; Martins, F.R. Taxonomic identification, sampling methods, and minimum size of the tree sampled: Implications and perspectives for studies in the Brazilian Atlantic Rainforest. Funct. Ecosyst. Communities 2007, 1, 95–104. [Google Scholar]
  13. Arruda, D.M.; Ferreira-Junior, W.G.; Duque-Brasil, R.; Schaefer, C.E. Phytogeographical patterns of dry forests sensu stricto in northern Minas Gerais State, Brazil. An. Acad. Bras. Ciências 2013, 85, 623–634. [Google Scholar] [CrossRef] [Green Version]
  14. De Azevedo, I.F.P.; Nunes, Y.R.F.; de Avila, M.A.; da Silva, D.L.; Fernandes, G.W.; Veloso, R.B. Phenology of riparian tree species in a transitional region in southeastern Brazil. Braz. J. Bot. 2014, 37, 47–59. [Google Scholar] [CrossRef]
  15. Rodrigues, P.M.S.; Azevedo, I.; Veloso, M.; Santos, R.; Menino, G.; Nunes, Y.; Fernandes, G. Riqueza Florística da Vegetação ciliar do rio Pandeiros, norte de Minas Gerais. MG. Biota 2009, 2, 18–35. [Google Scholar]
  16. Bennett, A.F.; Nimmo, D.G.; Radford, J.Q. Riparian vegetation has disproportionate benefits for landscape-scale conservation of woodland birds in highly modified environments. J. Appl. Ecol. 2014, 51, 514–523. [Google Scholar] [CrossRef]
  17. Purnomo, M.; Utomo, M.R.; Pertiwi, V.i.A.; Laili, F.; Pariasa, I.I.; Riyanto, S.; Andriatmoko, N.D.; Handono, S.Y. Resistance to mining and adaptation of Indonesia farmer’s household to economic vulnerability of small scale sand mining activities. Local Environ. 2021, 26, 1498–1511. [Google Scholar] [CrossRef]
  18. Peduzzi, P. Sand, rarer than one thinks. Environ. Dev. 2014, 11, 208–218. [Google Scholar]
  19. Ikhsan, J.; Rezanaldy, A.; Rozainy, M.Z.M.R. Analysis of Sand Mining Impacts on Riverbed in the Downstream of the Progo River, Indonesia. IOP Conf. Ser. Mater. Sci. Eng. 2021, 1144, 012065. [Google Scholar] [CrossRef]
  20. Saviour, M.N. Environmental impact of soil and sand mining: A review. Int. J. Sci. Environ. Technol. 2012, 1, 125–134. [Google Scholar]
  21. Ahmad, M.S.A.; Ashraf, M.; Ali, Q. Soil salinity as a selection pressure is a key determinant for the evolution of salt tolerance in Blue Panicgrass (Panicum antidotale Retz.). Flora-Morphol. Distrib. Funct. Ecol. Plants 2010, 205, 37–45. [Google Scholar] [CrossRef]
  22. Mtero, F. Rural livelihoods, large-scale mining and agrarian change in Mapela, Limpopo, South Africa. Resour. Policy 2017, 53, 190–200. [Google Scholar] [CrossRef]
  23. Bhatawdekar, R.M.; Singh, T.N.; Tonnizam Mohamad, E.; Armaghani, D.J.; Binti Abang Hasbollah, D.Z. River sand mining vis a vis manufactured sand for sustainability. In Proceedings of the International Conference on Innovations for Sustainable and Responsible Mining, Hanoi, Vietnam, 15–17 October 2020; pp. 143–169. [Google Scholar]
  24. Madeira, B.G.; Espírito-Santo, M.M.; Neto, S.D.Â.; Nunes, Y.R.; Arturo Sánchez Azofeifa, G.; Wilson Fernandes, G.; Quesada, M. Changes in tree and liana communities along a successional gradient in a tropical dry forest in south-eastern Brazil. In Forest Ecology; Springer: Berlin/Heidelberg, Germany, 2009; pp. 291–304. [Google Scholar]
  25. Ullah, K.; Zhang, J. GIS-based flood hazard mapping using relative frequency ratio method: A case study of Panjkora River Basin, eastern Hindu Kush, Pakistan. PLoS ONE 2020, 15, e0229153. [Google Scholar] [CrossRef] [Green Version]
  26. Ahmad, D. Khyber Pakhtunkhwa State of the Environment; Environmental Protection Agency, Government of Khyber Pakhtunkhwa: Peshawar, Pakistan, 2012. [Google Scholar]
  27. Ali, A.; Khan, T.A.; Ahmad, S. Analysis of climate data of Khyber Pakhtunkhwa, Pakistan. Int. Res. J. Eng. Technol. 2018, 5, 4266–4282. [Google Scholar]
  28. Curtis, J.T.; Mcintosh, R.P. The interrelations of certain analytic and synthetic phytosociological characters. Ecology 1950, 31, 434–455. [Google Scholar] [CrossRef]
  29. Martínez-Falcón, A.P.; Zurita, G.A.; Ortega-Martínez, I.J.; Moreno, C.E. Populations and assemblages living on the edge: Dung beetles responses to forests-pasture ecotones. PeerJ 2018, 6, e6148. [Google Scholar] [CrossRef]
  30. Ali, S.I.; Qaiser, M. A phytogeographical analysis of the phanerogams of Pakistan and Kashmir. Proc. R. Soc. Edinb. Sect. B Biol. Sci. 1986, 89, 89–101. [Google Scholar] [CrossRef]
  31. Aeschimann, D.; Rasolofo, N.; Theurillat, J.-P. Analyse de la flore des Alpes. 1: Historique et biodiversité. Candollea 2011, 66, 27–55. [Google Scholar] [CrossRef]
  32. Maan, I.; Kaur, A.; Singh, H.P.; Batish, D.R.; Kohli, R.K. Exotic avenue plantations turning foe: Invasive potential, distribution and impact of Broussonetia papyrifera in Chandigarh, India. Urban For. Urban Green. 2021, 59, 127010. [Google Scholar] [CrossRef]
  33. Castillón, E.E.; Arévalo, J.R.; Quintanilla, J.Á.V.; Rodríguez, M.M.S.; Encina-Domínguez, J.A.; Rodríguez, H.G.; Ayala, C.M.C. Classification and ordination of main plant communities along an altitudinal gradient in the arid and temperate climates of northeastern Mexico. Sci. Nat. 2015, 102, 59. [Google Scholar] [CrossRef]
  34. Kamrani, A.; Jalili, A.; Naqinezhad, A.; Attar, F.; Maassoumi, A.A.; Shaw, S.C. Relationships between environmental variables and vegetation across mountain wetland sites, N. Iran. Biologia 2011, 66, 76–87. [Google Scholar] [CrossRef]
  35. Reis, A.T.; Coelho, J.P.; Rucandio, I.; Davidson, C.M.; Duarte, A.C.; Pereira, E. Thermo-desorption: A valid tool for mercury speciation in soils and sediments? Geoderma 2015, 237, 98–104. [Google Scholar] [CrossRef] [Green Version]
  36. Nelson, D.W.; Sommers, L.E. Total carbon, organic carbon, and organic matter. Methods Soil Anal. Part 3 Chem. Methods 1996, 5, 961–1010. [Google Scholar]
  37. Yadav, R.; Tomar, S.; Sharma, U. Output: Input ratios and apparent balances of N, P and K inputs in a rice-wheat system in North-West India. Exp. Agric. 2002, 38, 457–468. [Google Scholar] [CrossRef]
  38. Robin, V.; Cuisinier, O.; Masrouri, F.; Javadi, A. Chemo-mechanical modelling of lime treated soils. Appl. Clay Sci. 2014, 95, 211–219. [Google Scholar] [CrossRef] [Green Version]
  39. Saxton, K.; Rawls, W.J.; Romberger, J.S.; Papendick, R. Estimating generalized soil-water characteristics from texture. Soil Sci. Soc. Am. J. 1986, 50, 1031–1036. [Google Scholar] [CrossRef]
  40. Malik, Z.; Hussain, F.; Malik, N. Life form and leaf size spectra of plant communities Harbouring Ganga Chotti and Bedori Hills during 1999–2000. Int. J. Agric. Biol. 2007, 9, 833–838. [Google Scholar]
  41. Khan, M.; Hussain, F.; Musharaf, S. Biological characteristics of plant species in Tehsil Takht-e-Nasrati Pakistan. J. Biodivers. Environ. Sci. 2012, 2, 42–47. [Google Scholar]
  42. Biondi, E.; Allegrezza, M.; Casavecchia, S.; Galdenzi, D.; Gasparri, R.; Pesaresi, S.; Soriano, P.; Tesei, G.; Blasi, C. New insight on Mediterranean and sub-Mediterranean syntaxa included in the Vegetation Prodrome of Italy. Flora Mediterr. 2015, 25, 77–102. [Google Scholar]
  43. Barua, N.; Aziz, M.A.I.; Tareq, A.M.; Sayeed, M.A.; Alam, N.; ul Alam, N.; Uddin, M.A.; Lyzu, C.; Emran, T.B. In vivo and in vitro evaluation of pharmacological activities of Adenia trilobata (Roxb.). Biochem. Biophys. Rep. 2020, 23, 100772. [Google Scholar] [CrossRef]
  44. Devi, K.; Singh, H.; Gupta, A. Life form in hill forest of Manipur, North-East, India. J. Agroecol. Nat. Resour. Manag. 2014, 1, 7–13. [Google Scholar]
  45. Díaz, S.; Kattge, J.; Cornelissen, J.H.; Wright, I.J.; Lavorel, S.; Dray, S.; Reu, B.; Kleyer, M.; Wirth, C.; Colin Prentice, I. The global spectrum of plant form and function. Nature 2016, 529, 167–171. [Google Scholar] [CrossRef]
  46. Khwaja, M.A.; Saeed, S.; Urooj, M. Preliminary Environmental Impact Assessment (EIA) Study of China-Pakistan Economic Corridor (CPEC) Northern Route Road Construction Activities in Khyber Pakhtunkhwa (KPK), Pakistan; Sustainable Development Policy Institute: Islamabad, Pakistan, 2018. [Google Scholar]
  47. Khera, N.; Kumar, A.; Ram, J.; Tewari, A. Plant biodiversity assessment in relation to disturbances in mid-elevational forest of Central Himalaya, India. Trop. Ecol. 2001, 42, 83–95. [Google Scholar]
  48. Devi, L.S.; Yadava, P. Floristic diversity assessment and vegetation analysis of tropical semievergreen forest of Manipur, north east India. Trop. Ecol. 2006, 47, 89–98. [Google Scholar]
  49. Chowdhury, M.; Huda, M.; Islam, A. Phytodiversity of Dipterocarpus turbinatus Gaertn. F. (garjan) undergrowths at Dulahazara Garjan Forest, Cox’s Bazar, Bangladesh. Indian For. 2000, 126, 674–684. [Google Scholar]
  50. Kadavul, K.; Parthasarathy, N. Plant biodiversity and conservation of tropical semi-evergreen forest in the Shervarayan hills of Eastern Ghats, India. Biodivers. Conserv. 1999, 8, 419–437. [Google Scholar] [CrossRef]
  51. Pande, P. Comparative vegetation analysis and sal (Shorea robusta) regeneration in relation to their disturbance magnitude in some sal forests. Trop. Ecol. 1999, 40, 51–61. [Google Scholar]
  52. Fox, B.J.; Taylor, J.E.; Fox, M.D.; Williams, C. Vegetation changes across edges of rainforest remnants. Biol. Conserv. 1997, 82, 1–13. [Google Scholar] [CrossRef]
  53. Ohlson, M.; Söderström, L.; Hörnberg, G.; Zackrisson, O.; Hermansson, J. Habitat qualities versus long-term continuity as determinants of biodiversity in boreal old-growth swamp forests. Biol. Conserv. 1997, 81, 221–231. [Google Scholar] [CrossRef]
  54. Nautiyal, M.; Nautiyal, B.; Prakash, V. Phenology and growth form distribution in an alpine pasture at Tungnath, Garhwal, Himalaya. Mt. Res. Dev. 2001, 21, 168–174. [Google Scholar] [CrossRef] [Green Version]
  55. Qian, H.; Guo, Q. Linking biotic homogenization to habitat type, invasiveness and growth form of naturalized alien plants in North America. Divers. Distrib. 2010, 16, 119–125. [Google Scholar] [CrossRef]
  56. Tappeiner, J.; Zasada, J.; Ryan, P.; Newton, M. Salmonberry clonal and population structure: The basis for a persistent cover. Ecology 1991, 72, 609–618. [Google Scholar] [CrossRef]
  57. Milchunas, D.G.; Sala, O.E.; Lauenroth, W.K. A generalized model of the effects of grazing by large herbivores on grassland community structure. Am. Nat. 1988, 132, 87–106. [Google Scholar] [CrossRef]
  58. Timsina, B.; Shrestha, B.B.; Rokaya, M.B.; Münzbergová, Z. Impact of Parthenium hysterophorus L. invasion on plant species composition and soil properties of grassland communities in Nepal. Flora-Morphol. Distrib. Funct. Ecol. Plants 2011, 206, 233–240. [Google Scholar] [CrossRef]
  59. Amjad, M.S.; Arshad, M.; Sadaf, H.M.; Akrim, F.; Arshad, A. Floristic composition, biological spectrum and conservation status of the vegetation in Nikyal valley, Azad Jammu and Kashmir. Asian Pac. J. Trop. Dis. 2016, 6, 63–69. [Google Scholar] [CrossRef]
  60. Nazir, A.; Malik, Z. Life-form and index of similarity of plant communities recorded at Sarsawa Hills, District Kotli. J. Res. Sci 2006, 17, 27–33. [Google Scholar]
  61. Shah, M.; Hussain, F. Phytosociological Study of the Vegetation of Hayat Abadpeshawar, Pakistan. Pak. J. Plant Sci. 2009, 15. [Google Scholar]
  62. Traiser, C.; Klotz, S.; Uhl, D.; Mosbrugger, V. Environmental signals from leaves–a physiognomic analysis of European vegetation. New Phytol. 2005, 166, 465–484. [Google Scholar] [CrossRef]
  63. Nasir, Z.A.; Sultan, S. Floristic, biological and leaf size spectra of weeds in gram, lentil, mustard and wheat fields of district Chakwal, Pakistan. Pak. J. Biol. Sci. (Pak.) 2002, 5, 758–762. [Google Scholar]
  64. Hussain, T. A floristic description of flora and ethnobotany of Samahni Valley (AK), Pakistan. Ethnobot. Leafl. 2009, 2009, 6. [Google Scholar]
  65. Samad, M.; Badshah, L.; Khan, S.M. Biological spectra of Lala Kalay area distrist Peshawar Khyber Pakhtunkhwa province Pakistan. Pak. J. Weed Sci. Res. 2018, 24, 353–362. [Google Scholar] [CrossRef]
  66. Samreen, U.; Ibrar, M.; Badshah, L. Diversity and Ecological Characteristics of Weed Flora at Darazinda, Frontier Region Dera Ismail Khan Pakistan. Pak. J. Weed Sci. Res. 2018, 24, 223–229. [Google Scholar] [CrossRef]
  67. McIntosh, R.P. An index of diversity and the relation of certain concepts to diversity. Ecology 1967, 48, 392–404. [Google Scholar] [CrossRef]
  68. Singh, K.; Kumar, A.; Lal, B.; Todaria, N. Species diversity and population status of threatened plants in different landscape elements of the Rohtang Pass, Western Himalaya. J. Mt. Sci. 2008, 5, 73–83. [Google Scholar] [CrossRef]
  69. Ayyappan, N.; Parthasarathy, N. Biodiversity inventory of trees in a large-scale permanent plot of tropical evergreen forest at Varagalaiar, Anamalais, Western Ghats, India. Biodivers. Conserv. 1999, 8, 1533–1554. [Google Scholar] [CrossRef]
  70. Veloso, M.D.D.M.; Nunes, Y.R.F.; Azevedo, I.F.P.; Rodrigues, P.M.S.; Fernandes, L.A.; Santos, R.M.D.; Fernandes, G.W.; Pereira, J.A.A. Floristic and structural variations of the arboreal community in relation to soil properties in the Pandeiros river riparian forest, Minas Gerais, Brazil. Interciencia 2014, 39, 628–636. [Google Scholar]
  71. De Lima Dantas, V.; Batalha, M.A. Vegetation structure: Fine scale relationships with soil in a cerrado site. Flora-Morphol. Distrib. Funct. Ecol. Plants 2011, 206, 341–346. [Google Scholar] [CrossRef]
  72. Fagundes, N.C.A.; de Ávila, M.A.; de Souza, S.R.; de Azevedo, I.F.P.; Nunes, Y.R.F.; Fernandes, G.W.; Fernandes, L.A.; dos Santos, R.M.; Veloso, M.d.D.M. Riparian vegetation structure and soil variables in Pandeiros river, Brazil. Rodriguésia 2019, 70, e01822017. [Google Scholar] [CrossRef]
Figure 1. Study area map showing sampling points across the River Panjkora in Khyber Pakhtunkhwa, Pakistan.
Land 11 01801 g001
Figure 2. Flow chart of the methodology.
Land 11 01801 g002
Figure 3. Life form (A) and Habit based spectrum (B) of the flora recorded in the mining and non-mining sites along the River Panjkora basin.
Land 11 01801 g003
Figure 4. Spectrum based (A) on seed and status in Pakistan (B) of the flora recorded in the mining and non-mining sites along the River Panjkora basin.
Land 11 01801 g004
Figure 5. Raunkiaer life form (A) and leaf size class spectrum (B) of the flora recorded in the mining and non-mining sites along the River Panjkora basin.
Land 11 01801 g005
Figure 6. Correlation heat map showing the relationship among the environmental variables of mining and non-mining sites. Note: Legends are same as that of Table 2.
Land 11 01801 g006
Figure 7. CCA-ordination and biplot showing vegetation distribution in 30 stands along the Panjkora river basin. Note: St. (Stand number); Environmental variables legends are same as that in Table 2; Species codes are same as that in Table S2.
Land 11 01801 g007
Table 1. Mean importance value index of dominant plant species in Group I (mining sites) and (Group II) non-mining sites.
Group I (Mining Sites)Group II (Non-mining Sites)
Plant BinomialMean ± SEPlant BinomialMean ± SE
Cynodon dactylon (L.)4.52 ± 0.70Cannabis sativa L.4.65 ± 1.28
Cannabis sativa L.2.7 ± 0.87Cirsium arvense (L.) Scop.1.88 ± 0.67
Cirsium arvense (L.) Scop.2.4 ± 0.73Corynephorus canescens (L.) P Beauv.2.13 ± 1.18
Corynephorus canescens (L.) P. Beauv.2.52 ± 1.22Cynodon dactylon (L.)2.8 ± 0.94
Datura metal L.2.07 ± 0.86Dodonaea viscosa (L.) Jacq.2.1 ± 1.43
Helianthus annus L.2.22 ± 1.01Duchesnea indica (Andr.) Focke1.79 ± 1.01
Mentha longifolia (L.) Huds3.12 ± 0.91Ficus carica L.1.62 ± 0.71
Persicaria hydropiper (L.) Delarbre.2.06 ± 0.74Monotheca buxifolia (Falc.) A. DC.1.86 ± 1.15
Populus nigra L.3.41 ± 0.98Olea ferruginea Royle.2.21 ± 1.12
Ricinus communis L.2.24 ± 0.94Pinus roxburghii Sargent.2.86 ± 1.23
Tagetes minuta L.2.61 ± 0.72Rumex dentatus L.1.68 ± 0.49
Xanthium strumarium L.4.23 ± 1.12Ficus carica L.1.62 ± 0.71
Note: Only twelve major dominant species having an importance value (IVI) higher than 1 are selected, and their IVI is presented as Mean ± SE.
Table 2. Descriptive value (Mean ± SD) of environmental variables affecting the vegetation sites of mining and non-mining sites.
FactorCodeMining SitesNon-Mining Sitest-Valuep-Value
Aspect Angle (°)AA257.5 ± 24.13237.21 ± 21.210.680.25
Elevation (m)ELE1189.4 ± 179.681081.5 ± 111.021.130.13
Latitude (°)Lat.35.04 ± 0.0835.00 ± 0.051.10.14
Longitude (°)Long71.95 ± 0.0471.94 ± 0.020.170.43
Sand (%age)Sand47.41 ± 2.1043.17 ± 2.271.20.12
Silt (%age)Silt29.82 ± 2.5832.51 ± 2.870.790.22
Clay (%age)Clay22.75 ± 1.9023.93 ± 2.190.660.33
Nitrogen (%age)N0.15 ± 0.050.34 ± 0.072.660.009
Phosphorus (mg/Kg)P5.12 ± 0.516.34 ± 0.541.760.05
Potassium (mg/Kg)K137.35 ± 18.06110.92 ± 7.171.630.06
Lime (%age)L13.09 ± 1.0211.17 ± 0.701.90.033
Organic matter (%age)OM0.86 ± 0.110.84 ± 0.090.140.44
pH (1:5)pH6.84 ± 0.146.47 ± 0.211.390.09
Electrical conductivity EC36.42 ± 2.6137.5 ± 2.50.550.29
Wilting pointWP0.13 ± 0.000.14 ± 0.010.650.22
Bulk density (g/cm)BD1.41 ± 0.011.42 ± 0.011.090.14
Available waterAW0.12 ± 0.000.13 ± 0.00−1.040.16
Saturation pointSP0.46 ± 0.000.47 ± 0.00−1.070.15
Table 3. Canonical correspondence analysis axes summary, correlation and biplot scores of the environmental variables.
AxesAxis 1Axis 2Axis 3
Eigenvalue0.7010.5040.438
Species data variance
Variance explained (%)8.96.45.6
Cumulative variance (%)8.915.320.9
Correlation (Pearson). Spp-Envt0.9950.9690.989
Correlation (Kendall). Spp-Envt0.8250.8470.899
VariableCorrelationBiplot scores
Axis 1Axis 2Axis 3Axis 1Axis 2Axis 3
1AA−0.1880.02−0.331−0.1570.014−0.224
2ELE0.955−0.192−0.0340.795−0.133−0.023
3Lat.0.803−0.4360.0660.669−0.3020.045
4Long0.752−0.4170.1990.626−0.2890.134
5Sand−0.0030.030.07−0.0030.0210.047
6Silt−0.111−0.024−0.302−0.092−0.017−0.204
7Clay0.145−0.0160.2910.121−0.0110.196
8N0.1460.1250.2680.1220.0870.181
9P−0.1880.0760.383−0.1560.0530.258
10K−0.3510.262−0.03−0.2920.181−0.02
11L−0.1880.032−0.255−0.1560.022−0.172
12OM−0.003−0.063−0.11−0.002−0.043−0.074
13pH0.1470.207−0.5380.1220.143−0.363
14EC−0.04−0.0360.352−0.034−0.0250.238
15WP0.115−0.0250.2650.095−0.0170.179
16BD−0.184−0.001−0.316−0.1530−0.213
17AW−0.091−0.029−0.252−0.076−0.02−0.17
18SP0.17600.3130.14700.211
Note: Legends are the same as that in Table 2.
Publisher’s Note: MDPI stays neutral with regard to jurisdictional claims in published maps and institutional affiliations.

