Article

Understanding Recovery Is as Important as Understanding Decline: The Case of the Crested Ibis in China

1
Key Laboratory of Animal Ecology and Conservation Biology, Institute of Zoology, Chinese Academy of Sciences, Beijing 100101, China
2
College of Life Sciences, University of Chinese Academy of Sciences, Beijing 100049, China
3
Beijing National Day School, 66 Yuquan Road, Haidian District, Beijing 100039, China
4
Shaanxi Hanzhong Crested Ibis National Nature Reserve, Yang County, Hanzhong 723300, China
5
Cardiff School of Biosciences, Sir Martin Evans Building, Cardiff University, Museum Avenue, Cardiff CF10 3AX, UK
*
Author to whom correspondence should be addressed.
Land 2022, 11(10), 1817; https://doi.org/10.3390/land11101817
Submission received: 23 September 2022 / Revised: 12 October 2022 / Accepted: 14 October 2022 / Published: 17 October 2022

Abstract

:
The wild population of the crested ibis (Nipponia nippon) has recovered remarkably from seven individuals in 1981 to over 7000 in 2021. However, it is unclear how key factors, from endogenous density dependence to exogenous environmental pressure, have contributed to the species’ recovery. We used species distribution models to quantify the contributions of climatic variables, human impact, land form and land use in order to understand the recovery process in the context of prevailing environmental conditions. We also calculated the nest density over the past 39 years to estimate the influence of density dependence on population dynamics. We found that the interaction between rice paddy areas and water bodies (rivers, lakes and ponds) had the highest contribution to nest site selection, whereas linear terms for either rice paddies or water bodies alone had little effect. During its recovery, sub-populations in two watersheds have been constrained by high density and have experienced logistic growth, while other sub-populations in over seven watersheds are growing exponentially. Our models indicate that exogenous environmental factors are more important than density restriction at this stage. In China’s transformed landscape, the crested ibis needs both rice paddies and water bodies to fulfil its annual life cycle. Habitat protection should thus cover both habitat types to ensure the long-term survival of this still endangered species.

1. Introduction

Recent decades have witnessed numerous species extinctions and population declines [1,2], but some endangered species have fortunately recovered for reasons that are not always clear [3]. In the United States, 23 species were identified as recovered, and 43 species were downlisted from endangered to threatened or removed entirely from the Endangered Species List between 1973 and 1999 [3,4]. Among these species, the mechanism of recovery is largely unknown, e.g., [5,6]. For example, peregrine falcon (Falco peregrinus) populations have been restored in the past 40 years starting from about 300 to over 7000 individuals after the ban on DDT in early 1970s, yet the mechanism of such population growth has not been sufficiently addressed [7]. Varied reasons, e.g., [8], have been proposed to account for the recovery of the bald eagle (Haliaeetus leucocephalus), but the underlying recovery process is still unknown. In general, a challenging question in regards to recovered/recovering species remains the same: what are the prevailing factors that have driven the population to rebound [3]?
The recovery of the crested ibis (Nipponia nippon) presents an ideal model to address this issue, because, unlike many other recovered species, which lack detailed information about their demography and environmental factors, the entire wild population has been closely monitored since its recovery [9]. The crested ibis used to be a common species in East Asia [10,11]. Due to the massive use of pesticide and fertilizer in rice paddies, the crested ibis’ favorite foraging sites, as well as habitat loss and human disturbance, the wild populations underwent a rapid decline [10,12]. In 1963, Russia declared the birds locally extinct; in 1975, the last crested ibis disappeared from North Korea; in 1981, the last five known survivors were put in captivity in Japan, yet they never successfully reproduced [10]. Fortunately, two breeding pairs and three nestlings were rediscovered in Yang County, Shaanxi, Central China in 1981 [13]. Since then, the species has been recognized as one of the world’s most critically endangered bird species [14], and numerous efforts by governments and society have been undertaken to conserve this species using in situ and ex situ conservation [15,16]. After a continuous population increase for four decades, the population size is estimated to have reached over 7000 wild individuals in 2021 [9]. The ibis has also been reintroduced into Japan [17] and South Korea [18], and to several putative historical locations in China [16]. Although the crested ibis population has been continuously monitored throughout its recovery processes, e.g., [13,19,20], until now there has been no systemic study investigating why and how the species recovered.
Two hypotheses may explain the recovery of the crested ibis. The first is that if the habitat is restored, the species will respond positively, and the population will grow exponentially until other limiting factors start to play a role. Our previous work has indicated that the habitats have improved mainly because of the banning of pesticide and fertilizer use in its core habitat [9], with the contamination of rice paddies is speculated to be an important condition associated with the population decline [12]. The second hypothesis associated with the crested ibis’ recovery is density dependence, e.g., [21], in which the birds have a high growth rate at low densities and its population growth would become restricted at high densities. The crested ibis has been found to compete for limited food resources during breeding [22,23] because rice paddies serve as their main breeding foraging sites [24]. The two hypotheses explain both exogenous (environmental) and endogenous (demographic) reasons for the species’ recovery, but remain untested until now.
Here, through the continuous collection of nesting data from 1981 to 2019, we systematically analyzed the contributions of environmental variables (climate, anthropogenic influence, land class and land use types) in the habitat selection of the crested ibis, and estimated their population density in different regions and at differential temporal stages, with the aim to explore whether the two hypothetical mechanisms or their interactions are responsible for the successful species recovery of this endangered species.

2. Methods

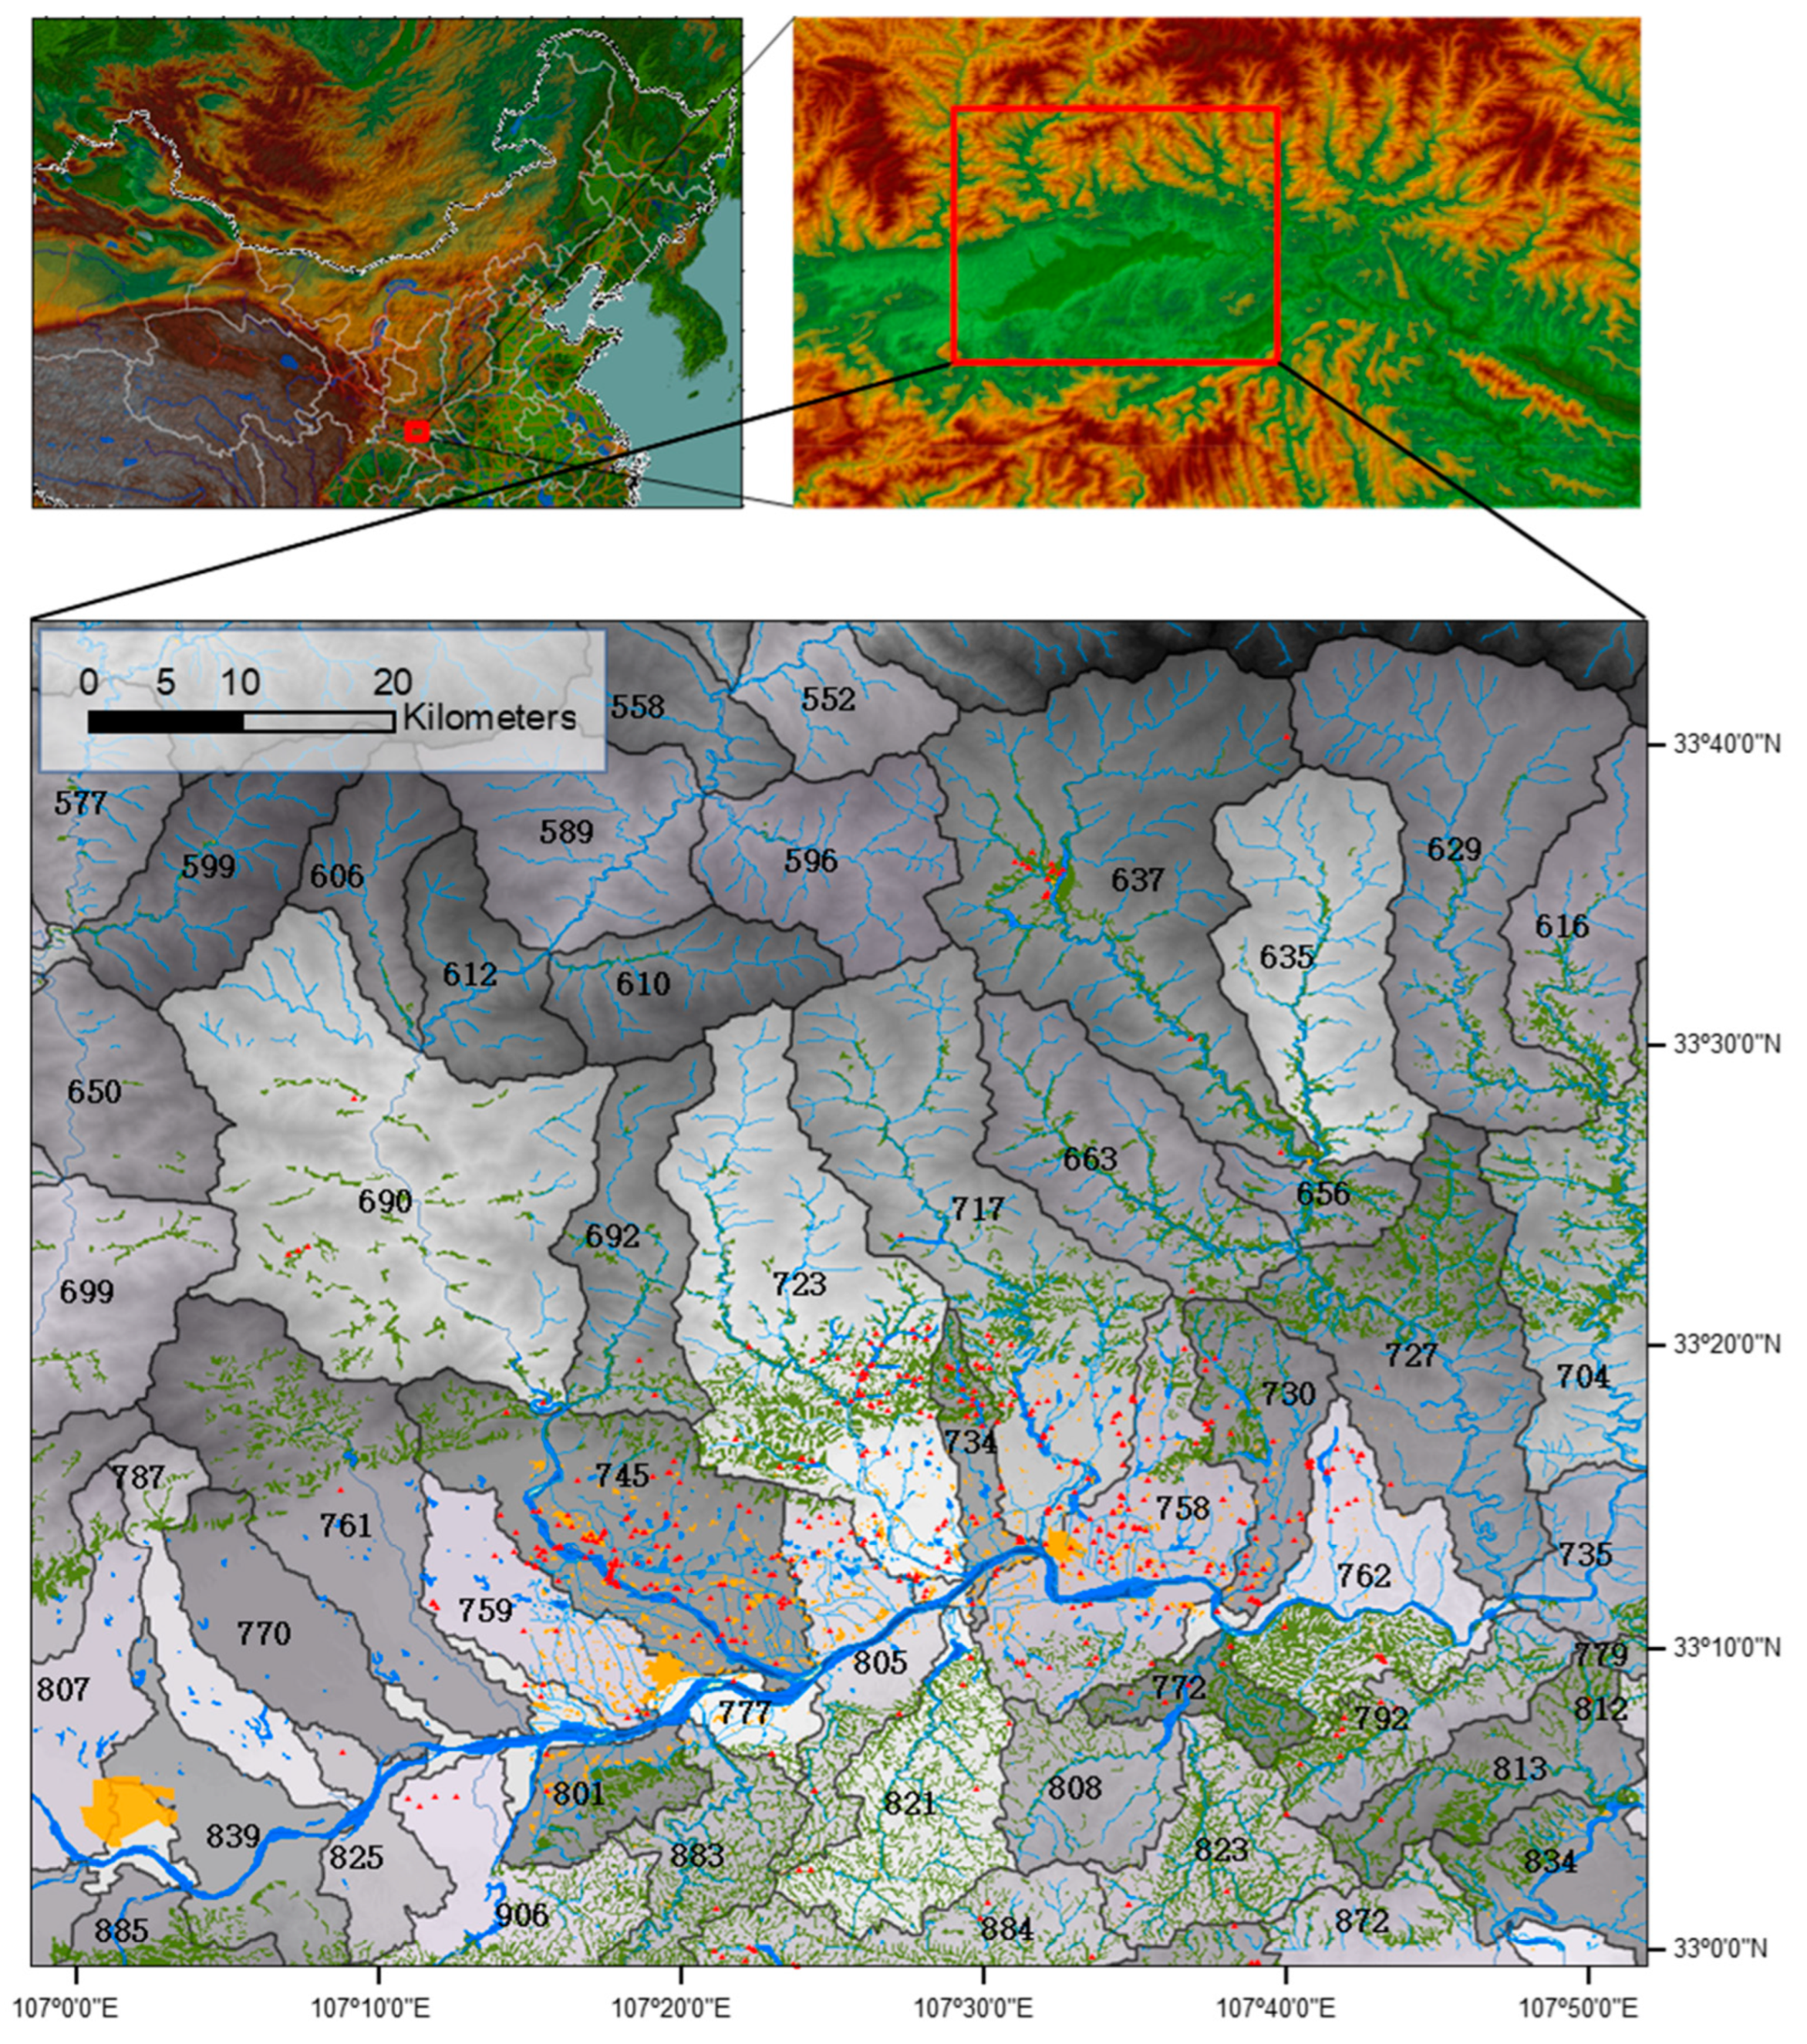
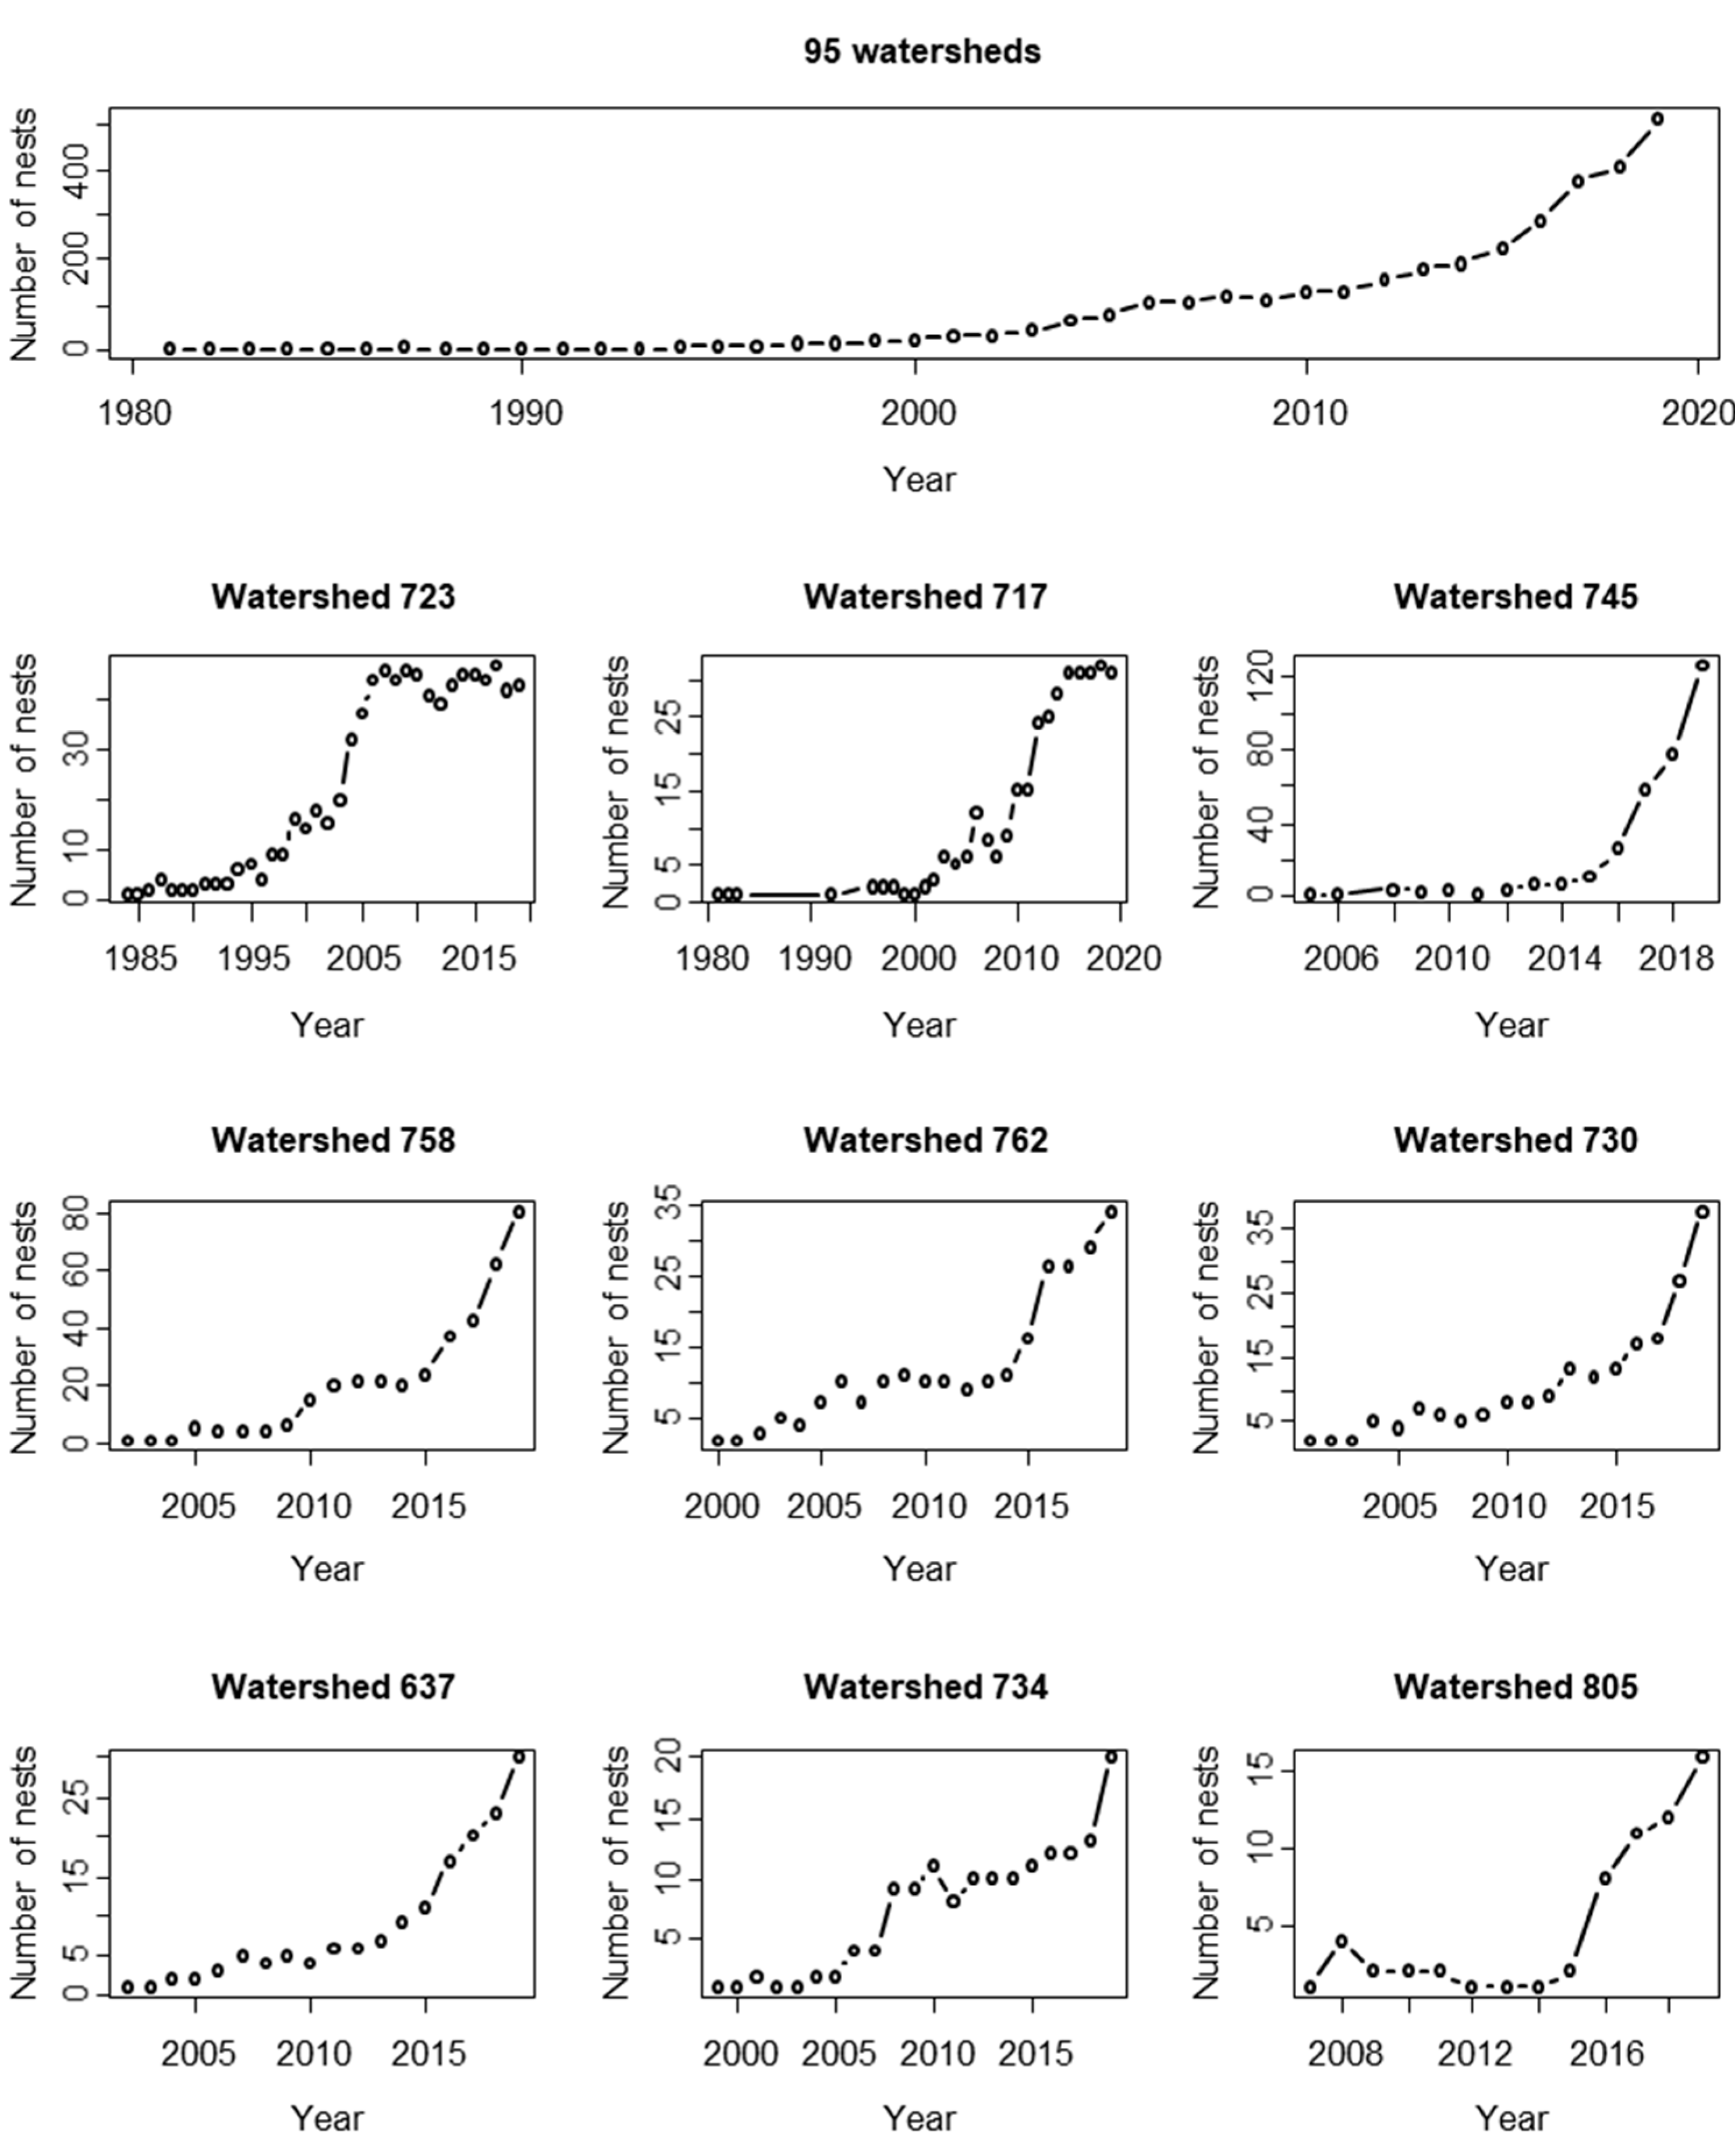
2.1. Study Area and Nest Data Collection

Having recovered from a few remnant individuals, the wild population of the crested ibis resides in Yang County and its neighboring counties in Shaanxi Province, Central China. Yang County is on the southern slope of the Qinling Mountains (Figure 1). The landscape comprises forested foothills and steep mountains to the north and gently rolling croplands in the south, mixed with rivers and ponds. The species’ typical nesting habitat has been described as temperate forest mixed with rice paddies and other wetlands [13,20].
We collected annual nesting data for the recovering population in Yang County and the adjacent areas from 1981 to 2019. The crested ibis has strong nest site fidelity [24], and we therefore checked all the nest sites used, surveyed potential sites using line transects, and recorded the presence or absence of birds at those sites. We determined a survey route for each nest. Most survey routes are fixed and have been repeatedly used for many years. Occasionally, surveyors made a detour in order to find new nests. The crested ibis is a large bird, which can be easily detected in forests, shrubs and crop lands. As such, the survey time was in the daytime (7:00–19:00), unlike song bird surveys that start at dawn. Surveys for the crested ibis were repeated 3–4 times per breeding season. As a result, we recorded 3366 nest sites based on the 39-year-long survey (Figure S1).

2.2. Using Watersheds as the Spatial Scale for Habitat Analysis

The accuracy of species distributions predicted by species distribution models (SDMs) may suffer from spatially and/or temporally autocorrelated occurrence observations [25,26]. To overcome this bias, we analyzed the habitat use of the crested ibis at the scale of the watershed, evaluating the overall suitability of each potentially occupied watershed. The birds stay in the same watershed during the breeding season (due to limited dispersal of less than 10 km [12]). Watersheds were delineated using DEM (digital elevation model) data using HydroSHEDs developed by the WWF-US [27,28]. Watershed area was at 100–200 km2 (Figure 1) in order to cover both breeding and post-breeding habitats. With this standard, 95 watersheds were defined in our study with an average area of 154 km2 (Figure 1). We then used negative binomial regression models to explore the relationship between the number of nests in a watershed and local environmental variables. Analysis at a larger spatial scale, rather than using point occurrences, also enabled us to examine the overall habitat preference throughout the species’ life cycle.

2.3. Envirenmental Variables

We constructed a GIS database with a layer of crested ibis occurrences using the nest site data collected above (Figure S1), and seven other layers with nine environmental variables related to climate, land use, land form and human impact: annual mean temperature, annual total precipitation, area of rice paddies, area of water bodies, mean elevation, variance in elevation, human population density, human footprint index and gross domestic product (GDP). Two elevation variables were derived from the DEM layer, and areas of rice paddies and water bodies were derived from the land use layer.
The means, standard deviations and ranges of these variables, as well as the data sources, are listed in Table 1. Elevation data were taken from the Shuttle Radar Topography Mission (SRTM) dataset at a horizontal resolution of 90 m [29]. Land use data comprised polygons identified as cropland (irrigated or non-irrigated), forest, shrub, grassland, or water bodies (i.e., rivers and ponds), derived from remote sensing images processed by the Chinese Academy of Surveying and Mapping [30]. The irrigated croplands in the study area were all rice paddies. Human population density and gross domestic product (GDP) were raster layers at a resolution of one km2, processed by the Institute of Geographic Sciences and Natural Resources Research, Chinese Academy of Sciences [31,32]. The human footprint index was a raster layer integrating impacts of human population density, accessibility, land transformation and electrical power infrastructure at a resolution of one km2 [33]. The annual average temperature and total precipitation were raster layers calculated from monthly mean values from 1971 to 2000 [34].
To check the multicollinearity of the environmental variables, we used variance inflation factors (VIFs) to quantify the dependence of a variable with all other variables. The vif function in R package car [35] was used to calculate VIFs. We removed variables with VIF scores over 5.

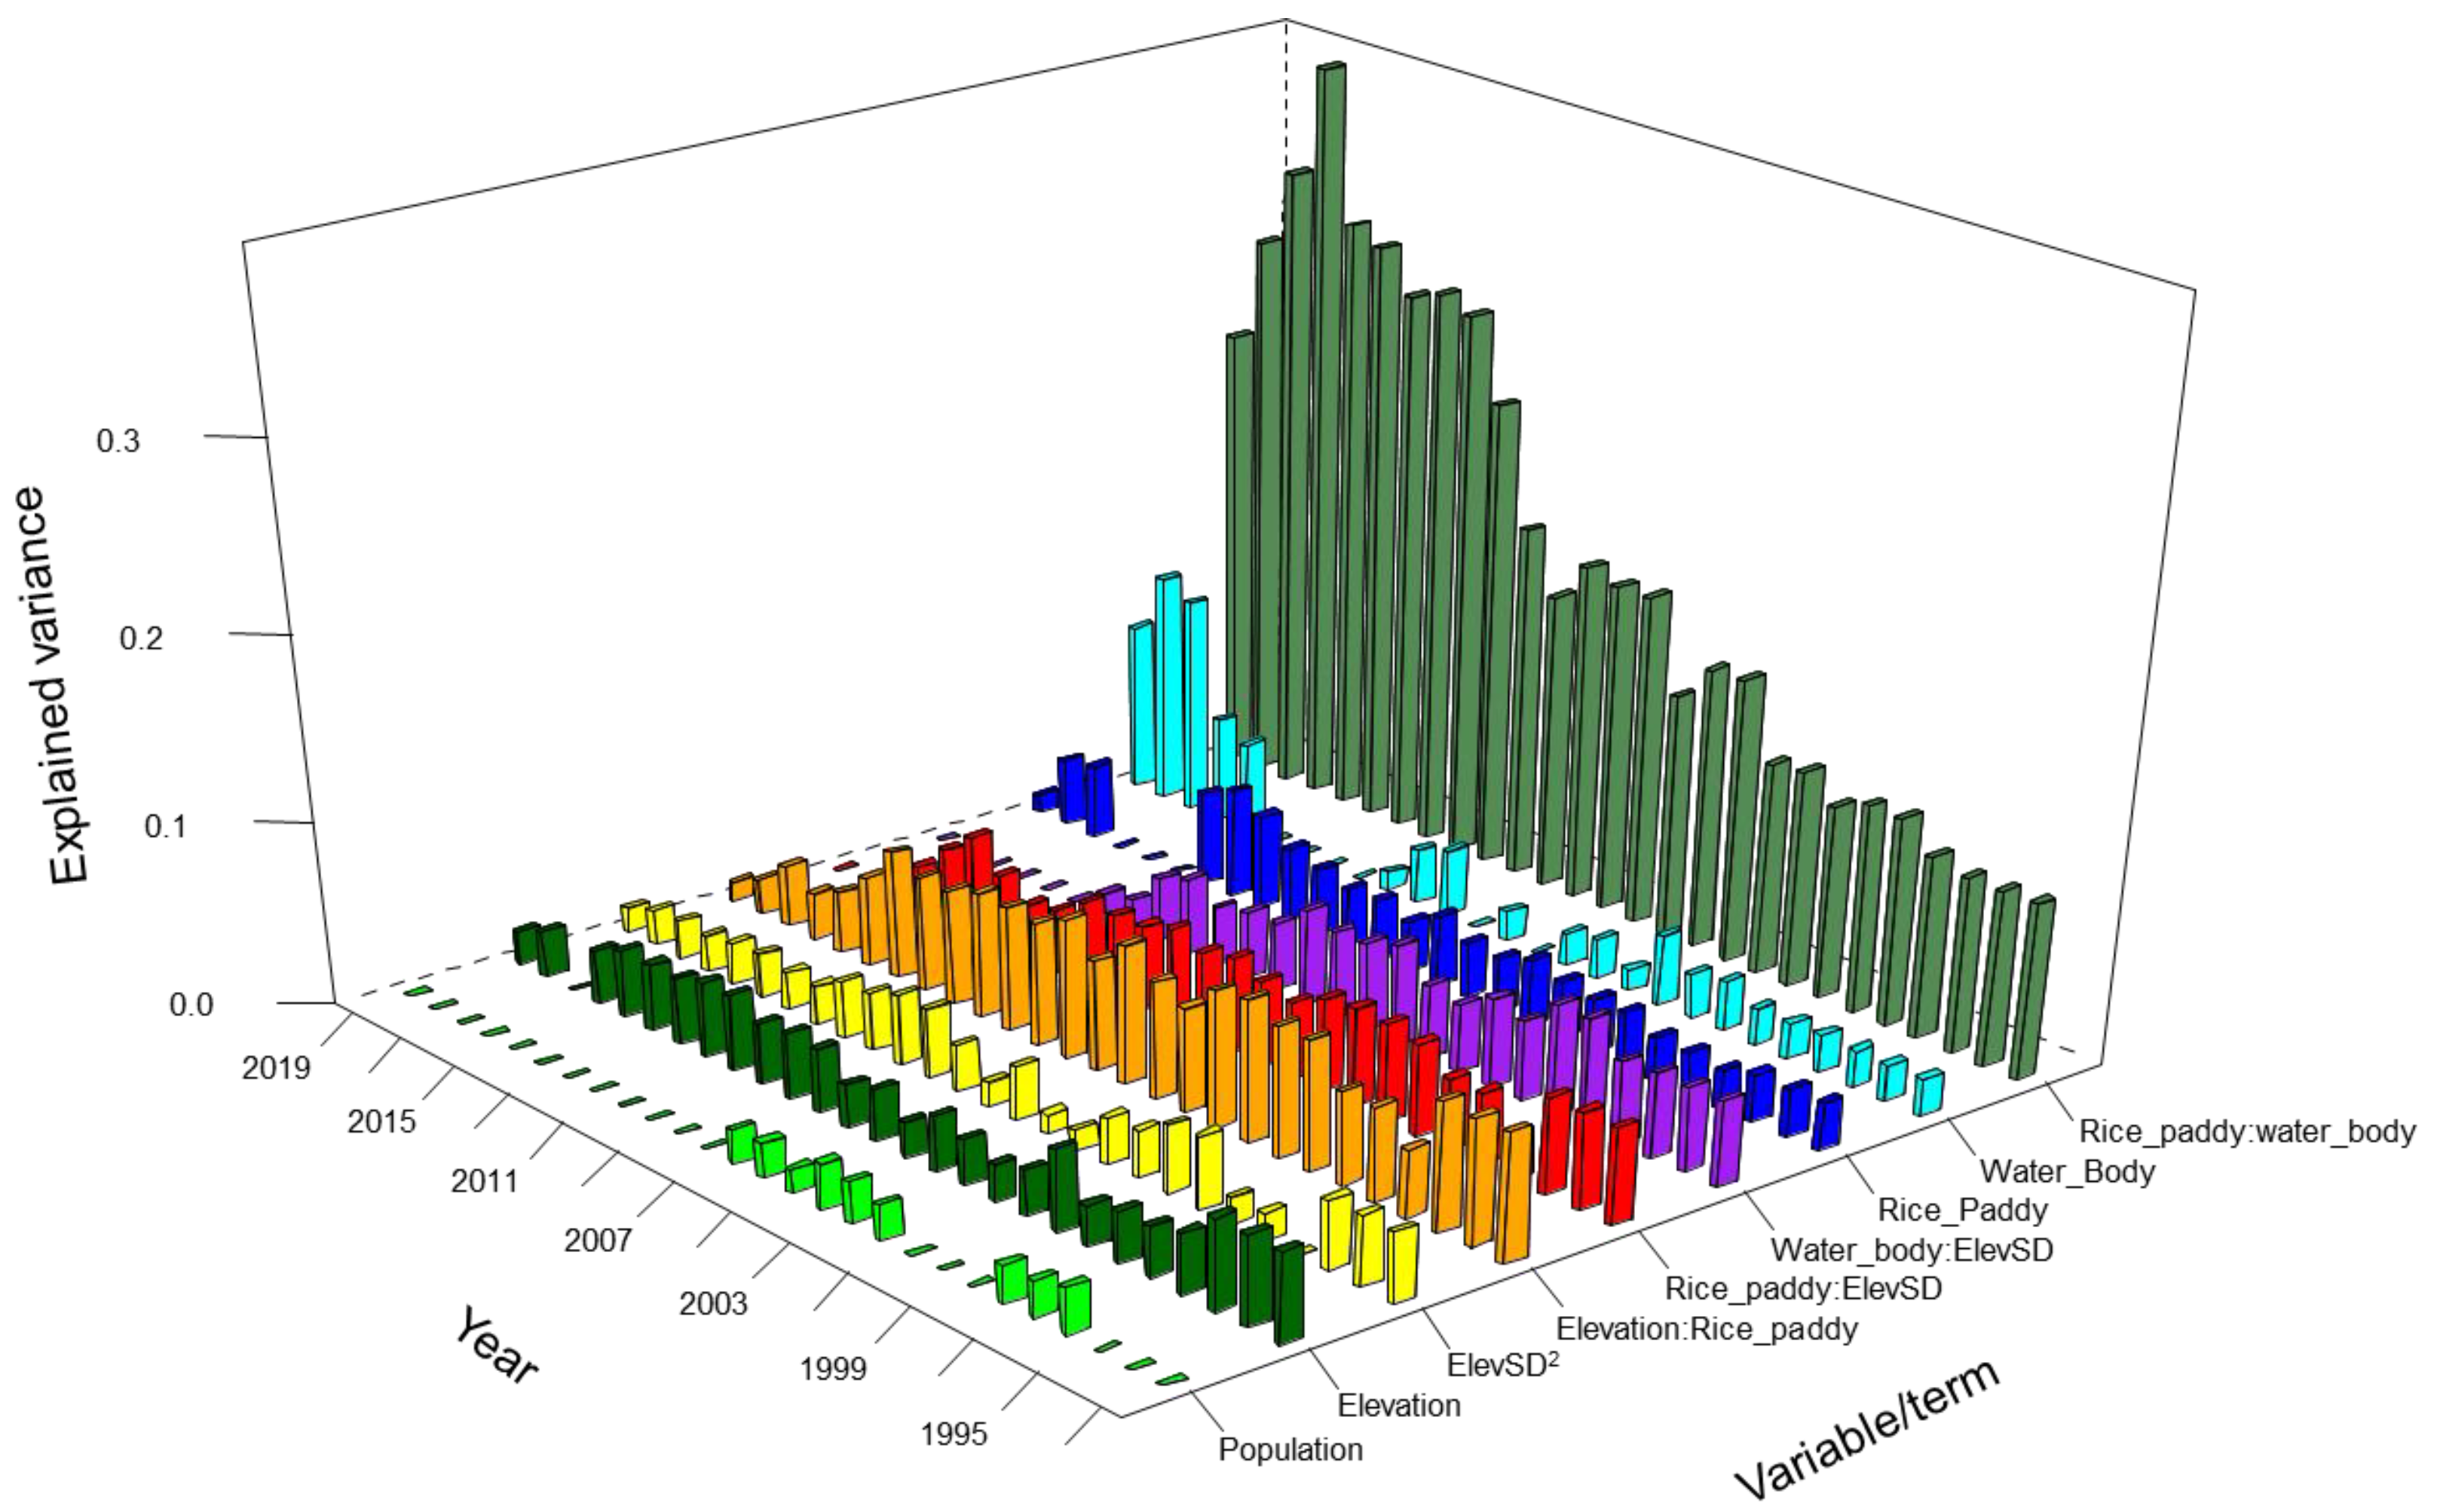
2.4. Species Distribution Modelling

Since the number of nests within the 95 watersheds are count data, and the variances of the data are about 10 times higher than the mean values, we applied negative binomial regressions to explain the annual number of nest sites within the watersheds using nine explanatory variables (Table 1). At watershed i, the number of nests inside the watershed is Ni, estimated by:
log(Ni) = b0 + Σ(bm × var(i, m))
where b0 is the intercept, bm is the mth coefficient, and var(i, m) is the mth explanatory variable or term (e.g., quadratic term or interaction term) of watershed i.
Equation (1) represents a full model including all the linear terms, quadratic terms, and two-way interaction terms between the explanatory variables. We ran a negative binomial regression model to fit data for each year from 1993 to 2019, because the sample sizes (number of nests) were too low before 1993. We used a backward stepwise model selection procedure based on AIC values. All remaining variables and terms are listed in Table S1.
Since the performance of the negative binomial regressions was not stable across years from 1993 to 2019, we also used multiple regression models to quantify the association between the number of nests in watersheds and the environmental variables of watersheds. The models are:
Ni = b0 + Σ(bm × var(i, m))
In the multiple regressions, we selected the type III sum of square to quantify the contribution of each variable/term by using the Anova() function in the package car [35]. Backward stepwise model selection procedure was also carried out, and the results were listed in Table S2.
Negative binomial regression models and multiple regression models, although they take into account all the quadratic and two-way interaction terms as types of linear models, poorly fit the dependent variable (number of nests) if the nonlinearity, interaction and multicollinearity of the explanatory variables are strong. As such, we applied a random forest approach [37] to predict the number of nests in all watersheds and evaluated the contributions of the explanatory variables. We included all nine explanatory variables in the model, ranked their importance, and plotted the partial effects of these variables. The random forest can also facilitate the model selection of the negative binomial regressions, as we can select the most important variables and relevant terms based on the random forest importance indices and partial plots. Specifically, the quadratic term of a variable was kept in the model when the partial plot showed a dome-shaped curve.

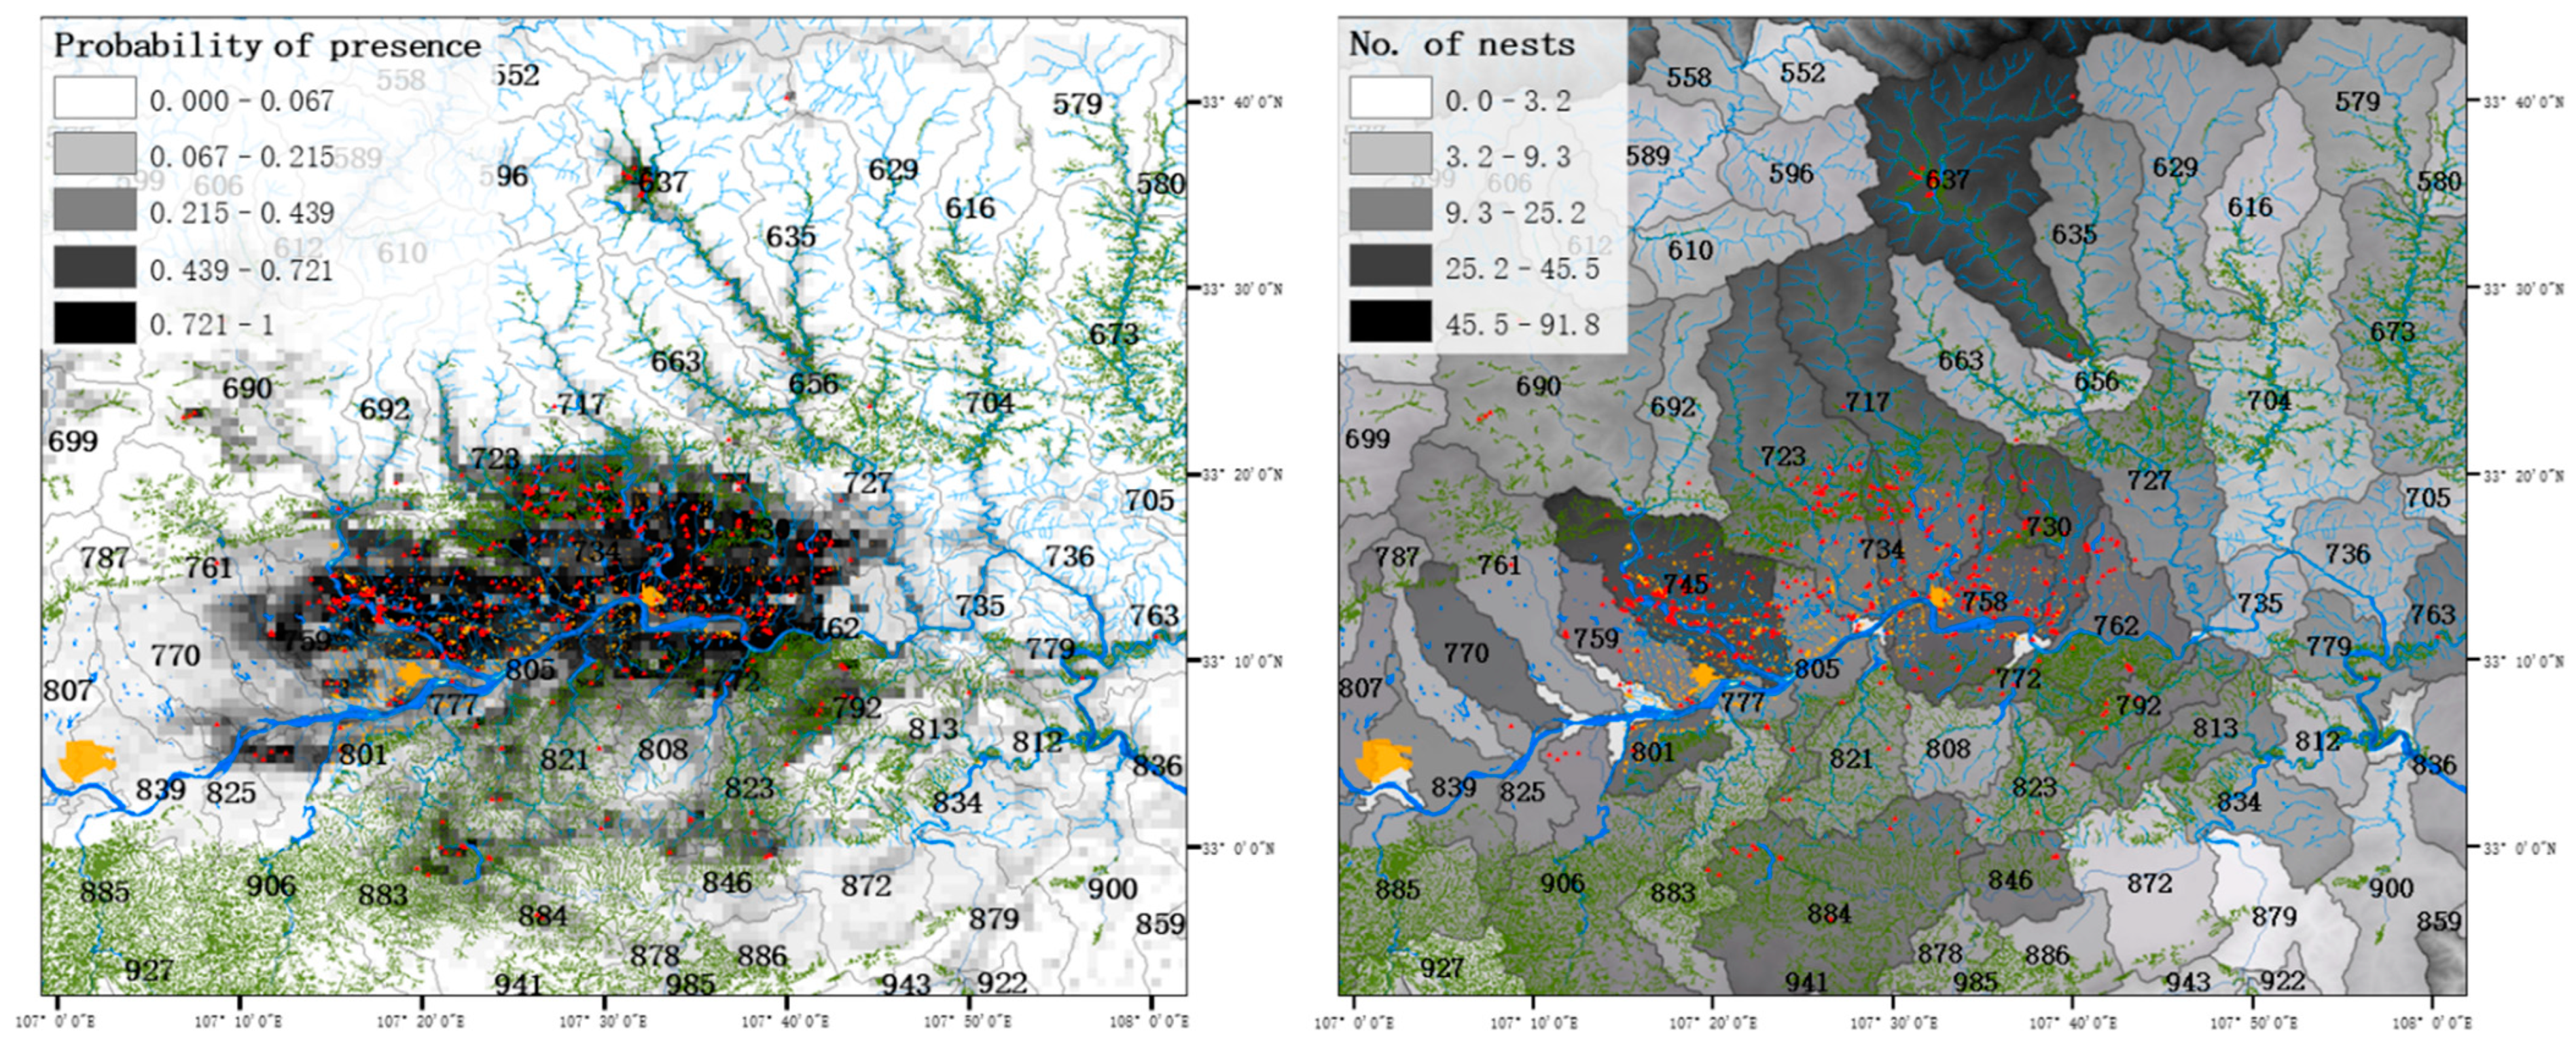
2.5. Nest Density and Carrying Capacity Estimation

To access the nest density in each year, we counted the number of nests within the rectangle enclosing all the nests in the year and calculated the nest density as: number of nests/area of the rectangle. Since 2000, a few nests have been far away from others. As such, we used the 10% and 90% quantile ranges of latitude and longitude to define the rectangle, meaning we estimated nest density in the central part of the nesting areas. We also calculated distances between every two nests in every year, as an index of population density.
To estimate the carrying capacity for the crested ibis in its current distribution range, we applied a random forest algorithm to calculate the presence of nests using all nest sites in 2019 and 900 evenly distributed pseudo-absence points. We used the R package abundanceR [38], which provided 39 variables covering all terrestrial areas on the earth, and provided functions to crop the environmental data layers (function: cropLayers()), generate pseudo-absent points, extract values of environmental variables (function: getEnvData()), develop SDMs and make the prediction at a one km2 resolution (function: popSize()). The predicted presence using an SDM is usually not accurate, unless the target species reaches carrying capacity or follows an ideal free distribution [39]. As such, we used the ratio of predicted and observed number of nests in watersheds where the ibis population has reached carrying capacity to adjust the estimated nest numbers. We also predicted the number of nests within watersheds directly using the environmental variables of watersheds based on the random forest algorithm.

3. Results

From 1981 to 2019, the crested ibis population gradually increased from only two breeding pairs in two watersheds to 511 breeding pairs occupying 35 watersheds in the Hanzhong Basin, including 503 pairs in 32 watersheds in the central part of the Hanzhong Basin (Figure 1 and Figure S1). Initially, the population fluctuated at a very low level (two to four pairs) for 13 years after its rediscovery. From 1994, the population started to increase rapidly. Generally, its demographic recovery can be fitted using an exponential function: number of nests = exp (1.445 × (−1977 + Year)) (Figure 2, upper panel). The R2 value of the regression reached 98%. However, the sub-population growth varied among different watersheds: sub-populations reached carrying capacity in watersheds 723 and 717, featuring large subpopulation sizes (number of nests were 43 and 31, respectively) and population stability by 2006 and 2015, respectively, whereas others (i.e., watersheds 745, 758, 732, 762, 637, 734 and 805) demonstrated continual exponential growth (Figure 2).
We checked the independence of the environmental variables and found that six variables, mean elevation, standard deviation of the elevation, annual total precipitation, human population density, areas of rice paddies and areas of waterbodies, have VIF scores less than five, and we used these variables to build the negative binomial models. Temperature was removed, as its correlation coefficient with elevation was −0.99. GDP and human footprint index were also removed because their correlation coefficients with human population density were 0.93 and 0.83, respectively.
The results of 27 negative binomial regressions for the years from 1993 to 2019 showed that the most important term is the interaction term of areas of rice paddies and areas of waterbodies. The elevation–population interaction was also important in some years. Other important variables are areas of water bodies, areas of rice paddies, square term of elevation, standard deviation of elevation (ElevSD), etc. (Table 2 and Table S1). The results of the multiple regressions are similar (Table 2 and Table S2), and they provided a consistent contribution of variables across the 27 years (Figure 3), compared with those from the negative binomial regressions (Figure S2).
Our random forest models included all the correlated variables because random forest is robust to multicollinearity. The interaction term of areas of rice paddies and water bodies was especially important, thus we added this term (areas of rice paddies × areas of water bodies) to the random forest model as a variable and named it “Wetland”. The results showed that in 2019, the most important explanatory variables for nest selection were the interaction term of areas of rice paddies and water bodies (the Wetland in the model), areas of water bodies, areas of the watersheds and standard deviation of elevation (Figure S3). Based on the partial plots (Figure S4) of the explanatory variables, we can see that precipitation had a bow-shaped effect, so that the quadratic term of precipitation might be included in the linear models.
The growth of the crested ibis population was found to be density-dependent. In watershed 723, the number of nests has been stable since 2005, and in watershed 717, the number of nests has reached carrying capacity since 2015. The population density in watersheds 723 and 717 was 0.139 and 0.102 nests/km2, respectively. In contrast, the number of nests in watersheds 745, 758, 730, 762, 637, 734 and 805 increased dramatically after 2015. Watershed 745 became the most occupied watershed in 2017 (Figure 2). The bird density increased asynchronously in different watersheds.
During the recovery of the crested ibis, the population density increased steadily after 2000 (Figure S5). One striking feature is that many crested ibises no longer defend their breeding territories, and nest together with others. From 1994 to 2005, the minimum distance between nests was 100 m; since 2005, the minimum distance has been 10 m, and since 2016, more pairs have nested in the same trees (Table 3).
We used two methods to predict the number of nests based on the environmental variables (Table 1) using the random forest algorithm: the occurrence-based method (Figure 4, left panel) and the watershed-based method (Figure 4, right panel). The former method overestimated the number of nests, and the latter method underestimated the number of nests (Table 4). We adjusted the predictions using the number of nests in watersheds 717 and 723, where the bird populations reached their carrying capacity and were stable for years (Figure 2). Compared with the number of nests in watersheds in 2019, the watershed-based method provided more accurate predictions (Table 4), because it explained 94.6% of the variance in the number of nests in all watersheds, whereas the occurrence-based method explained 77.2%.
Based on the watershed-based method, we found that watersheds 777, 906 and 801 had a large capacity to support more birds. Watersheds 770, 807 and 635, although not occupied, were suitable for the crested ibis and can support 5–7 pairs. The carrying capacity of the 95 watersheds is 602 pairs (Table 4).

4. Discussion

The crested ibis has recovered from seven individuals (two pairs and three nestlings) [13] to over 7000 from 1981 to 2021 (including several captive populations), making it a conservation success story of global significance [9]. Previous studies have suggested that the most important reasons for its recovery are habitat restoration (e.g., pesticide ban) and poaching control [11,16,19,40]. In this study, we demonstrated that the habitat combination of rice paddies and water bodies played the most important role in habitat selection, while previous studies only implicate the importance of wetlands without distinguishing wetland types, e.g., [22,41,42,43]. We highlight that the crested ibis needs both rice paddies and water bodies in watersheds. In general, habitat quality (in term of the areas of rice paddies and water bodies) was the most important factor for the ibis’ recovery, rather than human disturbance and climate conditions [44]. Thus, the hypothesis that environmental factors dominated the recovery of this species is supported, since the population has grown as a function of habitat restoration and availability [9].
The SDM analysis allowed us to estimate the carrying capacity to be 602 nests (Table 4) in the 95 watersheds, meaning that the population is expected to reach its carrying capacity in a few years, if the ibis population keeps growing at its current rate (Figure 2), even though density dependence may slow this growth as the carrying capacity is approached and available nesting sites in other watersheds become limiting. The dependence on wetlands constrains the bird’s distribution within the Hanzhong Basin, which has a high density of wetlands (Figure 1, upper right panel). The area adjacent to the Hanzhong Basin is likely to be too dry for the crested ibis, so that the carrying capacity of 602 nests is unlikely to increase substantially if the population was to expand its range.
The dramatic increase in population density from 1993 to 2019 implies that there is no density-dependent limitation on population recovery. However, the logistic population growth in two watersheds (the core habitat) showed that high densities can constrain population growth in some regions. In watersheds 717 and 723, population growth seems to have stopped a few years ago (Figure 2) since the available foraging sites, the rice paddies along the river, are now all occupied.
During the recovery process, the crested ibis has shifted to lower altitudes with higher human densities, from about 1200 m in 1980s to 600–800 m in 2000s. In recent years, especially since 2015, over 50 new nests have been built in the lowest area of the region, where the human population density is very high. For example, the human density in watershed 745 is 715 person/km2.
The area of rice paddies and water bodies are the most important factors for nest site selection by the crested ibis, implying that food supply is the limiting factor for birds during the breeding season. The bird therefore requires both wetland types, but in different seasons. During the breeding season, rice paddies are the major foraging sites. The rice paddies in the area (Figure 1) are mostly permanent (i.e., rice is harvested once in a year, and then the paddies are left fallow), as the local weather is not warm enough for two harvests in a year, compared to elsewhere in Southern China. The rice paddies usually have rich food resources, such as fish and invertebrates. In June, the breeding season ends and the rice plants are too high and dense to be accessed by the crested ibis. At this time, adults bring their fledglings to low-elevation areas, where they can forage around the water bodies (i.e., rivers, ponds and lakes). Thus, watersheds featuring both rice paddies and water bodies are the preferred habitat, as they can support the full life cycle of the bird.
In the study area, all streams are natural without dams or levees. However, there are lots of man-made ponds and reservoirs, contributing about 20% of the water body areas. Moreover, all the rice paddies are non-natural. As such, the aquatic habitat of the crested ibis is half-natural. We think the crested ibis is a “smart” bird that rapidly adapted to human-altered habitats, and became a human-commensal bird species.
Selecting an appropriate sampling scale is important in habitat modeling [45]. We selected the watershed as our unit of analysis. The results contrast those from previous studies that were based on the occurrence data and raster layers of environmental variables, e.g., [12,24], which only addressed its habitat preference in one season (i.e., the breeding season). We suggest using region-based SDMs to study species–environment relationships, which would provide more general information about the overall suitability of a region. However, one weakness of region-based SDMs is that they cannot address spatial heterogeneity at a fine scale (i.e., quadrat scale with a 1 km2 resolution) within a watershed. Further studies could focus on fine-scale analyses within watersheds in which the carrying capacity has been reached and make comparisons to those in which it has not been achieved.
Among the iconic recovered birds of the world, few species have been as closely monitored with detailed demographic data as the crested ibis, with notable exceptions, including the Mauritius kestrel [46] and California condor [47], yet the use of spatially explicit population information for recovering species is rare [3]. Using accurate nest location data over the past 39 years, we were able to analyze the dynamics of habitat preference (Figure 3) and population density (Figure S1), showing the changes in the contribution of key factors (rice paddies and water bodies) for recovery (Table S1).
Finally, we have demonstrated the asynchronous population growth of the crested ibis in different watersheds and predict that growth will slow or stop in a few years, since our model suggests that there is still space in the lower elevation areas of the region, but that this space will be exhausted soon. We concluded that areas of rice paddies and water bodies are the most important factors in the crested ibis’ recovery and suggest that the bird can live harmoniously with local farmers as long as poaching is controlled and pesticide usage is restricted in this region.

Supplementary Materials

The following supporting information can be downloaded at: https://www.mdpi.com/article/10.3390/land11101817/s1. Figure S1. The locations of nests built by the crested ibis from 1981 to 2019. Figure S2. Contribution (proportion of deviance decreased) of variables/terms in the negative binomial regressions fitting the number of nests in the watersheds from 1993 to 2019. Figure S3. Variable importance in the random forest model explaining the variance of the number of nests in 95 watersheds in 2019. Variable wetland is the interaction term for areas of rice paddies and areas of water bodies. Figure S4. Partial effects of each variable on the number of nests in watersheds in 2019 based on the random forest algorithm. The variables were ranked in descending importance order in the plot. Figure S5. Population density (number of nests per km2) of the crested ibis in Hanzhong, China from 1981 to 2019. Table S1. The remaining variables and terms after stepwise model selection of the negative binomial regressions fitting the number of crested ibis nests within watersheds from 1993 to 2019 based on the environmental variables of the watersheds. Table S2. The remaining variables and terms after stepwise model selection of the multiple regressions fitting the number of crested ibis nests within watersheds from 1993 to 2019 based on the environmental variables of the watersheds.

Author Contributions

Conceptualization, X.L., X.Z. and Y.S.; methodology, X.L.; validation, T.Z. and Y.Z.; formal analysis, X.L.; investigation, X.L., J.F. and T.Z.; data, X.L. and T.Z.; writing—original draft preparation, X.L.; writing—review and editing, X.L., J.F., M.W.B. and X.Z.; visualization, X.L.; supervision, Y.S.; project administration, X.L.; funding acquisition, X.L. All authors have read and agreed to the published version of the manuscript.

Funding

This work was supported by the National Natural Science Foundation of China (No. 31970432 and 32171528), the Strategic Priority Program of Chinese Academy of Sciences (XDB31000000), the Third Xinjiang Scientific Expedition Project (Grant No. 2021XJKK1302), and the Second Tibetan Plateau Scientific Expedition and Research Program (STEP, Grant No. 2019QZKK0501). The study is also supported by the Alliance of International Science Organizations (ANSO) (Project ID: ANSO-CR-KP-2020-08) for ecosystem safety assessment and policy making at the China–Mongolia–Russia corridor of the One Belt One Road zone.

Data Availability Statement

The number of nests in 95 watersheds from 1981 to 2019 and associated environmental variables are provided as a supplementary EXCEL file (watersheds-number of nests and environmental variables.xlsx). The nest locations are sensitive data regarding conservation, and they are available upon request.

Acknowledgments

We thank the staff of Hanzhong Crested Ibis National Nature Reserve for their help during the field surveys. We are grateful to Liming Ma for carrying out the field surveys.

Conflicts of Interest

The authors declare no conflict of interest.

References

  1. Channell, R.; Lomolino, M.V. Dynamic biogeography and conservation of endangered species. Nature 2000, 403, 84–86. [Google Scholar] [CrossRef] [PubMed]
  2. Novacek, M.J.; Cleland, E.E. The current biodiversity extinction event: Scenarios for mitigation and recovery. Proc. Natl. Acad. Sci. USA 2001, 98, 5466–5470. [Google Scholar] [CrossRef] [PubMed] [Green Version]
  3. Rjf, A.; Scott, J.M. Examining differences between recovered and declining endangered species. Conserv. Biol. 2001, 15, 1274–1284. [Google Scholar] [CrossRef]
  4. Tear, T.H.; Scott, J.M.; Hayward, P.H.; Griffith, B. Recovery plans and the endangered-species-act—Are criticisms supported by data. Conserv. Biol. 1995, 9, 182–195. [Google Scholar] [CrossRef]
  5. Vredenburg, V.T. Reversing introduced species effects: Experimental removal of introduced fish leads to rapid recovery of a declining frog. Proc. Natl. Acad. Sci. USA 2004, 101, 7646–7650. [Google Scholar] [CrossRef] [Green Version]
  6. Fleming, W.J.; Grue, C.E. Recovery of cholinesterase activity in 5 avian species exposed to dicrotophos, an organo-phosphorus pesticide. Pestic. Biochem. Physiol. 1981, 16, 129–135. [Google Scholar] [CrossRef]
  7. Kauffman, M.J.; Frick, W.F.; Linthicum, J. Estimation of habitat-specific demography and population growth for peregrine falcons in California. Ecol. Appl. 2003, 13, 1802–1816. [Google Scholar] [CrossRef]
  8. Bowerman, W.W.; Giesy, J.P.; Best, D.A.; Kramer, V.J. A review of factors affecting productivity of bald eagles in the Great Lakes region: Implications for recovery. Environ. Health Perspect. 1995, 103, 51–59. [Google Scholar] [CrossRef]
  9. Ma, L.; Li, X.; Zhai, T.; Zhang, Y.; Song, K.; Holyoak, M.; Sun, Y. Changes in the Habitat Preference of Crested Ibis (Nipponia nippon) during a Period of Rapid Population Increase. Animals 2021, 11, 2626. [Google Scholar] [CrossRef]
  10. Shi, D.; Yu, X.; Fan, C.; Cao, Y. The description of the decline of the crested ibis. J. Northwest Univ. 1991, 21, 25–30. [Google Scholar]
  11. Zhang, Y.; Wang, F.; Cui, Z.; Li, M.; Li, X.; Ye, X.; Yu, X. Can we reestablish a self-sustaining population? A case study on reintroduced Crested Ibis with population viability analysis. Avian Res. 2021, 12, 14. [Google Scholar] [CrossRef]
  12. Li, X.; Tian, H.; Li, D. Why the crested ibis declined in the middle twentieth century. Biodivers. Conserv. 2009, 18, 2165–2172. [Google Scholar] [CrossRef]
  13. Liu, Y. Rediscovery of the crested ibis in Qinling Mountains. Acta Zool. Sin. 1981, 27, 273. [Google Scholar]
  14. BirdLife International. Nipponia nippon. In 1994 IUCN Red List of Threatened Species; IUCN: Gland, Switzerland, 1994. [Google Scholar]
  15. BirdLife International. Species Factsheet: Nipponia nippon. 2018. Available online: http://www.birdlife.org (accessed on 17 April 2018).
  16. Wang, M.; Ye, X.-P.; Li, Y.-F.; Huo, Z.-P.; Li, X.; Yu, X.-P. On the sustainability of a reintroduced crested ibis population in Qinling Mountains, Shaanxi, Central China. Restor. Ecol. 2017, 25, 261–268. [Google Scholar] [CrossRef]
  17. Yoshio, M.; Kato, N.; Miyashita, T. Landscape and local scale effects on the orthopteran assemblages in the paddy agroecosystems on the Sado Island, Japan with implications for the habitat management for the crested ibis. Ecol. Civ. Eng. 2009, 12, 99–107. [Google Scholar] [CrossRef]
  18. Kim, K.-a.; Car, J.; Gimtae, L.; Bak, H. Sex Identification of the First Incubated Chicks of the Crested Ibis Nipponia nippon in Korea. J. Life Sci. 2011, 21, 626–630. (In Korean) [Google Scholar] [CrossRef] [Green Version]
  19. Sun, Y.; Wang, T.; Skidmore, A.K.; Palmer, S.C.F.; Ye, X.; Ding, C.; Wang, Q. Predicting and understanding spatio-temporal dynamics of species recovery: Implications for Asian crested ibis Nipponia nippon conservation in China. Divers. Distrib. 2016, 22, 893–904. [Google Scholar] [CrossRef] [Green Version]
  20. Li, X.; Li, D. Current state and the future of the crested ibis (Nipponia nippon): A case study by population viability analysis. Ecol. Res. 1998, 13, 323–333. [Google Scholar] [CrossRef]
  21. Nicoll, M.A.C.; Jones, C.G.; Norris, K. Declining survival rates in a reintroduced population of the Mauritius kestrel: Evidence for non-linear density dependence and environmental stochasticity. J. Anim. Ecol. 2003, 72, 917–926. [Google Scholar] [CrossRef]
  22. Ye, Y.; Jiang, Y.; Hu, C.; Liu, Y.; Qing, B.; Wang, C.; Fernandez-Juricic, E.; Ding, C. What makes a tactile forager join mixed-species flocks? A case study with the endangered Crested Ibis (Nipponia nippon). Auk 2017, 134, 421–431. [Google Scholar] [CrossRef] [Green Version]
  23. Li, X.; Li, D.; Ma, Z.; Zhai, T.; Drummond, H. Ritualized aggression and unstable dominance in broods of crested ibis (Nipponia nippon). Wilson Bull. 2004, 116, 172–176. [Google Scholar] [CrossRef]
  24. Li, X.; Li, D.; Ma, Z.; Schneider, D.C. Nest site use by crested ibis: Dependence of a multifactor model on spatial scale. Landsc. Ecol. 2006, 21, 1207–1216. [Google Scholar] [CrossRef]
  25. Teng, S.N.; Xu, C.; Sandel, B.; Svenning, J.-C. Effects of intrinsic sources of spatial autocorrelation on spatial regression modelling. Methods Ecol. Evol. 2018, 9, 363–372. [Google Scholar] [CrossRef] [Green Version]
  26. Segurado, P.; Araujo, M.B.; Kunin, W.E. Consequences of spatial autocorrelation for niche-based models. J. Appl. Ecol. 2006, 43, 433–444. [Google Scholar] [CrossRef]
  27. Lehner, C.; Verdin, K.; Jarvis, A. HydroSHEDS Technical Documentation; World Wildlife Fund US: Washington, DC, USA, 2006. [Google Scholar]
  28. Guth, P.L. Drainage basin morphometry: A global snapshot from the shuttle radar topography mission. Hydrol. Earth Syst. Sci. 2011, 15, 2091–2099. [Google Scholar] [CrossRef] [Green Version]
  29. Rabus, B.; Eineder, M.; Roth, A.; Bamler, R. The shuttle radar topography mission—A new class of digital elevation models acquired by spaceborne radar. ISPRS J. Photogramm. Remote Sens. 2003, 57, 241–262. [Google Scholar] [CrossRef]
  30. Chinese Academy of Surveying and Mapping. China Basic Geographical Data: 1:1 Million Landcover; Chinese Academy of Surveying and Mapping: Beijing, China, 2004. [Google Scholar]
  31. Data Center for Resources and Environmental Sciences. China’s Gross Domestic Product Data (1 km Resolution); Institute of Geographic Sciences and Natural Resources Research, CAS: Beijing, China, 2006. [Google Scholar]
  32. Data Center for Resources and Environmental Sciences. China’s Population Density Data (1 km Resolution); Institute of Geographic Sciences and Natural Resources Research, CAS: Beijing, China, 2006. [Google Scholar]
  33. Sanderson, E.W.; Jaiteh, M.; Levy, M.A.; Redford, K.H.; Wannebo, A.V.; Woolmer, G. The Human Footprint and the Last of the Wild. Bioscience 2002, 52, 891–904. [Google Scholar] [CrossRef] [Green Version]
  34. China Meteorological Administration. The Meteorological Data for China during the Period 1971–2000; China Meteorological Administration: Beijing, China, 2012.
  35. Fox, J.; Weisberg, S. An R Companion to Applied Regression, 3rd ed.; Sage: Thousand Oaks, CA, USA, 2019. [Google Scholar]
  36. Chinese Academy of Surveying and Mapping. China Basic Geological Data: 1:1 Million Raster Data of Vegetation and Land Cover; Chinese Academy of Surveying and Mapping: Beijing, China, 2004. [Google Scholar]
  37. Breiman, L. Random forests. Mach. Learn. 2001, 45, 5–32. [Google Scholar] [CrossRef] [Green Version]
  38. Li, X.; Li, N.; Li, B.; Sun, Y.; Gao, E. abundanceR: A novel method for estimating wildlife abundance based on distance sampling and species distribution models. Land 2022, 11, 660. [Google Scholar] [CrossRef]
  39. Boyce, M.S.; Johnson, C.J.; Merrill, E.H.; Nielsen, S.E.; Solberg, E.J.; van Moorter, B. Can habitat selection predict abundance? J. Anim. Ecol. 2016, 85, 11–20. [Google Scholar] [CrossRef]
  40. Wang, F.; Li, M.; Zhang, Y.-S.; Zhao, W.-A.; Liu, D.-N.; Zhang, Y.-Z.; Zhang, H.; Ye, X.-P.; Yu, X.-P. Post-release dispersal and breeding site suitability of reintroduced populations of the Crested Ibis in Shaanxi Province, China. Restor. Ecol. 2021, 29, e13383. [Google Scholar] [CrossRef]
  41. Hu, C.; Song, X.; Ding, C.; Ye, Y.; Qing, B.; Wang, C. The size of winter-flooded paddy fields no longer limits the foraging habitat use of the endangered crested ibis (Nipponia nippon) in winter. Zool. Sci. 2016, 33, 345–351. [Google Scholar] [CrossRef] [PubMed]
  42. Sun, Y.; Wang, T.; Skidmore, A.K.; Wang, Q.; Ding, C. Decline of traditional rice farming constrains the recovery of the endangered Asian crested ibis (Nipponia nippon). Ambio 2015, 44, 803–814. [Google Scholar] [CrossRef] [Green Version]
  43. Sun, Y.; Skidmore, A.K.; Wang, T.; van Gils, H.A.M.J.; Wang, Q.; Qing, B.; Ding, C. Reduced dependence of crested ibis on winter-flooded rice fields: Implications for their conservation. PLoS ONE 2014, 9, e98690. [Google Scholar] [CrossRef] [PubMed] [Green Version]
  44. Li, X.; Li, B.; Wang, G.; Zhan, X.; Holyoak, M. Deeply digging the interaction effect in multiple linear regressions using a fractional-power interaction term. MethodsX 2020, 7, 101067. [Google Scholar] [CrossRef] [PubMed]
  45. Albert, C.H.; Yoccoz, N.G.; Edwards, T.C., Jr.; Graham, C.H.; Zimmermann, N.E.; Thuiller, W. Sampling in ecology and evolution—Bridging the gap between theory and practice. Ecography 2010, 33, 1028–1037. [Google Scholar] [CrossRef] [Green Version]
  46. Jones, C.G.; Heck, W.; Lewis, R.E.; Mungroo, Y.; Slade, G.; Cade, T. The restoration of the Mauritius kestrel falco-punctatus population. Ibis 1995, 137, S173–S180. [Google Scholar] [CrossRef]
  47. Finkelstein, M.E.; Doak, D.F.; George, D.; Burnett, J.; Brandt, J.; Church, M.; Grantham, J.; Smith, D.R. Lead poisoning and the deceptive recovery of the critically endangered California condor. Proc. Natl. Acad. Sci. USA 2012, 109, 11449–11454. [Google Scholar] [CrossRef]
Figure 1. The spatial distribution of crested ibis nest sites in 2019 (red triangles). The upper right panel shows the elevation of the study area, ranging from 400 to 1800 m. In the bottom panel, the polygons in grey colors are watersheds; the green areas represent rice paddies; the blue areas represent water bodies (rivers, lakes, and ponds); and the brown areas are human residences.
Land 11 01817 g001
Figure 2. Number of nests of the crested ibis from 1981 to 2019 in its whole habitat (upper panel) and in the nine most occupied watersheds (lower panel).
Land 11 01817 g002
Figure 3. Contribution (proportion of explained variance) of variables/terms in the multiple regressions fitting the number of nests in the watersheds from 1993 to 2019.
Land 11 01817 g003
Figure 4. Predicted probability of presence of nests in every 1 km2 quadrat (left panel) and predicted number of nests in every watershed based on the nest data in 2019 using the random forest algorithm (right panel). The probability of presence was summed in every watershed to represent number of nests. The red triangles are nest sites. The polygons in grey colors are watersheds; the green areas represent rice paddies; the blue areas represent water bodies (rivers, lakes, and ponds); and the brown areas are human residences.
Land 11 01817 g004
Table 1. Variable parameters and data sources used in the nest site selection analysis of crested ibis.
Variables Measured within Each WatershedParametersUnitSource
MeanMinimumMaximumSD
Area154.1132.65474.6699.59square km(Rabus et al. 2003) [29]
Mean elevation1018.32508.431891.37394.91m(Rabus et al. 2003) [29]
SD of elevation243.4828.84601.06121.95m(Rabus et al. 2003) [29]
Area of rice paddies1.670.0012.952.31square km(Chinese Academy of Surveying and Mapping 2004) [36]
Area of water bodies0.120.001.030.19square km(Chinese Academy of Surveying and Mapping 2004) [36]
Population density in 2000190.363.931387.31234.86person per
square km
(Data Center for Resources and Environmental Sciences 2006b) [32]
GDP in 200045.340.69453.2378.751000 RMB
per capita
(Data Center for Resources and Environmental Sciences 2006a) [31]
Human footprint index25.0414.6247.626.67/(Sanderson et al. 2002) [33]
Annual mean temperature from 1971 to 200012.377.6114.781.98degree Celsius(China Meteorological Administration 2012) [34]
Annual total precipitation from 1971 to 2000878.44803.361049.8854.57mm(China Meteorological Administration 2012) [34]
Table 2. The most important variables and terms in negative binomial regressions and multiple regression that fit number of nests in watersheds by environmental variables.
Negative Binomial RegressionsMultiple Regression
Variable/TermProportion of Deviance
(Mean Value) *
Significance
in 27 Years **
Variable/TermR Square (Mean Value)Significance in 27 Years **
Elevation0.06419Elevation0.03326
Elevation:Population0.5385Elevation:Rice_paddy0.05827
ElevSD0.12224ElevSD20.02626
Elevation20.14418Population0.0219
Population20.05019Rice_paddy0.03324
Rice_paddy0.06124Rice_paddy:ElevSD0.04425
Rice_paddy:Wter_body0.34010Rice_paddy:Waer_body0.19827
Water_body0.16924Water_body0.03821
Water_body:ElevSD0.04221
* The proportion of deviance decreased when the variable/term was added to the model. Mean values are the values for models for years from 1993 to 2019. ** The number of times the variable/term was significant among the 27 models for years from 1993 to 2019.
Table 3. The number of cases that the distance between every two nests is less than a series of thresholds indicating the number of neighboring nests in each year.
YearNo. of NestsNo. of Distance <10,000 mNo. of Distance <1000 mNo. of Distance <100 mNo. of Distance <10 mNo. of Distance <1 m
1993320000
19946141100
19957212100
19966100000
199711442000
199811542000
19991814714100
20002011713300
20013022019300
2002311538200
20034231222300
20046272160600
20057895677710
20061051655114210
20071061510861390
2008118173680500
2009112176578300
2010128237379000
2011129217861110
2012153279661110
2013177358878320
20141893902100520
201522047591371140
2016286699219135141
2017368969527153261
201840514,11554375402
201951126,1941019162582
Table 4. The observed number of nests in each watershed, predicted number of nests and adjusted number of nests using occurrence-based method and watershed-based method, respectively.
WatershedNo. Nests in 2019Predicted_Point *Predicted_Polygon **Adjusted_Point *Adjusted_Polygon **
745126196.576.053.091.8
75881188.167.050.781.0
72343154.437.641.645.5
7303870.120.918.925.2
7623497.927.926.433.7
71731119.024.232.129.2
6373037.727.810.233.6
7342044.114.711.917.8
8051683.911.122.613.5
8841595.917.725.821.4
7591069.215.318.718.4
792841.76.011.27.2
821668.97.118.68.6
690551.93.714.04.5
777522.114.36.017.3
772435.34.79.55.7
846426.75.57.26.7
906430.67.78.39.3
727351.32.913.83.5
801320.77.65.69.2
823349.24.213.35.1
692212.01.13.31.3
779218.63.45.04.1
813219.63.55.34.2
62917.71.22.11.4
663116.61.14.51.4
74816.91.41.91.7
761147.52.312.82.8
763111.64.03.14.8
808131.72.08.52.4
825114.74.24.05.0
883144.22.411.92.9
770017.75.84.87.0
80707.35.42.06.5
63507.84.62.15.6
77400.13.90.04.8
83909.23.72.54.5
876011.83.43.24.1
Total5032144499578602
* Predicted and adjusted number of nests in each watershed using the occurrence-based method.** Predicted and adjusted number of nests in each watershed using the watershed-based method.
Publisher’s Note: MDPI stays neutral with regard to jurisdictional claims in published maps and institutional affiliations.

