Article

Comparative Evaluation of Mountain Landscapes in Beijing Based on Social Media Data

School of Landscape Architecture, Beijing Forestry University, Beijing 100083, China
*
Author to whom correspondence should be addressed.
Land 2022, 11(10), 1841; https://doi.org/10.3390/land11101841
Submission received: 13 September 2022 / Revised: 18 October 2022 / Accepted: 18 October 2022 / Published: 19 October 2022
(This article belongs to the Special Issue Landscape Governance in the Age of Social Media)

Abstract

:
An important part of Beijing’s ecological pattern, mountain landscapes are also the most important natural tourist destinations in Beijing. The unique mountain environment in Taihang and Yan Mountains attracts Beijing and foreign tourists alike. Tourists publish travel photos and comments on social media, which provides a new opportunity for a systematic evaluation of these mountain parks based on social media data. To fully understand the developmental status of mountain landscapes in Beijing, this paper comparatively evaluates 45 mountain landscapes in Beijing based on social media data. Using big data capture, semantic network analysis, importance-performance analysis (IPA), etc., it explores the composition of tourist groups in mountain parks, the preferences of the tourist groups, and the relationships between park tourists and different influencing factors, and evaluates the recreational experiences of tourist groups. The development of recreational activities was found to be more important to local tourists than scenic sites for foreign tourists. According to gender differences, women were more interested in recreational experiences than men, while men were more interested in the park’s landscapes. According to the IPA, tourists were satisfied with the overall recreation offered by mountain landscapes. The perceptual experience was dominated by visual perception, followed by smell; touch, hearing, and taste were of minor importance. Using social media data to analyze mountain landscape resources in Beijing can provide useful insights into the advantages of these landscapes under a variety of site conditions, strengthen local mountain resource development and tourism publicity, integrate tourism management and planning resources in a targeted and attractive manner, and enhance ecological leisure services.

1. Introduction

The construction of urban forests is an important measure for adapting to China’s national conditions and developmental stage, promoting urban and rural ecological construction, and enhancing residents’ ecological welfare. Beijing, as the capital city, is responsible for the construction of the ecological civilization. In 2020, Beijing formulated the Beijing Forest City Development Strategy (2018–2035). As an important mountain resource in Beijing, Taihang-Yan Mountain also plays an important role in the forest city development strategy. The forest city refers to an urban area in which buildings such as offices, houses, hotels, hospitals, and schools are almost entirely covered by plants and trees of different kinds and sizes for protecting the urban ecological environment. In the overall construction of the forest city, the vision of building a healthy mountain forest has been put forward. The Beijing Mountain area is an important water conservation area and ecological barrier in the capital, and it is the main ecological recreation area. By developing and using mountain resources, it is the goal of forest city construction to build an ecological development demonstration area that is suitable for living, industry, and tourism, as well as a model area that displays Beijing’s history, culture, and beautiful natural landscape.
Mountain tourism is an important part of contemporary tourism. Because of their biodiversity, rich environmental resources, and rich history and culture, mountain landscapes can satisfy people’s desire to be close to nature and pursue health, so mountain tourism is playing an increasingly important role in global tourism patterns [1]. The development and use of a mountain landscape are of great significance in the construction of a forest city, so it is necessary to pay more attention to and study them. Research and analysis of mountain landscape resources play an important role in urban development. Mountain landscape tourism resources are important for attracting tourists, and the richness of the landscapes is an important factor in developing them [2]. From the perspective of tourism, many studies focus on factors related to tourist identity, such as gender, age, mode of travel, and so on. However, further empirical research is required to explore how the factors related to tourists themselves influence broader tourism decisions and results. Therefore, studying what landscapes tourists prefer in mountain parks is of great significance in promoting ecological service function and developing mountain tourism.
As per Cavagnaro et al., modern tourists show a strong interest in topics related to natural resources and like to visit destinations with important natural resources for recreational activities [3,4,5,6,7,8]. Giachino [9] and others found that modern tourists show seasonal differences in their choices of natural tourist destinations. Selecting a holiday destination is heavily influenced by the image of tourist destinations. The tourist destination image (TDI) consists primarily of impressions (45%), perceptions (27%), beliefs (18%), ideas (18%), and representations (15%). In scientific doctrine, one of the most commonly cited definitions of image is something that can be described as the sum of a person’s beliefs, ideas, and impressions of a particular location [10].
Tieskens et al. [11] proved that the analysis of elements of mountain cultural landscapes has a high research value in the exploration of tourists’ preference for mountain landscapes. Studies have also shown that analyzing modern tourists’ visiting behaviors can promote sustainable mountain tourism development, and their participation is considered necessary for sustaining and improving natural tourism. At the same time, tourists themselves show an important impact on environmental sustainability [12]. Therefore, to promote the sustainable development of tourist destinations, it is of great significance to study the natural and cultural landscape preferences of modern tourists in such destinations. Tourists’ preferred activities also differ with age [13], gender [14], mode of transportation [15], and travel mode [16]. However, it remains to be studied in detail whether modern tourists’ preferences for natural and cultural landscapes of mountain parks differ due to these factors. Therefore, it is necessary to study the differences in modern tourists’ preferences for mountain landscapes when using different travel modes.
The arrival of the era of big data has also provided a new opportunity for the evaluation of mountain park landscapes. In recent years, taking users as the research object, research using big data basically focused on four aspects: mobile phone signaling data, satellite positioning, social media data, and photo analysis with geographical location information [17,18]. The development of modern information technology, especially the popular Internet technologies, such as social media, as a platform for the public to obtain information and publish opinions, has a large number of valuable comments on people, events, products, etc. [19], making it an important source of data that can help evaluate personal emotions, perceptions, opinions, and interests [20]. A large amount of content for evaluation is posted on social media; this data enables textual analysis and sentiment analysis and allows one to study people’s preferences for places [21,22,23]. The research usually uses high-frequency words and semantic network analysis methods to measure and predict users’ preferences, such as the travel preferences of outbound Chinese tourists [24], the differences in mental models between tourism marketers and travelers [25], the image perception of specific places [26], and even the services of hotels and other service facilities [27]. One can combine photos with geographical location information with the characteristics of places to effectively predict the number of visits to places and infer people’s habits and preferences to help in urban planning and ecological construction [28,29,30,31,32,33]. The widely used importance-performance analysis (IPA) method was first put forward in 1977 when it was used to analyze product attributes [34]. This method, as a diagnostic model biased toward qualitative research, can help managers identify noteworthy resources and services and provide guidance for landscape planning and construction. Because of its simplicity, intuition, easy operation, and easy interpretation, it has been widely used in landscape architecture in recent years to study the demand characteristics of park visitors [35], recreation situations [36,37], the supply-demand relationship of the cultural ecosystem [38], and so on.
In short, mountain landscapes play an important role in the construction of Beijing’s forest city, the promotion of the functions of ecological services, and the development of related tourism resources; social media data are used to understand the landscape preferences of modern tourists in mountain tourism, identify the differences in landscape evaluations by crowds with different characteristics, and evaluate recreational experiences. The aim of this research is to investigate the demographic characteristics and landscape preferences of tourists visiting the 45 mountain landscapes in Beijing by classifying photos based on the associated text uploaded by users to social media. Through an in-depth semantic network analysis of social media comments published by users, the relationships between the evaluations of the mountain landscapes in Beijing and the demographic characteristics and geographical locations of the users will be identified. In addition, the differences in tourists’ landscape evaluations based on the different genders and regions will be explored. The landscape characteristics of different mountain systems and 10 administrative divisions are also compared. Finally, through an IPA, tourists’ satisfaction in terms of (1) recreation provided by the mountain landscapes in Beijing and (2) experiencing these landscapes via the five senses will be analyzed. This study will provide a theoretical basis for the key points and developmental directions of the construction and improvement of mountain landscapes, leading not only to a new research area but also helping policymakers and tourism managers improve the attractiveness of regional tourism. The Taihang-Yan Mountain area of Beijing is of great significance for the sustainable development of mountain landscape resources.

2. Research Method

Using big data to study tourists’ behavior is beneficial for the planning and management of tourist attractions, especially in the field of landscape architecture. In this study, we selected Dianping (https://www.dianping.com, accessed on 10 June 2022), Trip.com Group (https://www.ctrip.com, accessed on 10 June 2022), and Mafengwo (https://www.mafengwo.cn, accessed on 10 June 2022), all of which are the mainstream social media websites for tourism in China. Social media data were used instead of traditional research methods for the following reasons: (1) Social media data can reduce the restrictions related to insufficient sample size, time, place, and self-reporting errors. (2) The photos provided by users record the local environment and experience, which is more authentic. (3) Social media are an important medium for modern tourists to publish and receive tourism information, and the content has important research significance and value. This research is based on the quantitative analysis of photos and evaluation of texts published by tourists on social media. Content analysis is a digital research method for objectively, systematically, and quantitatively analyzing the contents of texts. People upload photos that they like or are interested in on social platforms. Therefore, the contents of the photos were coded and analyzed according to landscape features, and the specific landscape elements that attracted tourists were studied by comparing the frequency of each element. The relationships between various landscape elements and preferences of crowds with different characteristics were analyzed. At the same time, keyword extraction, emotional and semantic network analysis, and IPA were performed on the comments published by tourists on social platforms; then, the differences in landscape evaluations under different factors were explored.

2.1. Research Object

In all, 45 representative mountain landscapes in Beijing were selected as the research objects (Table 1, Figure 1). Generally, in Beijing, the mountains are clear and dangerous, and the terrain rises in steps, forming several levels of viewing platforms. Geological structure and lithology differ greatly, and the landforms are diverse and colorful. The higher the altitude of a scenic mountain, the more natural the scenery is; the lower the altitude, the more anthropic the scenery is. Religious temples are found on most of the tops or foothills of the cultural landscape mountains, indicating that religious culture has a profound influence on the mountains in the suburbs of Beijing. As well as being favored by residents, the temples are also revered by the royal family, illustrating the nexus between religion and politics. Beijing’s two mountain spaces, Xishan and Beishan, have significantly different associations with the scenery. A large number of scenic mountains are mostly associated with the content of the Great Wall in Beishan, Beijing, forming a natural cultural landscape similar to the Great Wall. The West Mountains in Xishan are devoid of Great Wall cultural landscapes, with the exception of the enemy towers along the River City.

2.2. Data Collection and Statistics

The data collected in this paper are from 45 representative mountain landscapes in Beijing (visited on 10 June 2022) that were manually searched on the website of the Beijing Municipal Bureau of Landscaping and Greening. They included national-level scenic spots and representative tourist destinations of Grade 3A or above. From high to low, China’s tourist attractions are classified into five levels, from AAAAA (the highest level) to A (the lowest). After AAAAA and AAAA, AAA (3A) is the third highest level of quality for tourist attractions. In addition, web crawler tools were utilized on Dianping, Trip.com Group, and Mafengwo to crawl for information on the evaluation of the 45 mountain landscapes and photos of the 45 selected mountain landscapes released by tourists. By analyzing users’ evaluative social media texts and uploaded and shared travel photos, tourists’ demand for recreational activities and their landscape preferences can be understood. From the perspective of data content screening, first, the comments adopted were those published by tourists without any commercial activities, and the language that expressed their feelings and emotions was used as the criterion. As mentioned above, tourists’ travel preferences were influenced by gender, mode of transportation, travel mode, and landscape preferences. Therefore, we also collected information about users’ gender, transportation mode, and travel mode. Finally, we eliminated comments with prominent advertising information and copyright marks. The sample period was from January 2021 to June 2022. There were 37,572 photos of the 45 mountain landscapes, totaling more than 2.82 million words. Most of the crawled comments were made between January 2021 and June 2022.

2.2.1. Data Collection and Preprocessing

The automatically crawled social media data contains a significant amount of noise, so it is necessary to remove the noise data from the text data. To begin with, news information, advertising information, and explanatory texts published by public accounts were removed, and only original content published by individuals was retained. Among the photos posted by users, some photos were primarily based on pictures, and the text description was often too short (for example, only the names and locations of mountain attractions were included); at the same time, there was also content that mentioned mountain attractions; however, the actual description content or evaluation did not follow. A comment that had little relevance to mountain attractions was discarded, as these data were deemed invalid and must be removed. Thus, 20 images were randomly selected from the reserved text for manual verification and removal of invalid information. When the data is invalid, the above operations will be repeated until a valid image with comment data is selected. A total of 31,367 valid images were obtained from 13,990 users, along with 1,631,972 characters.
In terms of data processing, the user information published by social media websites and the keywords in social media comments published by users were extracted, the demographic characteristics of the image users were determined, and the following types of user information were summarized: gender (male and female), mode of transportation (walking; using the subway, a taxi, or a bus; and using a self-driven mode of transport), and travel mode (lone travelers, friends and classmates, families, and couples). Accordingly, the tourism behavior of users was quantitatively analyzed.

2.2.2. Image Recognition and Statistics

On the basis of China’s national standard of “Classification, Investigation, and Evaluation of Tourism Resources” (GB/T18972-2017), we divided landscape resources into eight types: physiographic landscape, water landscape, biological landscape, astronomical and climatic landscape, buildings and facilities, historical sites, tourist purchases, and cultural activities (Table 2). On this basis, we quantitatively analyzed 31,367 tourist photos and calculated the frequency of each landscape resource type (Figure 2).

2.2.3. Text Analysis

A total of 45 representative mountain scenery spots in Beijing were analyzed based on their average star ratings. In order to highlight the differences between different mountain landscapes, the study utilized the tools of “word frequency analysis” and “social network and semantic network analysis” in ROSTCM6 developed by Wuhan University in order to quantify image data in order to generate a collinear network diagram of keywords in tourists’ comments on parks and scenic spots, further exploring the core factors that affect mountain landscape evaluations. Using a network diagram, the core elements and deep reasons that affected the evaluation of the mountain landscapes were explored further and the correlation between each element and the evaluation was explored using SPSS tools.

2.2.4. IPA Model Building

To further explore the present situation, problems, and development directions of mountain landscapes in Beijing, the importance-performance analysis (IPA) method was used to analyze tourists’ satisfaction and experience in terms of the five senses. IPA, which was proposed by Martilla and James, is used to compare customers’ expectations before consumption with their perceived achievements after consumption, and to comprehensively evaluate the performance of each attribute [39]. Since the early 1990s, IPA has been widely used in service industries [40], including service satisfaction evaluations [41], regional attraction analysis [42], tourism policy formulation [43], and scenic spot satisfaction evaluations [44]. In the satisfaction survey, the IPA method requires respondents to evaluate the indicators of the designated survey object in terms of importance and satisfaction in order to form the IPA matrix (Figure 3). The IPA matrix takes tourists’ expectations (importance) as the horizontal axis, tourists’ satisfaction (performance) as the vertical axis, and the total average as the separation point of the X-Y axis. The space is divided into four quadrants, and the meanings of each quadrant are as follows: the first quadrant is the area of advantage retention, the second quadrant is the area that can be maintained without too much improvement, the third quadrant is the slow improvement area, and the fourth quadrant is the area that needs to be improved. The recreational elements in the related literature on the evaluation of mountain landscape recreation were summed up, the words featured with a high frequency in the evaluation texts were extracted and evaluated, the specific elements worthy of attention in mountain landscapes were integrated, tourists’ recreational satisfaction and evaluation factors in terms of the five senses were determined, a vocabulary of recreational satisfaction and elements related to the experience of the five senses was generated (Table 3 and Table 4), and each index for each element in the obtained textual data was identified and counted as the result of the importance of each element index in the IPA. The text was classified by emotion, and the frequency of each factor index in positive comments was used as the result for satisfaction. Using the IPA method, based on the results of the textual analysis of social media data, this paper evaluated the satisfaction provided by the mountain landscape in terms of recreation and the experience of the landscape via the five senses and further explored the future direction of development of the mountain landscape.

3. Research Results and Analysis

3.1. Demographic Analysis of Tourist Groups

Among the 13,990 users who submitted reviews, there were 2882 men (32.4%) and 6014 women (67.6%). It was not possible to distinguish the gender of the remaining users by using public data. It can be seen that women were keener to share their travel experiences on social media.
From the point of view of the mode of transportation, among the review users, 3485 (94.2%) were self-driving tourists, accounting for far more than walking tourists (16, or 0.4%), subway tourists (62, or 1.7%), bus tourists (115, or 3.1%), and taxi tourists (23, 0.6%). Most tourists chose to travel by car, which is probably related to the unique geographical location and landscape characteristics of the mountains. Self-driving is more convenient for reaching the destination and enjoying the beautiful natural scenery along the route.
From the perspective of travel patterns, among the review users, 56.3% chose to travel with their families and only 1.8% chose to travel with their partners. See Table 5 for a statistical analysis of the tourist groups.

3.2. Analysis of the Landscape Preferences of Tourist Groups

3.2.1. Overall Analysis of Tourists’ Landscape Preference

Based on the classification of landscape resources summarized in Table 2, 31,367 tourist photos were analyzed quantitatively for landscape elements. Tourists’ landscape preferences were determined according to the following order: physiographic landscape (9807, or 31.4%) > buildings and facilities (9000, or 28.8%) > biological landscape (5377, or 17.2%) > water landscape (4090, or 13.1%) > historical sites (1030, or 3.4%) > astronomical and climate landscapes (885, or 2.9%) > cultural activities (781, or 2.6%) > tourism purchases (162, or 0.6%).

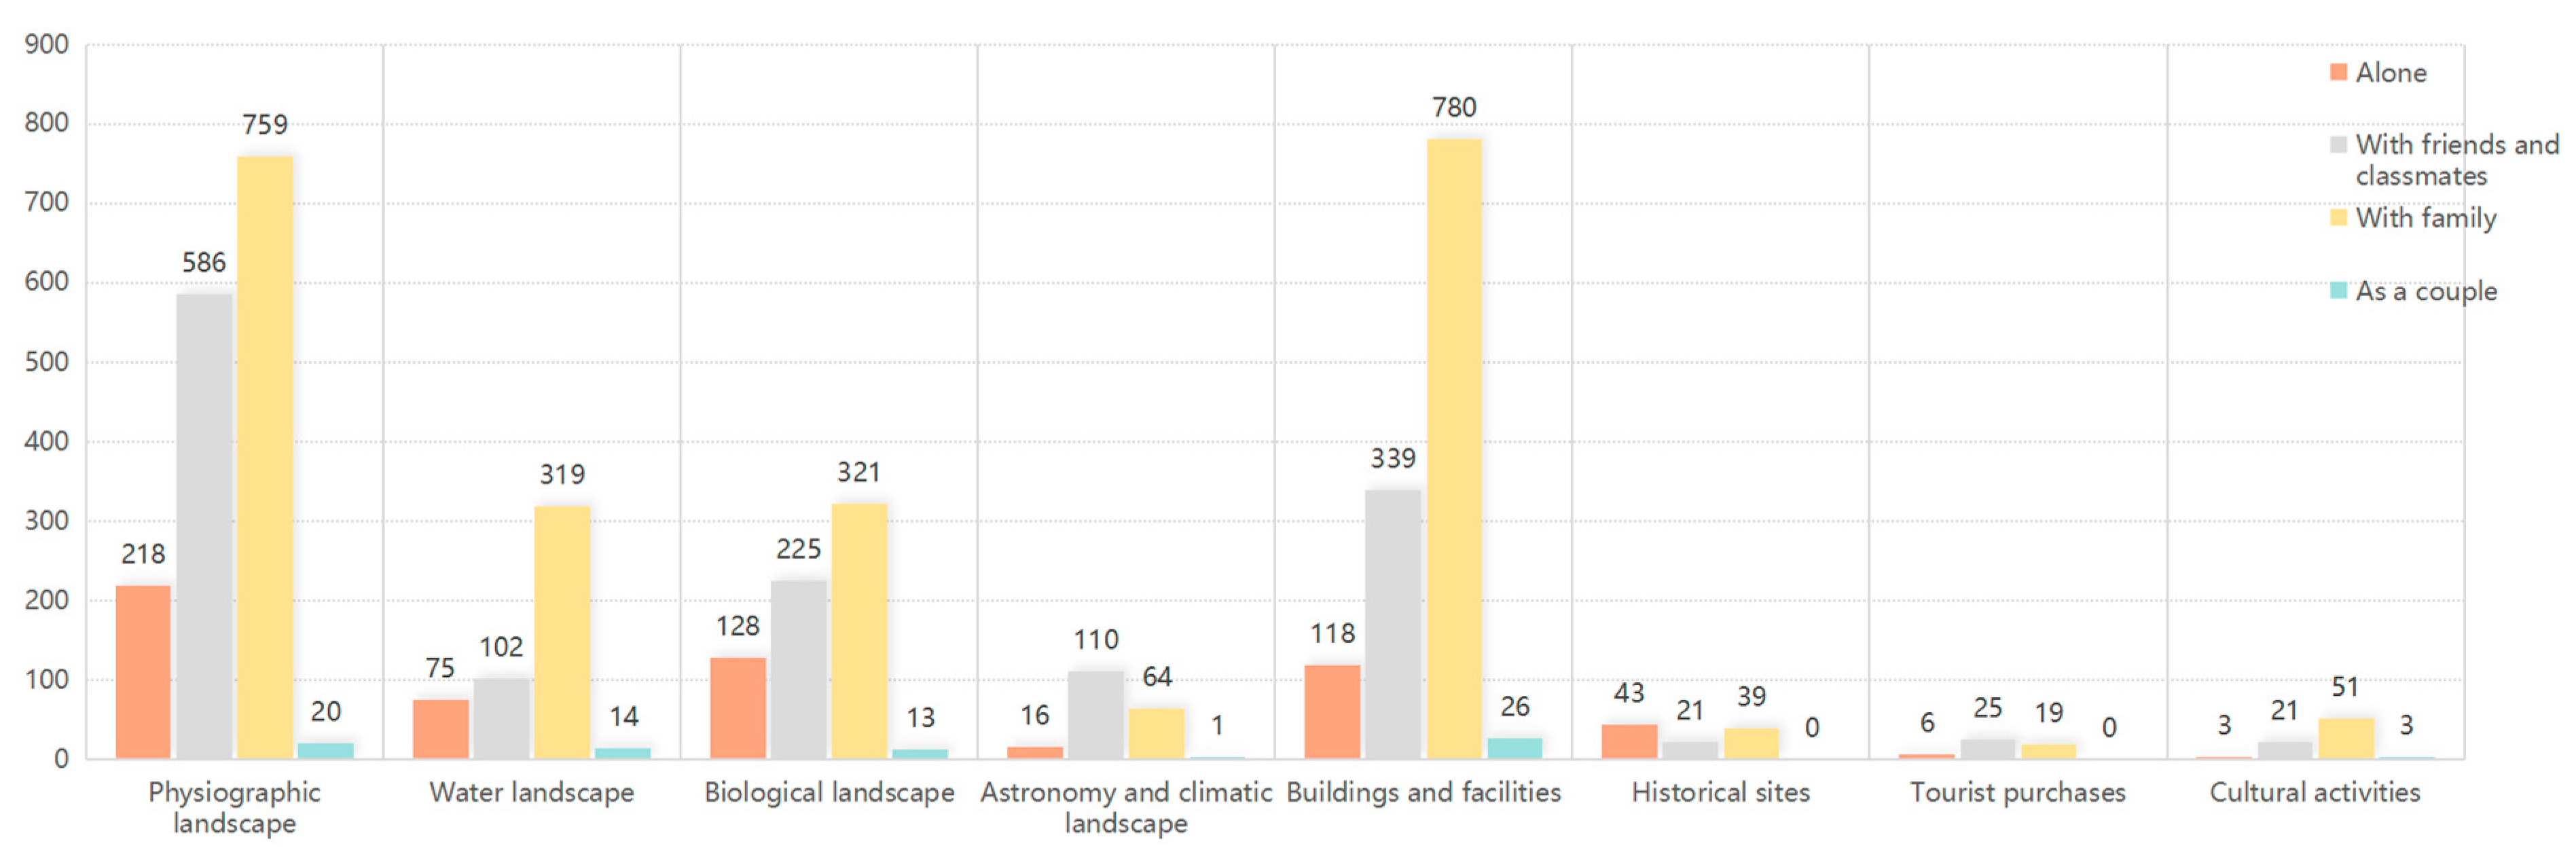
3.2.2. Analysis of Landscape Preferences Based on Crowds with Different Characteristics

According to the differences in the gender, transportation mode, and travel mode of the tourists, the landscape preferences of the different groups were statistically analyzed. As far as gender is concerned (Figure 4), men and women tended to prefer the same types of landscapes, and they all showed an obvious preference for landscapes, architecture, and facilities, which is probably because mountain landscapes are dominated by natural landscapes, such as valleys and gullies, and tourists mainly go to scenic mountain spots for sightseeing, so the photos taken are mainly of buildings and places for sightseeing in the landscape. Table 6 presents an analysis of the images shared by people of different genders; men preferred physiographic landscapes, followed by biological landscapes and buildings and facilities, while women preferred water landscapes, followed by astronomical and climatic landscapes and cultural activities. From the perspective of humanistic activities, compared to men, women showed a greater preference for recording their personal activities during travel.
Figure 5 shows the differences in tourists’ landscape preferences when using different modes of transportation. Irrespective of the mode of transportation, tourists preferred physiographic landscapes, buildings and facilities, biological landscapes, and water landscapes. However, this choice was more obvious when using a self-driven vehicle. Figure 6 shows the differences in tourists’ landscape preferences according to their different modes of travel. Tourists who traveled with their families and partners preferred buildings and facilities, followed by physiographic landscapes, and the degrees of interest were similar between biological landscapes and water landscapes. Tourists who traveled alone or with friends and classmates were more interested in landscapes than in buildings and facilities, and their interest in biological landscapes was also greater than their interest in water landscapes. With regard to the different types of landscape resources, there were certain differences in tourists’ travel patterns. As can be seen in Figure 7, tourists who traveled with friends and classmates preferred astronomical and climatic landscapes and tourism purchases.

3.3. Landscape Evaluation and Analysis of Tourist Groups

To further understand tourists’ preferences for recreation types and feelings regarding Beijing’s mountain landscapes, word segmentation and word frequency analysis were performed by using ROSTCM6 to evaluate the texts of the review users, and the 30 words related to recreation and emotional experience with the highest frequency were extracted (Figure 8). By and large, tourists tended to show seven recreational behaviors related to mountain landscapes: climbing, rafting, hiking, fitness, camping, picnicking, and sightseeing. Moreover, their emotional experiences were dominated by positive words, such as “suitable”, “convenient”, “characteristic”, and “beautiful”, all of which show a positive attitude. It can be seen that tourists loved the overall landscapes and environments of the mountains. The authors of this study extracted the texts of positive reviews by users for semantic network analysis and generated a positive semantic network diagram (Figure 9). The texts of negative user evaluations were also extracted for semantic network analysis, and a negative semantic network diagram was generated (Figure 10). The nodes represent high-frequency vocabulary elements, and the density of connections between elements represents the co-occurrence frequency. The factors of positive evaluations of the mountain landscape were mainly reflected in the beautiful scenery, suitability for outings, traffic accessibility, recreational facilities, and parent-child experiences. The negative factors of the evaluations were mainly reflected in tickets, transportation, infrastructure, and park management services. Although the overall evaluation of the mountain landscape is high, it does not necessarily imply that the parks are well-managed. The management of a forest park involves many complex aspects that are not readily apparent to the public. Negative feedback recorded on social media indicates that tickets, transportation, infrastructure, and park management services may not need to be improved, rather, the meaning implies that the management mode may need to be reviewed.

3.3.1. Differences in Mountain Landscape Evaluations by Groups with Different Characteristics

The semantic network analysis of the evaluative texts of local and foreign tourists showed (Figure 11 and Figure 12) that the main mountain landscape elements that local and foreign tourists focused on were different. In the user sample, users with undisclosed regional information were excluded. In all, 10,869 local tourists and 1042 foreign tourists were included. Local tourists paid more attention to mountain climbing and recreational experiences, transportation time, infrastructure, fare collection, and parent-child activities. The focus of foreign tourists was mainly on the degree of fame of scenic spots, scenery, scenic environment, consumption cost, and traffic time. It can be seen that local tourists paid more attention to the development of recreational activities, while foreign tourists preferred to register their arrival at the scenic spots.
According to the semantic network analysis of textual data from people of different genders (Figure 13 and Figure 14), male users mainly focused on mountain climbing, infrastructure, and traffic accessibility, and female users paid more attention to the scenic quality, scenic environment, convenient transportation, recreational activities, parent-child experiences, and infrastructure. It can be seen that women paid more attention to recreational experiences than men did.

3.3.2. Differences in Mountain Landscape Evaluations in Different Geographical Locations

Among the 10 administrative districts in which mountainous landscapes are distributed in Beijing, Haidian District had the highest comprehensive star rating, reaching 4.73 stars, followed by Fengtai District (4.7 stars), Yanqing District (4.65 stars), and Changping District (4.22 stars) (Table 7). The overall evaluation of the mountain landscape was high, which shows that the parks were well-managed and popular with tourists.
For further investigation, the factors that influenced the evaluations of mountainous landscapes—such as the population density, the number of permanent residents, the GDP of the administrative district, the GDP per capita of the administrative district, the average distance from the city center, and the average driving distance from the city center of the administrative district—in each scenic area were analyzed. The correlation analysis using the SPSS tool (Table 7 and Table 8) showed that there were no significant correlations between the evaluations of mountainous landscapes and any of these factors. In other words, visitors’ evaluations of mountainous landscapes were not related to these external factors, and the internal factors of a scenic area may be more important in influencing the evaluation of a landscape.
The semantic network analysis of the textual evaluations of the mountain landscapes in the Taihang Mountains and Yan Mountains showed that (Figure 15 and Figure 16) the main landscape elements that tourists in the different mountain ranges paid attention to were also different. The analysis showed that the Taihang Mountains mainly have national forest parks, while the Yan Mountains mainly include scenic spots. Tourists paid more attention to the experiences of mountain climbing and recreation in scenic spots when they enjoyed recreation in Taihang Mountains, while tourists visiting the Yan Mountains for recreational activities paid more attention to the traffic accessibility of scenic spots and the time spent in traffic to visit them. The scenic value of the water system landscape in the Yan Mountains was higher, and tourists preferred to go to mountain parks in the Yan Mountains for waterscape viewing and swimming experiences.
The semantic network analysis of the textual evaluations of the mountain landscapes in different administrative divisions showed (Figure 17, Figure 18 and Figure 19) that the mountain landscapes in the different divisions had their own characteristics but they also had similarities. Haidian District has Xishan National Forest Park, which has beautiful scenery, as its main tourist attraction. Shijingshan District’s mountain landscape is characterized by Badachu Park, offering rich recreational activities. Fangshan District and Miyun District have similar mountain landscape features, and both are dominated by a natural water system landscape; recreational activities there are characterized by ferrying. The mountain landscape of Fengtai District is mainly characterized by wildlife viewing. Huairou District, Pinggu District, and Yanqing District are rich in the historical sites of mountain landscapes, but they have different characteristics. The mountain landscape in Huairou District is steep and suitable for outdoor activities, such as bungee jumping. The mountain landscape in Pinggu District has a certain religious color. Yanqing District is rich in cave sites with a strong historical background. The Mentougou Mountain landscape is rich in natural scenery, but its characteristics are not obvious. Fangshan District, Miyun District, Fengtai District, Huairou District, and Shijingshan District are all suitable for parent-child activities.

3.4. IPA of Tourist Groups’ Recreational Experiences

3.4.1. Analysis of Satisfaction in Terms of Recreation

In a comprehensive IPA of tourists’ satisfaction in terms of recreation in mountain landscapes in Beijing (Table 9, Figure 20), most of the indicators were concentrated in the first and second quadrants, indicating that tourists’ overall satisfaction with the mountain landscapes was high. The mountain landscapes were shown to have greater advantages in terms of natural landscapes, plant landscapes, outdoor recreational activities, parent-child experiences, and emotional experiences, but public service facilities, traffic accessibility, ticket cost, and park management services needed to be improved.
The IPA (Table 10, Figure 21) of mountain landscapes in different mountain ranges showed that tourists were more satisfied with the overall recreation offered by the mountain landscapes in the Taihang Mountains than those offered by the Yan Mountains. Tourists loved the mountain landscapes in the Taihang Mountains in terms of plant landscapes and outdoor recreational activities, while the mountain landscapes in the Yan Mountains were more distinctive in terms of historical and cultural landscapes and leisure activities. In terms of traffic accessibility, public service facilities, ticket cost, and park management services, there was a need for further strengthening and improvement of the facilities. The plant landscapes and the outdoor recreational activities offered in the Yan Mountains had higher importance but a lower satisfaction rating than the average. Therefore, the mountain landscape in the Yan Mountains needs to be improved.

3.4.2. Analysis of the Experience of the Five Senses

A comprehensive IPA of the experiences of tourists in the mountain landscapes in Beijing in terms of the five senses (Table 11, Figure 22) showed that most of the indicators of the five senses were concentrated in the second and third quadrants, implying that tourists did not pay much attention to the overall sensory experience of the mountain landscapes, and the overall satisfaction of the tourists was high in terms of sight, smell, and touch, but low in terms of taste. Visual and olfactory landscape elements—such as visibility of plants, visibility of animals, landscape recognizability, and smell of air/water—in the first quadrant can continue to be developed; visual and taste elements—such as visibility of natural landscapes, visibility of roads, and food sales—in the fourth quadrant need to be improved and enhanced; and auditory and tactile landscape elements—such as the sounds of plants, sounds of animals, feel of sunlight, feel of water, and touch of the road—in the third quadrant need to be gradually improved.
For the landscapes of different mountain ranges, the IPA (Table 12, Figure 23) showed that, similarly to the conclusion regarding tourists’ satisfaction with recreation, tourists’ satisfaction with the mountain landscapes in terms of the five senses was higher for the Taihang Mountains than for the Yan Mountains. The Taihang Mountains were characterized by the visibility of plants, the visibility of animals, landscape recognizability, the smell of air/water, and other visual and olfactory landscape elements that were highly valued, while the tourists in the Yan Mountains attached more importance to the visibility of natural landscapes, landscape recognizability, the visibility of roads, smell of air/water, and the feel of temperature, as well as other visual, olfactory, and tactile landscape elements. That is, tourists in both mountain landscapes attached more importance to visual and olfactory sensory feelings. In terms of sensory elements in urgent need of key improvement, for the Taihang Mountains, more attention should be paid to improving the visibility of natural landscapes, the visibility of roads, and food sales, and for the Yan Mountains, more attention should be paid to the visibility of plants, the visibility of animals, and food sales. Thus, it is clear that both need to improve the sensory experiences of vision and taste.

4. Conclusions

This study investigated the demographic characteristics and landscape preferences of tourists visiting the mountain landscapes in Beijing by classifying photos based on the associated text uploaded by users to social media. In this study, more tourists in mountain landscapes chose a self-driving mode of transportation, which was closely related to the geographical locations of the mountains in the urban countryside. In terms of travel mode, they preferred to travel with friends, classmates, or family members. Regarding landscape preferences, geographical landscapes, buildings, and facilities were the most preferred, followed by biological landscapes and water landscapes; the interest in tourist purchases was the lowest. Tourists’ landscape preferences were related to their gender, transportation mode, and travel mode. Men’s perception of landscapes was more direct, and they were more inclined toward geographical landscapes and biological landscapes, while women were more emotional, preferring to record the beautiful scenery and personal activities during the trip. The influence of different transportation modes on landscape preferences is not obvious, and the difference is small. Tourists who traveled with friends and classmates preferred astronomical phenomena, climatic landscapes, and tourist shopping. Compared to other sources, the three sources selected in this paper are more representative and provide more images with evaluative significance. The images presented in guides and blogs tend to be more illustrative. For the purpose of studying tourist destination imagery, prescriptive, evaluative, and normative components are valuable conceptualizations. The present study employs both quantitative and qualitative methods of analysis in a quasi-empirical manner. Using this hybrid approach, factual results based on sample data can be developed alongside interpretive results intended to enhance conceptual understanding. As a result of this study, important scientific and practical implications are generated in terms of theoretical frameworks, techniques, and insights, providing a theoretical basis for the key points and developmental directions of the construction and improvement of mountain landscapes.
In this research and analysis of tourists’ evaluative texts, tourists’ recreational behaviors in mountain landscapes were focused on seven aspects: climbing, rafting, hiking, fitness, camping, picnics, and sightseeing. There were some differences between the positive and negative factors in the overall evaluation of mountain parks in Beijing. The positive evaluation factors of mountain landscapes were mainly focused on the environment, traffic accessibility, recreational facilities, and parent-child experiences, while the negative factors were mainly reflected in tickets, traffic, infrastructure, and park management services. Therefore, in the construction of mountain landscapes, it is necessary to moderately reduce consumption costs, adjust traffic planning, and improve accessibility, infrastructure construction, and the park management and service level.
Local tourists were found to pay more attention to the development of recreational activities, while foreign tourists preferred to visit scenic spots. In terms of gender differences, women paid more attention to recreational experiences than men, while male tourists paid more attention to the park landscapes themselves. Different mountain ranges and administrative divisions of mountain parks affected tourists’ landscape evaluations, and the characteristics of mountain landscapes in different geographical locations could also be reflected through the analysis of the evaluative texts.
An IPA of how satisfied tourists were with the recreation offered by the mountain landscapes and their experiences of the landscapes via the five senses was conducted. The results showed that tourists were satisfied with the overall recreation offered by the mountain landscapes. Mountain landscapes offer natural landscapes, plant landscapes, outdoor recreational activities, and parent-child activities, which can be satisfying in terms of tourists’ emotional experiences. However, there is an urgent need to improve and upgrade public service facilities, transport accessibility, ticket costs, and park management services. It is necessary to improve park infrastructure construction, optimize the road transport system, improve accessibility, reduce consumption costs, develop management methods, and upgrade park management services. However, in terms of the five senses, tourists did not pay much attention to the overall sensory experience of mountain landscapes. Compared with other aspects, vision played a dominant role in the perceptual experience, followed by smell; the perceptions of touch, hearing, and taste were low. Therefore, more attention should be paid to the creation of the sense of a landscape in the construction of scenic spots.
A comparative evaluation of Beijing’s mountain landscapes based on social media data can provide comprehensive information on the advantages of mountain landscapes, thus promoting their development and the construction of a forest city. Accommodation facilities, however, remain an important tourist resource that should be considered. An analysis of tourists’ landscape preferences can help the government and managers of scenic spots manage, plan, and promote tourism in a more targeted manner. The analysis of tourists’ evaluations can help managers grasp the current situation, advantages, and disadvantages of scenic spots and decide quickly and intuitively on a developmental direction. These data are of great significance for the planning, design, construction, development, and management of different mountain landscapes and can help the government and managers analyze the advantages of local landscape resources, make up for the shortcomings, improve the service level, and environmentally improve the park and landscape quality according to the aesthetic preferences of different tourist groups, making Beijing’s mountain landscapes more attractive for sightseeing and enhancing their competitive advantage in the future.
As this research environment is unique, some limitations must be acknowledged. The theoretical and methodological frameworks adopted are useful for conceptualizing specific phenomena within specific cultural contexts (e.g., Chinese information sources). Nevertheless, scholars should exercise caution when extrapolating these findings to other populations. It may be necessary to repeat this experiment with other sources or methods in order to determine more predictable results. It is also recommended to more deeply examine the pattern of target images and the meaning of the images. Researchers can, for example, examine in greater depth the prescribed dimensions of destination imagery for short-haul tourists.
As a result of the nuances of this study and the cases of tourists from various countries visiting Chinese destinations, future research can take several directions. It will be interesting to identify the challenges that local tourism marketers may encounter in gaining access to the information sources preferred by tourists in China and abroad. It is also possible to disseminate the marketing strategies of tourist attractions through various channels, such as official websites, social media, and other promotional channels. Future research on the tourism image of Beijing, China can therefore refer to other news and online platforms at home and abroad to gain a more comprehensive understanding of the produced image. As a final point, it is necessary to clarify how previous experiences at these tourist attractions affect tourists’ use of destination images and information sources.

Author Contributions

Conceptualization, T.D.; methodology, T.D.; software, T.D.; validation, W.S., Y.W. and R.Y.; formal analysis, T.D.; investigation, T.D.; writing—original draft preparation, T.D.; writing—review and editing, X.G.; visualization, T.D.; supervision, X.G.; project administration, X.G.; funding acquisition, X.G. All authors have read and agreed to the published version of the manuscript.

Funding

This research was funded by the projects of the National Natural Science Foundation of China, (grant number: 31800606), Beijing Municipal Social Science Foundation of China (grant number: 21JCC094), and Beijing Scientific Research and Postgraduate Education Jointly Construction (grant number: 2015BLU REE01).

Institutional Review Board Statement

Not applicable.

Informed Consent Statement

Not applicable.

Data Availability Statement

All data generated or analyzed during this study are included in this article.

Conflicts of Interest

The authors declare no conflict of interest.

References

  1. Tian, M.; Ming, Q. Hotspots, progress and enlightenments of foreign mountain tourism research. World Reg. Stud. 2020, 29, 1071–1081. [Google Scholar]
  2. Kotler, P. Marketing for Hospitality and Tourism, 5th ed.; Pearson Education: Chennai, India, 2018. [Google Scholar]
  3. Higham, J.; Thompson-Carr, A.; Musa, G. Activity, People and Place. In Mountaineering Tourism; Musa, G., Higham, J., ThompsonCarr, A., Eds.; Routledge: New York, NY, USA, 2015; pp. 1–15. [Google Scholar]
  4. Cavagnaro, E.; Staffieri, S. A study of students’ travellers values and needs in order to establish futures patterns and insights. J. Tour. Futures 2015, 1, 94–107. [Google Scholar] [CrossRef]
  5. Hopkins, D. Destabilising automobility? The emergent mobilities of generation Y. Ambio 2016, 46, 371–383. [Google Scholar] [CrossRef] [PubMed] [Green Version]
  6. Miller, D.; Merrilees, B.; Coghlan, A. Sustainable Urban Tourism: Understanding and Developing Visitor pro-Environmental Behaviors. J. Sustain. Tour. 2015, 23, 26–46. [Google Scholar] [CrossRef]
  7. Olsen, J.E.; Thach, L.; Nowak, L. Wine for My Generation: Exploring How US Wine Consumers are Socialized to Wine. J. Wine Res. 2007, 18, 1–18. [Google Scholar] [CrossRef]
  8. Schoolman, E.D.; Shriberg, M.; Schwimmer, S.; Tysman, M. Green Cities and Ivory Towers: How Do Higher Education Sustainability Initiatives Shape Millennials’Consumption Practices? J. Environ. Stud. Sci. 2016, 6, 490–502. [Google Scholar] [CrossRef]
  9. Giachino, C.; Truant, E.; Bonadonna, A. Mountain Tourism and Motivation: Millennial Students’ Seasonal Preferences. Curr. Issues Tour. 2019, 23, 2461–2475. [Google Scholar] [CrossRef]
  10. Marine-Roig, E. Destination image analytics through traveller-generated content. Sustainability 2019, 11, 3392. [Google Scholar] [CrossRef] [Green Version]
  11. Tieskens, K.F.; Van Zanten, B.T.; Schulp, C.J.; Verburg, P.H. Aesthetic Appreciation of the Cultural Landscape Through Social Media: An Analysis of Revealed Preference in the Dutch River Landscape. Landsc. Urban Plan. 2018, 177, 128–137. [Google Scholar] [CrossRef]
  12. Kiatkawsin, K.; Han, H. Young Travelers’ Intention to Behave Pro-Environmentally: Merging the Value-Belief-Norm Theory and the Expectancy Theory. Tour. Manag. 2017, 59, 76–88. [Google Scholar] [CrossRef]
  13. Oliveira, T.; Araujo, B.; Tam, C. Why Do People Share Their Travel Experiences on Social Media? Tour. Manag. 2020, 78, 104041. [Google Scholar] [CrossRef]
  14. Zhang, Y.; Qiu, J.; Shao, L.; Cui, J.; Meng, X. The Structure of Pull Motivations of Rural Tourism and the Segmentation of Rural Tourists. J. Arid. Land Resour. Environ. 2014, 28, 191–196. [Google Scholar]
  15. Pettebone, D.; Newman, P.; Lawson, S.R.; Hunt, L.; Monz, C.; Zwiefka, J. Estimating Visitors’ Travel Mode Choices along the Bear Lake Road in Rocky Mountain National Park. J. Transp. Geogr. 2011, 19, 1210–1221. [Google Scholar] [CrossRef]
  16. Chen, Y.Y.; Cheng, A.J.; Hsu, W.H. Travel Recommendation by Mining People Attributes and Travel Group Types from Community-Contributed Photos. IEEE Trans. Multimed. 2013, 15, 1283–1295. [Google Scholar] [CrossRef]
  17. Dang, A.; Zhang, D.; Li, J.; Xu, J. Review of urban and rural landscape planning and design research based on spatio-temporal big data. Chin. Gard. 2018, 34, 5–11. [Google Scholar]
  18. Dang, A.; Xu, J.; Tong, B.; Li, J.; Qian, F. Research Progress of the Application of Big Data in China’s Urban Planning. China City Plan. Rev. 2015, 24, 24–30. [Google Scholar]
  19. Zhao, Y.; Qin, B.; Liu, T. Text Sentiment Analysis. J. Softw. 2010, 21, 1834–1848. [Google Scholar] [CrossRef]
  20. Do, Y. Valuating Aesthetic Benefits of Cultural Ecosystem Services Using Conservation Culturomics. Ecosyst. Serv. 2019, 36, 100894. [Google Scholar] [CrossRef]
  21. Evenson, K.R.; Jones, S.A.; Holliday, K.M.; Cohen, D.A.; McKenzie, T.L. Park Characteristics, Use, and Physical Activity: A Review of Studies Using Soparc (System for Observing Play and Recreation in Communities). Prev. Med. 2016, 86, 153–166. [Google Scholar] [CrossRef] [Green Version]
  22. Liu, Y.; Bao, J.; Zhu, Y. Research on the Emotional Evaluation Method of Tourist Destination Based on Big Data. Geogr. Res. 2017, 36, 1091–1105. [Google Scholar]
  23. Shao, J.; Chang, X.; Zhao, Y. A Study on Tourist Behavior Pattern of Huashan Scenic Spot Based on Travel Big Data. Chin. Gard. 2018, 34, 18–24. [Google Scholar]
  24. Liu, Y.; Bao, J.; Chen, K. A Study on the Emotional Characteristics of Chinese Tourists to Australia: A Text Analysis Based on Big Data. J. Tour. 2017, 32, 46–58. [Google Scholar]
  25. Pan, B.; Fesenmaier, D.R. Semantics of Online Tourism and Travel Information Search on the Internet: A Preliminary Study. 2002, pp. 320–328. Available online: https://www.researchgate.net/publication/228605286_Semantics_of_Online_Tourism_and_Travel_Information_Search_on_the_Internet_A_Preliminary_Study (accessed on 12 September 2022).
  26. Zhang, W.; Du, X. Exploring Mainland Tourists’ Perception of Taiwan Province’s Tourist Destination Image: Based on the Content Analysis of Online Travel Notes. J. Beijing Int. Stud. Univ. 2010, 32, 75–83. [Google Scholar]
  27. Xiong, W.; Guo, Y. Text Mining of Online Reviews of Hotel Customers. J. Beijing Int. Stud. Univ. 2013, 35, 38–47. [Google Scholar]
  28. Sinclair, M.; Ghermandi, A.; Sheela, A.M. A Crowdsourced Valuation of Recreational Ecosystem Services Using Social Media Data: An Application to a Tropical Wetland in India. Sci. Total Environ. 2018, 642, 356–365. [Google Scholar] [CrossRef] [PubMed]
  29. Fisher, D.M.; Wood, S.A.; White, E.M.; Blahna, D.J.; Lange, S.; Weinberg, A.; Tomco, M.; Lia, E. Recreational Use in Dispersed Public Lands Measured Using Social Media Data and On-Site Counts. J. Environ. Manag. 2018, 222, 465–474. [Google Scholar] [CrossRef]
  30. Mancini, F.; Coghill, G.M.; Lusseau, D. Using Social Media to Quantify Spatial and Temporal Dynamics of Nature-based Recreational Activities. PLoS ONE 2018, 13, e0200565. [Google Scholar] [CrossRef] [Green Version]
  31. Kádár, B.; Gede, M. Where do Tourists go Visualizing and Analysing the Spatial Distribution of Geotagged Photography. Cartogr. Int. J. Geogr. Inf. Geovis. 2013, 48, 78–88. [Google Scholar] [CrossRef]
  32. Carlos, G.P.J.; Gutierrez, J.; Minguez, C. Identification of Tourist Hot Spots Based on Social Networks: A Comparative Analysis of European Metropolises Using Photo-Sharing Services and GIS. Appl. Geogr. 2015, 63, 408–417. [Google Scholar]
  33. Kisilevich, S.; Krstajic, M.; Keim, D.; Andrienko, N.; Andrienko, G. Event-Based Analysis of People’s Activities and Behavior Using Flickr and Panoramio Geotagged Photo Collections. In Proceedings of the 2010 14th International Conference Information Visualisation, London, UK, 26–29 July 2010; pp. 289–296. [Google Scholar]
  34. Martilla, J.A.; James, J.C. Importance-Performance Analysis. J. Mark. 1977, 41, 77–79. [Google Scholar] [CrossRef]
  35. Gu, X. Research on the Structure, Behavior and Demand Characteristics of Tourists in Shanghai Urban Parks and Their Influencing Factors. Master’s Thesis, East China Normal University, Shanghai, China, 2013. [Google Scholar]
  36. Yu, B.; Xie, C.; Yang, S.; Che, S. Corresponding Analysis of Residents’ Perceived Satisfaction and Importance of Recreation in Shanghai Urban Community Parks. Chin. Gard. 2014, 30, 75–78. [Google Scholar]
  37. Fan, Y.; Mao, D.; Zhou, C.; Ye, J.; Chen, L.; Zheng, Y. Evaluation of Recreational Resources in Fuzhou West Lake Park Based on Web Text Analysis. China Urban For. 2019, 17, 41–46. [Google Scholar]
  38. Wang, M.; Qiu, M.; Wang, J.; Peng, Y. Analysis and Optimization of Supply and Demand Relationship of Cultural Ecosystem Services in Waterfront Space of Suzhou, Shanghai Based on Importance-Performance Analysis. Landsc. Archit. 2019, 26, 107–112. [Google Scholar]
  39. Liang, H.; Wang, Y.; Liu, M. IPA Analysis of Tourists’ Perception of Local Food Experience in Tourist Destinations-Taking Enshi Prefecture, Hubei Province as an Example. J. Agric. For. Econ. Manag. 2016, 15, 335–342. [Google Scholar]
  40. Chen, X. Revision of IPA Analysis Method and Its Application in Tourist Satisfaction Research. J. Tour. 2013, 28, 59–66. [Google Scholar]
  41. Chen, P.Z.; Liu, W.Y. Assessing Management Performance of the National Forest Park Using Impact Range-Performance Analysis and Impact-Asymmetry Analysis. For. Policy Econ. 2019, 104, 121–138. [Google Scholar] [CrossRef]
  42. Go, F.; Zhang, W. Applying Importance-Performance Analysis to Beijing as an International Meeting Destination. J. Travel Res. 1997, 35, 42–49. [Google Scholar] [CrossRef]
  43. Evans, M.R.; Chon, K.S. Formulating and Evaluating Tourism Policy Using Importance-Performance Analysis. Hosp. Educ. Res. J. 1989, 13, 203–213. [Google Scholar]
  44. Sever, I. Importance-Performance Analysis: A Valid Management Tool? Tour. Manag. 2015, 48, 43–53. [Google Scholar] [CrossRef]
Figure 1. Distribution of the 45 representative mountain landscapes in Beijing.
Land 11 01841 g001
Figure 2. Images of the classification of mountain landscape resources.
Land 11 01841 g002aLand 11 01841 g002b
Figure 3. IPA quadrant diagram.
Land 11 01841 g003
Figure 4. Analysis of tourists’ landscape preferences and its difference among different genders.
Land 11 01841 g004
Figure 5. Analysis of tourists’ landscape preferences when using different modes of transportation.
Land 11 01841 g005
Figure 6. Analysis of tourists’ landscape preferences when using different travel modes.
Land 11 01841 g006
Figure 7. Analysis of tourists’ travel mode preferences with respect to different landscape resource types.
Land 11 01841 g007
Figure 8. Frequency of the top 30 words related to recreation and emotional experience.
Land 11 01841 g008
Figure 9. The semantic network of positive evaluations.
Land 11 01841 g009
Figure 10. The semantic network of negative evaluations.
Land 11 01841 g010
Figure 11. The semantic network of local tourists’ evaluations.
Land 11 01841 g011
Figure 12. The semantic network of foreign tourists’ evaluations.
Land 11 01841 g012
Figure 13. The semantic network of males’ evaluations.
Land 11 01841 g013
Figure 14. The semantic network of females’ evaluations.
Land 11 01841 g014
Figure 15. The semantic network for the Taihang Mountain landscape.
Land 11 01841 g015
Figure 16. The semantic network for the Yan Mountain landscape.
Land 11 01841 g016
Figure 17. The semantic web of mountain landscapes in various administrative regions (From left to right: Changping District, Fangshan District, and Fengtai District).
Land 11 01841 g017aLand 11 01841 g017b
Figure 18. The semantic web of mountain landscapes in various administrative regions (From left to right: Haidian District, Huairou District, and Miyun District).
Land 11 01841 g018
Figure 19. The semantic web of mountain landscapes in various administrative regions (From left to right: Pinggu District, Yanqing District, Mentougou District, and Shijingshan District).
Land 11 01841 g019
Figure 20. Comprehensive IPA of satisfaction in terms of recreation.
Land 11 01841 g020
Figure 21. IPA of satisfaction with recreation in different mountain systems.
Land 11 01841 g021
Figure 22. Integrated IPA of the experience of the five senses.
Land 11 01841 g022
Figure 23. IPA of the experiences of different mountain systems in terms of the five senses.
Land 11 01841 g023
Table 1. Basic information on mountain landscapes.
Serial NumberNameMountain RangeDistrictScoreDistance to the City Center (km)Driving Time to the City Center (h)
1Fragrant Hill ParkTaihang MountainHaidian District4.7532 km0.75 h
2Badachu ParkTaihang MountainShijingshan District4.8029 km0.75 h
3Ming Tombs National Forest ParkYan MountainChangping District4.5554 km1 h
4Shangfang Mountain National Forest ParkTaihang MountainFangshan District4.6080 km1.5 h
5Xishan National Forest ParkTaihang MountainHaidian District4.8034 km1 h
6Beigong National Forest ParkTaihang MountainFengtai District4.7520 km0.5 h
7Jiufeng National Forest ParkTaihang MountainHaidian District4.6040 km1 h
8Miaofeng Mountain National Forest ParkTaihang MountainMentougou District4.5555 km1.5 h
9Baishui Temple Forest ParkYan MountainFangshan District4.6567 km1 h
10Fahai Temple Forest ParkTaihang MountainShijingshan District4.0039 km0.75 h
11Yaji Mountain Forest ParkYan MountainPinggu District4.8075 km1.25 h
12Laobagoumen National Forest ParkYan MountainHuairou District4.60160 km4 h
13Dayang Mountain National Forest ParkYan MountainChangping District3.8540 km1 h
14Jingzhi Lake Forest ParkYan MountainChangping District4.3028 km1 h
15Yunmeng Mountain National Forest ParkTaihang MountainMiyun District4.5585 km1.5 h
16Xiayunling National Forest ParkTaihang MountainFangshan District4.2074 km1.5 h
17Tianmeng Mountain National Forest ParkTaihang MountainMentougou District4.6540 km1 h
18Shuanglongxia Dongshan Forest ParkTaihang MountainMentougou District4.6092.2 km2 h
19Nanshiyang Grand Canyon Forest ParkTaihang MountainMentougou District4.5091.8 km2 h
20Badaling National Forest ParkTaihang MountainYanqing District4.6567.6 km0.9 h
21Baihujian Scenic AreaTaihang MountainChangping District4.1545 km1 h
22Yunmeng Mountain Scenic AreaTaihang MountainMiyun District4.5585 km1.5 h
23Bairuigu Scenic AreaTaihang MountainFangshan District4.5585 km2.2 h
24Guyaju Scenic AreaYan MountainYanqing District4.6592 km2.5 h
25Baihua Mountain Scenic AreaTaihang MountainMentougou District4.65120 km3 h
26Yaji Mountain Scenic AreaYan MountainHaidian District4.8042 km1 h
27Yangtai Mountain Scenic AreaTaihang MountainPinggu District4.4590 km2 h
28Fenghuangling Scenic AreaTaihang MountainHaidian District4.7053 km0.9 h
29Shenquanxia Scenic AreaTaihang MountainMentougou District4.5055 km1 h
30Zhuijiuyu Scenic AreaYan MountainChangping District4.1562 km1 h
31Shentangyu Scenic AreaYan MountainHuairou District4.6065 km1.2 h
32Qinglongxia Scenic AreaYan MountainHuairou District4.6575 km2 h
33Baicaopan Scenic AreaTaihang MountainFangshan District4.65120 km2.5 h
34Baiyanggou Scenic AreaTaihang MountainChangping District4.3063.8 km1 h
35Jiangjuntuo Scenic AreaTaihang MountainFangshan District3.8045 km1 h
36Yunfeng Mountain Scenic AreaYan MountainMiyun District4.55120 km3 h
37Linlong Mountain Scenic AreaYan MountainHuairou District4.2575 km2 h
38Jiugukou Scenic AreaYan MountainHuairou District4.1078 km1.3 h
39Xianjugu Scenic AreaYan MountainMiyun District4.45125 km1.7 h
40Taoyuan Xiangu Scenic AreaYan MountainMiyun District4.20101 km1.5 h
41Penghewan Scenic AreaYan MountainMiyun District4.20105 km1.24 h
42Bailongtan Scenic AreaYan MountainMiyun District3.85105 km1.24 h
43Yunxiugu Scenic AreaYan MountainMiyun District4.20175 km2.32 h
44Hudongshui Scenic AreaYan MountainPinggu District4.45103 km1.8 h
45Qianling Mountain Scenic AreaTaihang MountainFengtai District4.6530 km1 h
Note: Social media has given an overall possible score of 5.
Table 2. Classification of landscape resources.
Main
Category
SubcategoryBasic Types
Physiographic
landscape
Natural landscape complexHills, mesas, valleys, and beaches
Geological and tectonic tracesFractured landscape, folded landscape, stratigraphic section, and biological fossil point
Surface morphologyHill-shaped landscape, peak-columnar landscape, ravines, and caves
Natural marks and natural phenomenaStrange natural phenomena and natural landmark
Water
landscape
River systemRecreational river sections, waterfalls, and ancient river sections
Lake and marshRecreational lakes, pools, and wetlands
GroundwaterSprings and buried bodies of water
Ice and snow areaSnow fields and modern glaciers
Biological landscapeVegetation landscapeWoodland, single and bushy trees, meadows, and flower fields
Wildlife habitatAquatic animal habitat, land animal habitat, bird habitat, and butterfly habitat
Astronomical and climatic landscapeAstronomical landscapeSun, moon, stars, aurora, and natural or artificial light phenomena
Weather and climatic phenomenaClouds, fog rime, rain rime, extreme and special climate displays, and phenological phenomena
Buildings and facilitiesCultural landscape complexPlaces for social and commercial activities, military sites and ancient battlefields, places for cultural activities, places for recreation and leisure, places for religious and sacrificial activities, and places for memorials and commemorative activities
Practical buildings and core facilitiesCharacteristic blocks, landscape buildings and spaces with viewing functions, bridges, dams, caves, mausoleums, landscape farmland, landscape forest farms, and specialty shops
Landscape and sketch architectureImage markers, viewing points, pavilions, platforms, buildings, pavilions, sculptures, archways, forest of steles, porches, tower buildings, landscape trails, flower lawns, fountains, and rock piles
Historical sitesMaterial cultural relicsArchitectural relics and movable cultural relics
Immaterial cultural relicsFolk literature and art, local customs, traditional costume decoration, and traditional performing arts
Tourist
purchases
Agricultural productsPlanting, forestry, animal husbandry, aquaculture products, and aquatic products
Industrial productsDaily industrial product and tourism equipment products
Handmade arts and craftsStationery, fabrics, furniture, ceramics, and paintings
Cultural
activities
Personal activity recordsLocal people and local events
Festivals and seasonsReligious activities and temple fairs, agricultural festivals, and modern festivals
Table 3. Evaluative indexes of tourist satisfaction with mountain landscapes in terms of recreation.
Evaluation TermIndicatorsIndicator Definition
Landscape
quality (A)
Natural landscape (A1)Rivers, streams, and other natural landscapes
Plant landscape (A2)Trees, flowers, and other plant landscapes
Animal landscape (A3)Squirrels, ducks, hedgehogs, and other animal landscapes
Astronomical landscape (A4)Seas of clouds, rimes, rainbows, and other astronomical landscapes
Historical and cultural landscape (A5)Temples, ancient temples, ancient buildings, gardens, and other characteristic landscapes
Recreational
activities (B)
Outdoor recreational activities (B1)Hiking, ferrying, picnicking, and other outdoor recreational activities
Leisure activities (B2)Taking photos, hiking, walking, and other leisure activities
Fitness activities (B3)Sports, hiking, fitness, and other activities
Humanistic activities (B4)Burning incense, praying for blessings, and other humanistic activities
Tourism
experience (C)
Ticket cost (C1)Park fares and charges
Parent-child experience (C2)Suitability for parent-child activities
Emotional experience (C3)Comfort, pleasure, happiness, and other recreational emotions
Air and environmental quality (C4)Environmental quality, air freshness, and weather conditions
Sense of crowded space (C5)The number of visitors and the degree of space crowding
Infrastructure (D)Traffic accessibility (D1)Connectivity of internal and external roads
Public service facilities (D2)Parking lots, toilets, trash cans, and other service facilities
Recreational and entertainment facilities (D3)Slides, cable cars, cableways, and other recreational facilities
Navigation signage system (D4)Guide systems, signage, etc.
Catering and convenience facilities (D5)Restaurants, catering, food sales, etc.
Safety facilities (D6)Railings, fences, and other safety equipment
Management
services (E)
Facility maintenance (E1)Maintenance and management of public facilities and infrastructure
Park management services (E2)Park management, public security maintenance, etc.
Planning layout (E3)Park areas, planning and design, route planning, etc.
Table 4. Evaluative indexes of the experiences of mountain landscape tourists in terms of the five senses.
Senses TermIndicatorIndicator Definition
Vision (F)Visibility of plants (F1)Visibility of trees, grass, flowers, etc.
Visibility of animals (F2)Visibility of squirrels, ducks, hedgehogs, etc.
Visibility of natural landscapes (F3)Visibility of the landscape, rivers, streams, etc.
Visibility of celestial phenomena (F4)Visibility of celestial landscapes (sea of clouds, smog, rainbow, etc.)
Crowd disturbances (F5)The number of people and the presence or absence of distractions
Landscape recognizability (F6)Special sites
Visibility of roads (F7)The line, shape, color, etc. of the roads
Others (F8)Environmental visibility, etc.
Hearing (G)Sounds of humans (G1)Moderate vocals
Sounds of plants (G2)Sound of the wind blowing through the plants
Sounds of animals (G3)Sounds of birds, insects, and other animals
Sounds of broadcasts (G4)Sounds of broadcasts
Sounds of water (G5)Sound of flowing water
Others (G6)Sounds of wind, rain, etc.
Smell (H)Smell of air/water (H1)Smell of the air and water emanating from the landscape
Smell of plants (H2)Smell of the scent emanating from the plants
Touch (L)Feel of sunlight (L1)Feel of the balance of light and shadow
Feel of wind (L2)Feel of the wind environment
Feel of water (L3)Feel of water flowing through the landscape
Feel of temperature (L4)Feel of the landscape temperature
Touch of the road (L5)Feel of the comfort of road contact
Touch of animals (L6)Lack of mosquito bites
Others (L7)Touch of plants, etc.
Taste (K)Food sales (K1)Purchase of food
Taste of food (K2)Taste of food, spring water, etc.
Table 5. Statistical analysis of the tourist groups.
TypeQuantityPercentage
GenderMale288232.4
Female601467.6
TransportationWalking160.4
Using the subway621.7
Using a bus1153.1
Using a taxi230.6
Using a self-driven vehicle348594.2
Travel modeAlone41712.1
With friends and classmates102529.8
With family193756.3
As a couple651.8
FamilyHad children94648.9
Had an elderly person683.5
Had both children and elderly people1206.2
Had other relatives80341.4
Table 6. The frequency with which landscape types were visited by each gender.
Types of Landscape ResourcesNumber of PeopleNumber of PhotosAverage Value
MaleFemaleMaleFemaleMaleFemale
Physiographic landscape8941993266345762.982.30
Water landscape34583784821852.462.61
Biological landscape5011094128424462.562.24
Astronomy and climatic landscape771751804402.342.51
Buildings and facilities8261674210940912.552.44
Historical sites1533132995201.951.66
Tourist purchases306146811.531.33
Cultural activities562051085061.932.47
Table 7. Factors of different administrative regions were used in the correlation analysis.
Average Rating StarPopulation
Density (ppl/km²)
Number of Permanent Residents (10,000 People)Per Capita GDP of the District (10,000 CNY)GDP of the District (1,000,000,000 CNY) aAverage Distance from the City Center (km)Average Driving Time from the City Center (H)
Haidian District4.73 7515323.726.273108504.640.20.93
Fengtai District4.70 6628202.59.035061829.620.00.75
Changping District4.22 1612216.64.948291071.856.21.0
Yanqing District4.65 17334.65.62138194.579.81.7
Fangshan District4.41 650131.35.78751759.978.51.62
Pinggu District4.57 48145.76.22000284.189.31.68
Huairou District4.44 21044.19.80000432.673.252.1
Miyun District4.32 24052.76.83000360.3112.631.75
Shijingshan District4.40 668457.014.14737806.4340.75
Mentougou District4.58 27139.36.84000268.875.671.75
a One billion yuan.
Table 8. Correlation analysis.
Average Rating StarPopulation Density as per the Latest Yearbook (Ppl/Km²)Number of Permanent Residents as per the Latest Yearbook (10,000 People)per Capita GDP of the District as per the Latest Yearbook (10,000 CNY)GDP of the District as per the Latest Yearbook (100,000,000 CNY) aAverage Distance from the City Center (Km)Average Driving Time from the City Center (H)
Average rating starPearson correlation coefficient10.3860.2210.4390.472−0.342−0.124
Sig. (two-tail) 0.2700.5400.2040.1680.3340.732
Number10101010101010
a One hundred million yuan.
Table 9. Importance and satisfaction scores of tourists’ satisfaction in terms of recreation.
Main CategorySerial No.SubcategoryImportanceSatisfaction
Landscape quality (A)A1Natural landscape0.10340.6669
A2Plant landscape0.06880.6982
A3Animal landscape0.03580.7259
A4Astronomical landscape0.00680.6744
A5Historical and cultural landscape0.03240.7017
Recreational activities (B)B1Outdoor recreational activities0.07700.6628
B2Leisure activities0.03700.6713
B3Fitness activities0.02270.6814
B4Humanistic activities0.00200.7626
Tourism experience (C)C1Ticket cost0.05270.5624
C2Parent-child experience0.04840.6826
C3Emotional experience0.11960.7087
C4Air and environmental quality0.03180.7206
C5Sense of crowded space0.01340.5506
Infrastructure (D)D1Traffic accessibility0.13650.5885
D2Public service facilities0.07710.6132
D3Recreation and entertainment facilities0.02530.6641
D4Navigation signage system0.00990.5762
D5Catering and convenience facilities0.00820.5828
D6Safety facilities0.02680.5737
Management services (E)E1Facility maintenance0.00160.5093
E2Park management services0.04990.6014
E3Planning layout0.01300.6738
Table 10. Importance and satisfaction scores of tourists’ satisfaction in terms of recreation in different mountain systems.
Main CategorySerial No.SubcategoryTaihang MountainsYan Mountains
ImportanceSatisfactionImportanceSatisfaction
Landscape quality (A)A1Natural landscape0.09020.66550.14570.6696
A2Plant landscape0.07540.71660.04790.6064
A3Animal landscape0.04090.73990.01930.6309
A4Astronomical landscape0.00780.66720.00360.7241
A5Historical and cultural landscape0.02840.69890.04520.7073
Recreational activities (B)B1Outdoor recreational activities0.07930.67500.06960.6186
B2Leisure activities0.03440.66330.04560.6906
B3Fitness activities0.02460.67580.01650.7078
B4Humanistic activities0.00120.79350.00440.7358
Tourism experience (C)C1Ticket cost0.05210.57210.05440.5328
C2Parent-child experience0.04980.69620.04370.6332
C3Emotional experience0.11760.71380.12600.6933
C4Air and environmental quality0.03310.72810.02770.6921
C5Sense of crowded space0.01490.55400.00860.5314
Infrastructure (D)D1Traffic accessibility0.13630.58880.13710.5874
D2Public service facilities0.07900.61390.07100.6106
D3Recreation and entertainment facilities0.02630.68950.02190.5663
D4Navigation signage system0.01010.56670.00950.6087
D5Catering and convenience facilities0.00750.60940.01040.5219
D6Safety facilities0.02470.57740.03350.5649
Management services (E)E1Facility maintenance0.05070.47500.00180.6047
E2Park management services0.05070.60310.04740.5958
E3Planning layout0.01410.67250.00930.6800
Table 11. Importance and satisfaction scores of the experience of the five senses.
Main CategorySerial No.SubcategoryImportanceSatisfaction
Vision (F)F1Visibility of plants (F1)0.22690.6973
F2Visibility of animals (F2)0.11790.7259
F3Visibility of natural landscapes (F3)0.15380.6478
F4Visibility of celestial phenomena (F4)0.02270.6743
F5Crowd disturbances (F5)0.01520.5548
F6Landscape recognizability (F6)0.10690.6962
F7Visibility of roads (F7)0.05470.6438
F8Others (F8)0.03550.7037
Hearing (G)G1Sounds of humans (G1)0.01110.7265
G2Sounds of plants (G2)0.00070.6364
G3Sounds of animals (G3)0.00300.7500
G4Sounds of broadcasts (G4)0.00520.6076
G5Sounds of water (G5)0.00320.5859
G6Others (G6)0.00320.6701
Smell (H)H1Smell of air/water (H1)0.05820.7584
H2Smell of plants (H2)0.00350.7570
Touch (L)L1Feel of sunlight (L1)0.03110.6474
L2Feel of wind (L2)0.00760.7682
L3Feel of water (L3)0.00710.5556
L4Feel of temperature (L4)0.03890.6747
L5Touch of the road (L5)0.03220.6282
L6Touch of animals (L6)0.01750.7026
L7Others (L7)0.00130.6829
Taste (K)K1Food sales (K1)0.04150.6423
K2Taste of food (K2)0.00110.6364
Table 12. Importance and satisfaction scores of the experience of the five senses in different mountain systems.
Main CategorySerial No.SubcategoryTaihang MountainsYan Mountains
ImportanceSatisfactionImportanceSatisfaction
Vision (F)F1Visibility of plants (F1)0.25190.71660.15190.6012
F2Visibility of animals (F2)0.13670.73990.06100.6288
F3Visibility of natural landscape (F3)0.12100.64180.25280.6565
F4Visibility of celestial phenomena (F4)0.02650.66890.01140.7126
F5Crowd disturbances (F5)0.01700.57030.00970.4730
F6Landscape recognizability (F6)0.09500.69820.14280.6923
F7Visibility of roads (F7)0.04950.61440.07040.7063
F8Others (F8)0.03600.72950.03430.6221
Hearing (G)G1Sounds of humans (G1)0.01080.76310.01190.6264
G2Sounds of plants (G2)0.00060.53850.00120.7778
G3Sounds of animals (G3)0.00290.77270.00340.6923
G4Sounds of broadcast (G4)0.00230.65380.01390.5849
G5Sounds of water (G5)0.00240.60000.00580.5682
G6Others (G6)0.00330.69330.00290.5909
Smell (H)H1Smell of air/water (H1)0.06070.77170.05060.7106
H2Smell of plants (H2)0.00380.73560.00260.8500
Touch (L)L1Feel of sunlight (L1)0.03190.66170.02840.5991
L2Feel of wind (L2)0.00800.77840.00630.7292
L3Feel of water (L3)0.00590.61480.01060.4568
L4Feel of temperature (L4)0.03670.67180.04600.6818
L5Touch of the road (L5)0.03280.62650.03030.6336
L6Touch of animals (L6)0.02060.71520.00840.6094
L7Others (L7)0.00130.62070.00160.8333
Taste (K)K1Food sales (K1)0.04160.66460.04120.5746
K2Taste of food (K2)0.00120.70370.00080.3333
Publisher’s Note: MDPI stays neutral with regard to jurisdictional claims in published maps and institutional affiliations.

