Article

Effectiveness of Strategically Located Green Stormwater Infrastructure Networks for Adaptive Flood Mitigation in a Context of Climate Change

1
School of Landscape Architecture, Lincoln University, Lincoln 7647, New Zealand
2
Faculty of Geological Sciences, University of Canterbury, Christchurch 8140, New Zealand
*
Authors to whom correspondence should be addressed.
Land 2022, 11(11), 2078; https://doi.org/10.3390/land11112078
Submission received: 10 October 2022 / Revised: 9 November 2022 / Accepted: 14 November 2022 / Published: 18 November 2022

Abstract

:
Studies indicate Green Stormwater Infrastructure (GSI) on industrial land can provide substantial adaptive flood mitigation within urban catchments under climate change. To identify a cost-effective adaptive GSI network, planners need to evaluate flood mitigation capabilities of industrial properties through time and understand key characteristics informing when, where, and how GSI should be implemented for maximum effect. We applied the Hydrology-based Land Capability Assessment and Classification (HLCA+C) methodology to a catchment in Christchurch, New Zealand, to evaluate the capabilities of industrial properties clustered into Storm Water Management (SWM) zones under different climate change scenarios. SWM zone potentials and limitations were assessed to develop the most capable adaptive flood mitigation network with climate change. We prioritised six of twenty SWM zones for inclusion in the network based on their substantial flood mitigation capabilities. To maximise their capabilities through time, we orchestrated, and implemented GSI in zones incrementally, using different implementation approaches based on key characteristics determining their capability. The results indicated that the most capable zone could mitigate climate change-induced flooding, by itself, up to the end of this century under the moderate climate change scenario. However, if its capability was combined with that of five others, together they could mitigate flooding just shy of that associated with the major climate change scenario up to the end of this century. The resulting adaptive industrial GSI network not only provides substantial flood protection for communities but allows costly investments in flood mitigation structures, such as barriers and levees, to be safely delayed until their cost-effectiveness has been confirmed under increased climate certainty.

1. Introduction

Substantial changes in existing flood protection systems will be needed for coastal cities facing large scale climate change-induced flooding in the long term [1,2]. However, under climate change uncertainty, one-time investments in expensive mechanical flood defence structures like barriers are risky [3]. It is uncertain whether their flood mitigation capabilities will be adequate or needed in the long term [4,5].
Instead of reinforcing flood protection capacity at one point in time, Green Stormwater Infrastructure (GSI) can provide a flood mitigation system capable of adapting to the dynamics and uncertainty associated with climate change [6]. GSI networks are composed of decentralised vegetated stormwater facilities (e.g., raingardens, infiltration trenches, and detention ponds) that intercept and delay surface runoff before it reaches waterways [7]. These facilities require less investment than many mechanical flood defence structures and can be implemented as needed with changing conditions [2]. They can enable planners to delay decision making on investments in large engineering structures until their cost-effectiveness becomes certain [5].
A network of GSI across a catchment has been demonstrated to provide substantial flood mitigation with climate change [8,9,10], and has been widely adopted for adaptative flood management [7]. For example, in-ground storage-based GSI facilities (e.g., detention ponds) can mitigate flooding under an extreme storm event [11]. This is particularly true of facilities located on properties with substantial depths above groundwater [12], large potential GSI areas [13], and located at waterway confluences [14]. Privately-owned large properties, such as industrial, commercial, and institutional land, should be considered as opportunities for strategic flood mitigation, as many cities do not have large areas of public land having these characteristics [15,16]. For example, simulations of catchment runoff reductions demonstrate GSI on industrial land has the potential to mitigate increased runoff volume associated with climate change [13,17]. Many scholars argue implementing GSI on industrial land could be easier than on other land use types, such as residential land, due to the availability of larger potential areas of land on which to install GSI, and to planners having to deal with fewer landowners per unit area [18]. In addition, business owners may be more likely to be in favour of GSI if it provides them with a competitive advantage from green branding via certification [19]. In addition, according to Johns [20], many industrial landowners favour collaborations with local authorities, and the adoption of environmental policies, like ones encouraging GSI implementation, as long as they allow for long term business planning.
Despite their potential, little is known about the capability of individual industrial properties to provide catchment flood mitigation under different climate change scenarios. Nor is much known about how GSI on individual industrial properties, having different flood mitigation characteristics, can be orchestrated through time to form effective networks. Using a catchment in Christchurch, New Zealand, as a case study, the Hydrology-based Land Capability Assessment and Classification (HLCA+C) methodology [21] was applied to evaluate the Flood Mitigation Capability (FMC) of GSI on industrial properties that have different biophysical and built-environmental characteristics in support of flood mitigation, through time under climate change. Based on this evaluation, implementation approaches are suggested to maximise their FMCs individually and as networks through time.

2. Materials and Methods

2.1. Study Area

All industrial properties across the Heathcote River catchment, Christchurch, New Zealand, were selected for the study. Most of them are clustered in industrial estates or subdivisions, while a few are isolated. The properties cover 8.3 km2 or 7.5% of the Heathcote River catchment area (Figure 1). A previous study revealed the overall potential of these properties as a network for reducing climate change-induced flooding to the current level over the long term, except under the major climate change scenario [17]. However, industrial properties located in different parts of the catchment are likely to have substantial biophysical variations, which could impact their individual FMC through time [17].
The catchment is 111 km2 and is largely low-lying and flat. A small portion at the southern end is Banks Peninsula and is hilly to gently undulating. Average annual rainfall is about 600 to 800 mm [23]. About 50% of the catchment area is built-up, mostly on the flat area. Meadow and woodland cover about 30% and 10% of the catchment area, respectively, and are in hilly areas.
The catchment is prone to flooding due to its biophysical characteristics [24] and the consequences of earthquakes [25]. Most recently, the 2010 and 2011 earthquakes damaged drainage infrastructures and caused riverbanks to slump. They led to subsidence upstream and tectonic uplift downstream, reducing the river’s ability to carry runoff [26] and discharge it to the sea [25].
The city has implemented a flood mitigation strategy, largely on its publicly owned lands along the river. It has widened and deepened the river channel, reinforced river banks, and provided a diversion channel [27]. The city also purchased greenfield land to implement retention basins in the upper catchment [27], in addition to installing small GSI facilities, like rain gardens, within public rights of way. These strategies are capable of handling runoff volumes associated with the current 50-year storm [28,29]. However, the city is concerned these strategies will not be sufficient to manage increased runoff associated with climate change [27,30].

2.2. HLCA+C Methodology

The Hydrology-based Land Capability Assessment and Classification (HLCA+C) methodology [21] was used to evaluate the Flood Mitigation Capability (FMC) of different industrial Storm Water Management (SWM) zones within the catchment based on their hydrological and geographical characteristics. SWM zones are defined as industrial properties located in the same drainage area sharing a common drainage outlet.
The methodology is described in detail in Muangsri, et al. [21]. The methodology is specially designed to provide planners with an initial assessment of properties for their flood mitigation capabilities, and to understand their flood mitigation characteristics. Planners can then use this information to determine when and how GSI on properties can be implemented through time to provide catchment flood mitigation. The methodology consists of four main steps (Figure 2). Steps 1–3 evaluate the FMC of each SWM zone. In Step 1, industrial properties are grouped into SWM zones. In Step 2, the collectable runoff volumes in each zone under different climatic conditions are quantified based on: (a) the total runoff volumes generated within the SWM zone’s drainage area, and (b) the SWM zone’s potential in-ground storage capacity given its biophysical and land use characteristics. Step 3 evaluates the SWM zone’s FMC under different climate conditions. These steps require four data inputs (square boxes in Figure 2): (1) geographic information to identify SWM zones, (2) hydrological information to calculate runoff volumes generated from a zone’s drainage area, (3) geographic information to estimate potential in-ground storage capacity of each zone, and (4) hydrological information to identify runoff reductions for maintaining a flood protection objective (see details in Section 2.2.1, Section 2.2.2, Section 2.2.3 and Section 2.2.4).
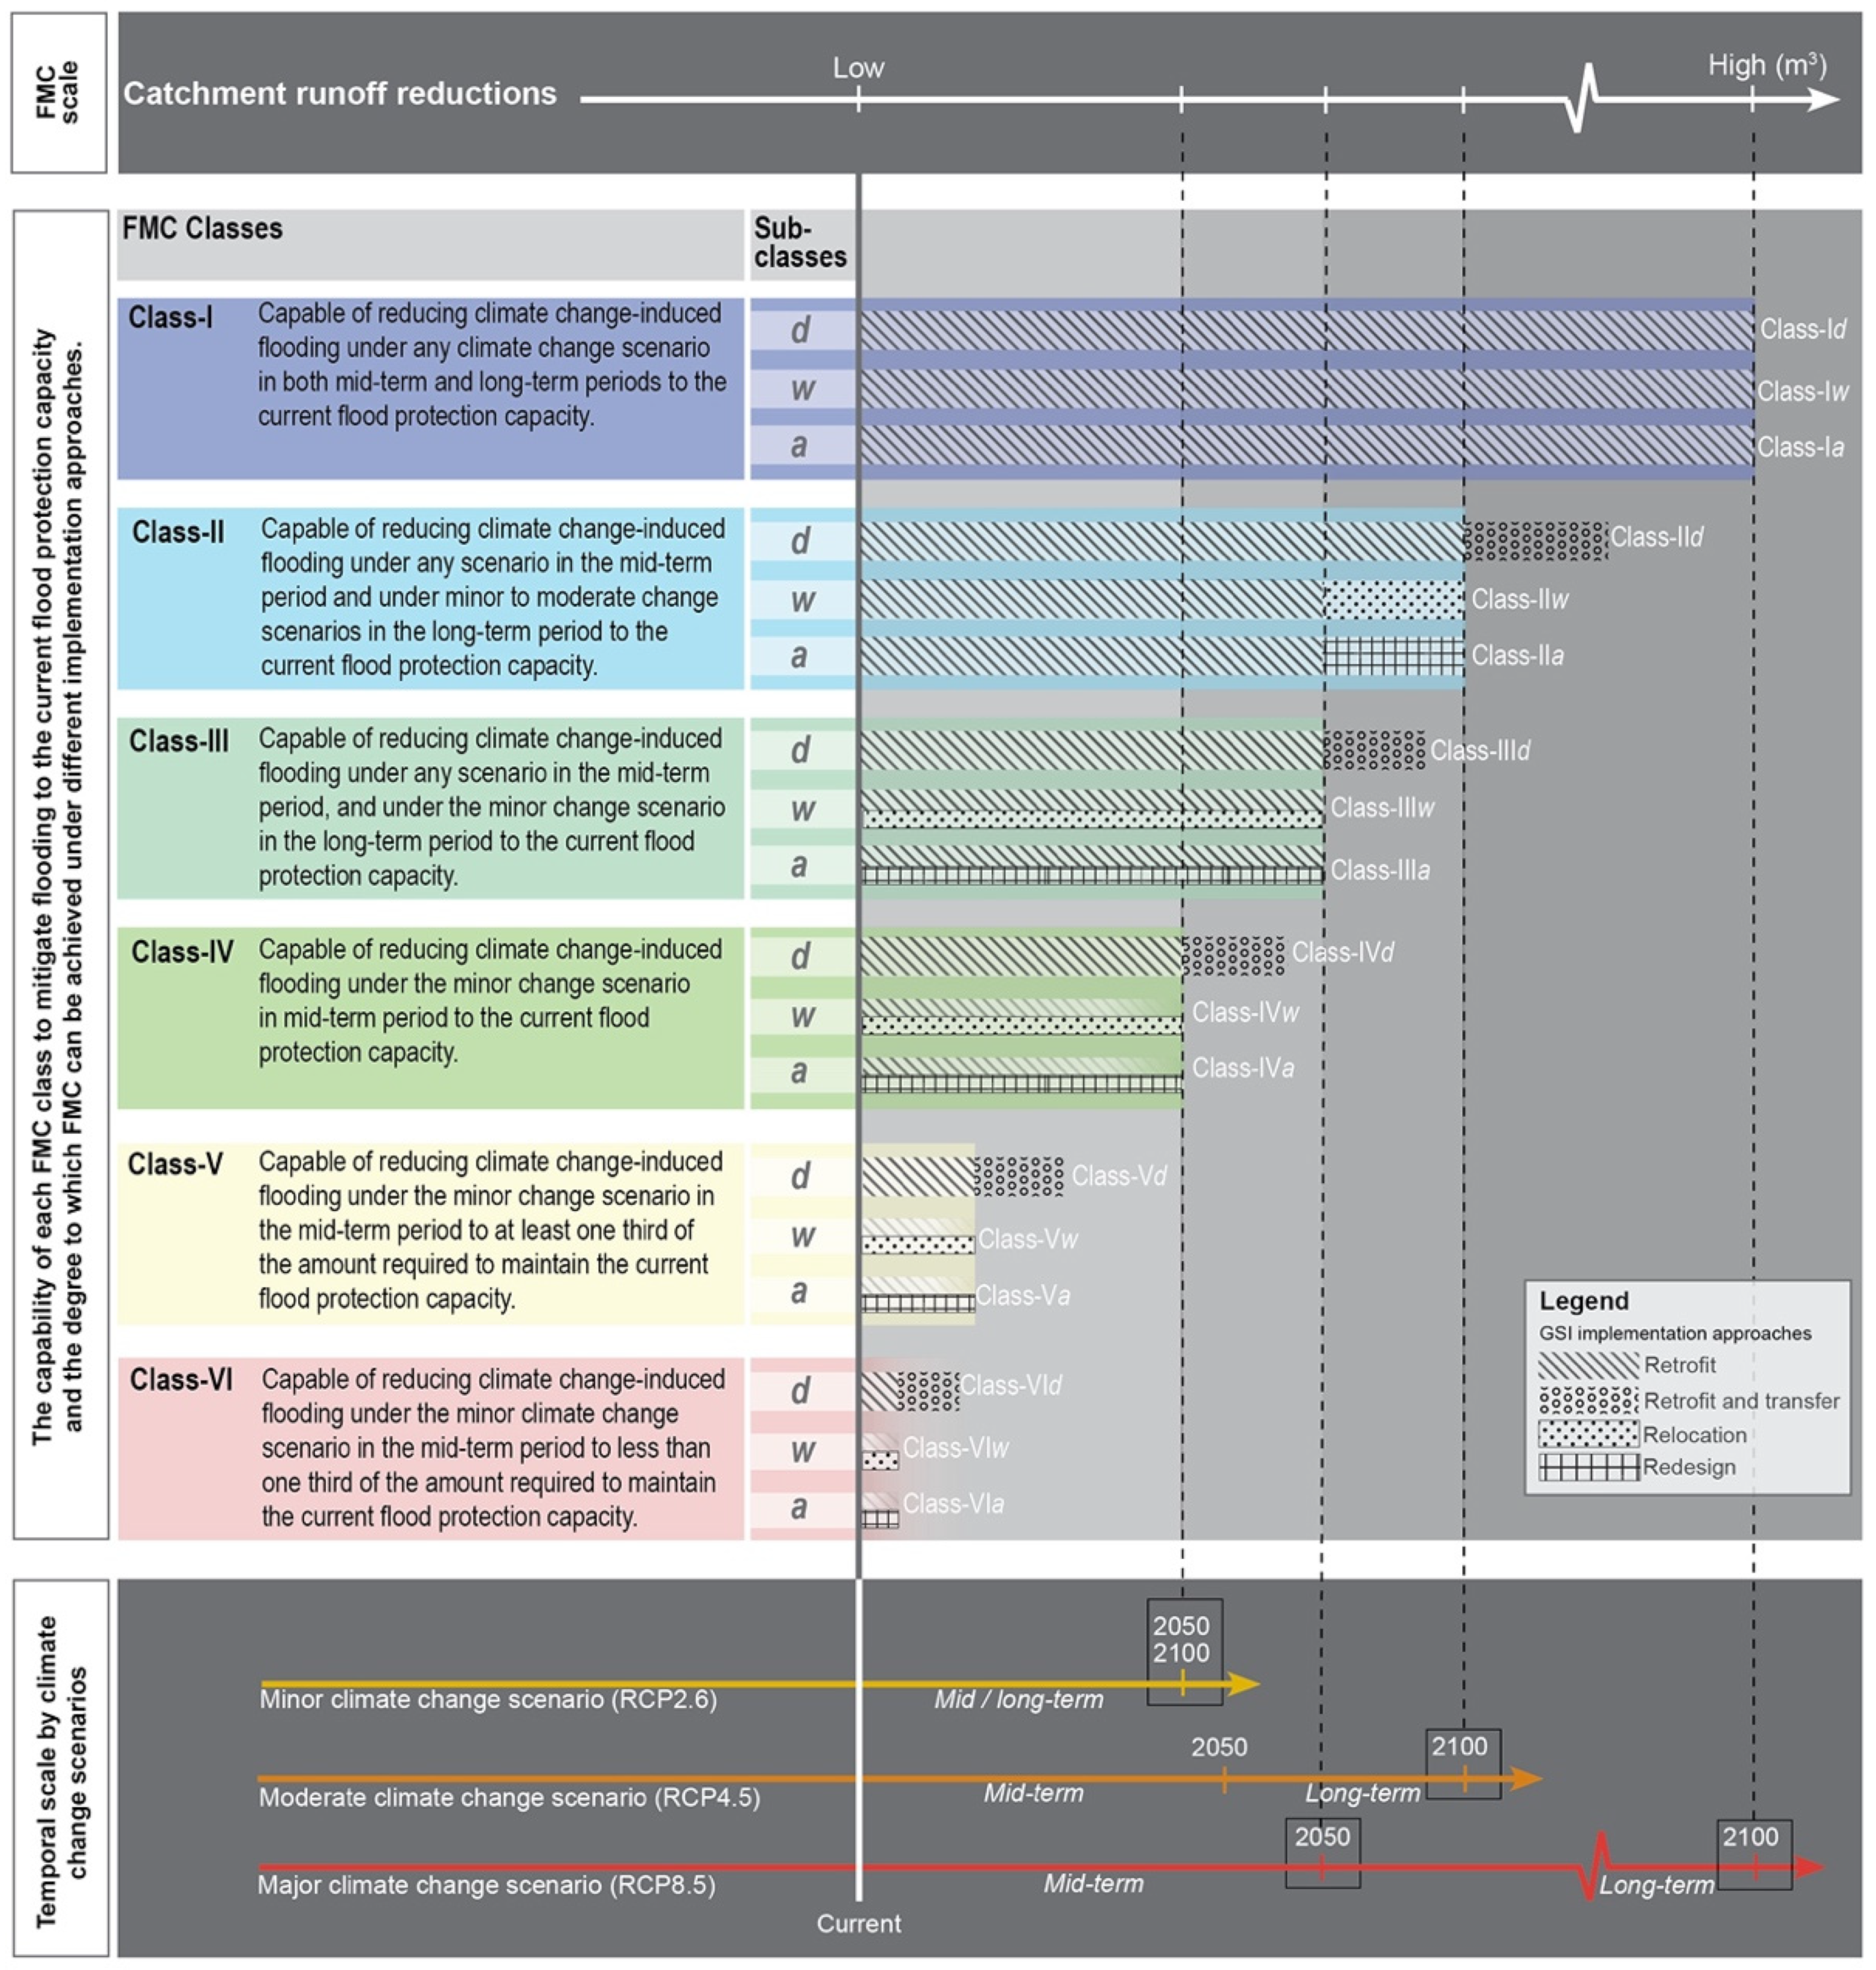
In Step 4, using the FMC classification system (Figure 3), the SWM zones are grouped into six classes ranging from high (Class-I) to low FMC (Class-VI). Then, zones are categorised based on their key limiting factors influencing FMC levels: the size of drainage area (Sub-class d), the groundwater level (Sub-class w), and the potential GSI area (Sub-class a). There is a variety of implementation approaches which have the potential to meet different levels of FMC depending on the results of classification (Figure 3). A retrofit approach requires minor changes in potential GSI areas with minimum disruption of existing land use. When the retrofitted GSI facility also receives water from an adjacent SWM zone, the approach is referred to as a retrofit and transfer implementation approach. A redesign approach requires more significant changes in the existing land use to maximise GSI storage capacity. Finally, in a relocation approach, the current land use is replaced by GSI completely and placed elsewhere. For example, this may be desirable on properties where the level, or impacts, of flooding are unacceptable and cannot be mitigated.
FMC assessment and classification were conducted in mid-term (2031–2050) and long-term (2081–2100) periods under different climate change scenarios, which corresponded to the Representative Concentration Pathways (RCP) proposed by the Intergovernmental Panel on Climate Change (IPCC; 2014, 2022). RCP2.6, RCP4.5 and RCP 8.5 were selected to represent minor, moderate, and major climate change scenarios, respectively.

2.2.1. Geographic Information to Define SWM Zones

Industrial SWM zones in the Heathcote River catchment were defined by drainage area boundaries associated with common drainage outlets of industrial properties, which are spatially connected. A 2018 one-metre Digital Elevation Model (DEM) was used to indicate the direction of surface runoff flowing into waterways and stormwater pipeline systems. The cadastral map depicting property boundaries was used to align zone boundaries with land ownership.
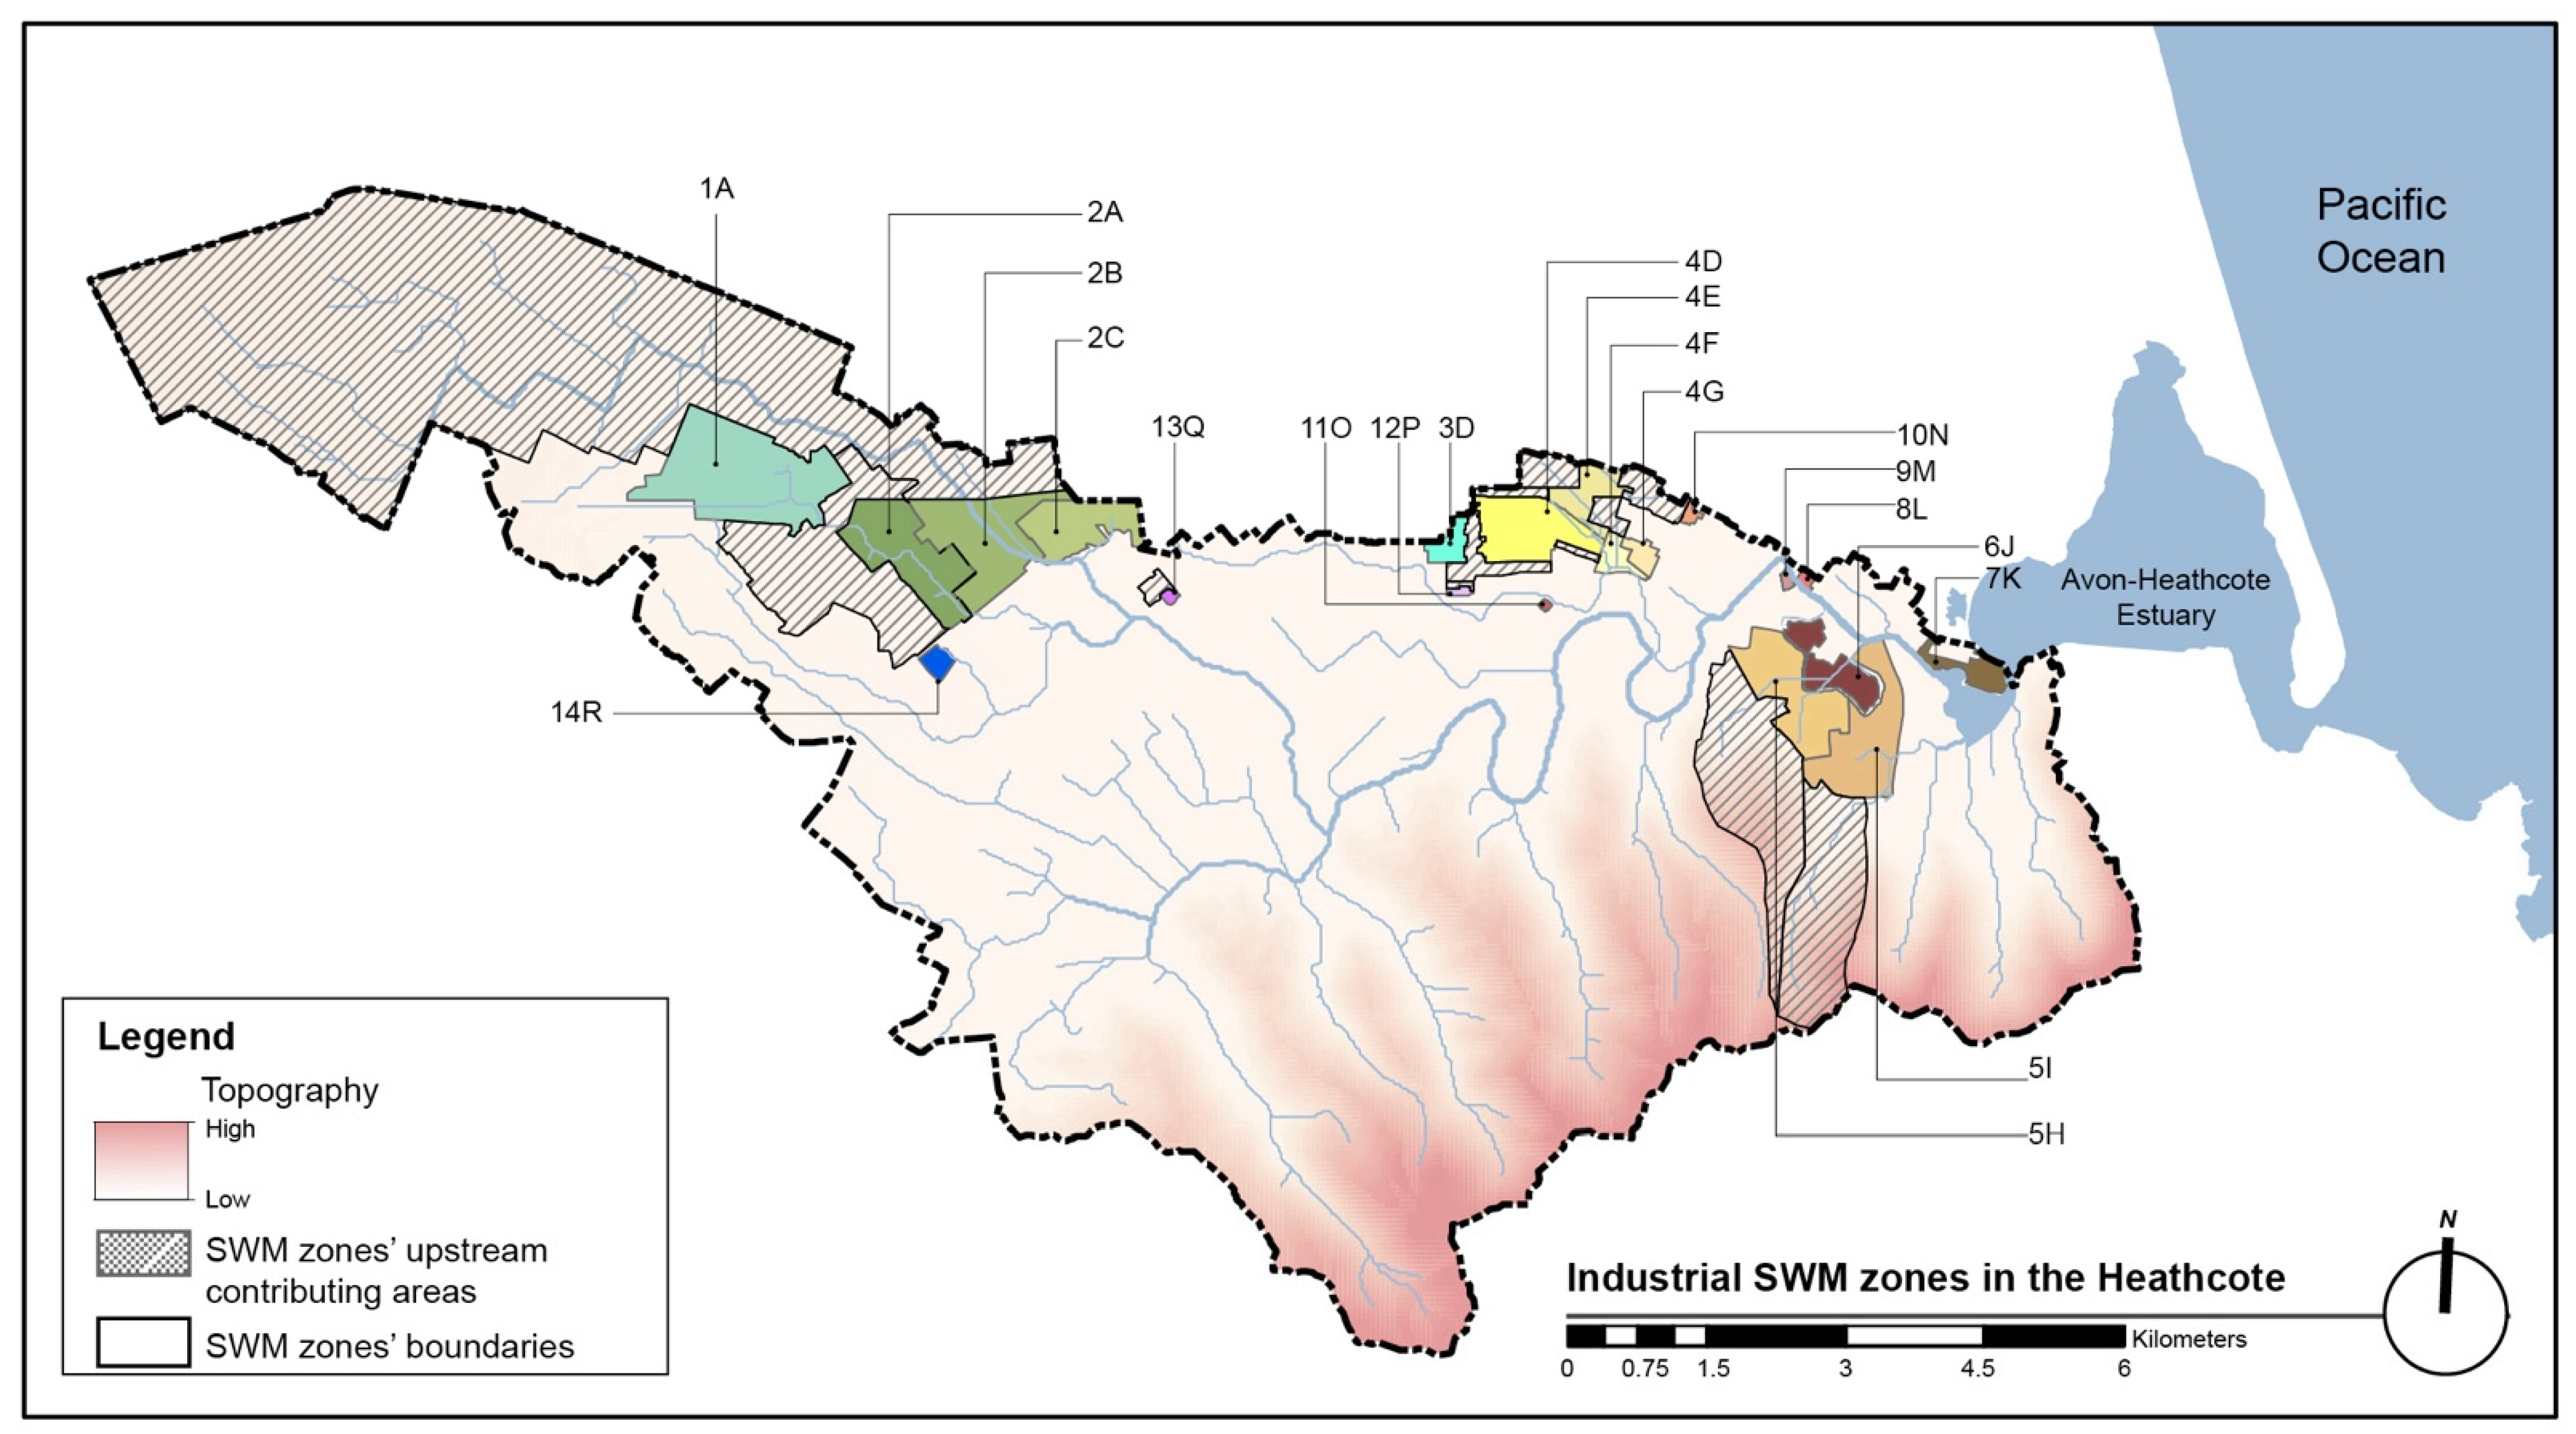
Delineation of boundaries resulted in 20 SWM zones with areas ranging from 1.78 km2 to 0.01 km2 (Figure 4). All were located on flat land, with elevations of 2 to 27 m. Depth to maximum high groundwater ranged from less than one metre to greater than six metres. Nine out of twenty SWM zones had upstream contributing areas from which runoff could be captured. These areas accounted for 0.5–17 times corresponding zone areas (Table 1). Zone drainage areas included the upstream contributing area and were used to calculate runoff volumes flowing through drainage outlets.

2.2.2. Hydrological Information to Calculate Runoff Volumes Generated from a Zone’s Drainage Area

The runoff flow at the zone’s drainage outlet was calculated using the Rational Method equation stated in Pilgrim and Institution of Engineers Australia [31]: Q = 0.278 C I A , where Q is the runoff peak flow at a zone’s outlet (m3/s), C is the average runoff coefficient of a zone’s drainage area (–), I is rainfall intensity (mm/h) for a selected storm with a duration equal to a critical period, and A is the size of a designed drainage area (km2). The Rational Method has been used to calculate runoff from a wide range of drainage areas [32,33,34], including catchments the size of the Heathcote. Many scholars argue it is beneficial for conducting initial assessments of runoff for the purpose of strategic flood mitigation planning [35,36,37], which is the purpose of this research. Its use allows planners to evaluate the potential of alternative strategies during the concept approval phase prior to detailed design, which involves more advanced modelling to confirm the effectiveness of proposed strategies.
The 50-year storm with a critical duration was selected for calculation as it is currently used as the design storm associated with the current flood protection capacity [30]. As the Heathcote River flows freely to the open sea, the critical storm duration, which could overwhelm the primary drainage system and cause flooding downstream, is equivalent to the catchment time of concentration (Tc) [38]. This point of time indicates when the peak flow at the catchment outlet would occur once all runoff from every part of the catchment reaches the outlet. Retaining runoff on-site during this period is assumed to be a minimum requirement for maintaining the peak flow below the current capacity or delaying the time of peak flow during storm events longer than Tc. Tc for the Heathcote River catchment is about 16 h [17]. It was calculated based on Friend’s equation for estimating the time of entry that overland flow at the most remote point takes to enter a drainage pipe/channel and Manning’s equation for estimating the time of network flow [23]. The runoff volumes generated in the SWM zone’s drainage area were then calculated by multiplying the peak flow at the SWM zone’s outlet (QSWMzone) by the catchment time of concentration (16 h). This calculation of the flow volume was based on a triangular hydrograph in which Tc is equal to recession time [39]. The runoff volume estimated in this study was validated with the hydrograph of the 5-year storm observed at the monitoring station (the location presented in Figure 1) on 16 December 2021, which was the highest rainfall intensity during 2019–2021. Tc at the monitoring station was estimated using both equations, which yielded the result of 13.7 h. According to the hydrograph (see Figure S1), the 12.5 h from the centroid of the first rainfall peak to the point of inflection on the first falling limb indicated the observed Tc for the drainage area of the monitoring station [40]. Due to the difficulty in observing Tc at the outlet of a coastal catchment, Tc used in our runoff modelling was estimated. Although our estimate is slightly longer than that resulting from observation, FMC will be underestimated, and thus, the potential of industrial zone to mitigate flooding remains true.
Runoff coefficient values used in our runoff calculation (CRM) were determined by the Rational Method. They are specified by local and national authorities, including Christchurch City Council [23] and Land Transport New Zealand [41], which are credible management agencies with long and carefully curated monitoring data. The CRM values depend on three factors: soil texture, land cover, and slope. They were analysed and overlaid in ArcGIS 10.6 to delineate areas representing different values of runoff coefficients, resulting in a CRM value of 0.5. This modelled CRM was higher by only 4% than the observed volumetric runoff coefficient (CVol) of the rainfall-runoff event on 16 December 2021 at the monitoring station (Table S1). CVol was calculated from the rainfall hyetograph and runoff hydrograph of this event (Figure S1). As the storm event used for calibration was a 5-year storm, CVol was multiplied by the value presented in Table S2 to arrive at CVol for a 50-year storm.
With respect to variations in rainfall intensities over a large catchment, the rainfall intensity data was gathered from 14 weather stations across the catchment. The catchment was divided into four different rainfall intensity zones. The zones were defined based on the topography and elevation having similar ranges of rainfall intensities. The average rainfall intensities of each rainfall zone were used to calculate runoff volumes.
Historical records of rainfall intensity and projections of climate change-induced increased rainfall intensity were retrieved from the National Institute of Water and Atmospheric Research (NIWA; https://niwa.co.nz/information-services/hirds (accessed on 28 November 2021)). Future rainfall intensities were projected using the High-Intensity Rainfall Design System (HIRDS) version 4 [42]. The average rainfall intensity of the current 50-year storm for a 16 h duration is about 7.4 mm/h. This intensity is expected to increase by 5.3%, 6.6%, and 7.5% in the mid-term period (2031–2050) under RCP2.6, RCP4.5, and RCP8.5, respectively. In the long-term period (2081–2100), rainfall intensity will continue to rise under RCP4.5 and RCP8.5 by 10.4% and 19.7%, respectively, from the current level [43].

2.2.3. Geographic Information to Estimate the Potential In-Ground Storage Capacity of Each Zone

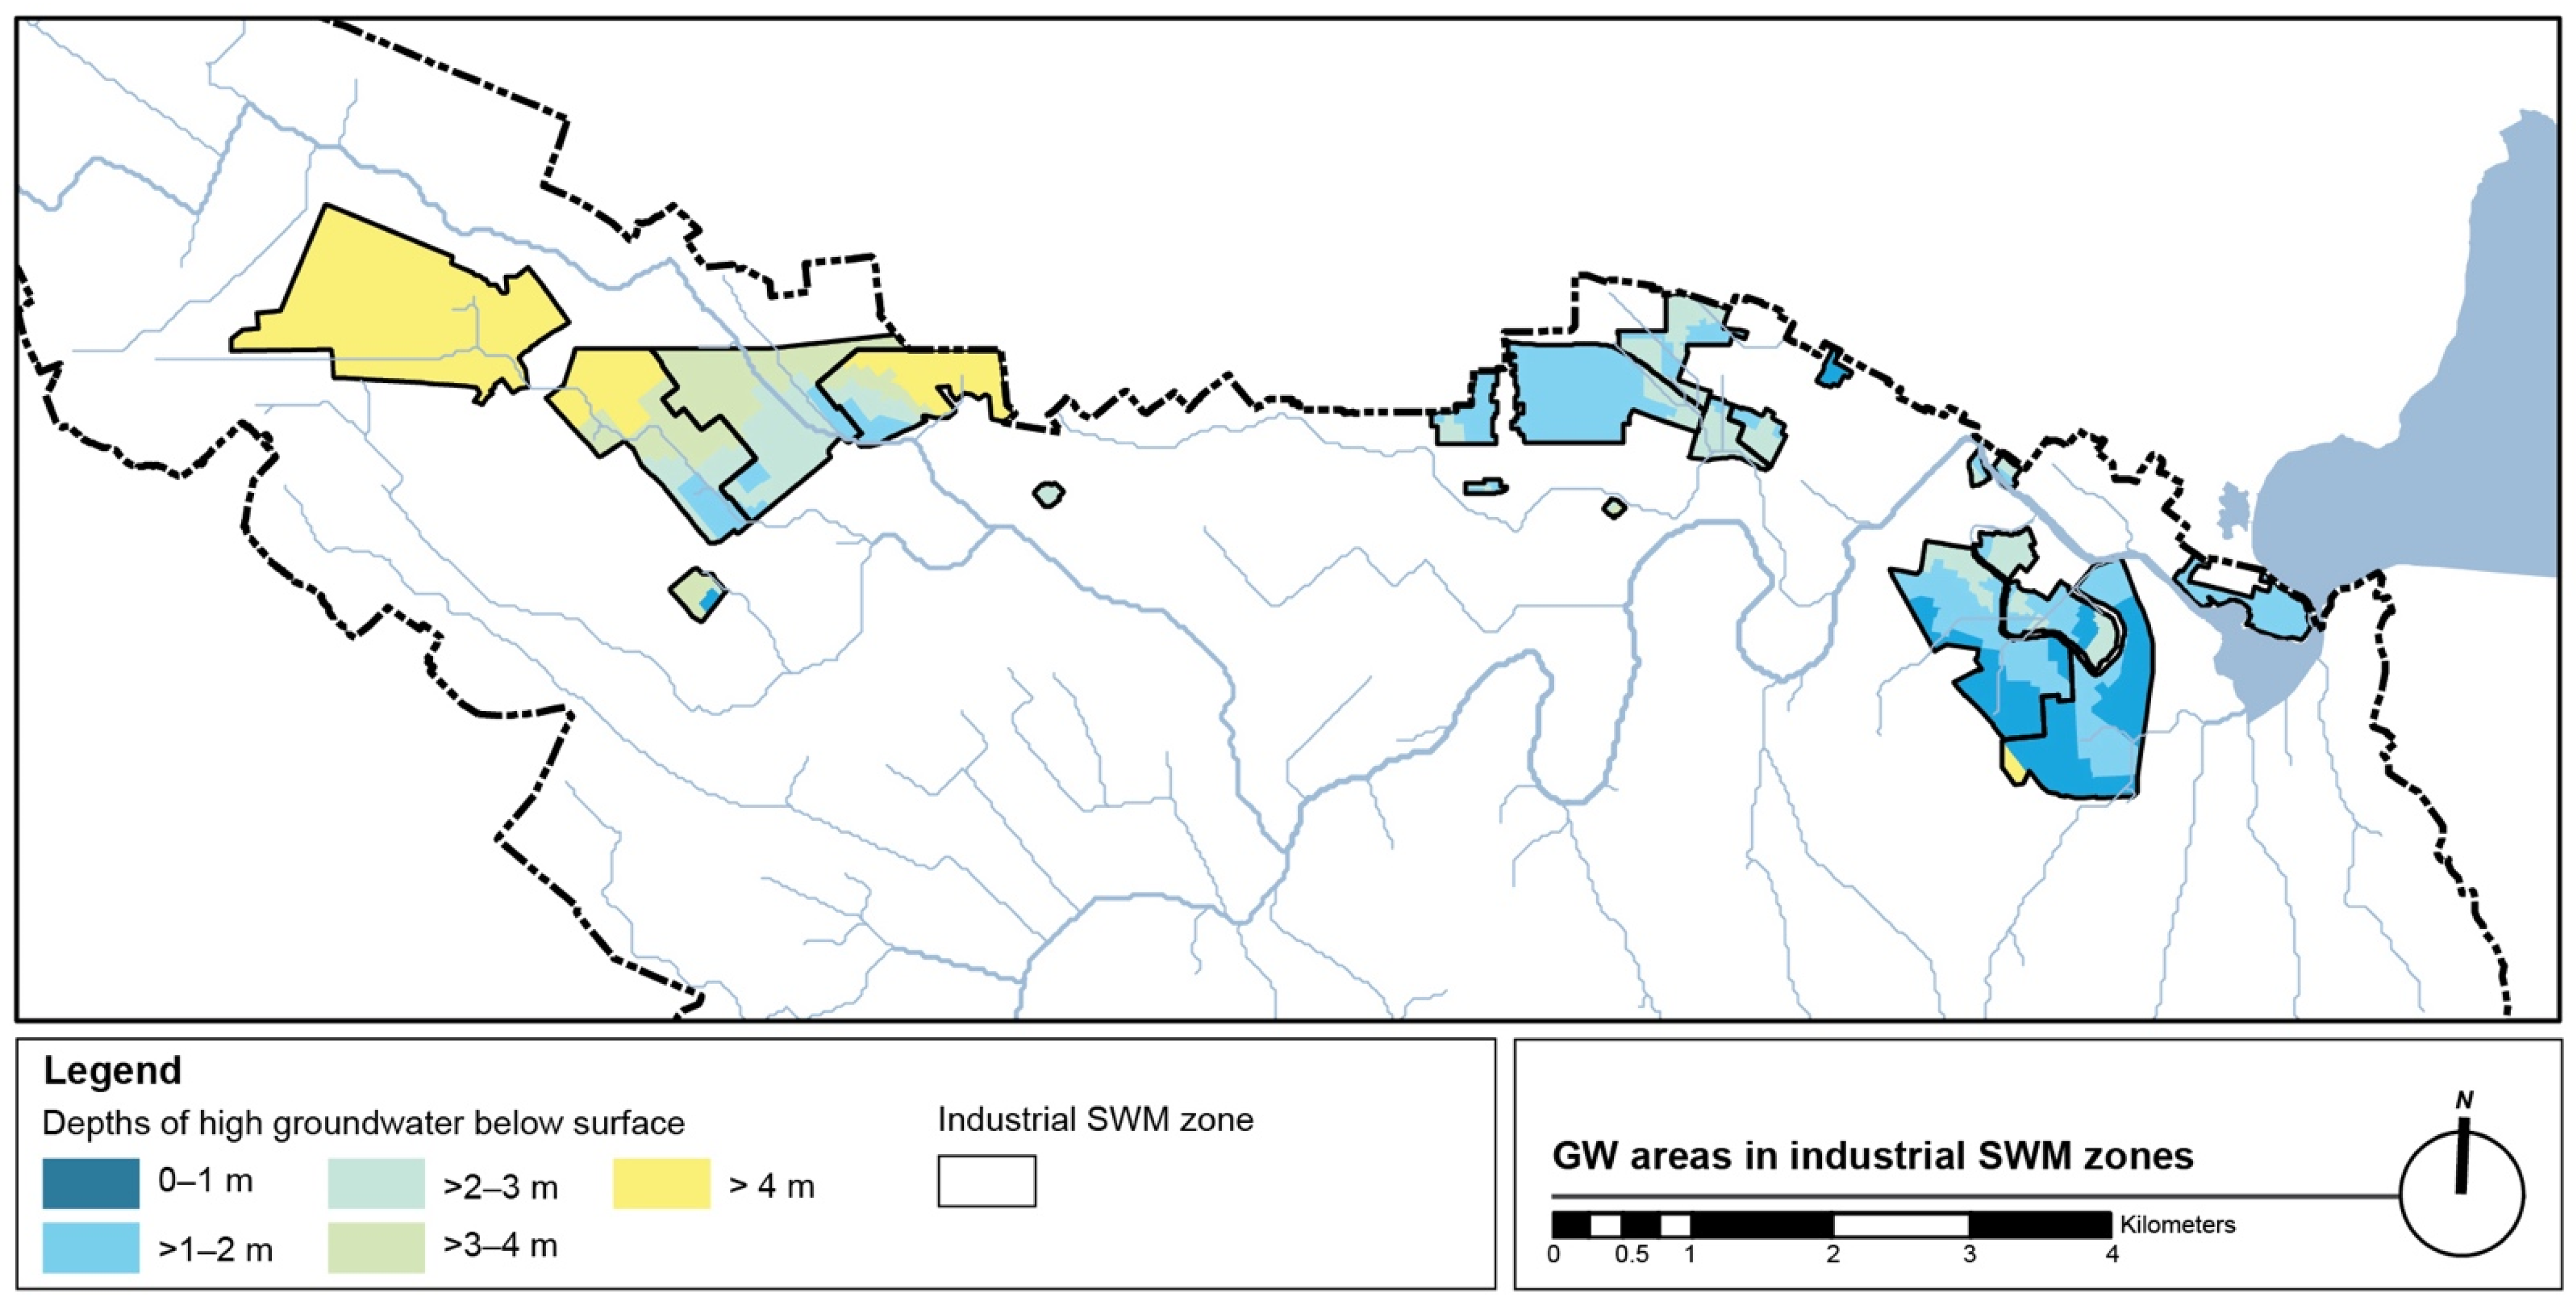
The in-ground storage capacity was estimated by multiplying the potential GSI area by the maximum depth of in-ground storage. In this study, a potential GSI area is defined as the area of an industrial property outside of buildings, public or shared roads, and railways [44]. The amount of potential GSI area within each SWM zone ranged from 15% to 93% of zone areas (Table 1). Where SWM zones have a wide range of maximum high groundwater, different groundwater areas (GW areas) were defined to identify the maximum in-ground storage depth. GW areas were classified into five categories: 0–1 m, >1–2 m, >2–3 m, >3–4 m and >4 m below the ground based on the maximum high groundwater level recorded in September 2010 and June 2011 [45] (Figure 5 and Table 1). However, the groundwater levels will rise with seawater levels [46] in response to different climate scenarios and periods. For Christchurch, the sea level is expected to rise by a maximum of 0.3 m in the mid-term period, with minor variations among climate change scenarios. However, there is a wide range of rising sea levels projected between different scenarios in the long-term period. A rise of 0.65 m is expected under RCP2.6, 0.75 m under RCP4.5, and 1.15 m under RCP8.5 [47,48]. These rises in sea level included the upper value of additional offset for New Zealand of 0.05 m. Sea levels around New Zealand’s coastline are anticipated to be higher than average global sea level rise due to a faster rate of tectonic subsidence [48]. In New Zealand, a 60 cm of minimum separation depth between the bottom of GSI facilities and the high groundwater is required [49].

2.2.4. Hydrological Information to Identify Runoff Reductions for Maintaining a Flood Protection Objective

The FMC of each SWM zone was assessed by comparing the zone’s collectable runoff volume with the runoff reduction needed to reduce climate change-induced flooding under different climate change scenarios and periods below the current flood protection capacity. This indicates the extent to which an individual zone can maintain a catchment flood protection objective through time with climate change. The flood protection objective for the Heathcote River catchment is to handle a maximum runoff volume corresponding to a 50-year storm during the critical storm duration (Tc = 16 h). The current catchment runoff volume of this design storm was modelled using the Rational Method which resulted in 6.51 million m3 [17]. Catchment runoff reductions required to maintain this flood protection objective during the mid-term period were about 0.37, 0.46, and 0.53 million m3 under RCPs 2.6, 4.5, and 8.5, respectively. Larger reductions in catchment runoff would be required in the long-term period under RCPs 4.5 and 8.5, about 0.75 and 1.6 million m3, respectively, but not under RCP 2.6 [17].

3. Results

3.1. Industrial SWM Zone Classification and Identification of Implementation Approaches

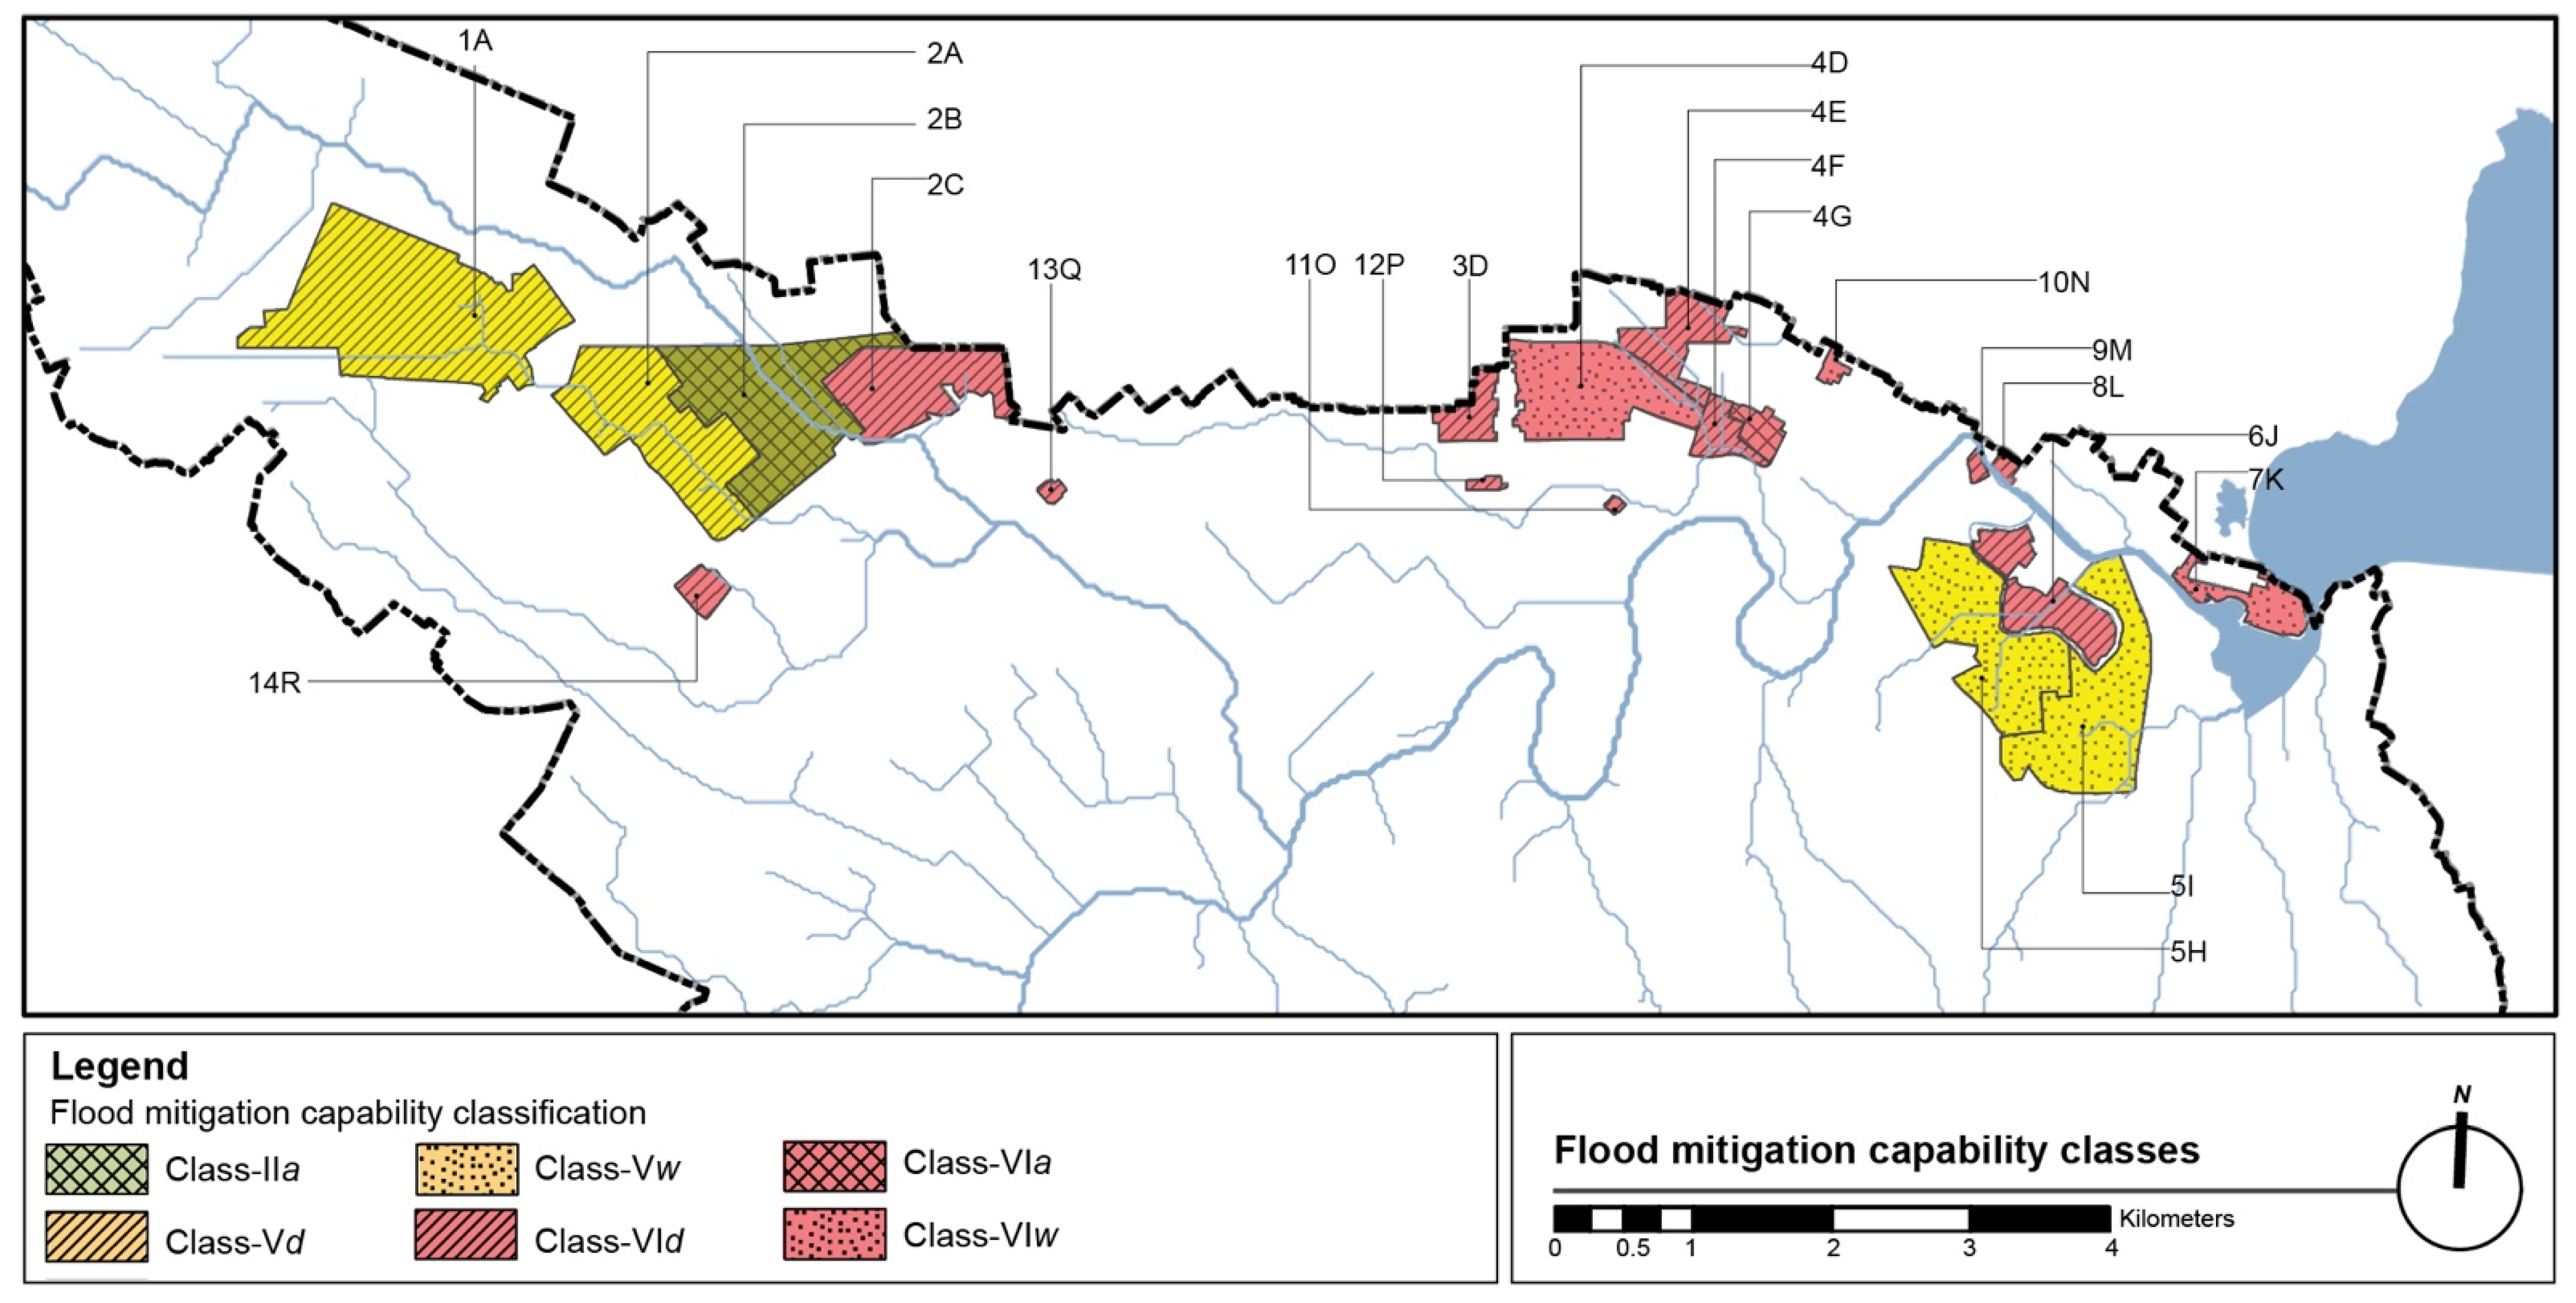
The results indicated that among 20 industrial SWM zones in the Heathcote River catchment, one zone had the highest FMC to offset the impacts of climate change-induced flooding under the moderate climate change scenario up to the long-term period (Class-II). Four zones significantly reduced catchment runoff volume, although they could not mitigate climate change-induced flooding to below the current level by themselves (Class-V). The other 15 zones had relatively limited FMCs to contribute to catchment runoff reduction (Class-VI). The majority of the industrial SWM zones (13 zones) had the size of drainage area (d) as the key limiting factor. This was followed by five zones having high groundwater level (w) as a key limiting factor, and two zones had the amount of potential GSI area (a) limiting their FMCs. The variations in FMCs and limiting factors resulted in their categorisation into six different SWM zone combinations of class (FMC level) and sub-class (limiting factor) (Figure 6).

3.1.1. Class-IIa

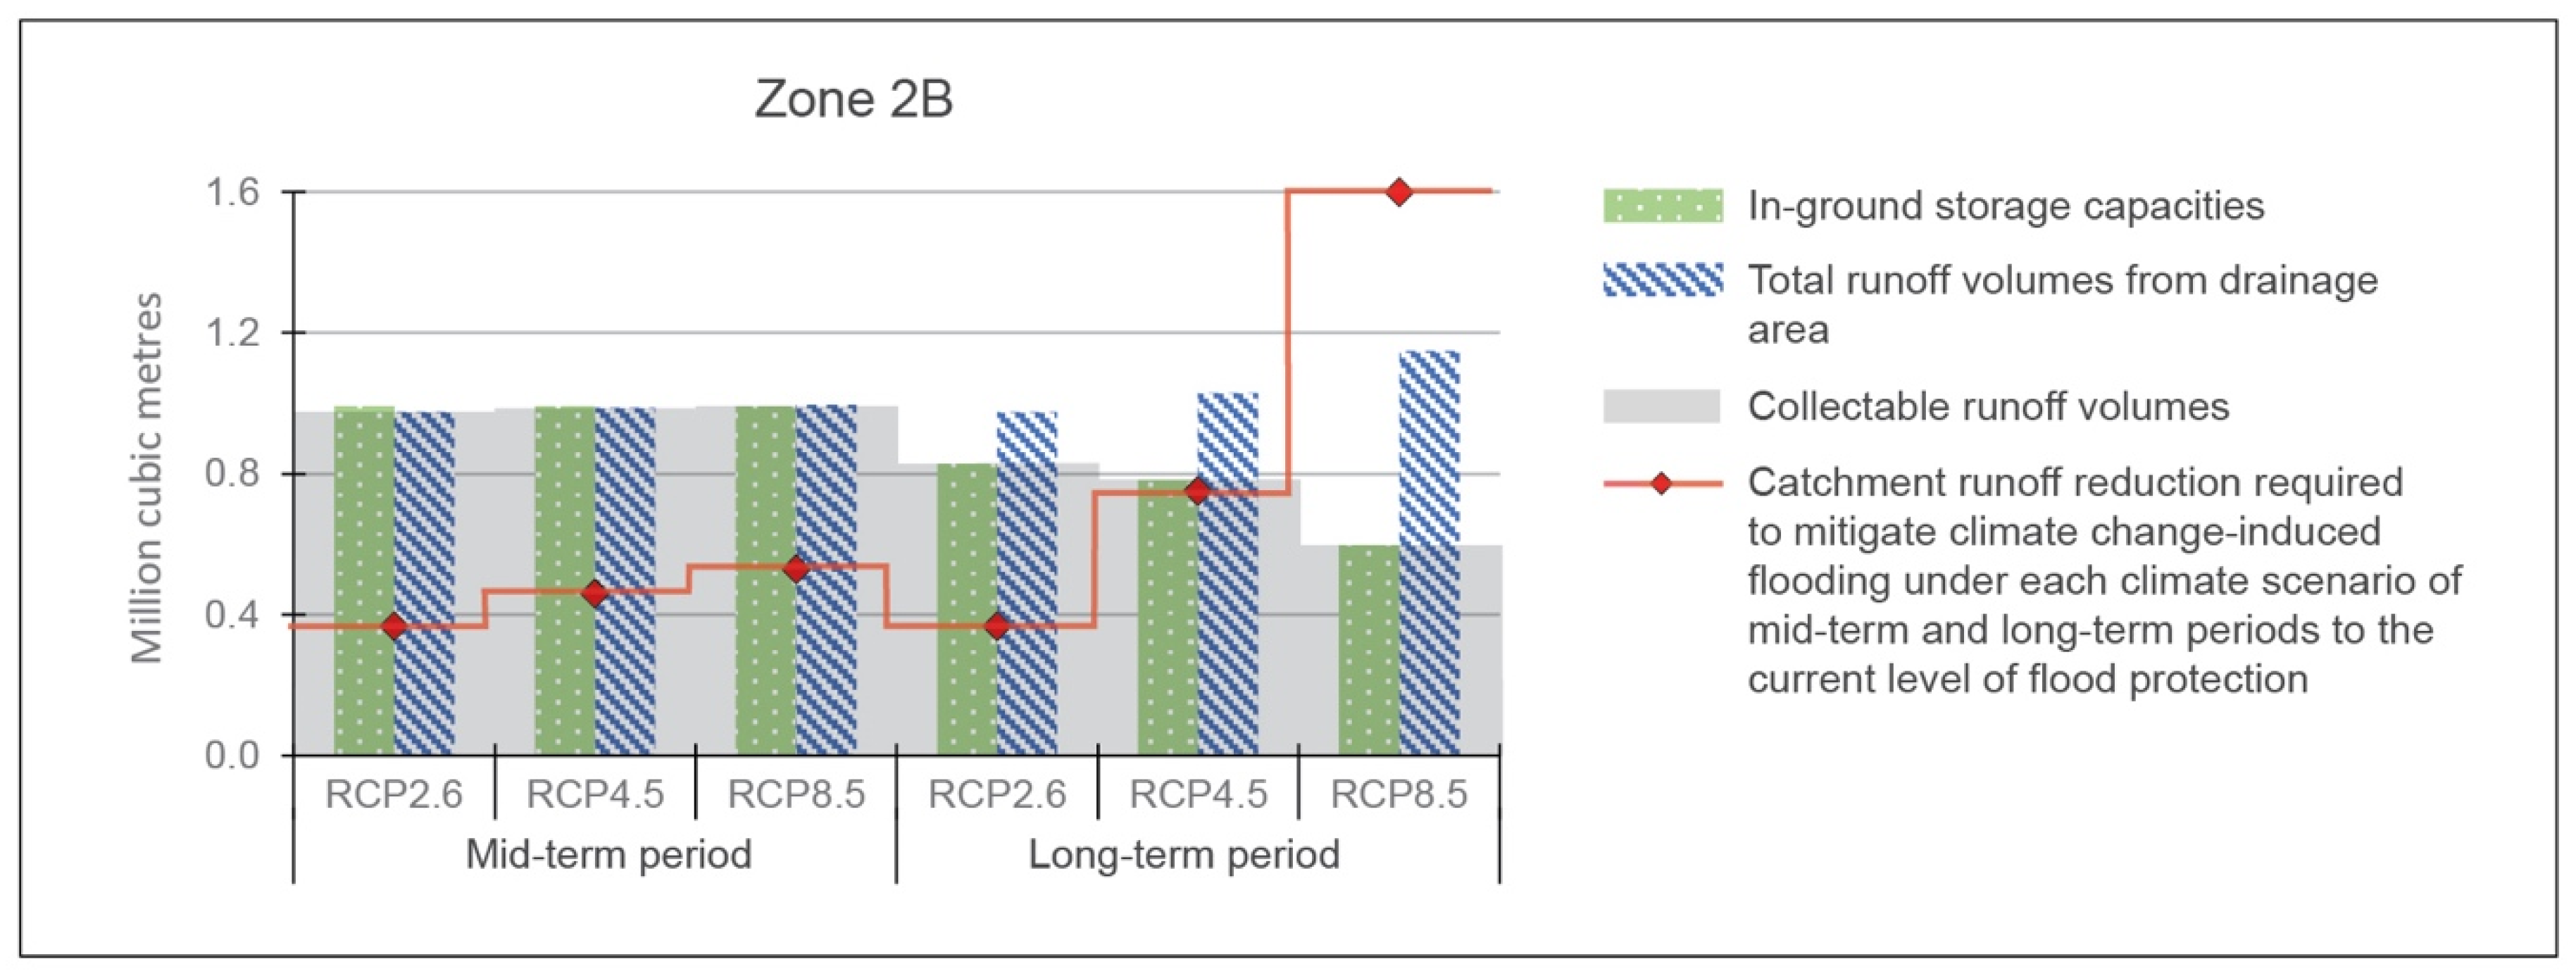
SWM zone 2B was classified as Class-IIa—the top classification level for the catchment. Implementing GSI in this zone at its maximum capability would offset the severity of climate change-induced flooding under any climate scenario over the mid-term period (2031–2050). In fact, the maximum FMC of this zone indicated that it could collect runoff volumes of about 190–260% of those required to maintain the flood protection objective. It could also offset the increased runoff volumes corresponding to the long-term 50-year storms under RCP2.6 and RCP4.5. However, under RCP8.5, this zone could only collect 37% of the required catchment runoff reduction (Figure 7).
The key limiting factor that determined the FMC level of this SWM zone was the amount of potential GSI area that occupied 45% of the zone area. Given this area, the in-ground storage capacity was not sufficient to collect all runoff from its large upstream contributing area, which was 17 times the area of the SWM zone, in the long-term period. Under RCP8.5, for the long term, only half of its total runoff volume would be able to be stored (Figure 7).
GSI in this zone could be implemented with the retrofit approach to achieve flood protection objectives under any climate scenario for the mid-term, as half of the potential GSI area was required. However, to provide its maximum FMC in the long term, the redesign approach would be necessary to optimise space in the industrial zone for GSI.

3.1.2. Class-Vd

SWM zones 1A and 2A were classified as Class-Vd. The results of their FMCs revealed they could collect 40% and 61%, respectively, of the runoff required to meet the flood protection objective under the minor climate change scenario (RCP2.6) in the mid-term period (Figure 8).
The key factor limiting their FMCs was the size of their drainage areas. Despite having the largest in-ground storage capacities compared with those of other zones, the total runoff volumes from Zone 1A and 2A drainage areas were equivalent to only 5% and 30% of their potential storage capacities, respectively, even under RCP8.5 in the long-term period. This was due to their drainage areas only occupying 1.6% and 2.9% of their catchment areas, respectively. If they were capable of collecting runoff from the larger upstream contributing areas, their FMCs would be higher.
A retrofit approach would be appropriate to implement GSI on these zones as a maximum FMC can be achieved on only a portion of the potential GSI area. GSI in these zones could be implemented in the near term, and their capability to collect total runoff volumes will not diminish in the far future. To improve their FMCs beyond these levels, planners might consider transferring excess runoff from other industrial properties or from other land uses adjacent to these zones into their GSI facilities via a pumping system.

3.1.3. Class-Vw

SWM zones 5H and 5I were classified as Class-Vw. The results of their FMCs indicated they could collect only 54% and 49% of runoff volumes, respectively, to offset the increased runoff volume under the minor climate change scenario (RCP2.6) to the current level in the mid-term (Figure 9).
The key limiting factor was their high groundwater levels (w), which limited their in-ground storage capacities, especially in the long term. Most of their areas (88% and 97%, respectively) were located on high groundwater less than 2 m below the surface. This meant they could only store total runoff volumes corresponding to any climate scenario over the mid-term, but runoff volumes would exceed their storage capacity in the long term. Furthermore, with rising sea levels in the longer term (predicted under the major climate change scenario), their capacities would be further reduced, enabling them to collect only 28% and 47% of runoff, respectively, from their drainage areas.
Considering their limited and diminishing water holding capacities, there is no way of mitigating the limitation posed by increasingly high groundwater levels. Their maximum FMCs could only be achieved by relocating their industrial land uses elsewhere and, perhaps, replacing them with wetlands. Retrofitting these zones for mid-term flood mitigation could be possible, but it would be unlikely to meet their maximum FMCs as almost all their potential GSI areas would be required.

3.1.4. Class-VIa/w/d

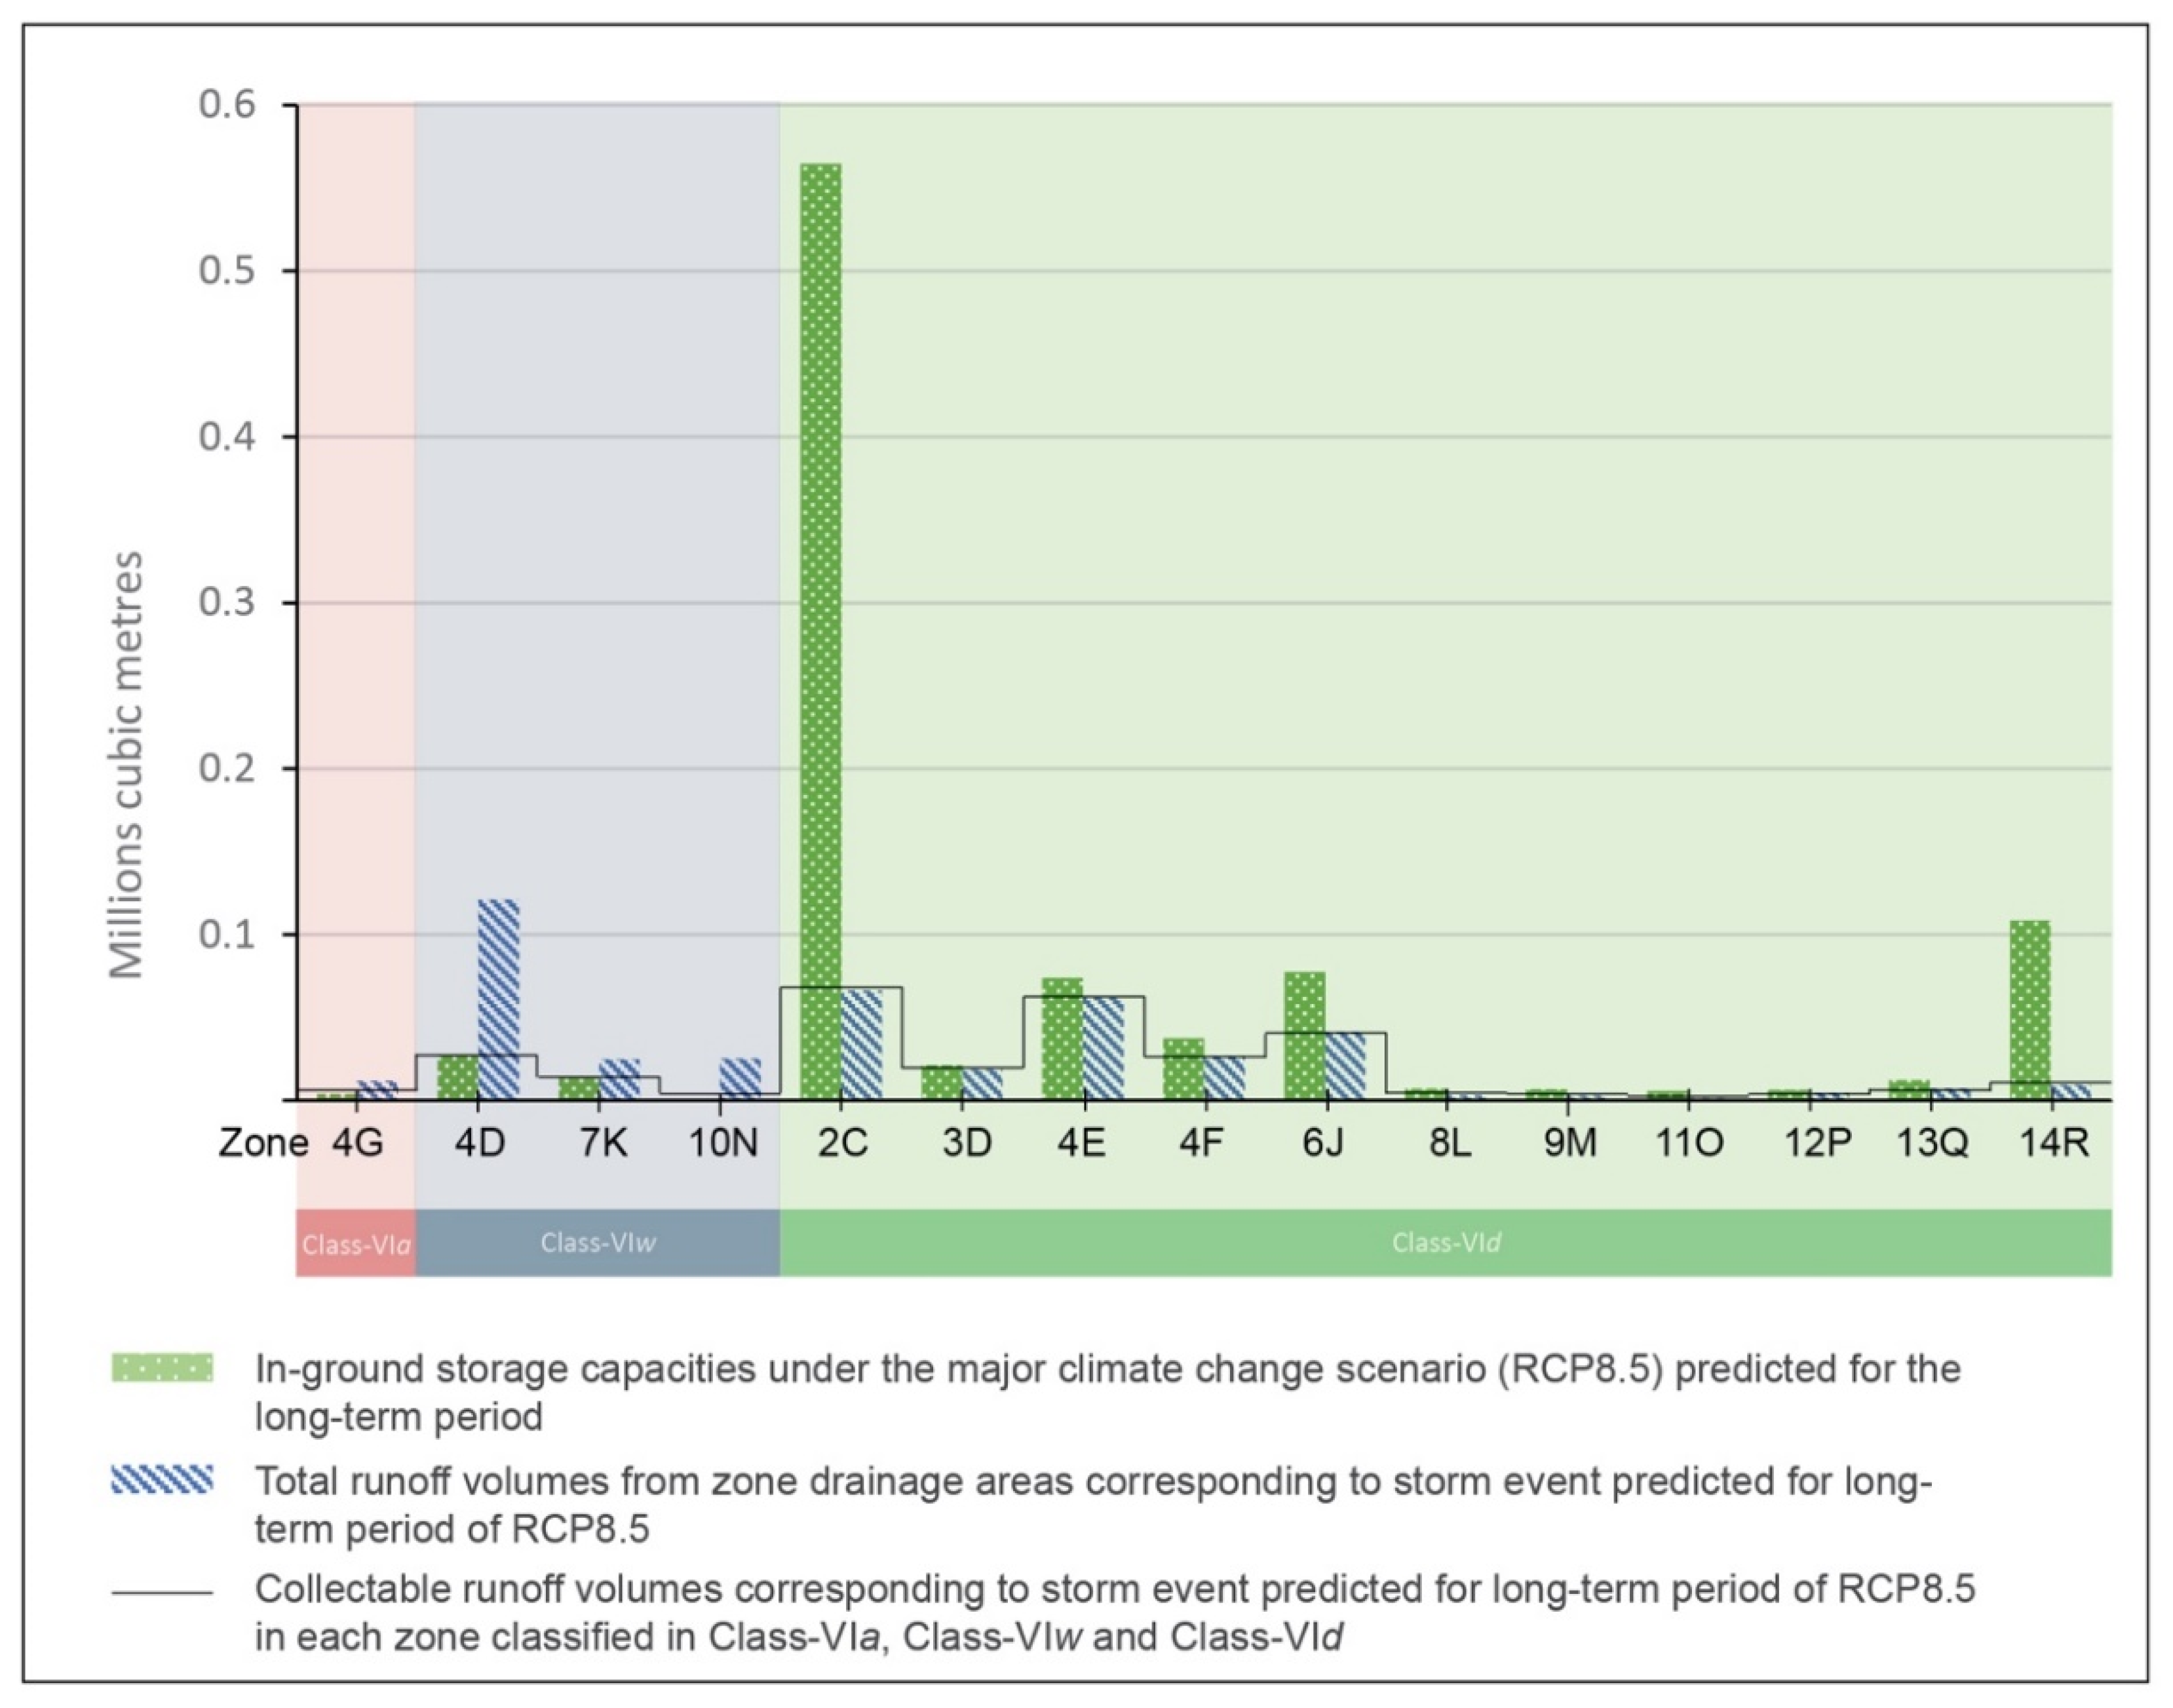
The fifteen SWM zones categorised as FMC class-VI had limited capabilities to mitigate climate change-induced flooding in both periods. Zone 4D had the highest FMC among others in this class but could only collect 25% of the runoff needed to reduce the increased flooding corresponding to the minor climate change scenario in the mid-term to the current level. Meanwhile, Zones 2C and 4E could collect only 15% of that required, and the remaining zones could collect less than 10% of that required (Figure 10).
The majority of the SWM zones (11 zones) grouped in this FMC class had the size of their drainage area as the key factor limiting their FMCs. Some of them had large excess in-ground storage capacities (Figure 11), which could be designed to receive runoff from adjacent SWM zones. For example, Zone 2C had almost 90% of its in-ground storage capacity available to store runoff from Zone 2B.
SWM zones 4D, 7K, and 10N had high groundwater as the key limiting factor. All areas in Zone 10N were on a high water table less than 1 m below the surface, which resulted in its inability to store any runoff even in the mid-term period. Zones 4D and 7K had most of their areas on a high water table 1–2 m below ground. This enabled them to only collect 22% and 54% of total runoff volumes from their drainage areas, respectively (Figure 11).
Only SWM zone 4G had a limited potential GSI area as a limiting factor. It accounted for only 15% of the zone area. This meant it was incapable of storing the total runoff volume corresponding to any climate change scenario projected for the long-term period. Under the major climate change scenario in the long-term period, only 33% of total runoff from its drainage area could be collected (Figure 11).

3.2. Prioritisation of Industrial SWM Zones for GSI Network Development in Support of Adaptive Flood Mitigation Planning

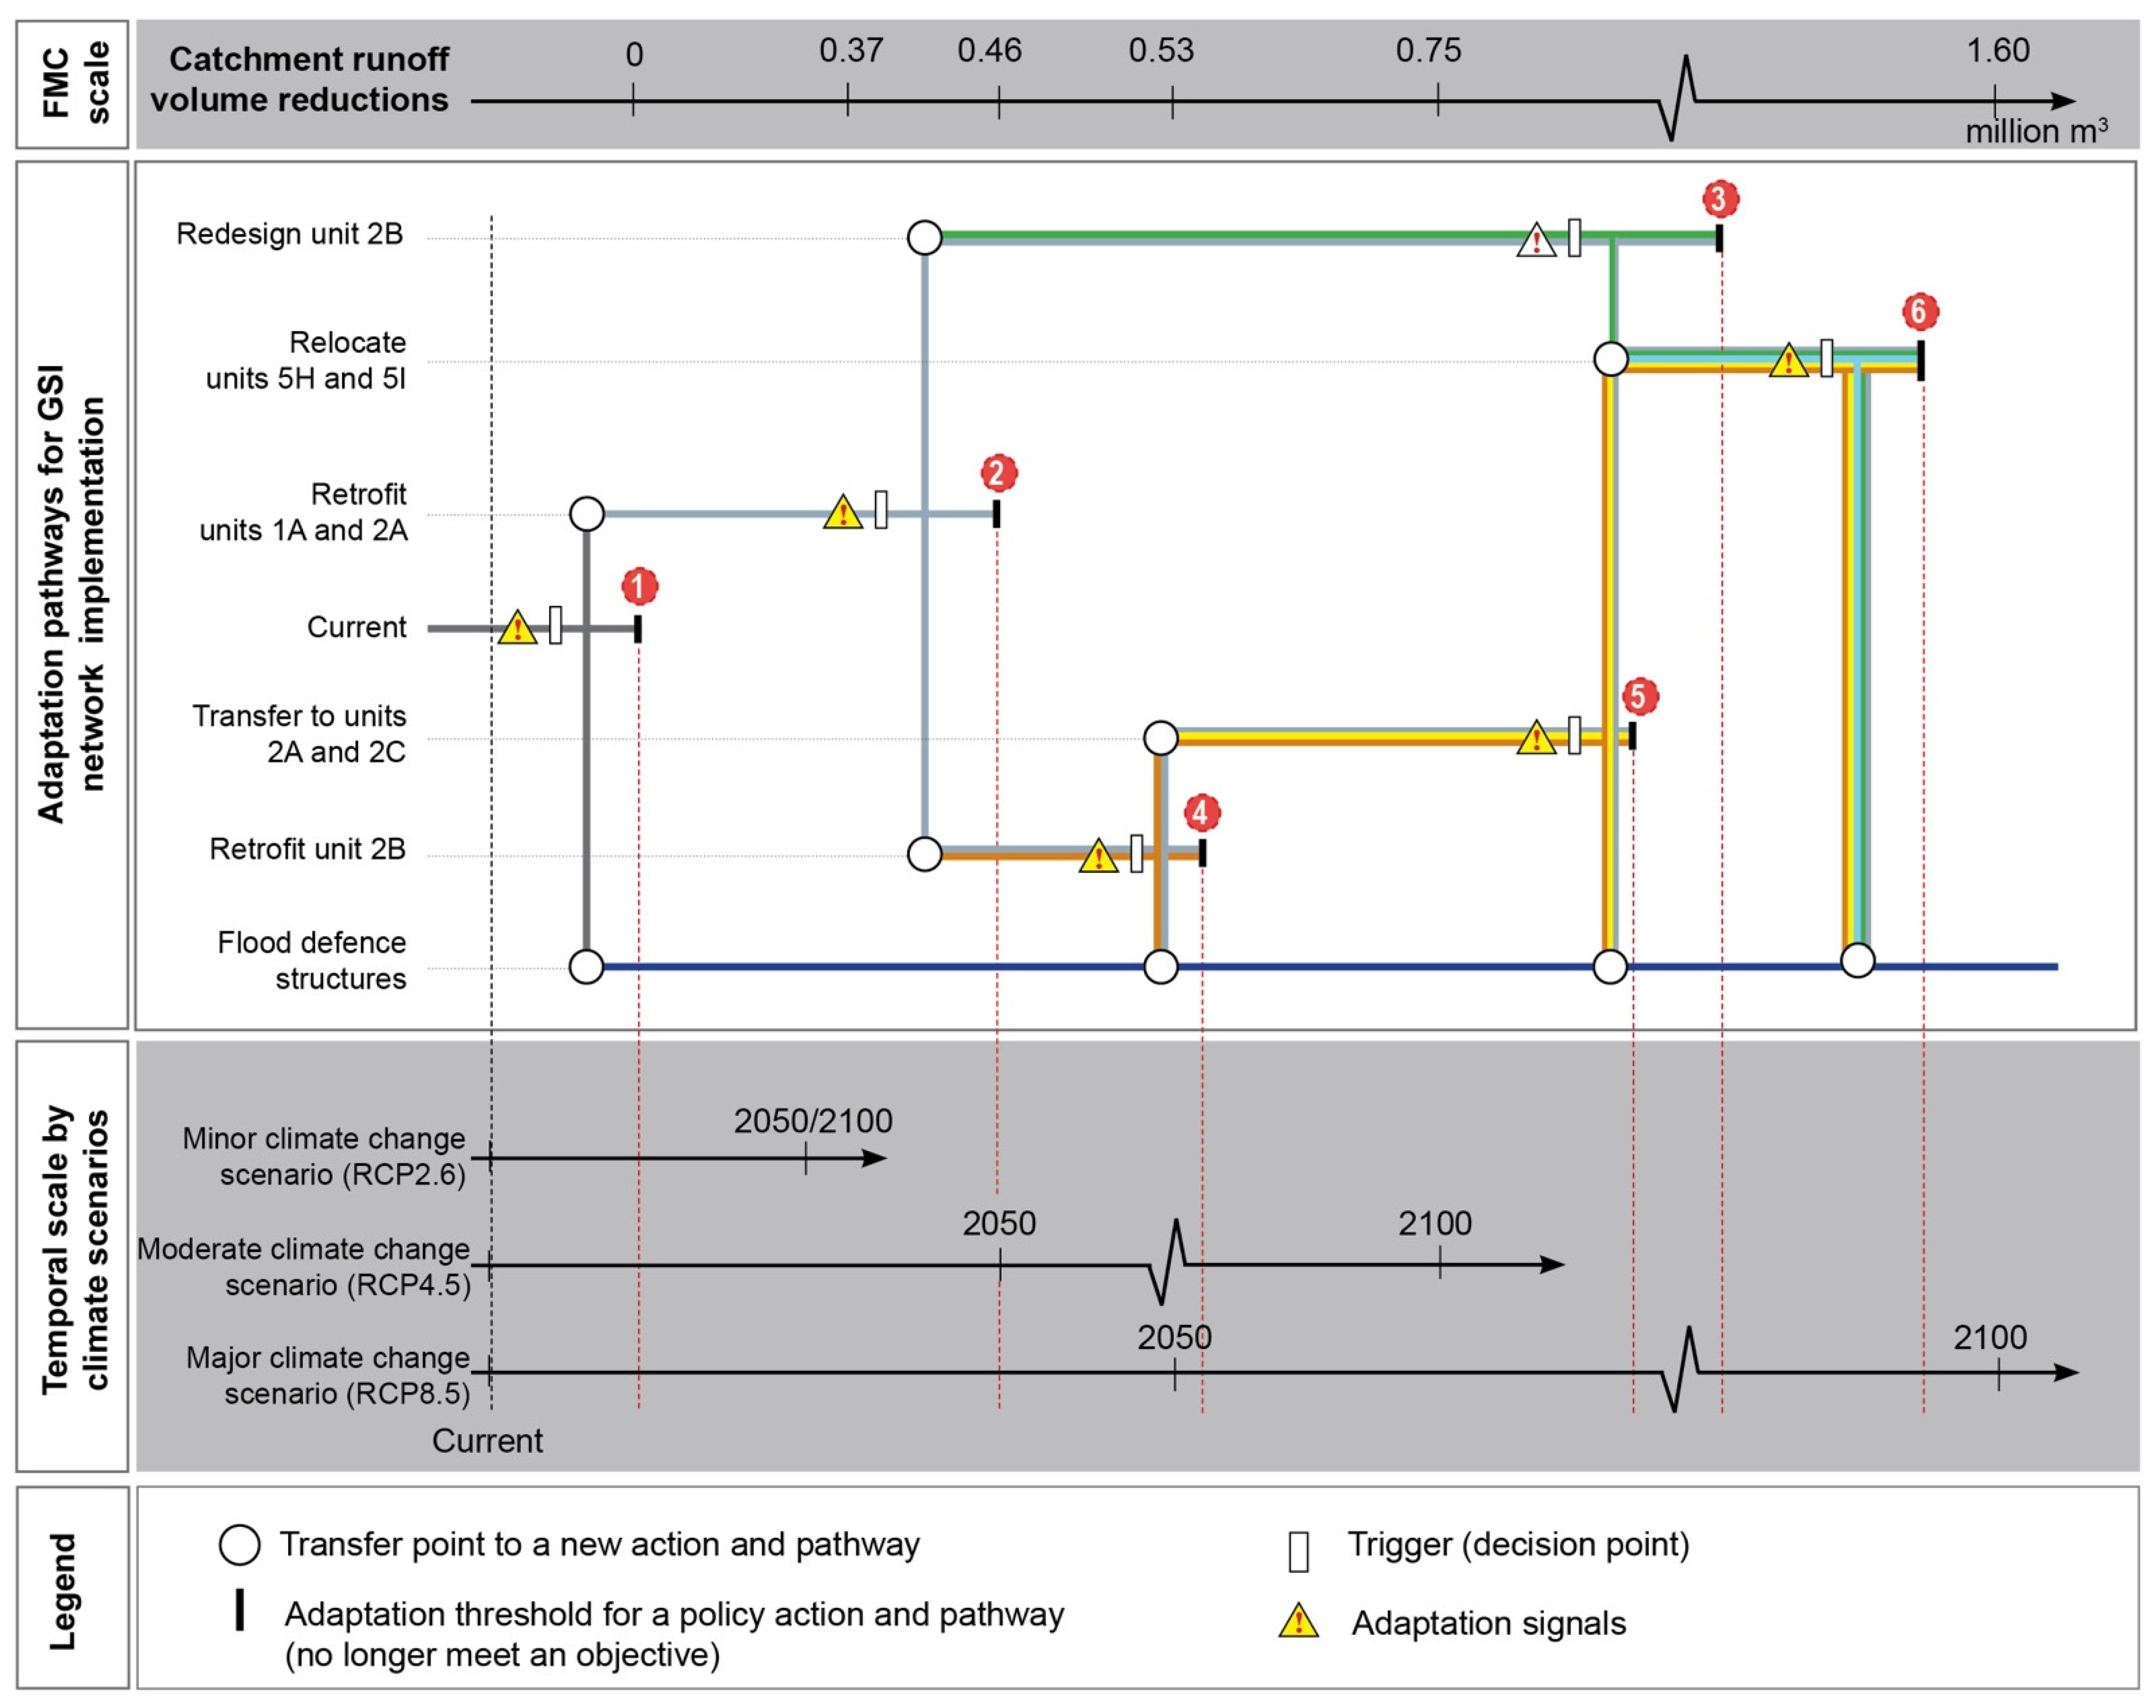
Here, we propose adaptation pathways to demonstrate the orchestration of GSI on the SWM zones through time to maximise their flood management effectiveness in the context of climate change (Figure 12). The adaptation pathways demonstrate how GSI in different SWM zones work together, incrementally, as a network in response to increased climate change impacts [50,51,52]. Six industrial SWM zones in the Heathcote River catchment (1A, 2A, 2B, 2C, 5H, and 5I) were prioritised to develop an effective GSI network due to their substantial flood mitigation capabilities.
With increased rainfall intensity, the existing flood mitigation protection provided by the City’s flood management system would become inadequate around the year 2030 (see Projected line 1 in Figure 12). Planners would then prioritise GSI implementation in Zone 1A and 2A to provide immediate supplemental flood mitigation. Their maximum FMCs could be most easily achieved through a retrofit implementation approach. Additionally, their capabilities to retain total runoff volumes from their drainage areas would be certain through time. If GSI is designed to maximise their FMCs, they could maintain the flood protection objective under the minor climate change scenario (RCP2.6). However, their threshold capacities would be reached around the middle of this century under the moderate climate change scenario (RCP4.5), and even earlier under the major climate change scenario (RCP8.5) (see projected line 2).
At this point, additional FMC would be needed. This could be provided by either redesigning or retrofitting Zone 2B. If the redesign approach is selected to maximise the FMC of Zone 2B, the long-term impact of climate change-induced flooding corresponding to the moderate climate change scenario could be offset to the current level (see Projected line 3). For the retrofit approach, only the mitigation of mid-term climate change-induced flooding under the major climate change scenario could be expected (assuming 40% of the potential GSI area in Zone 2B is retrofitted) (see Projected line 4). Following this pathway, the capability of the GSI network could be further increased to handle runoff associated with the moderate climate change scenario (RCP4.5) until the end of this century (see Projected line 5). This is when the excess runoff from Zone 2B could be transferred to Zones 2A and 2C. To achieve this flood protection level with the retrofit approach, only 40% of Zone 2A and 2C maximum in-ground capacities could be targeted for collecting runoff from their drainage areas and from transferred areas.
At this point, GSI could be further implemented on Zones 5H and 5I through a relocation approach if the cost-effectiveness of other flood mitigation strategies is still considered uncertain, or the greater GSI network capacity is required to provide backup or redundant flood mitigation systems. The FMCs of Zones 5H and 5I could further enhance catchment flood protection just shy of that associated with the major climate change scenario up to the end of this century (see Projected line 6). Beyond this level of protection, other flood mitigation strategies would be needed.

4. Discussion

4.1. To What Extent Can Individual SWM Zones Mitigate Flooding in a Context of Climate Change?

The application of the HLCA+C methodology to the industrial SMW zones in the Heathcote River catchment demonstrates that some industrial properties, clustered into SWM zones, can provide substantial flood mitigation. For example, in our case study, one zone (2B), classified as Class-II, could mitigate the climate change-induced flooding to the current flood protection capacity under the moderate change pathway (RCP4.5) for the long-term period. In addition, four zones (i.e., 1A, 2A, 5H, and 5I) were categorised as Class-V. Although they, individually, could not meet the flood protection objective under any climate scenario, their capabilities yielded significant catchment flood mitigation when combined.

4.2. What Was the Dominant Factor Determining FMC Classes?

The size of the drainage area controlled by SWM zones was the dominant factor determining FMC classes. For example, Zone 2B, with the highest FMC, had the largest drainage area covering 17% of the catchment area, while the drainage areas of the zones in Class-V ranged from 1.6% to 2% of the catchment area. None of the SWM zones classified as Class-VI had drainage areas greater than 1% of the catchment. These findings are supported by other scholars (e.g., [53,54]), who found that catchment runoff reductions increased as areas controlled by GSI were expanded. For medium to large catchments like the Heathcote, the SWM zone location (which allows them to collect runoff from a large upstream contributing area), was the crucial factor enabling them to be classified from Class-I to Class-IV. Zone 1A was the largest zone in the Heathcote River catchment (1.6% of the catchment area), but its capability was limited to Class-V. In contrast, Zone 2B, classified as Class-II, occupied only about 1% of the catchment area, but it could capture runoff from an upstream contributing area 17 times larger than its area. This finding agrees with Smith, et al. [14], who found that the capability of a detention pond to reduce catchment runoff volume increased when it was placed in a location capable of capturing runoff from an upstream area.
Some SWM zones could collect only some of this upstream water. For example, some industrial SMW zones in the Heathcote River catchment, with upstream contributing areas greater than twice their area (i.e., 5H and 5I), could not hold total runoff volumes when the rainfall intensities increased with climate change, particularly in the long term. These findings are supported by Smith, et al. [14], who indicated detention ponds controlling larger drainage areas had more variability in the hydrologic response to flooding as stored water could exceed a detention capacity under heavier rainfall. Therefore, the extension of drainage areas could only increase the FMC to certain levels depending on the groundwater level and the amount of GSI area, determining in-ground storage capacity.
If only runoff from industrial SWM zones within similarly sized or larger catchments than the Heathcote (111 km2) is collected, their FMCs are likely to be limited to Class-V or VI. However, catchments having the majority of their SWM zone areas located on high groundwater (less than 2 m below the surface) and/or having limited potential GSI area would also have limited FMC even if they collect upstream runoff as well.

4.3. What Is the Most Effective Way of Implementing GSI in Order to Achieve Maximum FMC of Properties for Long-Term Adaptive Flood Mitigation?

The most effective way to implement GSI on industrial properties (whether through a retrofit only, retrofit and transfer, redesign or relocation approach) depends on the key factors that limit their FMCs. Below, we outline the most effective implementation approach based on FMC sub-classes.

4.3.1. Zones Limited by the Size of Drainage Area (Sub-Class d)

Properties classified as sub-class d (for example, Zones 1A and 2A) have sufficient in-ground storage capacity to store the total runoff volume from their drainage areas, even under the major climate change scenario of the long-term period. Therefore, all the water from their drainage areas can be captured on just a portion of the potential GSI area. This enables a retrofit approach to be successfully implemented in this zone type as one of the biggest challenges for implementing GSI on developed land is finding suitable areas (e.g., areas not in use for other valued purposes) [55]. The chance of installing GSI in the most suitable areas increases as the amount of land needed for GSI decreases with increasing excess storage capacity. As the larger proportion of potential GSI area needed (or excess capacity decreases), the resistance among landowners to retrofit their land with GSI may increase [55,56]. However, designing GSI to provide multiple beneficial services or benefits to landowners (e.g., improved branding, greening certification, aesthetics and recreational facilities) rather than just stormwater management may help to increase support for GSI facilities among these landowners [15,55]. Further research, however, is required to determine the attitudes and behaviours of landowners regarding GSI on their land, along with barriers and enablers to implementation. In addition, further research is needed to identify an effective methodology for assessing the suitability of potential GSI areas for different GSI facilities and establishing near-, mid- and long-term stages of incremental development within the zones associated with climate change conditions.
Due to the excess storage capacities available in these zones, they can receive runoff from adjacent zones that do not have sufficient capacity to hold surface runoff from their drainage areas (e.g., zones like 2B). The excess runoff from the adjacent zones would be collected in a flow chamber until the water reaches a certain level, and then it will be pumped out to GSI facilities in the zones with excess storage capacity [57].

4.3.2. Zones Limited by High Groundwater Levels (Sub-Class w)

The zones with limited depths of groundwater less than two metres below the surface would be the most affected by increased water table levels with sea-level rise. In-ground storage capacity would be diminished, resulting in excess runoff volumes discharged from these zones, especially under moderate and major climate change scenarios of the long-term period.
This zone type could be retrofitted with GSI to collect runoff from industrial properties for only mid-term flood mitigation. However, implementing GSI through a retrofit would not provide sufficient storage capacity to collect runoff from upstream contributing areas. For example, Zone 5H in this case study could collect all the runoff volume from upstream contributing areas (which were 2.5 times the zone area) if almost all potential GSI areas were used for stormwater storage at their maximum depth. As a large proportion of the potential GSI area is needed, the retrofit approach may be more difficult to implement among landowners who may want to use the potential GSI area for other land uses. In addition, the retrofit implementation approach will be more challenging to implement to mitigate long-term flooding. Using all the potential GSI areas for flood mitigation would not be adequate to store the total runoff volume, particularly under the major climate scenario. For example, under this scenario, Zones 5H and 5I would not be able to collect runoff from the upstream area, only from its zone area.
Regardless of which approach is followed, these industrial lands would need to be relocated elsewhere in the long-term period to avoid the risk of groundwater and coastal flooding. May [58] argued that given current technology, there is no way of mitigating this type of flooding other than relocation. This argument is supported by Rogers, et al. [52] and Doberstein, et al. [59], who state that the buyback of properties in flood-prone areas would be a necessary solution for mitigating flood risk in coastal cities. In addition, the concern over contamination from industrial land uses may necessitate these lands be remediated before this flooding is expected to occur to avoid impacts of contamination on humans and the environment [46]. A constructed wetland could be used to remediate soil and groundwater contamination while collecting more runoff volume temporally [60]. This could result in a higher FMC within this zone type. However, further study is required to provide stronger evidence supporting the need for relocation to convince landowners of its necessity [61,62].

4.3.3. Zones Limited by the Amount of Potential GSI Area (Sub-Class a)

The variability in capability to collect runoff in-ground also appears in zones with potential GSI area as the key limiting factor. For instance, Zone 2B has relatively deep groundwater levels (50% of the zone area on water tables between 3–4 m below ground), but its potential GSI area was limited to only 45% of its zone area. This amount of potential GSI area was insufficient to store the increased runoff volume with climate change, especially given its large upstream contributing area which was 17 times greater than its zone area.
Retrofitting GSI on zones in Class-I, II and III, like 2B, could meet the flood protection objective for the mid-term plan. However, a redesign approach could be a solution if long-term flood mitigation is needed. For zones classified in the lower classes, the entire potential GSI area would be needed to provide the required flood mitigation. However, where the potential area is limited, this is unlikely to be achieved given competing land uses in the potential GSI area, like parking or outdoor storage areas. A redesign approach, however, may be pursued to reconfigure land uses within the potential GSI area to enable multi-functional spaces where GSI functions, as well as others, like parking, may be achieved. Rogers, et al. [52] also noted that redesign could potentially overcome site constraints as a result of limited suitable GSI areas. Cohen-Rosenthal and Smith [63] proposed the prototype of an industrial complex master plan named Quantum Connection Eco-Park, which can reduce pavement areas by 66% compared to the traditional design while providing a 50% increase in leasable space. The resulting increase in vacant land could be dedicated to GSI.
An urban renewal project for redesigning existing industrial land could be implemented when existing land uses in a zone become obsolete [64,65,66]. However, other zones or flood mitigation measures could be implemented to provide the needed flood mitigation until the redesign approach becomes viable. Further research is needed to investigate other aspects of SWM zones in support of the redesign approach and to estimate a possible time when GSI could be implemented to provide flood mitigation.

4.4. What Is the Effectiveness of Adaptive GSI Networks for Providing Supplemental Flood Mitigation under Climate Change?

The cumulative flood mitigation capability of industrial SWM zones in the Heathcote River catchment presented in the adaptation pathways (Section 3.2) is greater than that found in other studies. For example, Dudula and Randhir [8] found that retrofitting bioretention facilities in areas with a high density of impervious surface could reduce climate change-induced catchment average annual flow to below the current level up to 2030. Similarly, Kirshen, et al. [10] found that strategically locating retention basins substantially reduced climate change-induced flooding to the current level, even under the major climate change scenario up to 2070. However, they used lower percent changes for precipitation compared with those used in Dudula and Randhir’s study and in our study.
There are many reasons for this variation, including differences in GSI facilities [53], size of areas controlled by GSI [54], GSI locations within catchments [14], development densities [67], and catchment size and shape [68]. In addition to these factors, a key reason responsible for the greater FMC of industrial GSI in this study is that we used multiple implementation approaches that maximised the FMC of zones through time [2]. Relocation and redesign approaches may not be attractive to landowners, or city planners for that matter, in the near term, when climate change impacts are milder and other implementation approaches are available for flood mitigation. However, they are likely to be needed in the longer term and, thus, need to be included in adaptive flood mitigation planning. Using multiple implementation approaches, our proposed industrial GSI network could mitigate flooding just shy of that associated with the major climate change scenario up to the end of this century. It should be noted, however, that these results represent an initial assessment of the potential industrial GSI networks for strategic planning purposes. Further detailed hydrological investigations using more advanced modelling are needed in catchments, including that of the Heathcote River, to design GSI networks and determine the exact adaptation signal and trigger points for GSI in each SWM zone. The Rational Method presented here only provides the initial evidence for planners to prepare a concept approval plan. Following this, more modelling is required during the detailed design stage, in addition to property owner and public participation to facilitate GSI implementation.
Finally, the supplemental flood mitigation provided by industrial GSI networks allows planners to safely delay decision-making on expensive large-scale flood defensive structures until there is greater climate certainty and they are deemed unavoidable [69]. Moreover, under high climate uncertainty, supplemental industrial GSI networks can provide flood mitigation system redundancy to reduce the high risk of primary flood mitigation system failure. This is an example of providing a safe-to-fail planning approach advocated by Ahern [70], which is essential for ensuring our communities are protected no matter the climate change scenario or time period.

5. Conclusions

This study demonstrates that the HLCA+C methodology can be used to identify priority SWM zones to form a GSI network through time as climate change impacts increase. The results demonstrate that properties with these characteristics should be prioritised for GSI implementation: (1) large SMW drainage areas, (2) depths to high groundwater levels greater than two metres below the surface, and (3) large potential GSI areas. Among these properties, SWM zones that can be retrofitted with GSI to provide long-term flood mitigation should be chosen first to achieve near-term and mid-term flood protection objectives. SWM zones having potentially high FMC but limited by their potential GSI areas and/or high groundwater could be implemented later through redesign and relocation approaches to mitigate climate change-induced flooding in the long term. Linkages connecting GSI facilities and hydraulic engineering systems to transfer runoff from one SWM zone to another could further enhance the FMC in some zones. This study demonstrates that incremental implementation of GSI on different properties through time, as climate change occurs, is less risky, given climate uncertainty, than the one-time implementation approach associated with large mechanical flood defence structures. Further research is needed to assess landowner and community attitudes and behaviours regarding the suitability of GSI and to identify barriers and enablers to its implementation.

Supplementary Materials

The following supporting information can be downloaded at: https://www.mdpi.com/article/10.3390/land11112078/s1, Figure S1: the rainfall hyetograph and runoff hydrograph of the storm event on 16 December 2021 were used for validating the catchment time of concentration and catchment runoff coefficient, Table S1: the comparison between modelled and volumetric runoff coefficient of the monitoring station’s drainage area, Table S2: the average ratio between the runoff coefficient of a 50-year storm to a 5-year storm for the monitoring station’s drainage area.

Author Contributions

Conceptualisation, S.M. and W.M.; methodology, S.M. and T.D.; formal analysis, S.M.; investigation, S.M.; writing—original draft preparation, S.M.; writing—review and editing, W.M., G.L. and T.D.; visualisation, S.M. All authors have read and agreed to the published version of the manuscript.

Funding

This research was partially funded by the Waterways Centre for Freshwater Management.

Data Availability Statement

The data presented in this study are openly available in Data@Lincoln at 10.25400/lincolnuninz.21300507 for the characteristics of industrial SWM zones, 10.25400/lincolnuninz.21358338 for runoff volume calculation, 10.25400/lincolnuninz.21300522 for the estimation of in-ground storage capacity, and 10.25400/lincolnuninz.21358455 for flood mitigation capability assessment and classification.

Acknowledgments

The authors are grateful for the funding provided by the Waterways Centre for Freshwater Management, and for the contribution of Steve C Urlich to this research.

Conflicts of Interest

The authors declare no conflict of interest.

References

  1. Kates, R.W.; Travis, W.R.; Wilbanks, T.J. Transformational adaptation when incremental adaptations to climate change are insufficient. Proc. Natl. Acad. Sci. USA 2012, 109, 7156–7161. [Google Scholar] [CrossRef] [PubMed] [Green Version]
  2. Kuhl, L.; Rahman, M.F.; McCraine, S.; Krause, D.; Hossain, M.F.; Bahadur, A.V.; Huq, S. Transformational Adaptation in the Context of Coastal Cities. Annu. Rev. Environ. Resour. 2021, 46, 449–479. [Google Scholar] [CrossRef]
  3. Terry, J.P.; Winspear, N.; Goff, J. Is Bangkok at risk of marine flooding? Evidence relating to the historical floods of AD 1785 and 1983. Nat. Hazards 2021, 105, 1013–1030. [Google Scholar] [CrossRef]
  4. Brown, S.; Jenkins, K.; Goodwin, P.; Lincke, D.; Vafeidis, A.T.; Tol, R.S.J.; Jenkins, R.; Warren, R.; Nicholls, R.J.; Jevrejeva, S.; et al. Global costs of protecting against sea-level rise at 1.5 to 4.0 °C. Clim. Chang. 2021, 167, 4. [Google Scholar] [CrossRef]
  5. Aerts, J.C.J.H.; Botzen, W.J.W.; Emanuel, K.; Lin, N.; de Moel, H.; Michel-Kerjan, E.O. Evaluating Flood Resilience Strategies for Coastal Megacities. Science 2014, 344, 473–475. [Google Scholar] [CrossRef]
  6. Radhakrishnan, M.; Pathirana, A.; Ashley, R.M.; Gersonius, B.; Zevenbergen, C. Flexible adaptation planning for water sensitive cities. Cities 2018, 78, 87–95. [Google Scholar] [CrossRef]
  7. McPhillips, L.E.; Matsler, A.M. Temporal Evolution of Green Stormwater Infrastructure Strategies in Three US Cities. Front. Built Environ. 2018, 4, 26. [Google Scholar] [CrossRef] [Green Version]
  8. Dudula, J.; Randhir, T.O. Modeling the influence of climate change on watershed systems: Adaptation through targeted practices. J. Hydrol. 2016, 541, 703–713. [Google Scholar] [CrossRef] [Green Version]
  9. Zahmatkesh, Z.; Burian, S.J.; Karamouz, M.; Tavakol-Davani, H.; Goharian, E. Low-Impact Development Practices to Mitigate Climate Change Effects on Urban Stormwater Runoff: Case Study of New York City. J. Irrig. Drain. Eng. 2015, 141, 04014043. [Google Scholar] [CrossRef]
  10. Kirshen, P.; Caputo, L.; Vogel, R.M.; Mathisen, P.; Rosner, A.; Renaud, T. Adapting Urban Infrastructure to Climate Change: A Drainage Case Study. J. Water Resour. Plan. Manag. 2015, 141, 04014064. [Google Scholar] [CrossRef]
  11. Damodaram, C.; Giacomoni, M.H.; Prakash Khedun, C.; Holmes, H.; Ryan, A.; Saour, W.; Zechman, E.M. Simulation of Combined Best Management Practices and Low Impact Development for Sustainable Stormwater Management1. JAWRA J. Am. Water Resour. Assoc. 2010, 46, 907–918. [Google Scholar] [CrossRef]
  12. Davtalab, R.; Mirchi, A.; Harris, R.J.; Troilo, M.X.; Madani, K. Sea level rise effect on groundwater rise and stormwater retention pond reliability. Water 2020, 12, 1129. [Google Scholar] [CrossRef] [Green Version]
  13. Aparicio Uribe, C.H.; Bonilla Brenes, R.; Hack, J. Potential of retrofitted urban green infrastructure to reduce runoff—A model implementation with site-specific constraints at neighborhood scale. Urban For. Urban Green. 2022, 69, 127499. [Google Scholar] [CrossRef]
  14. Smith, B.K.; Smith, J.A.; Baeck, M.L.; Miller, A.J. Exploring storage and runoff generation processes for urban flooding through a physically based watershed model. Water Resour. Res. 2015, 51, 1552–1569. [Google Scholar] [CrossRef]
  15. O’Donnell, E.C.; Lamond, J.E.; Thorne, C.R. Recognising barriers to implementation of Blue-Green Infrastructure: A Newcastle case study. Urban Water J. 2017, 14, 964–971. [Google Scholar] [CrossRef] [Green Version]
  16. Fluhrer, T.; Chapa, F.; Hack, J. A Methodology for Assessing the Implementation Potential for Retrofitted and Multifunctional Urban Green Infrastructure in Public Areas of the Global South. Sustainability 2021, 13, 384. [Google Scholar] [CrossRef]
  17. Muangsri, S.; McWilliam, W.; Davies, T.; Urlich, S.C. Supplemental Coastal City Flood Mitigation: The Untapped Potential of Retrofitting Industrial Land with Green Stormwater Infrastructure. Ph.D. Thesis, Lincoln University, Christchurch, New Zealand, 2022.
  18. Backhaus, A.; Fryd, O. Analyzing the First Loop Design Process for Large-Scale Sustainable Urban Drainage System Retrofits in Copenhagen, Denmark. Environ. Plan. B Plan. Des. 2012, 39, 820–837. [Google Scholar] [CrossRef]
  19. Mas-Machuca, M.; Marimon Viadiu, F. Still implementing ISO 14000 for the same reasons? Int. J. Qual. Res. 2019, 13, 115–130. [Google Scholar] [CrossRef]
  20. Johns, C.M. Understanding barriers to green infrastructure policy and stormwater management in the City of Toronto: A shift from grey to green or policy layering and conversion? J. Environ. Plan. Manag. 2019, 62, 1377–1401. [Google Scholar] [CrossRef]
  21. Muangsri, S.; McWilliam, W.; Lawson, G.; Davies, T. Evaluating Capability of Green Stormwater Infrastructure on Large Properties toward Adaptive Flood Mitigation: The HLCA+C Methodology. Land 2022, 11, 1765. [Google Scholar] [CrossRef]
  22. Ries III, K.G. The National Streamflow Statistics Program: A Computer Program for Estimating Streamflow Statistics for Ungaged Sites. In Hydrologic Analysis and Interpretation; U.S. Department of the Interior and U.S. Geological Survey: Reston, VA, USA, 2007; Volume 4-A6, p. 12. [Google Scholar]
  23. Christchurch City Council. Rainfall and Runoff. In Waterways Wetlands and Drainage Guide; Christchurch City Council: Christchurch, New Zealand, 2020. [Google Scholar]
  24. Christensen, P. Improving Catchment Health while Reducing Flooding: The Opāwaho/Heathcote River Story. In Proceedings of the Stormwater Conference 2019, Auckland, New Zealand, 1–3 May 2019. [Google Scholar]
  25. Hughes, M.W.; Quigley, M.C.; van Ballegooy, S.; Deam, B.L.; Bradley, B.A.; Hart, D.E. The sinking city: Earthquakes increase flood hazard in Christchurch, New Zealand. GSA Today 2015, 25, 4–10. [Google Scholar] [CrossRef]
  26. Cavalieri, F.; Franchin, P.; Giovinazzi, S. Earthquake-altered flooding hazard induced by damage to storm water systems. Sustain. Resilient Infrastruct. 2016, 1, 14–31. [Google Scholar] [CrossRef]
  27. Christchurch City Council. Land Drainage Recovery Programme. Available online: https://ccc.govt.nz/services/water-and-drainage/stormwater-and-drainage/stormwater-projects/ (accessed on 12 March 2022).
  28. Christchurch City Council. Heathcote Catchment. Available online: https://ccc.govt.nz/services/water-and-drainage/stormwater-and-drainage/stormwater-projects/whats-happening-in-your-neighbourhood/heathcote-catchment/ (accessed on 5 October 2022).
  29. Christchurch City Council. Ōpāwaho/Heathcote River Floodplain Management Plan; Christchurch City Council: Christchurch, New Zealand, 2017.
  30. Christchurch City Council. Land Drainage Recovery Programme Summary Report; Christchurch City Council: Christchurch, New Zealand, 2018.
  31. Pilgrim, D.H.; Institution of Engineers Australia. Australian Rainfall and Runoff: A Guide to Flood Estimation; Institution of Engineers, Australia: Barton, Australia, 2001; Volume 1. [Google Scholar]
  32. Thompson, D.B. The Rational Method, Regional Regression Equations, and Site-Specific Flood-Frequency Relations; Texas Department of Transportation: Austin, TX, USA, 2006.
  33. Rahman, A.; Haddad, K.; Zaman, M.; Kuczera, G.; Weinmann, P.E. Design Flood Estimation in Ungauged Catchments: A Comparison Between the Probabilistic Rational Method and Quantile Regression Technique for NSW. Australas. J. Water Resour. 2011, 14, 127–139. [Google Scholar] [CrossRef]
  34. Al-Amri, N.S.; Ewea, H.A.; Elfeki, A.M. Revisit the rational method for flood estimation in the Saudi arid environment. Arab. J. Geosci. 2022, 15, 532. [Google Scholar] [CrossRef]
  35. Dhakal, N.; Fang, X.; Cleveland, T.G.; Thompson, D.B.; Asquith, W.H.; Marzen, L.J. Estimation of Volumetric Runoff Coefficients for Texas Watersheds Using Land-Use and Rainfall-Runoff Data. J. Irrig. Drain. Eng. 2012, 138, 43–54. [Google Scholar] [CrossRef] [Green Version]
  36. Young, C.B.; McEnroe, B.M. Evaluating the Form of the Rational Equation. J. Hydrol. Eng. 2014, 19, 265–269. [Google Scholar] [CrossRef]
  37. Guo, J.C.Y.; MacKenzie, K. Modeling Consistency for Small and Large Watershed Studies. J. Hydrol. Eng. 2014, 19, 04014009. [Google Scholar] [CrossRef] [Green Version]
  38. Hughes, J.; Baker, J. Review of Approaches for Stormwater Detention Sizing; Auckland Council: Auckland, New Zealand, 2014.
  39. Cleveland, T.G.; Thompson, D.B.; Fang, X. Use of the Rational and Modified Rational Method for Hydraulic Design; Texas Department of Transportation: Austin, TX, USA, 2011.
  40. Nagy, E.D.; Torma, P.; Bene, K. Comparing Methods for Computing the Time of Concentration in a Medium-Sized Hungarian Catchment. Slovak J. Civ. Eng. 2016, 24, 8–14. [Google Scholar] [CrossRef] [Green Version]
  41. Martell, C. Standardisation of Design Flows for Coastal Catchments in New Zealand; Land Transport New Zealand: Wellington, New Zealand, 2005.
  42. Carey-Smith, T.; Henderson, R.; Singh, S. High Intensity Rainfall Design System, Version 4; National Institute of Water & Atmospheric Research: Auckland, New Zealand, 2018.
  43. National Institute of Water and Atmospheric Research. High Intensity Rainfall Design System V4. Available online: https://hirds.niwa.co.nz (accessed on 28 November 2021).
  44. Omitaomu, O.A.; Kotikot, S.M.; Parish, E.S. Planning green infrastructure placement based on projected precipitation data. J. Environ. Manag. 2021, 279, 111718. [Google Scholar] [CrossRef]
  45. Earthquake Commission. Depth to Groundwater: 4 September 2010. Available online: https://ecan.maps.arcgis.com/home/item.html?id=9c7f25ad929d4b8c83bdc0b4252c010c (accessed on 28 November 2021).
  46. Befus, K.M.; Barnard, P.L.; Hoover, D.J.; Finzi Hart, J.A.; Voss, C.I. Increasing threat of coastal groundwater hazards from sea-level rise in California. Nat. Clim. Chang. 2020, 10, 946–952. [Google Scholar] [CrossRef]
  47. Oppenheimer, M.; Glavovic, B.C.; Hinkel, J.; van de Wal, R.; Magnan, A.K.; Abd-Elgawad, A.; Cai, R.; Cifuentes-Jara, M.; DeConto, R.M.; Ghosh, T.; et al. Sea Level Rise and Implications for Low Lying Islands, Coasts and Communities Supplementary Material; Cambridge University Press: Cambridge, UK, 2019. [Google Scholar]
  48. Ministry for the Environment. Coastal Hazards and Climate Change; Ministry for the Environment: Wellington, New Zealand, 2017.
  49. New Zealand Water Environment Research Foundation. On-Site Stormwater Management Guideline; New Zealand Water Environment Research Foundation: Wellington, New Zealand, 2004. [Google Scholar]
  50. Haasnoot, M.; Kwakkel, J.H.; Walker, W.E.; ter Maat, J. Dynamic adaptive policy pathways: A method for crafting robust decisions for a deeply uncertain world. Glob. Environ. Chang. 2013, 23, 485–498. [Google Scholar] [CrossRef] [Green Version]
  51. Lawrence, J.; Stephens, S.; Blackett, P.; Bell, R.G.; Priestley, R. Climate Services Transformed: Decision-Making Practice for the Coast in a Changing Climate. Front. Mar. Sci. 2021, 8, 703902. [Google Scholar] [CrossRef]
  52. Rogers, B.C.; Bertram, N.; Gersonius, B.; Gunn, A.; Löwe, R.; Murphy, C.; Pasman, R.; Radhakrishnan, M.; Urich, C.; Wong, T.H.F.; et al. An interdisciplinary and catchment approach to enhancing urban flood resilience: A Melbourne case. Philos. Trans. R. Soc. A Math. Phys. Eng. Sci. 2020, 378, 20190201. [Google Scholar] [CrossRef]
  53. Ahiablame, L.M.; Engel, B.A.; Chaubey, I. Effectiveness of low impact development practices in two urbanized watersheds: Retrofitting with rain barrel/cistern and porous pavement. J. Environ. Manag. 2013, 119, 151–161. [Google Scholar] [CrossRef]
  54. Schubert, J.E.; Burns, M.J.; Fletcher, T.D.; Sanders, B.F. A framework for the case-specific assessment of Green Infrastructure in mitigating urban flood hazards. Adv. Water Resour. 2017, 108, 55–68. [Google Scholar] [CrossRef]
  55. Shafique, M.; Kim, R. Retrofitting the Low Impact Development Practices into Developed Urban areas Including Barriers and Potential Solution. Open Geosci. 2017, 9, 240–254. [Google Scholar] [CrossRef]
  56. Voskamp, I.M.; Van de Ven, F.H.M. Planning support system for climate adaptation: Composing effective sets of blue-green measures to reduce urban vulnerability to extreme weather events. Build. Environ. 2015, 83, 159–167. [Google Scholar] [CrossRef]
  57. Malmur, R. Methods of drainage and transfer of rainwater. E3S Web Conf. 2019, 116, 00049. [Google Scholar] [CrossRef]
  58. May, C. Rising groundwater and sea-level rise. Nat. Clim. Chang. 2020, 10, 889–890. [Google Scholar] [CrossRef]
  59. Doberstein, B.; Fitzgibbons, J.; Mitchell, C. Protect, accommodate, retreat or avoid (PARA): Canadian community options for flood disaster risk reduction and flood resilience. Nat. Hazards 2018, 98, 31–50. [Google Scholar] [CrossRef]
  60. Song, Y.; Kirkwood, N.; Maksimović, Č.; Zheng, X.; O’Connor, D.; Jin, Y.; Hou, D. Nature based solutions for contaminated land remediation and brownfield redevelopment in cities: A review. Sci. Total Environ. 2019, 663, 568–579. [Google Scholar] [CrossRef] [PubMed]
  61. Rey-Valette, H.; Robert, S.; Rulleau, B. Resistance to relocation in flood-vulnerable coastal areas: A proposed composite index. Clim. Policy 2019, 19, 206–218. [Google Scholar] [CrossRef]
  62. Dedekorkut-Howes, A.; Torabi, E.; Howes, M. When the tide gets high: A review of adaptive responses to sea level rise and coastal flooding. J. Environ. Plan. Manag. 2020, 63, 2102–2143. [Google Scholar] [CrossRef]
  63. Cohen-Rosenthal, E.; Smith, M. Real estate and eco-industrial development: The creation of value. In Eco-Industrial Strategies: Unleashing Synergy between Economic Development and the Environment; Cohen-Rosenthal, E., Musnikow, J., Eds.; Greenleaf Publishing Limited: Shaffield, UK, 2003. [Google Scholar]
  64. Ploegmakers, H.; Beckers, P. Evaluating urban regeneration: An assessment of the effectiveness of physical regeneration initiatives on run-down industrial sites in The Netherlands. Urban Stud. 2014, 52, 2151–2169. [Google Scholar] [CrossRef]
  65. Jaroszewska, E. Urban shrinkage and regeneration of an old industrial city: The case of Wałbrzych in Poland. Quaest. Geogr. 2019, 38, 75–90. [Google Scholar] [CrossRef] [Green Version]
  66. MacGregor, C. Urban regeneration as a public health intervention. J. Soc. Interv. Theory Pract. 2010, 19, 38–51. [Google Scholar] [CrossRef] [Green Version]
  67. D’Ambrosio, R.; Balbo, A.; Longobardi, A.; Rizzo, A. Re-think urban drainage following a SuDS retrofitting approach against urban flooding: A modelling investigation for an Italian case study. Urban For. Urban Green. 2022, 70, 127518. [Google Scholar] [CrossRef]
  68. Goff, K.M.; Gentry, R.W. The Influence of Watershed and Development Characteristics on the Cumulative Impacts of Stormwater Detention Ponds. Water Resour. Manag. 2006, 20, 829–860. [Google Scholar] [CrossRef]
  69. Yousefpour, R.; Hanewinkel, M. Climate change and decision-making under uncertainty. Curr. For. Rep. 2016, 2, 143–149. [Google Scholar] [CrossRef] [Green Version]
  70. Ahern, J. From fail-safe to safe-to-fail: Sustainability and resilience in the new urban world. Landsc. Urban Plan. 2011, 100, 341–343. [Google Scholar] [CrossRef]
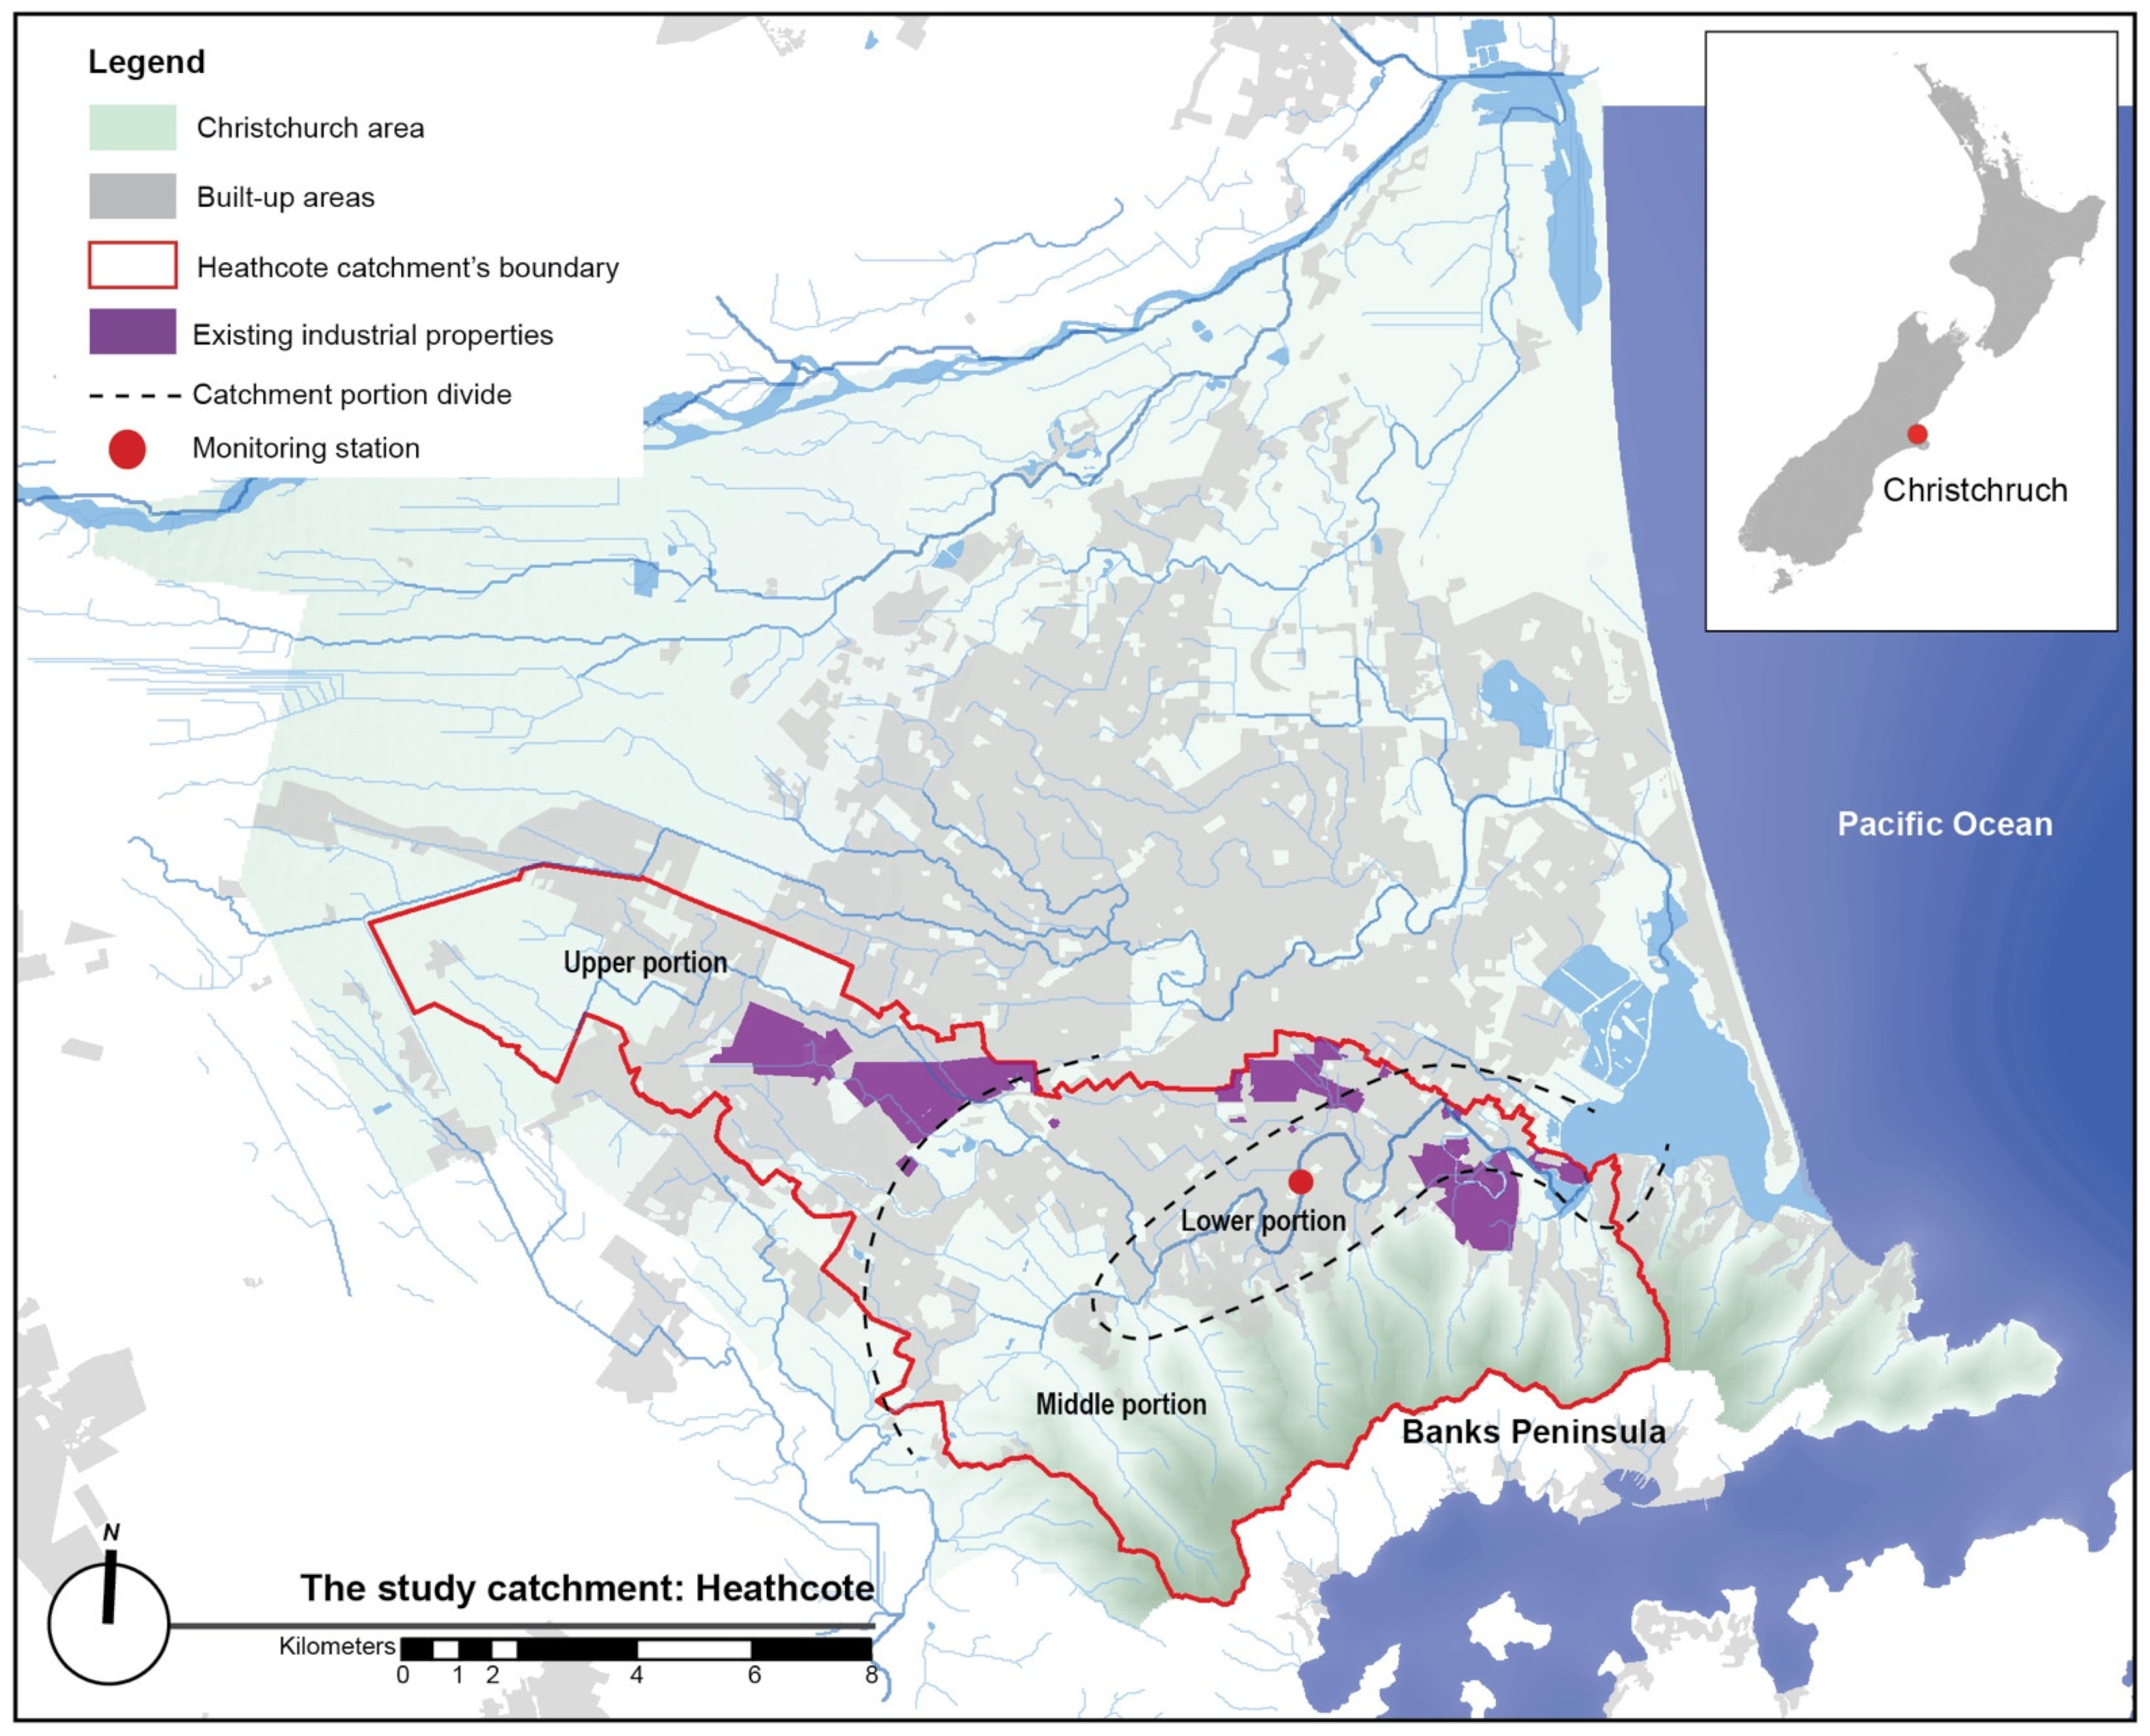
Figure 1. Industrial properties are located across the Heathcote catchment in the south of Christchurch, New Zealand. The catchment is a short, wide basin which can be divided into upper, middle, and lower portions, according to Ries III [22].
Land 11 02078 g001
Figure 2. The four steps of the Hydrology-based Land Capability Assessment and Classification methodology (HLCA+C). The methodology evaluates and classifies SWM zones to prioritise flood mitigation zones and evaluate implementation approaches toward effective GSI networks through time with increased climate change impacts.
Land 11 02078 g002
Figure 3. The FMC classification system groups SWM zones into six FMC classes according to their potential to reduce climate change-induced flooding to the current flood protection capacity associated with three temporal scales of different climate scenarios. Each class has three sub-classes indicating key limiting factors influencing the FMC of each zone (d: the size of drainage area, w: the high groundwater level, and a: the potential GSI area). Hatched patterns present the maximum FMC which can be achieved through different implementation approaches. This figure is reprinted with permission from Muangsri et al. [21].
Land 11 02078 g003
Figure 4. SWM zones in the Heathcote River catchment defined by drainage area boundaries.
Land 11 02078 g004
Figure 5. GW areas within SWM zones located in the Heathcote River catchment were delineated based on the maximum high groundwater from historical records.
Land 11 02078 g005
Figure 6. According to the flood mitigation classification system, Zone 2B has the highest FMC with the potential GSI area as the key limiting factor (Class-IIa). Four zones are classified as a lower FMC of Class-V. The FMCs of Zone 1A and 2A are limited by their size of drainage area and were classified as Class-Vd, while Zones 5H and 5I have high groundwater levels as their key limiting factor and were classified as Class-Vw. The other 15 zones have very low FMCs (Class-VI), with a wide range of key limiting factors.
Land 11 02078 g006
Figure 7. Collectable runoff volumes of Zone 2B (shaded in grey) are almost equivalent to the total runoff volume from the zone’s drainage area (blue bar) over the mid-term. However, runoff volumes would exceed the storage capacity (green bar) in the long term under all climate scenarios. Collectable runoff volumes are higher than the runoff reduction required to mitigate the increased flooding with climate change (red line), except under RCP8.5 in the long term. Under this scenario, the increased catchment runoff volume is three times greater than the amount the zone can collect.
Land 11 02078 g007
Figure 8. The collectable runoff volumes of Zones 1A and 2A (shaded in grey) correspond to the total amounts of runoff from their drainage areas (blue bar). However, these runoff reductions are not sufficient to meet the flood protection objective under the minor climate change scenario (RCP2.6) in the mid-term period (red line). Despite having a large storage capacity to collect runoff (green bar), their FMCs are limited by the amount of runoff they receive from their drainage areas.
Land 11 02078 g008
Figure 9. The collectable runoff volumes of Zone 5H and 5I (shaded in grey) are equivalent to their runoff volumes (blue bars) over the mid-term under all climate scenarios. Runoff volumes will exceed storage capacities (green bar) in the long term under all climate scenarios. However, collected runoff volumes are not sufficient to reduce the impacts of the minor climate change scenario in the mid-term (the levels indicated by the red lines).
Land 11 02078 g009
Figure 10. Collectable runoff volumes of all 15 SWM zones were classified as FMC class-VI. These zones can only capture a small proportion of that required to maintain the flood protection objective under the minor climate change scenario (RCP2.6) in the mid-term (red line).
Land 11 02078 g010
Figure 11. The collectable runoff volumes of SWM zones classified as Class-VI under the long-term major climate change scenario (RCP8.5) are presented by the black line. The zones are grouped according to their key limiting factors. Zones having the potential GSI area (a-highlighted in pink) and the high groundwater level (w-highlighted in blue) as key limiting factors have runoff volumes (blue bar) exceeding their storage capacities (green bar). Meanwhile, zones with the size of drainage area (d-highlighted in green) as the key limiting factor have excess storage capacity, which could be used to increase their FMCs if water could be transferred from other zones with excess runoff.
Land 11 02078 g011
Figure 12. The proposed adaptation pathways for implementing an industrial GSI network in the Heathcote River catchment over this century to supplement the primary catchment flood mitigation system. The projected lines to indicate the adaptation threshold of each action.
Land 11 02078 g012
Table 1. Land characteristics of SWM zones in the Heathcote River catchment.
SWM Zone IDSWM Zone AreasUpstream Contributing AreasGW Areas (% of Zone Area)Potential GSI Area (% of Zone Area)
Km2% of Catchment AreaKm2% of Catchment Area0–1 m>1–2 m>2–3 m>3–4 m>4 m
HE_1A1.781.60%------10059.72
HE_2A0.950.85%2.211.99%-1318333652.65
HE_2B1.060.96%18.4116.54%-104050 45.43
HE_2C0.620.56%---1216155749.69
HE_3D0.150.14%---7921--43.82
HE_4D0.720.64%0.340.30%-8812--25.17
HE_4E0.300.27%0.230.20%-3565--44.65
HE_4F0.130.12%0.150.13%-991--39.58
HE_4G0.090.08%---2773--14.9
HE_5H0.850.76%2.081.87%404812--57.97
HE_5I0.920.82%1.801.62%6136--371.12
HE_6J0.370.33%--124048--51.2
HE_7K0.200.18%---100---52.29
HE_8L0.030.02%---4159--48.43
HE_9M0.020.02%---5842--76.61
HE_10N0.030.03%0.230.21%100----41.43
HE_11O0.010.01%----4258-33.55
HE_12P0.020.02%0.020.02%-6139 -79.87
HE_13Q0.020.02%0.070.06%--100 -70.03
HE_14R0.090.08%--18-676-92.71
Publisher’s Note: MDPI stays neutral with regard to jurisdictional claims in published maps and institutional affiliations.