Article

Comparative Habitat Divergence and Fragmentation Analysis of Two Sympatric Pheasants in the Qilian Mountains, China

1
Key Laboratory of Animal Ecology and Conservation Biology, Institute of Zoology, Chinese Academy of Sciences, Beijing 100101, China
2
College of Life Sciences, University of Chinese Academy of Sciences, Beijing 100049, China
3
College of Life Science, Hebei University, Baoding 071002, China
4
Qinghai Service Center of Qilian National Park, Xining 810000, China
5
Zhangye Management Division of Gansu Provincial Administration of Qilian National Park, Zhangye 734000, China
*
Authors to whom correspondence should be addressed.
These authors contributed equally to this work.
Land 2022, 11(12), 2104; https://doi.org/10.3390/land11122104
Submission received: 15 September 2022 / Revised: 29 October 2022 / Accepted: 15 November 2022 / Published: 22 November 2022

Abstract

:
Habitat fragmentation is considered a major threat to biodiversity worldwide. Two endangered species, the blood pheasant (Ithaginis cruentus) and the blue eared pheasant (Crossoptilon auritum), co-exist in a fragmented forest in the Qilian Mountains. However, how their habitats react to the fragmenting landscape remains unclear. Therefore, we carried out a field survey in the core habitat of the two species in Qilian Mountains National Park and used the MaxEnt Model to predict their potential distribution and to assess the protection efficiency. Then, we utilized a modified within-patch fragmentation categorizing model to identify how their functional fragmentations differentiated. The results showed that the habitat utilization of the two pheasant species was significantly different, with a potential distribution area of 18,281 km2 for the blood pheasant and 43,223 km2 for the blue eared pheasant. The habitat of the blue eared pheasant is highly fragmented with 27.7% categorized as ‘Interior’ and 49.3% as ‘Edge’, while the habitat of the blood pheasant is more severe with 2.1% categorized as ‘Interior’ and 50.4% as ‘Edge’. Analysis shows that large areas of habitat for the two pheasants remain unprotected by the Qilian Mountains National Park. The intense grazing and human infrastructure may have a large effect on the currently highly fragmented landscape. Future measurements are needed to alleviate this conflict.

1. Introduction

Habitat fragmentation is considered a major threat to biodiversity worldwide [1]. Human-related land-use change, i.e., agricultural expansion and urbanization, is rapidly fragmenting the natural ecosystem and causing biodiversity loss, especially in China [2]. Therefore, habitat fragmentation assessment has become crucial in wildlife protection [3]. However, research showed that the reaction of wildlife habitat to climate change and human influence is species-specific, even for sympatric ones [4,5], indicating the necessity to understand how endangered species react to environmental conditions specifically when designing targeted protection strategy.
Nature reserves or national parks are effective solutions for in-suit biodiversity protection. Established in 2017, Qilian Mountains National Park (QMNP) has served as an isolated refuge for many gallinaceous birds during the Pleistocene glaciations, such as the Chinese grouse (Tetrastes sewerzowi), the blood pheasant (Ithaginis cruentus) and the blue eared pheasant (Crossoptilon auritum) [6]. QMNP is located in one of the biodiversity hotspots where many endemic species have habituated and, therefore, it is prioritized for biodiversity conservation in China [7,8]. The QMNP protects the core breeding habitat for two endangered Galliformes species, namely the blood pheasant and the blue eared pheasant [9,10], which are unique genetic resources for whole populations like the Chinese grouse [6,11]. The blood pheasant prefers coniferous or mixed forests and scrub at 2100–4600 m above sea level (ASL) [12,13]. The blue eared pheasant is a rare species endemic to China, distributed in the mountainous regions of Qinghai, Gansu, and Sichuan provinces and the Ningxia Hui Autonomous Region [14,15].
Many avian species have suffered from human activities, as man-made infrastructure have cut through and fragmented their habitat [16]. Gallinaceous birds, which are ground-dwelling with limited disperse ability [5,17,18,19], are particularly vulnerable to human over-exploiting and infrastructure expansion. The blood pheasant and the blue eared pheasant are listed as second class national protected animals in China, which are threatened by non-sustainable harvest and trade, as well as destruction and degradation of the forests [20]. Recently, the field work from Zhang et al. showed the sympatric and weakly connected landscape pattern of the blood pheasant and the blue eared pheasant [9] in the Qilian Mountain National Nature Reserve, Gansu, China. Their results also showed an urgent need to quantify the habitat fragmentation in the extensive range of the Qilian Mountains.
In this study, we carried out a field line transect survey and camera-trapping in the Qilian Mountains to study the threads and causes for habitat loss and fragmentation of the blood pheasant and the blue eared pheasant. Camera-trapping has been widely used in wildlife conservation and it has been successfully used to detect rare or elusive species for evaluating the effectiveness of protected area management [21]. Then, we utilized species distribution modeling (SDM), a widely used method to evaluate the geographical distribution of species, to evaluate the potential distribution range and ecological niche divergence of the two species. Finally, we utilized a modified forest fragmentation analytical model [5,22] to assess and quantify species-specific responses to habitat fragmentation and within-patch functional habitat fragmentation categorization. By quantifying the extent of fragmentation of their geographical distribution, we intend to clarify how this pair of sympatric species responds differently to human interference and how well the two pheasants are protected in QMNP.

2. Materials and Methods
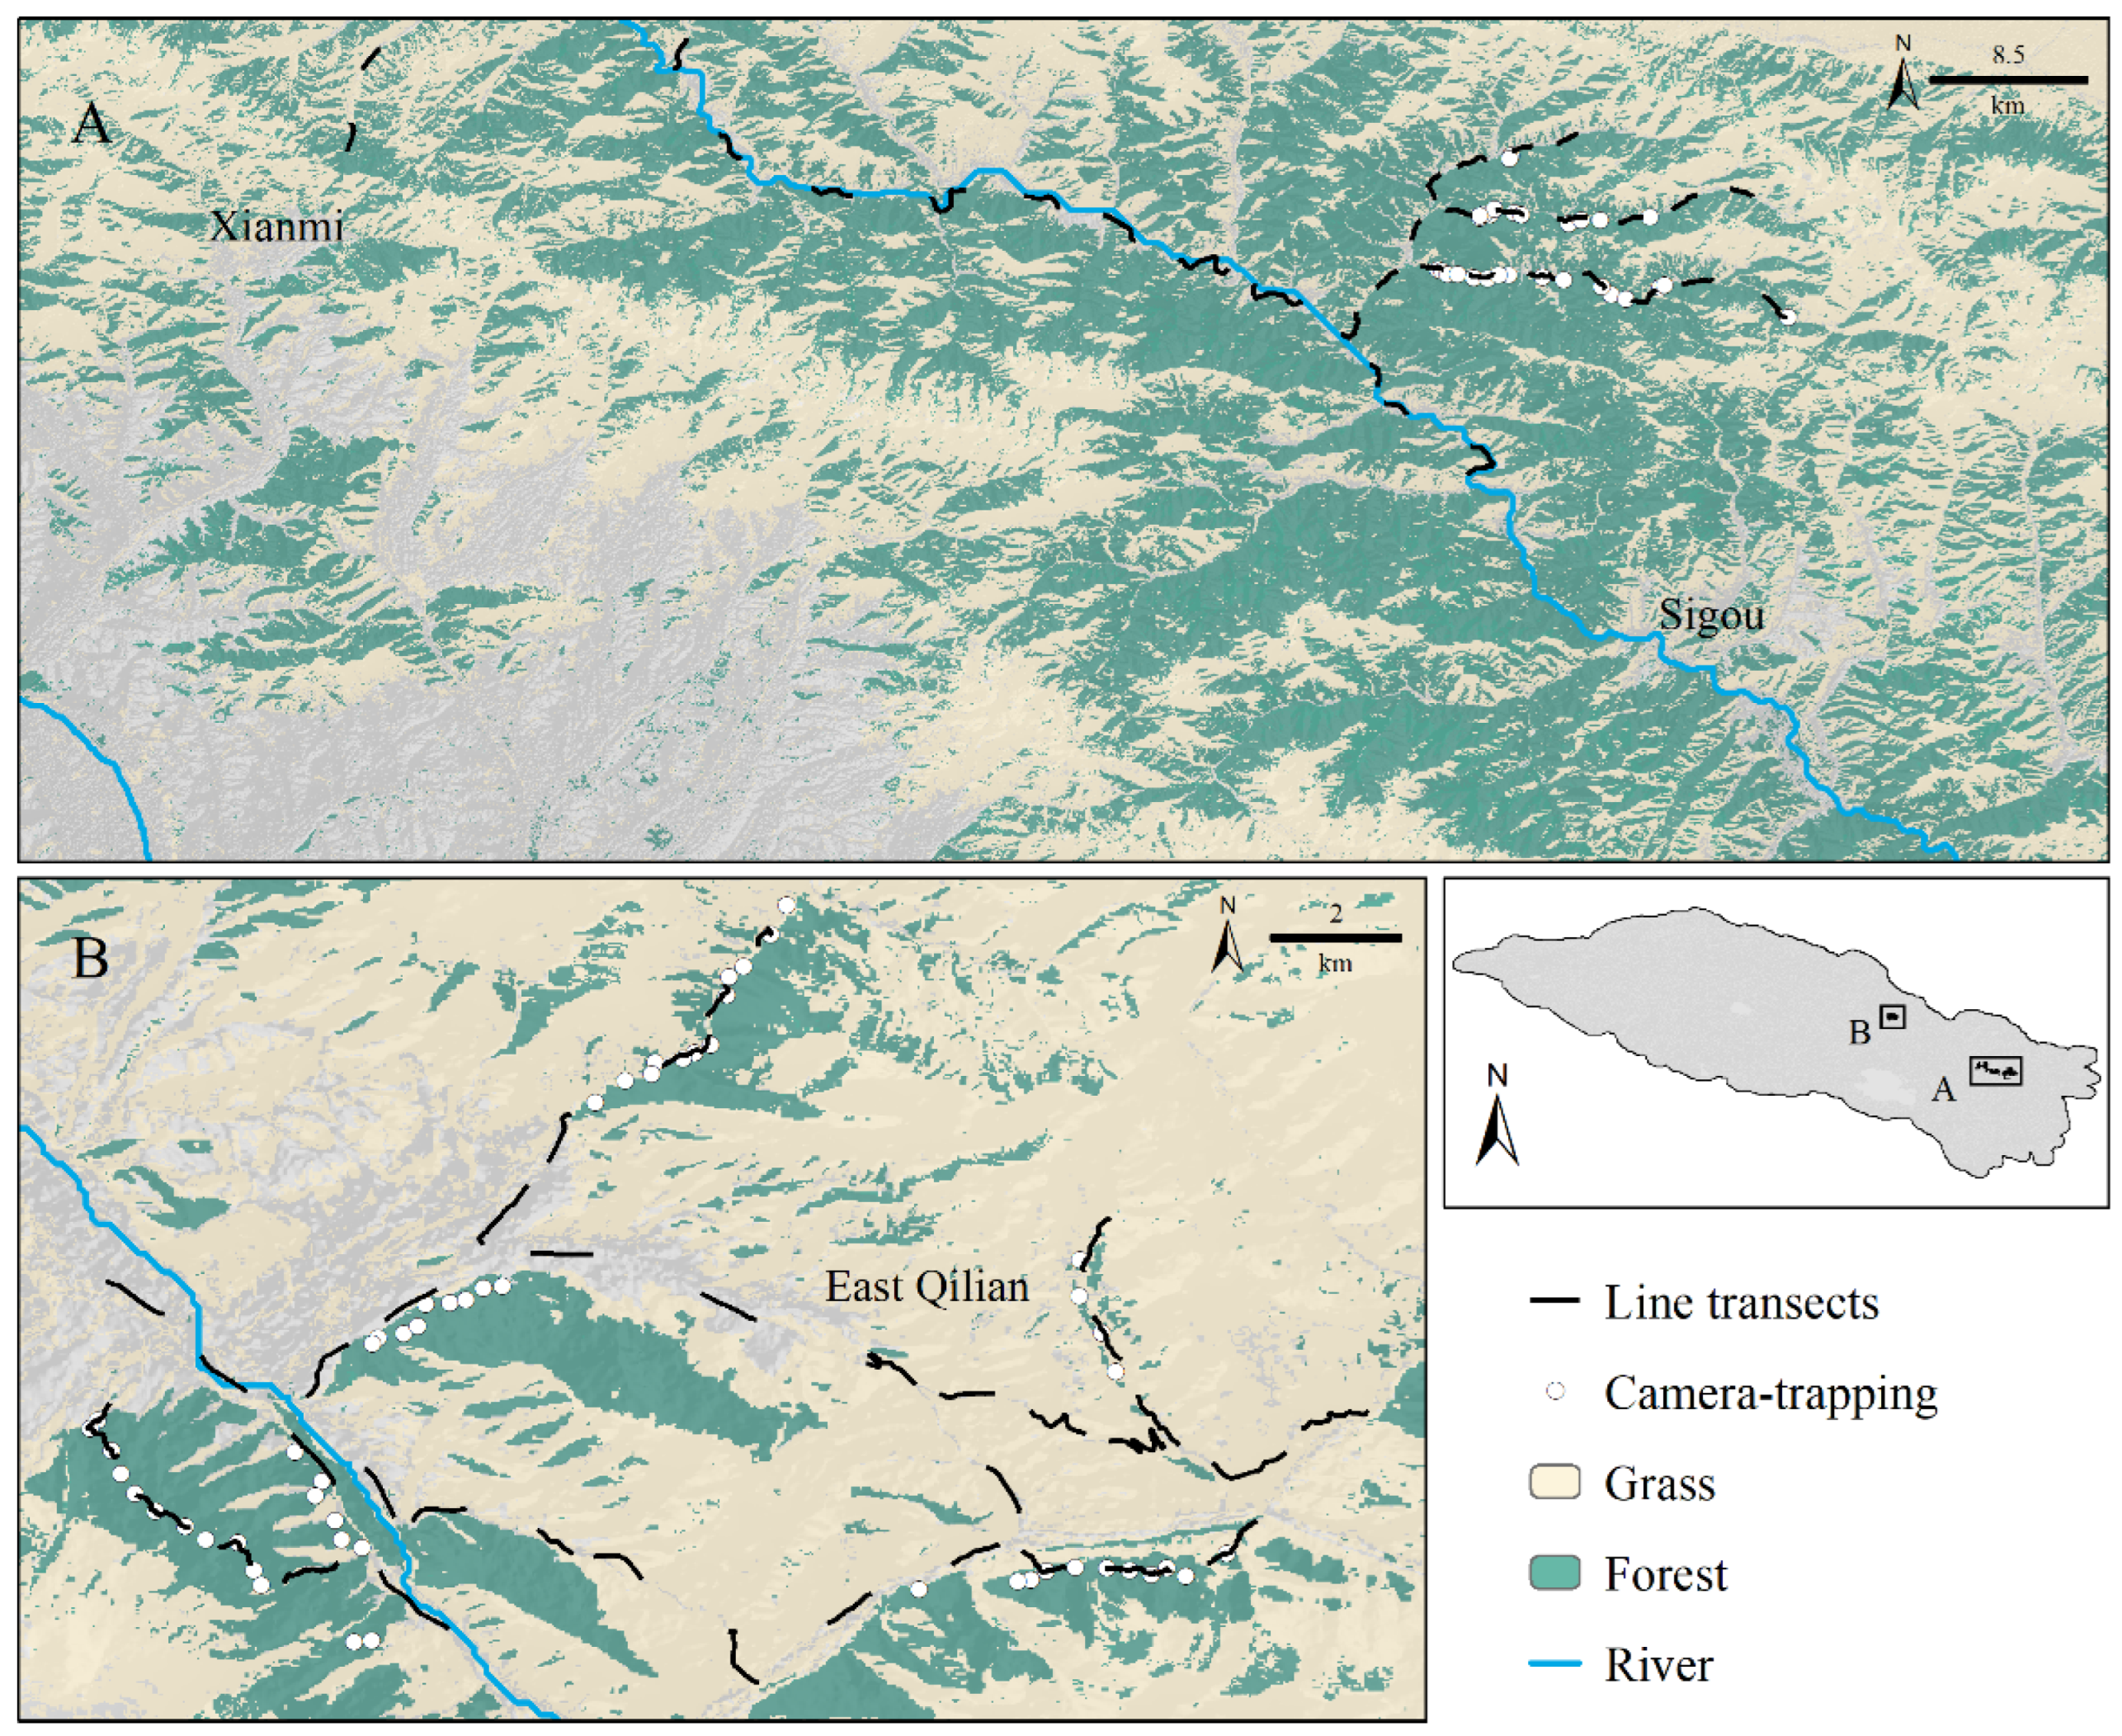
2.1. Study Area

The study area includes the QMNP and the Qilian basin (Figure 1), which is located in the northeast of the Qinghai-Tibet Plateau (QTP), with a total area of 221,067 km2 and a typical plateau continental climate, which is characterized by low annual mean temperatures (most areas below 0 °C) and high sunshine durations exceeding 2800 h. This makes the study area unique in terms of hydrothermal conditions [23]. Elevation throughout the Qilian Mountains Area ranges from 1623 m to 5766 m ASL. The Qilian Mountains are surrounded by the Gobi Desert and has important water sources and many inland rivers, such as the Shiyanghe River, Heihe River, and Shulehe River [24,25]. The area is covered with diverse vegetation due to its unique geographical features and the edge effect of flora (Figure A1) [26]. We included the Qilian Mountains and the Qilian basin in a polygon range based on features of the geography, like mountains and rivers.

2.2. Field Study

In 2021, from 26 April to 2 May, we carried out a systematic transect survey along with camera-trapping in the core habitat of the blood pheasant and the blue eared pheasant in the Qilian Mountains (Figure A2). The total length of the 76 line transects in our survey is 99.97 km. Camera-trapping was designed to be equally separated for at least 1 km and to be sampled at sites with trails or sightings of blood pheasant and blue eared pheasant. All the photos taken during the monitoring period (from 26 April to 28 June) were examined and selected to identify blood pheasant and blue eared pheasant.

2.3. Occurrence Data

We collected the occurrence data for blood pheasants and blue eared pheasants from the transect survey, camera-traps, previous surveys, and online database (Table A1). We used data from previous surveys and online data from the Global Biodiversity Information Facility (GBIF, www.gbif.org, accessed on 23 June 2021). Considering the data from the GBIF database may be biased or misidentified, we carefully examined every record and checked every location using Google Earth. In order to account for spatial autocorrelation between species occurrence points, we added a 300 m buffer area around each species occurrence point using ArcGIS 10.7 (Esri, Redlands, CA, USA) [27]. In total, 105 different samples for blood pheasant and 85 samples for blue eared pheasant were obtained (Table A2).

2.4. Environmental Variables

To get a more informative result for this small-scaled study area, only high-resolution (30 m) environmental variables were used, including three topographic factors, five Euclidean distance factors, and the Land Use and Land Cover variables, in the species distribution model (Table 1). Altitude, aspect of slope, and slope layers were retrieved from the ASTER GDEM 30M product from the USGS. Cropland and lake distribution layers were extracted from the land use and land cover layers from GLC FC30-2020 [28]. The distribution of rivers was accessed from the global HydroRIVERS Version 1.0 dataset. The road dataset was accessed from Gaode Map and building data was downloaded from GHSL (ghslsys.jrc.ec.europa.eu). Cropland, lake, river, road, and building layers were then imported to ArcGIS 10.7 as sources for calculating Euclidean distance variables. The same geographic extent (30 m cell size) and projected coordinate system (WGS 1984 UTM Zone 48N) were selected for each layer. Correlation testing was performed for all 9 environmental variables in R and we found no strong correlation, according to the Cohen 1988 correlation rule (Figure A3) (Very Small: |r| ≤ 0.1; Small: 0.1 < |r| ≤ 0.3; Moderate: 0.3 < |r| ≤ 0.5; Strong: |r| > 0.5) [29].

2.5. Model Building and Evaluation

We conducted SDM in MaxEnt version 3.4.4, an adapted and developed software using the maximum entropy general-purpose machine learning method [30,31,32], which is known to outperform other methods due to its extremely small sample size tolerance in a variety of wildlife studies [32,33,34,35]. Combining presence-only data with the environmental constraints presented as GIS layers in ASCII form, we modeled the potential distribution of the blood pheasant and the blue eared pheasant using the ten-fold subsampled method with default settings and a maximum of 5000 iterations.
We selected Jackknife analysis to evaluate the modeling contributions of each environmental value and we used Cohen’s kappa statistic [36], the area under the curve (AUC) of receiver operating characteristics (ROC), and true skills statistics (TSS) to validate the performance of the models. A Cohen’s kappa statistic ≤ 0 indicates a prediction no different from one that is random, whereas +1 stands for perfect performance. AUC values are threshold-independent measures of model accuracy, where an AUC value of 0 indicates a model with no better discrimination than chance, whereas an AUC value > 0.8 indicates excellent discrimination. TSS compares the number of correct predictions, minus the predictions attributed to random guessing, against a hypothetical set of ideal predictions. TSS values range from −1 to +1, where values ≤ 0 indicate a prediction no different from one that is random. A value of +1 represents perfect performance but is not affected by the prevalence or size of the validation dataset [5].

2.6. Data Analysis

To understand whether there is habitat selection differentiation between the blood pheasant and the blue eared pheasant, environmental values were extracted for each presence location and an ANOVA (Analysis of Variation) test was performed for each pair of environmental variables (for categorical variables—land use and land cover—we performed the Fisher t-test).
Then, the logistic output of the species distribution models (0–1) were transformed into binary maps (0 and 1) using the Equate Entropy of Thresholded and Original Distributions Logistic Threshold [37] for each species that exhibited the largest TSS and kappa value. The binary distribution maps for each species were projected onto WGS 1984 UTM Zone 48N in ArcGIS 10.7 and were used for habitat fragmentation analysis and protection GAP analysis in QMNP.
The dispersal ability of the blood pheasant can be up to 2.2 km [5], thus we used 0.5 km, 1 km, 1.5 km, 2 km, and 2.5 km as dispersal distances in habitat fragmentation analysis. Because of the lack of data on the blue eared pheasant’s maximum dispersal distance, the dispersal distance of its closely related species C. manchuricum is referred to, which is 5.97 km [38], and intercepted as 3 km, 4 km, 5 km, 5.5 km, and 6 km to calculate the habitat fragmentation matrices.
We calculated four class-level metrics using FRAGSTATS v4.2.1.603 [39] to evaluate the habitat fragmentation of blood pheasants and blue eared pheasants with different dispersal distances, including: (1) number of patches (NP), which indicates the degree of fragmentation [40]; (2) largest patch index (LPI), which represents the percentage of the landscape comprised of the largest habitat patch with high connectivity [41]; (3) percentage of the landscape (PLAND), which quantifies the habitat patches with high connectivity as a percentage of the study area [42]; and (4) area-weighted mean radius of gyration (GYRATE_AM) or correlation length (CL), which provides a measurement of the extensiveness of the habitat patches with high connectivity [43]. These metrics have been used frequently in research [44,45,46].
Finally, we distinguished different functional fragmentations into six fragmentation categories using two measurements, namely the amount of habitat (Pf) and its occurrence in adjacent pixels (Pff). These were calculated in fixed-sized ‘windows’ devised from a forest fragmentation analytical model by Riitters et al. [22] (Interior: Pf = 1.0; Patch: Pf < 0.4; Transitional: 0.4 ≤ Pf < 0.6; Edge: Pf ≥ 0.6 and Pf > Pff; Perforated: Pf ≥ 0.6 and Pf < Pff; Undetermined: Pf ≥ 0.6 and Pf = Pff). Since no single scale or window size is deemed suitable for all species across all habitats [5,22,47], we selected a 9 × 9-pixel window as the smallest practical scale (highest resolution) needed to reliably estimate forest cover (Pf) and functional response identification. The process was conducted using MATLAB version 2021b and the distinguished functional fragmentation was displayed in ArcGIS.
The ‘Interior’ refers to the area where all of the grids are habitable in the habitable sampling window. According to percolation theory, a connectable path can be formed when a certain type of grid reaches 60% of the sampling range, that is, when the proportion of suitable grids (or unsuitable grids) reaches 60% of the sampling window [22]. Therefore, Pf < 0.4 is the criterion for the non-diffusible habitat (named, ‘Patch’). When Pf ≥ 0.6, Pff > Pf indicates that the distribution of suitable rasters is adjacent and accounts for a relatively large proportion, indicating that the window position should be in the ‘Edge’. When Pff < Pf, it means that the distribution of non-suitable rasters is concentrated and the proportion is larger, representing a non-suitable raster with clustered distribution in the range of suitable habitat and is thus defined as ‘Perforated’. Finally, the areas that fall between ‘Perforated’ and ‘Patch’ are defined as ‘Transitional’.

3. Results

3.1. Model Validation

Model performance suggested further analysis can be performed, with all mean AUC > 0.9, kappa > 0.4, and TSS > 0.7. According to the Jackknife analysis (Figure A4), the variables Land Use and Land Cover have the highest gains in all of the modeling processes, which therefore suggests that they are the most important predictors for the distribution of blood pheasants and blue eared pheasants, while Aspect has little contribution to the modeling process (Table 2). For kappa and TSS, the values of every model and every threshold were calculated, which is 0.1147 for blood pheasant and 0.1768 for blue eared pheasant.

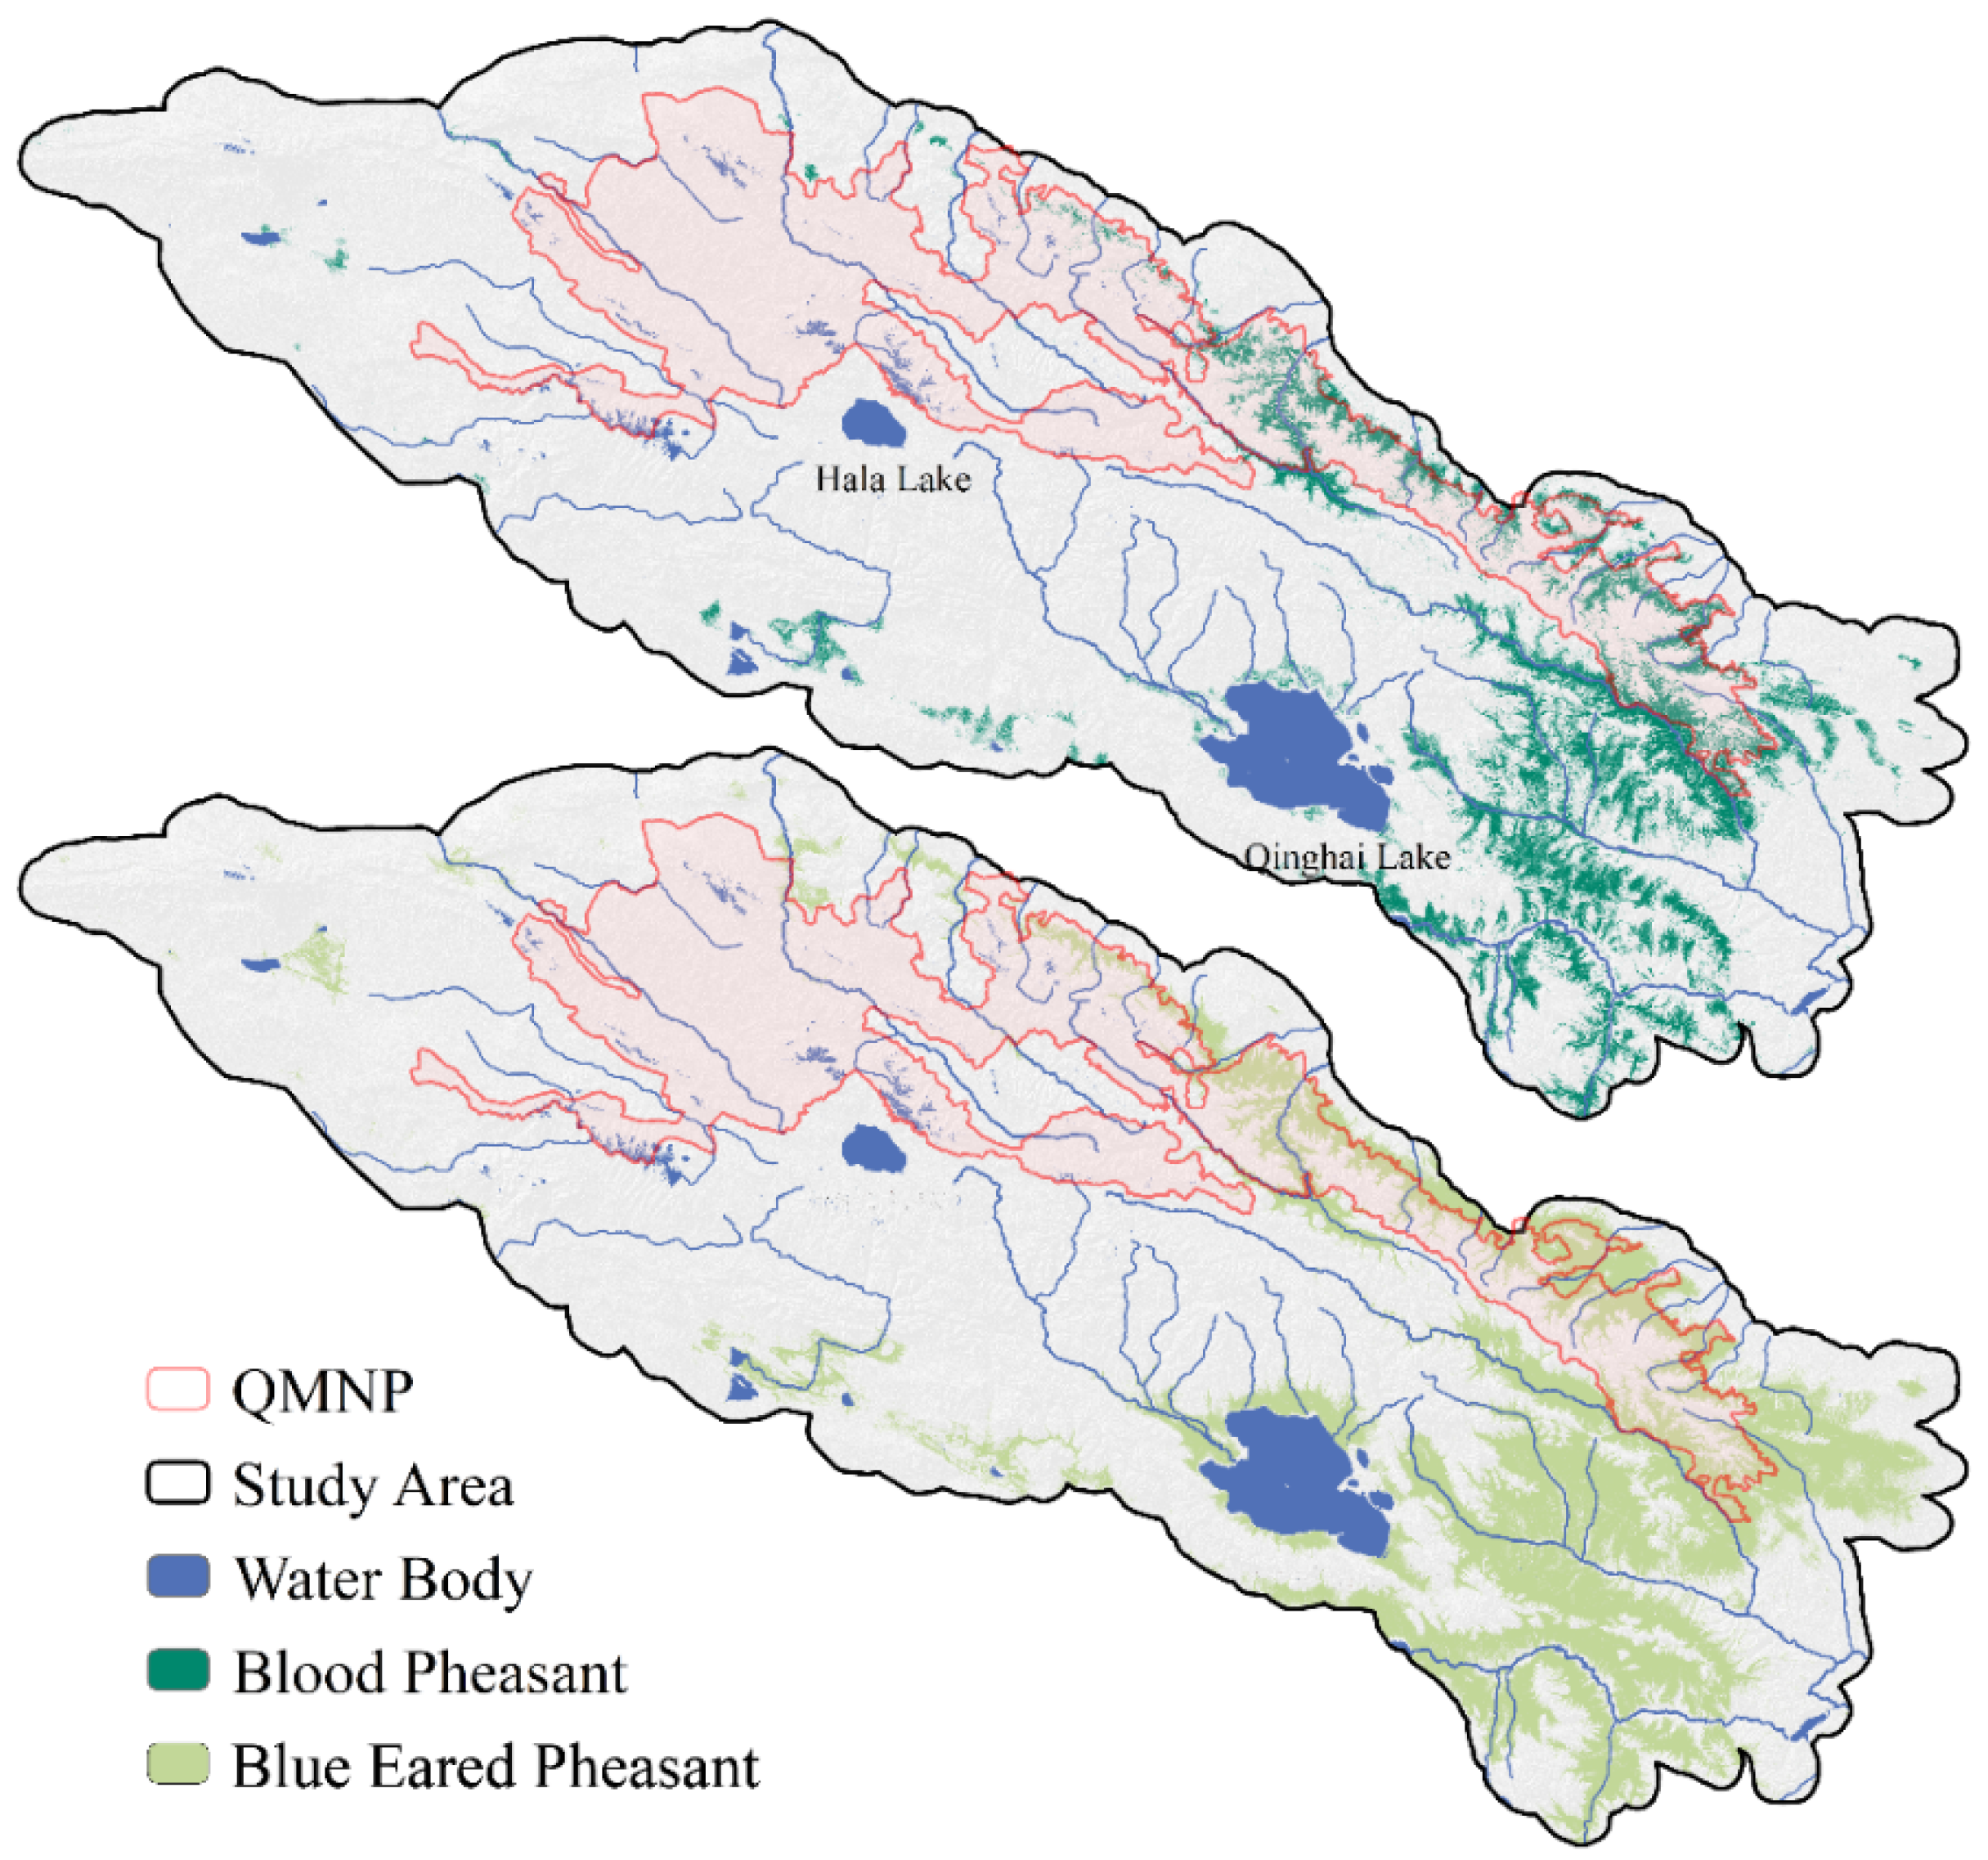
3.2. Potential Distribution and Niche Differentiation

The predicted geographical distribution of the blood pheasant and the blue eared pheasant mainly concentrate on the east part of the Qilian Mountains, with a total potential distribution area of 18,281 km2 for the blood pheasant and 43,223 km2 for the blue eared pheasant (Figure 2). Their distributions overlapped by 17,321 km2, which is 94.7% of the total potential distribution area for the blood pheasant and 40.1% for the blue eared pheasant. According to the response curves, both the blood pheasant and the blue eared pheasant distributed around 3 km ASL, mostly within 5 km from cropland, and within 20 km from lakes (Figure 3). The response curve for aspect shows that the two pheasants favor the north slope slightly more than the south slope. Both the blood pheasant and the blue eared pheasant prefer habitats in broad-leaved and needle-leaved forests with slopes steeper than 15 degrees but differentiated in the distance to rivers, where blood pheasants relatively prefer to be closer to rivers (Figure 3). According to the result of the differentiation test, blood pheasants and blue eared pheasants show significant differentiation in altitude, distance to rivers, lakes, buildings, roads, and land use and land cover, whereas blood pheasants occupy a narrower altitude range and tend to be closer to rivers, lakes, buildings, and roads. No significant differentiation was found for slope, aspect, and distance to cropland (Table 2).

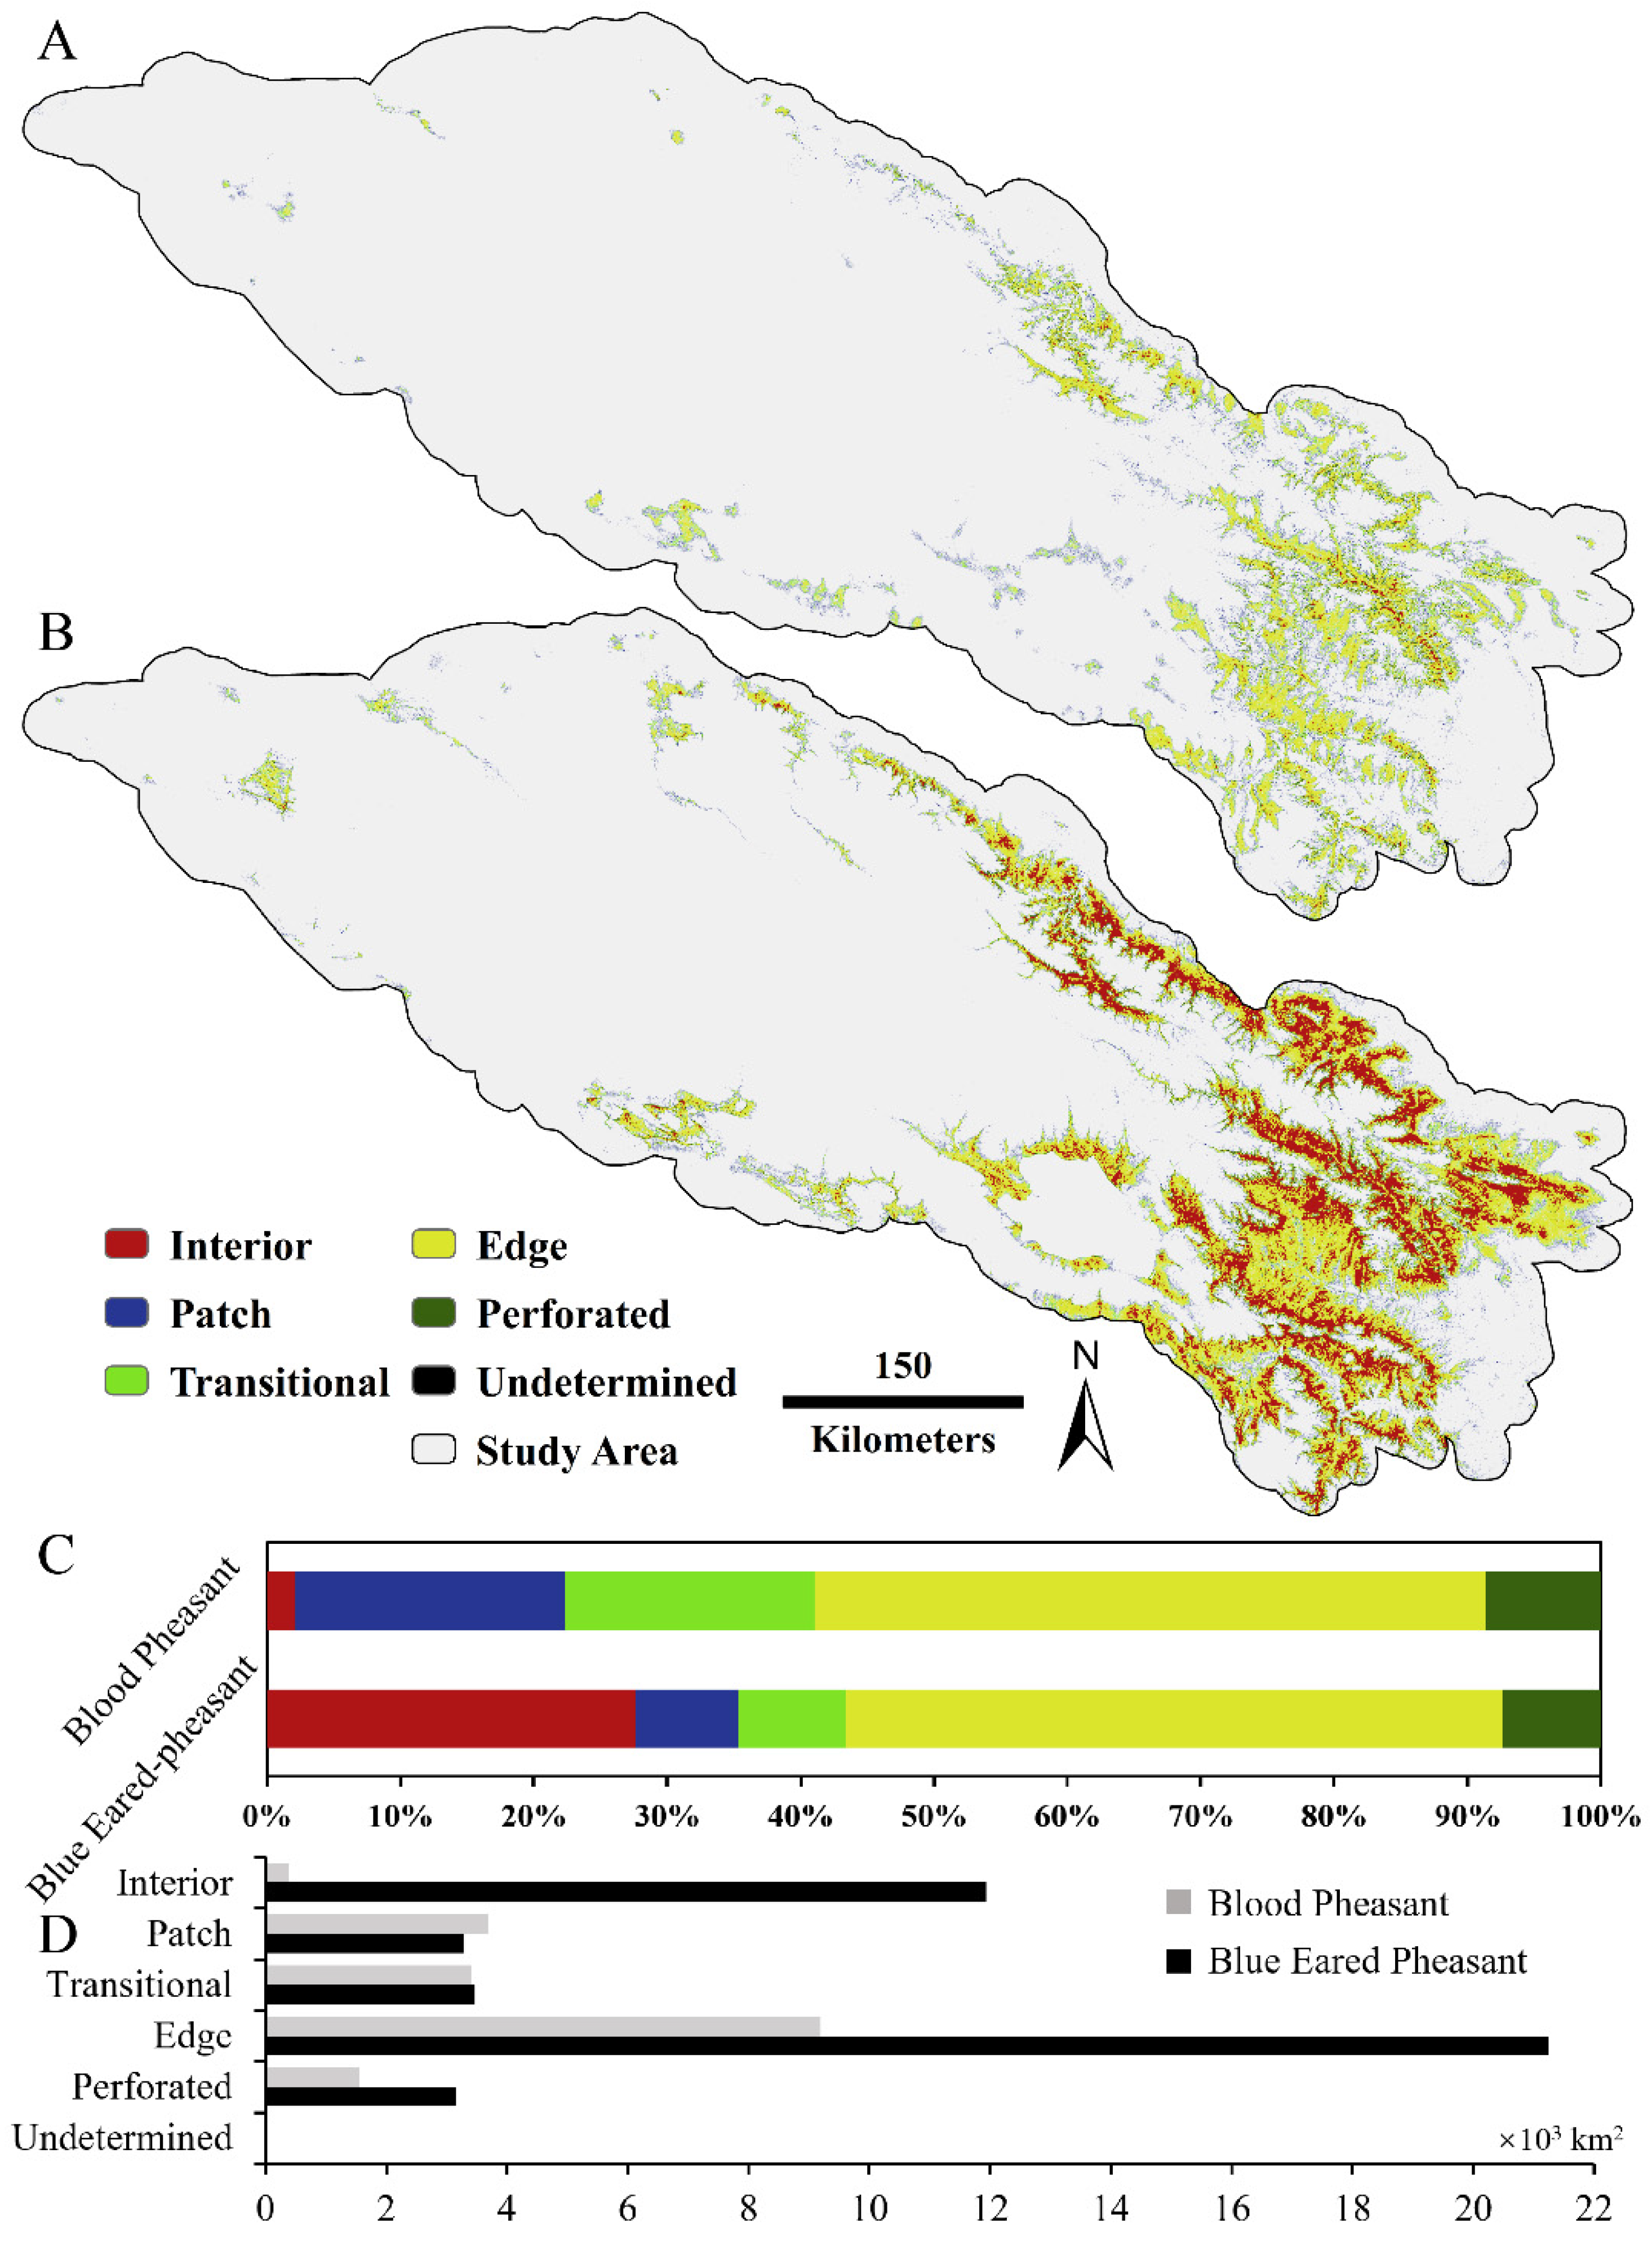
3.3. Habitat Fragmentation and Protection GAP

After determining the suitable areas of the blood pheasant and the blue eared pheasant, we divided them into 135 and 19 suitable patches according to their maximum diffusion distance, and found that the suitable patches of the blood pheasant were more separated than those of the blue eared pheasant. Large patches of predicted habitat for both species were primarily located in the southeast Qilian Mountains. With higher dispersal ability, NP decreases, whereas LPI, PLAND, and CL rise with higher dispersal ability (Table A3). For the blood pheasant, 7.9–13.4% of the landscape was occupied by connected habitat patches, compared to 20.0–24.0% for the blue eared pheasant, depending on different dispersal abilities. According to the calculated metrics, the habitat of the blood pheasant is noticeably more fragmented than that of the blue eared pheasant.
Our functional habitat categorization analysis revealed that the ‘Interior’ habitat category predicted for the blood pheasant, throughout all predicted suitable areas, is very limited; only 2.1% of suitable areas are categorized as ‘Interior’, 20.2% of its habitat categorized as ‘Patch’, 50.4% as ‘Edge’ areas, and 18.7% as ‘Transitional’. In comparison, the blue eared pheasant had 27.7% of suitable areas are categorized as ‘Interior’, 7.6% of its habitat categorized as ‘Patch’, 49.3% as ‘Edge’ areas, and 8.0% as ‘Transitional’ (Figure 4). The ‘Patch’ and ‘Transitional’ habitats were relatively more proportionate in the predicted habitat of the blood pheasant, whereas the proportion of ‘Edge’ was similar between the two pheasants (Figure 4).
The species distribution model showed that a major portion of the distribution of blood pheasants and blue eared pheasants falls outside of the Qilian NP. Only 22.9% of the blood pheasant’s habitat is protected and in the range of the QMNP area, and only 17.6% for the blue eared pheasant. There is a large area of concentrated and connected habitat unprotected in the southeast Qilian Mountains, indicating a large protection gap for the two pheasants.

4. Discussion

The establishment of the QMNP is an important step taken to protect and restore the ecosystem and biodiversity of the area. Understanding the habitat status and how endemic species respond to habitat fragmentation in the Qilian Mountains can contribute to the future protection of wild animals in QMNP. In this study, we modeled the potential distribution and quantified the habitat fragmentation of blood pheasants and blue eared pheasants in the Qilian Mountains. Different from a previous study in the Gansu areas of the Qilian Mountains [9], we performed the analysis in a larger area with a different set of fine-scaled environmental variables. The SDM result showed extensive overlap between the blood pheasant and the blue eared pheasant, whereas their habitats are fragmented differently. Large areas of protection gaps for two pheasants were found that could promote the QMNP to serve a better role in protecting their fragmented habitats.
Our results revealed highly fragmented geographical patterns in the two pheasants, while blood pheasants had a smaller and more fragmented habitat with a minor percent of core habitat (namely, ‘Interior’) (Figure 4). The more limited dispersal distance and stricter habitat selection of the blood pheasant may cause habitat fragmentation. On the contrary, the broader spatial niche of the blue eared pheasant makes it more resilient to forest fragmentation which is also related to its broader food choice [48]. In the field study, we found that blood pheasants were more alert to human presence, with less activity in open areas and preferred the north slope, or shady slope, which may be caused by major forest growth on the shady slope or the north slope, due to relatively less evapotranspiration [49]. In addition, we found there are excessive pasture fences in the forest, disrupting the natural dispersal of pheasants and other ground-dwelling animals [50]. Since blood pheasants and blue eared pheasants both rely heavily on needle-leaved and broad-leaved forests (Figure 3), the extensive segmentation by fences may be another reason for the current landscape pattern of the two pheasants [18,19,23].
Over the last 20 years, rapid infrastructure development in China has had a severe impact on the habitats of endangered species, since the distance from their core habitat to the impervious infrastructure is shortening every year [16]. The response curves for both blood pheasants and blue eared pheasants indicated that the major sustainable habitats of the two pheasants fell within 10 km of transportation infrastructure (i.e., distance to roads) and built-up areas (i.e., distance to buildings) (Figure 3). The smaller extent of the blood pheasant’s distribution may be related to their vicinity to human infrastructure. It seems that the two species of pheasants are well adapted to human infrastructure, even in their core habitat. Other studies regarding the brown eared pheasant (Crossoptilon auritum) and the Reeves’s pheasant (Syrmaticus reevesii), also show that moderate human disturbance has a positive effect on their populations [51,52,53]. However, the capability of living near man-made infrastructure can be an ecological trap (i.e., habitats more or equally preferred, but with costs to fitness [54]) for both species. Moreover, areas that are more urbanized may not be included in a natural protecting zone, increasing the risk of further deteriorating their habitat.
For better conservation, it is crucial not only to protect the major habitats of these pheasants but also to prevent the continuous degradation of habitat fragmentation. The development of human infrastructure should be avoided around the species’ core habitat and breeding zones. Future examination and systematic assessment of local biodiversity and its reaction to human interference (i.e., excessive fences) are needed. Based on the modeling of the blood pheasant and the blue eared pheasant, we suggest that more effort should be taken to protect areas exploited by humans but also habitable for wild animals.

5. Conclusions

In this study, we used SDM to model the geographical distribution of blood pheasants and blue eared pheasants, and used a modified analytical model to quantify their functional habitat fragmentations. We found that their habitats largely overlapped and were severely fragmented. Between them, the blood pheasant has a smaller and more fragmented habitat, which may be related to its stricter habitat selection and narrower food selection, as well as because of the extensive fences in the forest. Many of their habitats are located near human infrastructure and remain largely unprotected, with only 22.9% of blood pheasants’ habitats being protected by the QMNP. By comparison, only 17.6% is protected for the blue eared pheasant. The future protection plan needs to alleviate the conflict between grazing and wildlife protection, while putting more effort in protecting wildlife habitats in human-exploited areas.

Author Contributions

Conceptualization, Y.-H.S., K.S. and Y.F.; methodology, K.S., X.-H.L. and W.-D.X.; software, K.S. and W.-D.X.; validation, Y.-H.S., K.S., Y.F. and J.J.; investigation, J.J., W.-D.X., C.-L.B., L.-M.M., G.-S.W.-J., Y.F., K.S., Q.-L.L., H.-Q.Y. and F.-Y.X.; resources, Y.-H.S., Y.F., D.-F.M. and K.S.; data curation, K.S.; writing—original draft preparation, W.-D.X.; writing—review and editing, Y.-H.S., K.S., W.-D.X., Y.F. and J.J.; visualization, W.-D.X.; supervision, Y.-H.S. and K.S.; project administration, Y.-H.S.; funding acquisition, Y.-H.S. All authors have read and agreed to the published version of the manuscript.

Funding

This research was funded to Yue-Hua Sun by the Biodiversity Conservation Project of the Second Forest and Grass Ecosystem Recovery Funding in 2021 (funding number QHTX-2021-007).

Institutional Review Board Statement

Not applicable.

Informed Consent Statement

Not applicable.

Acknowledgments

We thank the Administration of Qilian National Park (including Long-term Scientific Base, Qinghai Service Center, Menyuan Management Division and Qilian Management Division) for their help during our field surveys.

Conflicts of Interest

The authors declare no conflict of interest.

Appendix A. Land Cover and Land Use

Figure A1. Land cover and land use in the study area.
Land 11 02104 g0a1

Appendix B. Result of Field Study

Figure A2. Location of line transects and camera-trapping in the Qilian Mountains. Field study was mainly carried out at Xianmi, Sigou (A) and East Qilian (B).
Land 11 02104 g0a2

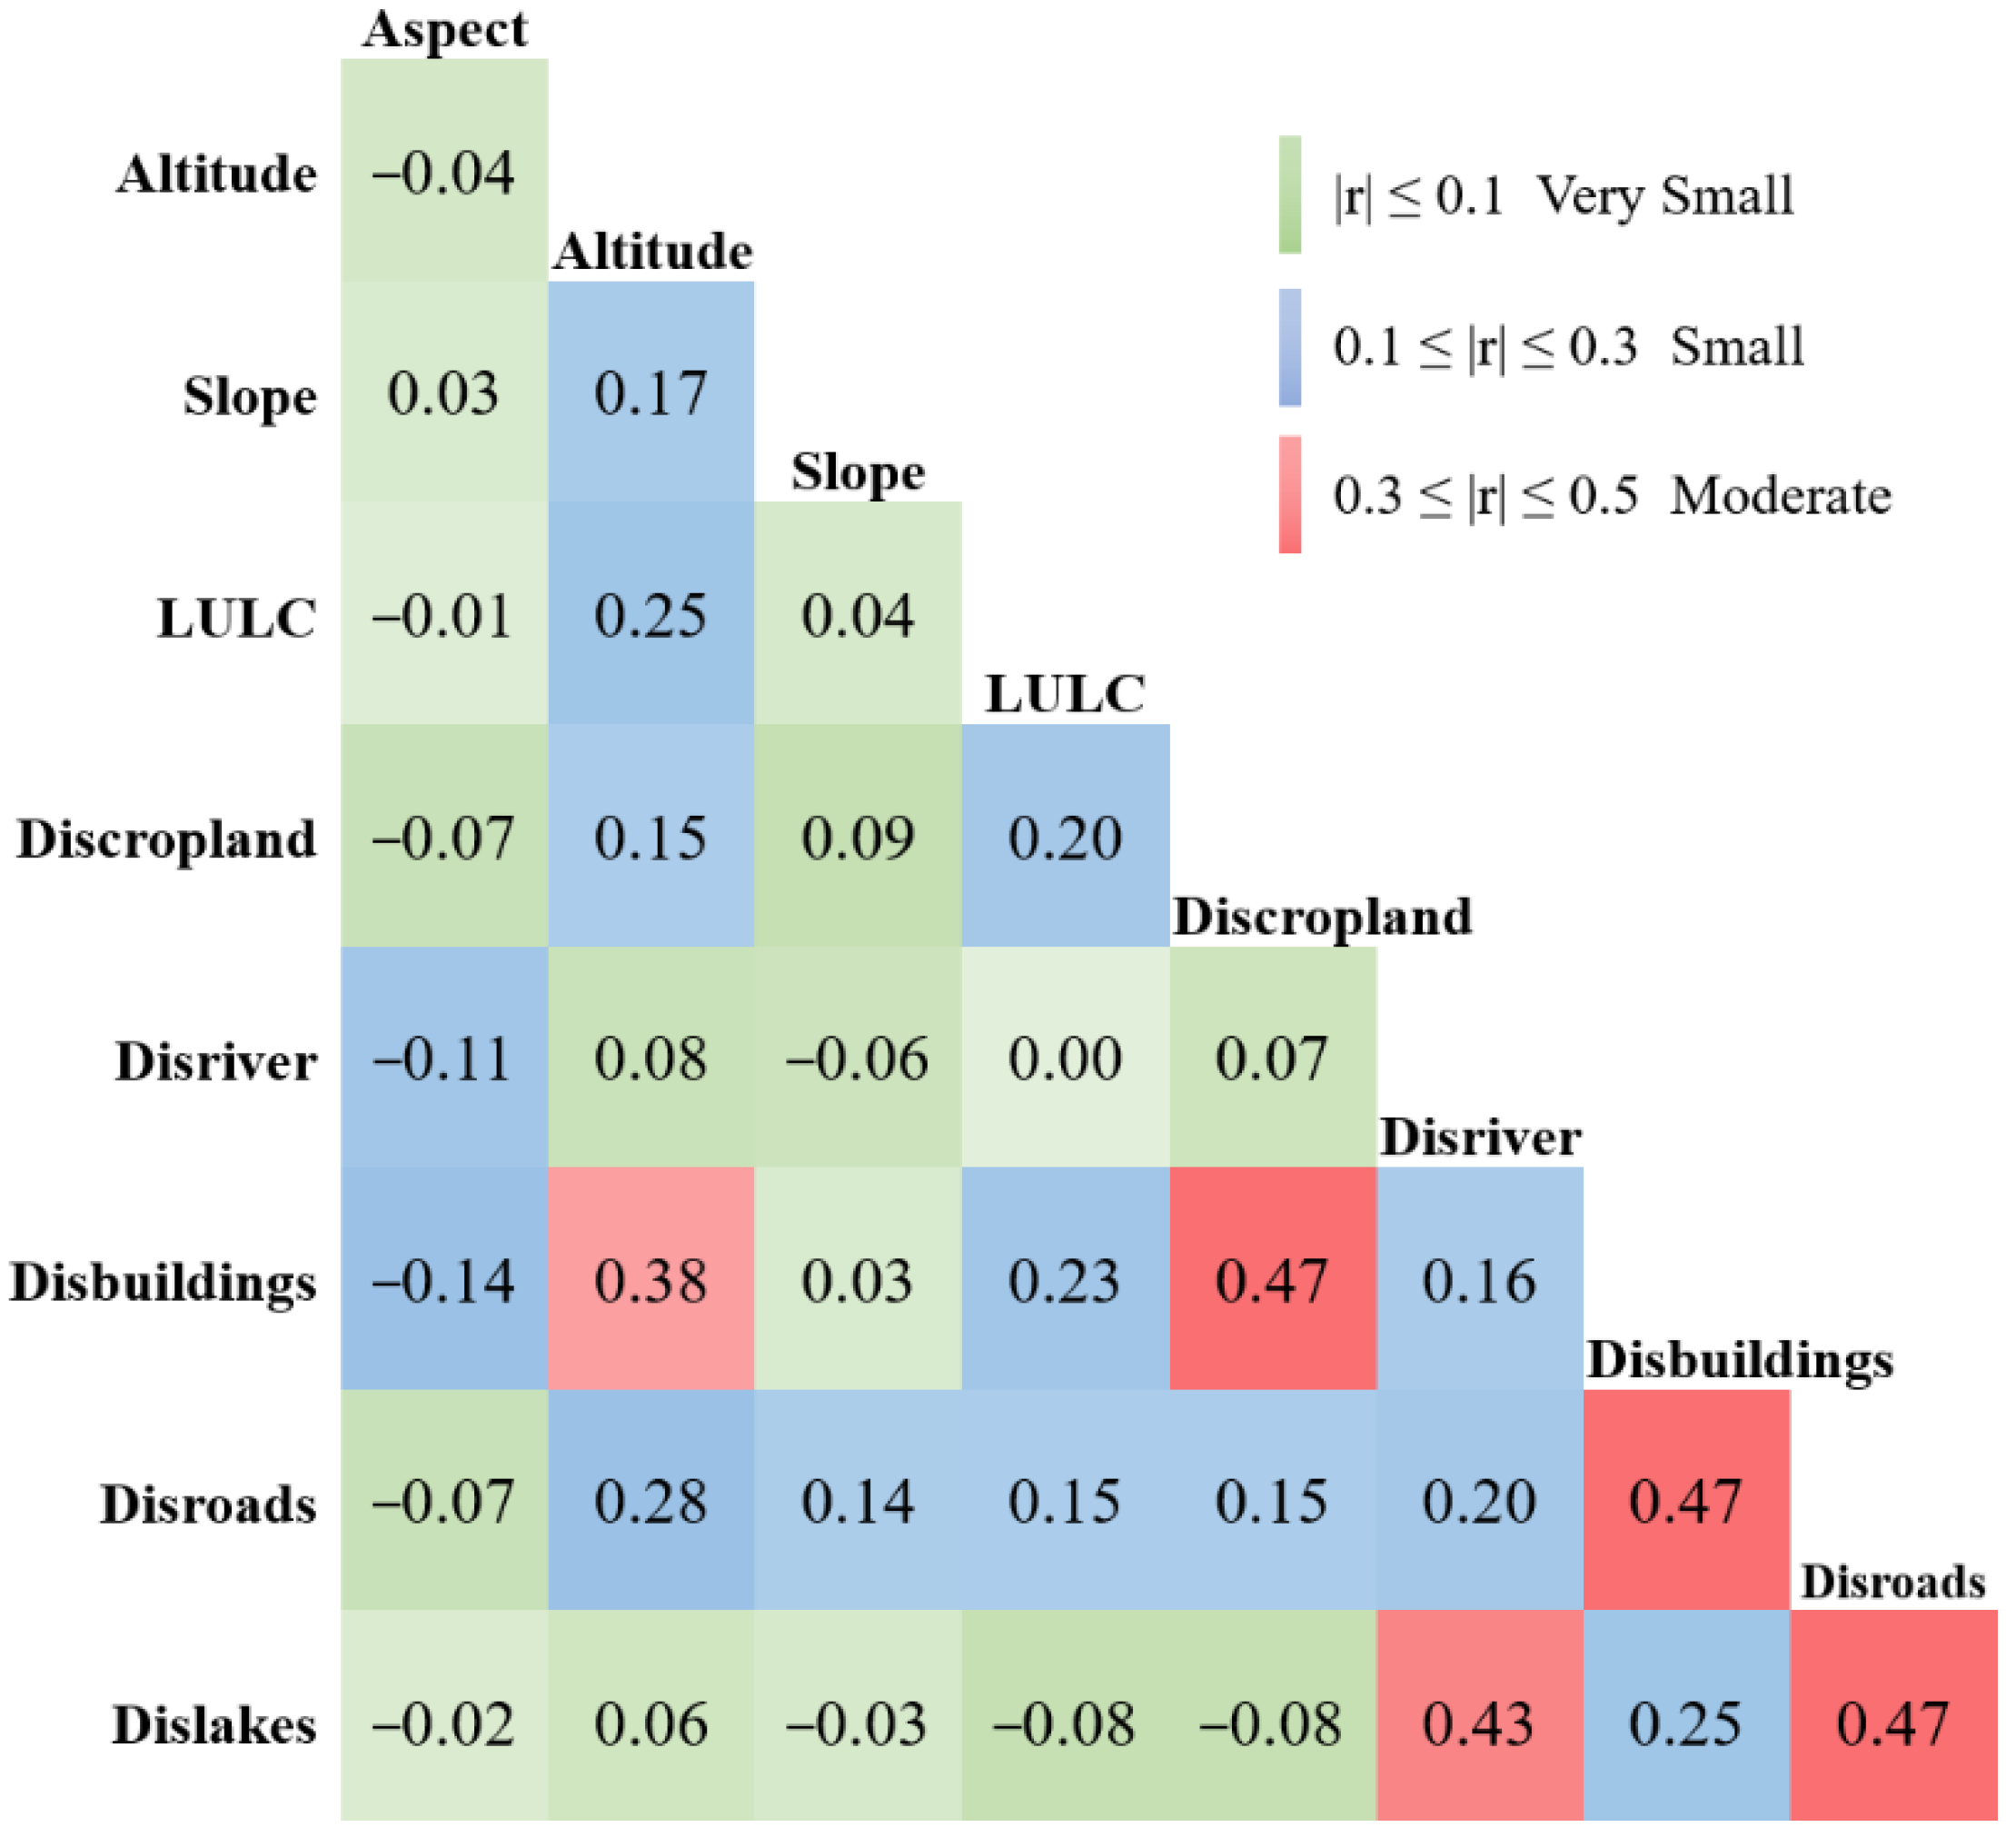
Appendix C. Correlation of Environmental Variable

Figure A3. Pearson’s correlation (r) test for every environmental variable using Cohen’s 1988 rule to determine the significance level.
Land 11 02104 g0a3

Appendix D. Occurrence Data Source

Table A1. Source of occurrence data used for the distribution modeling of the blood pheasant and the blue eared pheasant.
SpeciesTotalSelectedGBIFField SurveyPrevious Studies
Blood Pheasant1961723010537
Blue Eared Pheasant2632585585118

Appendix E. Field Survey Result

Table A2. Result of line transect and camera-trap survey.
Survey SiteSurvey PeriodTotal CamerasNo. of Blood Pheasant Obs.No. of Blue Eared Pheasant Obs.
Xian-mi26–27 April 161416
Si-gou28–29 April 27913
East of Qilian country30 April–2 May578756

Appendix F. Regularized Training Gain

Figure A4. Regularized training gain for each variable for the blood pheasant (A) and the blue eared pheasant (B).
Land 11 02104 g0a4

Appendix G. Fragmentation Analysis

Table A3. Ecological niche fragmentation analysis. NP: number of isolated patches; LPI: largest patch index; PLAND: percentage of the landscape; CL: correlation length (or GYRATE_AM: area-weighted mean radius of gyration).
SpeciesDispersal Distance (km)NPLPIPLANDCL
Blood Pheasant0.516995.087.8262,591.64
15188.019.8598,775.56
1.52669.2211.27103,526.01
218310.0712.41108,159.23
2.513510.7813.39109,810.40
Blue Eared Pheasant34316.1020.03127,128.70
43117.7321.50142,703.49
52320.4122.78163,100.33
5.52020.8823.38164,575.24
61921.2823.96165,054.78

References

  1. Bełcik, M.; Lenda, M.; Amano, T.; Skórka, P. Different response of the taxonomic, phylogenetic and functional diversity of birds to forest fragmentation. Sci. Rep. 2020, 10, 20320. [Google Scholar] [CrossRef] [PubMed]
  2. Liu, J.; Coomes, D.A.; Gibson, L.; Hu, G.; Liu, J.; Luo, Y.; Wu, C.; Yu, M. Forest fragmentation in China and its effect on biodiversity. Biol. Rev. 2019, 94, 1636–1657. [Google Scholar] [CrossRef]
  3. Wang, P.; Xia, W.; Zhou, E.; Li, Y.; Hu, J. Suitable Habitats of Chrysolophus spp. Need Urgent Protection from Habitat Fragmentation in China: Especially Suitable Habitats in Non-Nature Reserve Areas. Animals 2022, 12, 2047. [Google Scholar] [CrossRef] [PubMed]
  4. Watson, J.E.M.; Whittaker, R.J.; Freudenberger, D. Bird community responses to habitat fragmentation: How consistent are they across landscapes? J. Biogeogr. 2005, 32, 1353–1370. [Google Scholar] [CrossRef]
  5. Lu, N.; Jia, C.-X.; Lloyd, H.; Sun, Y.-H. Species-specific habitat fragmentation assessment, considering the ecological niche requirements and dispersal capability. Biol. Conserv. 2012, 152, 102–109. [Google Scholar] [CrossRef]
  6. Song, K.; Gao, B.; Halvarsson, P.; Fang, Y.; Klaus, S.; Jiang, Y.-X.; Swenson, J.E.; Sun, Y.-H.; Höglund, J. Demographic history and divergence of sibling grouse species inferred from whole genome sequencing reveal past effects of climate change. BMC Ecol. Evol. 2021, 21, 194. [Google Scholar] [CrossRef] [PubMed]
  7. Hu, R.; Wen, C.; Gu, Y.; Wang, H.; Gu, L.; Shi, X.; Zhong, J.; Wei, M.; He, F.; Lu, Z. A bird’s view of new conservation hotspots in China. Biol. Conserv. 2017, 211, 47–55. [Google Scholar] [CrossRef]
  8. Lei, F.-M.; Qu, Y.-H.; Tang, Q.-Q.; An, S.-C. Priorities for the conservation of avian biodiversity in China based on the distribution patterns of endemic bird genera. Biodivers. Conserv. 2003, 12, 2487–2501. [Google Scholar] [CrossRef]
  9. Zhang, D.; An, B.; Chen, L.; Sun, Z.; Mao, R.; Zhao, C.; Zhang, L. Camera Trapping Reveals Spatiotemporal Partitioning Patterns and Conservation Implications for Two Sympatric Pheasant Species in the Qilian Mountains, Northwestern China. Animals 2022, 12, 1657. [Google Scholar] [CrossRef]
  10. Li, D.-H.; Li, C.-Q. Blue-eared Phessant and Blood Pheasant in the Forestry of Qi-Lian Xian, Qinghai. Zool. Res. 1981, 1, 77–82. [Google Scholar]
  11. Song, K.; Gao, B.; Halvarsson, P.; Fang, Y.; Klaus, S.; Jiang, Y.-X.; Swenson, J.E.; Han, Z.-M.; Sun, Y.-H.; Höglund, J. Conservation genomics of sibling grouse in boreal forests reveals introgression and adaptive population differentiation in genes controlling epigenetic variation. Zool. Res. 2022, 43, 184. [Google Scholar] [CrossRef] [PubMed]
  12. Johnsgard, P.A. The Pheasants of the World: Biology and Natural History. Hist. Philos. Life Sci. 2002, 23, 547. [Google Scholar]
  13. Jia, C.-X.; Sun, Y.-H.; Swenson, J.E. Unusual Incubation Behavior and Embryonic Tolerance of Hypothermia by the Blood Pheasant (Ithaginis cruentus). Auk 2010, 127, 926–931. [Google Scholar] [CrossRef]
  14. Xin, L.; Guangmei, Z.; Binyuan, G. A preliminary investigation on taxonomy, distribution and evolutionary relationship of the eared pheasants, Crossoptilon. Dong Wu Xue Bao 1998, 44, 131–137. [Google Scholar]
  15. Li, X.; Huang, Y.; Lei, F. Comparative mitochondrial genomics and phylogenetic relationships of the Crossoptilon species (Phasianidae, Galliformes). BMC Genom. 2015, 16, 42. [Google Scholar] [CrossRef] [Green Version]
  16. Tian, S.; Xu, J.; Li, J.; Zhang, M.; Wang, Y. Response of Reeves’s Pheasants Distribution to Human Infrastructure in the Dabie Mountains over the Last 20 Years. Animals 2021, 11, 2037. [Google Scholar] [CrossRef]
  17. Yang, G.-J.; Xiao, D.-N.; Zhao, C.-Z. GIS-based Analysis on the Forest Landscape Patterns in the Qilian Mountain. Arid Zone Res. 2004, 1, 27–32. [Google Scholar]
  18. Yang, G.; Xiao, D. Forest landscape pattern and fragmentation: A case study on Xishui Natural Reserve in Qilian Mountain. Chin. J. Ecol. 2003, 22, 56–61. [Google Scholar]
  19. Tang, C.; Zhang, H.; Chen, Y.; Yao, X.; Wang, L.; Xiao, D. Vegetation landscape pattern and its fragmentation on southern slope of Qilian Mountain. Chin. J. Ecol. 2009, 28, 2305–2310. [Google Scholar]
  20. Fuller, R.A.; Garson, P.J. (Eds.) Pheasants: Status Survey and Conservation Action Plan 2000–2004; IUCN: Gland, Switzerland; Cambridge, UK; The World Pheasant Association: Reading, UK, 2000. [Google Scholar]
  21. Li, S.; Wang, D.; Xiao, Z.; Li, X.; Wang, T.; Feng, L.; Wang, Y. Camera-trapping in wildlife research and conservation in China: Review and outlook. Biodivers. Sci. 2014, 22, 685–695. [Google Scholar]
  22. Riitters, K.; Wickham, J.; O’Neill, R.; Jones, B.; Smith, E. Global-scale patterns of forest fragmentation. Conserv. Ecol. 2000, 4, 3. [Google Scholar] [CrossRef]
  23. Deng, S.-F.; Yang, T.-B.; Zeng, B.; Zhu, X.-F.; Xu, H.-J. Vegetation cover variation in the Qilian Mountains and its response to climate change in 2000–2011. J. Mt. Sci. 2013, 10, 1050–1062. [Google Scholar] [CrossRef]
  24. Xu, Z.; Zhao, C.; Feng, Z. Species distribution models to estimate the deforested area of Picea crassifolia in arid region recently protected: Qilian Mts. National Natural Reserve (China). Pol. J. Ecol. 2012, 60, 515–524. [Google Scholar]
  25. Rong, Z.; Zhao, C.; Liu, J.; Gao, Y.; Zang, F.; Guo, Z.; Mao, Y.; Wang, L. Modeling the Effect of Climate Change on the Potential Distribution of Qinghai Spruce (Picea crassifolia Kom.) in Qilian Mountains. Forests 2019, 10, 62. [Google Scholar] [CrossRef] [Green Version]
  26. Chen, G.-C.; Peng, M.; Huang, R.-F.; Lu, X.-F. Vegetation Characteristics and Its Distribution of Qilian Mountain Region. Acta Bot. Sin. 1994, 36, 10. [Google Scholar]
  27. Song, K.; Mi, C.-R.; Zhao, Y.-Z.; Yang, N.; Sun, Y.-H.; Xu, J.-L. Zonation of nature reserve according to the habitat requirement of conservation target: A case study on the endangered Brown Eared-Pheasant at Baihuashan Nature Reserve. Glob. Ecol. Conserv. 2021, 32, e01941. [Google Scholar] [CrossRef]
  28. Zhang, X.; Liu, L.; Chen, X.; Gao, Y.; Xie, S.; Mi, J. GLC_FCS30: Global land-cover product with fine classification system at 30 m using time-series Landsat imagery. Earth Syst. Sci. Data 2021, 13, 2753–2776. [Google Scholar] [CrossRef]
  29. Cohen, J. Statistical Power Analysis for the Behavioral Sciences, 2nd ed.; Routledge: New York, NY, USA, 1988. [Google Scholar]
  30. Phillips, S.J.; Dudík, M.; Schapire, R.E. A maximum entropy approach to species distribution modeling. In Proceedings of the Twenty-First International Conference on Machine Learning, Banff, AB, Canada, 4–8 July 2004; pp. 655–662. [Google Scholar]
  31. Phillips, S.J.; Anderson, R.P.; Schapire, R.E. Maximum Entropy Modeling of Species Geographic Distributions. Ecol. Model. 2006, 190, 231–259. [Google Scholar] [CrossRef] [Green Version]
  32. Coudrat, C.N.; Nekaris, K.A. Modelling Niche Differentiation of Co-Existing, Elusive and Morphologically Similar Species: A Case Study of Four Macaque Species in Nakai-Nam Theun National Protected Area, Laos. Animals 2013, 3, 45–62. [Google Scholar] [CrossRef]
  33. Meza Mori, G.; Barboza Castillo, E.; Torres Guzman, C.; Cotrina Sanchez, D.A.; Guzman Valqui, B.K.; Oliva, M.; Bandopadhyay, S.; Salas Lopez, R.; Rojas Briceno, N.B. Predictive Modelling of Current and Future Potential Distribution of the Spectacled Bear (Tremarctos ornatus) in Amazonas, Northeast Peru. Animals 2020, 10, 1816. [Google Scholar] [CrossRef]
  34. Hernandez, P.A.; Graham, C.H.; Master, L.L.; Albert, D.L. The effect of sample size and species characteristics on performance of different species distribution modeling methods. Ecography 2006, 29, 773–785. [Google Scholar] [CrossRef]
  35. Aguirre-Gutiérrez, J.; Carvalheiro, L.G.; Polce, C.; van Loon, E.E.; Raes, N.; Reemer, M.; Biesmeijer, J.C. Fit-for-Purpose: Species Distribution Model Performance Depends on Evaluation Criteria—Dutch Hoverflies as a Case Study. PLoS ONE 2013, 8, e63708. [Google Scholar] [CrossRef] [PubMed] [Green Version]
  36. McHugh, M.L. Interrater reliability: The kappa statistic. Biochem. Med. 2012, 22, 276–282. [Google Scholar] [CrossRef]
  37. Tang, Y.; Winkler, J.A.; Viña, A.; Liu, J.; Zhang, Y.; Zhang, X.; Li, X.; Wang, F.; Zhang, J.; Zhao, Z.J.P.O. Uncertainty of future projections of species distributions in mountainous regions. PLoS ONE 2018, 13, e0189496. [Google Scholar] [CrossRef] [Green Version]
  38. Song, K. Habitat Suitability Assessment of the Eastern Population of Brown Eared Pheasant (Crossoptilon mantchuricum) and Its Implication in Conservation. Master’s Thesis, Beijing Forestry University, Beijing, China, 2015. [Google Scholar]
  39. McGarigal, K. FRAGSTATS: Spatial Pattern Analysis Program for Quantifying Landscape Structure; US Department of Agriculture, Forest Service, Pacific Northwest Research Station: Corvallis, OR, USA, 1995; Volume 351.
  40. Wang, W.; Ren, G.; He, Y.; Zhu, J. Habitat Degradation and Conservation Status Assessment of Gallinaceous Birds in the Trans-Himalayas, China. J. Wildl. Manag. 2008, 72, 1335–1341. [Google Scholar] [CrossRef]
  41. Clark, W.R.; Schmitz, R.A.; Bogenschutz, T.R. Site selection and nest success of ring-necked pheasants as a function of location in Iowa landscapes. J. Wildl. Manag. 1999, 63, 976–989. [Google Scholar] [CrossRef]
  42. Johnson, M.; Reich, P.; Mac Nally, R. Bird assemblages of a fragmented agricultural landscape and the relative importance of vegetation structure and landscape pattern. Wildl. Res. 2007, 34, 185–193. [Google Scholar] [CrossRef]
  43. Das, P.; Behera, M.D.; Murthy, M.S.R. Forest fragmentation and human population varies logarithmically along elevation gradient in Hindu Kush Himalaya-utility of geospatial tools and free data set. J. Mt. Sci. 2017, 14, 2432–2447. [Google Scholar] [CrossRef]
  44. Mohammadi, A.; Almasieh, K.; Nayeri, D.; Ataei, F.; Khani, A.; Lopez-Bao, J.V.; Penteriani, V.; Cushman, S.A. Identifying priority core habitats and corridors for effective conservation of brown bears in Iran. Sci. Rep. 2021, 11, 1044. [Google Scholar] [CrossRef]
  45. Cushman, S.A.; Landguth, E.L. Ecological Associations, Dispersal Ability, and Landscape Connectivity in the Northern Rocky Mountains; Research Paper RMRS-RP-90; US Department of Agriculture, Forest Service, Rocky Mountain Research Station: Fort Collins, CO, USA, 2012; 21p.
  46. Elliot, N.B.; Cushman, S.A.; Macdonald, D.W.; Loveridge, A.J. The devil is in the dispersers: Predictions of landscape connectivity change with demography. J. Appl. Ecol. 2014, 51, 1169–1178. [Google Scholar] [CrossRef]
  47. O’Neill, R.V.; Hunsaker, C.T.; Timmins, S.P.; Jackson, B.L.; Jones, K.B.; Riitters, K.H.; Wickham, J.D. Scale problems in reporting landscape pattern at the regional scale. Landsc. Ecol. 1996, 11, 169–180. [Google Scholar] [CrossRef]
  48. Li, C.Q.; Li, D.H. Blood Pheasant (Ithaginis cruentus) and Blue Eared Pheasant (Crossoptilon auritum) in Qilian forests district, Qinghai province. Zool. Res. 1981, 2, 80–85. [Google Scholar]
  49. Jin, X.; Zhang, Y.; Schaepman, M.E.; Clevers, J.; Su, Z.; Cheng, J.; Jiang, J.; van Genderen, J. Impact of Elevation and Aspect on the Spatial Distribution of Vegetation in the Qilian Mountain Area with Remote Sensing Data; International Society for Photogrammetry and Remote Sensing: Nice, France, 2008. [Google Scholar]
  50. Sun, J.; Liang, E.; Barrio, I.C.; Chen, J.; Wang, J.; Fu, B. Fences undermine biodiversity targets. Science 2021, 374, 269. [Google Scholar] [CrossRef]
  51. Song, K.; Mi, C.R.; Zhao, Y.Z.; Yang, N.; Sun, Y.H.; Xu, J.L. Modeling habitat factors and suitability for the Brown Eared Pheasant (Crossoption mantchuricum) in Baihuashan National Nature Reserve, Beijing. Chin. J. Zool. 2016, 51, 363–372. [Google Scholar]
  52. Zhou, C.; Xu, J.; Zhang, Z. Dramatic decline of the Vulnerable Reeves’s pheasant Syrmaticus reevesii, endemic to central China. Oryx 2015, 49, 529–534. [Google Scholar] [CrossRef] [Green Version]
  53. Song, K.; Mi, C.-R.; Yang, N.; Sun, L.; Sun, Y.-H.; Xu, J.-L. Improve the roles of nature reserves in conservation of endangered pheasant in a highly urbanized region. Sci. Rep. 2020, 10, 17673. [Google Scholar] [CrossRef] [PubMed]
  54. Zuñiga-Palacios, J.; Zuria, I.; Castellanos, I.; Lara, C.; Sánchez-Rojas, G. What do we know (and need to know) about the role of urban habitats as ecological traps? Systematic review and meta-analysis. Sci. Total Environ. 2021, 780, 146559. [Google Scholar] [CrossRef] [PubMed]
Figure 1. Species occurrence sites (the black spots) for blood pheasant (A) and blue eared pheasant (B). The range of the QMNP is highlighted in green. The administrative border of China was derived from the Standard Map Service: GS(2019)1686.
Land 11 02104 g001
Figure 2. Binary map of the potential distribution of blood pheasants and blue eared pheasants. The range of the Qilian Mountains National Park (QMNP) is highlighted in red.
Land 11 02104 g002
Figure 3. Probability of presence in reaction to different variables. Forest type A: closed evergreen broadleaved forest, forest type B: closed deciduous broadleaved forest, forest type C: open evergreen needle-leaved forest, forest type D: closed evergreen needle-leaved forest, bare areas type A: bare areas, bare areas type B: consolidated bare areas, bare areas type C: unconsolidated bare areas.
Land 11 02104 g003
Figure 4. Functional habitat fragmentation categorization: (A) blood pheasant and (B) blue eared pheasant; (C) percentage of different habitat fragmentation and (D) total area of different habitat fragmentation.
Land 11 02104 g004
Table 1. Environmental variables used in the models.
TypeVariableDescriptionUnitSource
Topographic
variables
Altitude mASTER_GDEM_30M, From: https://earthexplorer.usgs.gov/
(Accessed on 23 June 2021)
Aspect °
Slope °
Land cover
variables
LULCLand Use
and Land Cover
-GLC_FCS30-2020, From: http://data.casearth.cn/sdo/detail/5d904b7a0887164a5c7fbfa0
(Accessed on 10 July 2021)
Euclidean
distance factor
CroplandDistance to croplandsm
LakeDistance to lakesm
RiverDistance to riversmRiver data from https://hydrosheds.org/page/hydrorivers
(Accessed on 11 July 2021)
RoadDistance to roadsmGaode Map
BuildingDistance to buildingsmGHSL, From: https://ghslsys.jrc.ec.europa.eu/download.php
(Accessed on 10 July 2021)
Table 2. Percent contribution for each variable and differentiation test for each pair of variables. Variables were ranked by contribution percentage to the models.
Blood PheasantBlue Eared Pheasant
VariableRankContribution (%)RankContribution (%)
LULC ***163.6141.3
Discropland29.3228.1
Disbuildings ***39.142.7
Altitude **47.6321.6
Disroads ***54.580.7
Disriver ***6352
Slope71.290.7
Dislakes ***81.261.7
Aspect90.571.1
*** p < 0.01; ** p < 0.05.
Publisher’s Note: MDPI stays neutral with regard to jurisdictional claims in published maps and institutional affiliations.

