Article

Check-Dams and Silt Fences: Cost-Effective Methods to Monitor Soil Erosion under Various Disturbances in Forest Ecosystems

by
Aristeidis Kastridis
*,
Stella Margiorou
and
Marios Sapountzis
Laboratory of Mountainous Water Management and Control, School of Forestry and Natural Environment, Aristotle University of Thessaloniki, 54124 Thessaloniki, Greece
*
Author to whom correspondence should be addressed.
Land 2022, 11(12), 2129; https://doi.org/10.3390/land11122129
Submission received: 19 October 2022 / Revised: 11 November 2022 / Accepted: 23 November 2022 / Published: 25 November 2022

Abstract

:
The present study was conducted in the suburban forest “Seich Sou”, which is located at the north-east of Thessaloniki city (north Greece). “Seich Sou” is one of the most significant suburban forests of North Greece. However, many disastrous events have taken place in the suburban forest during the last 25 years, caused by either human interference or other biotic/abiotic factors, such as insect outbreaks. In the present study, erosion measurements and field data were collected using a combination of silt fences (USLE plots) and depositions retained behind the constructed check-dams, aiming to monitor the impact of the significant biotic and abiotic disturbances (forest fires, insect outbreaks, logging) in Seich Sou forest. Specifically, the aim of this study is to present a cost-effective and time saving methodology towards the achievement of accurate and reliable soil erosion measurements and field data acquisition. Additionally, the installation details, data recording and collection, field work, supplementary materials and the advantages of silt fences and check-dams are presented in detail, as well as the limitations of the methods and the difficulties during the installation, maintenance and data collection period. The proposed methodology could be effectively applied in many environments and in the context of varied purposes, to quantify the erosion and runoff processes with high accuracy, as well as to increase the accuracy of soil erosion modeling performance, through implementation of calibration and/or validation processes, which is a major issue for the scientific community.

1. Introduction

Soil erosion is a serious environmental issue around the world due to its significant effects on the natural environment and human lives [1,2,3]. Surface soil erosion consists of two phases, the soil particle detachment due to the erosive force of rain and the subsequent particle transportation via surface runoff and wind forces [4,5,6]. Rainfall intensity is considered to be one of the most significant factors that drive the erosion rates and the magnitude and frequency of floods [7,8].
In natural conditions, soil loss is balanced by the simultaneous soil formation via rock weathering and pedogenesis processes. However, there are various disturbances, caused by abiotic or biotic factors, mainly associated with anthropogenic activities which tend to accelerate the erosion rate by destroying plant cover [9,10,11,12,13]. Insect infestations, land use changes, wildfires, excessive tillage, and poor soil conservation techniques are only a few of the major disturbances that contribute to higher soil erosion rates [14,15,16,17,18]. Hence, water quality deterioration, soil degradation and land catastrophes are all significant environmental problems caused by soil erosion [19], as well as increased sediment production, movement, and deposition in natural lakes and water reservoirs [20,21,22,23].
Erosion modeling approaches have been established in order to estimate soil erosion under natural conditions and/or after a variety of disturbances. Soil conservation practices and erosion research are supported by the use of models, which present a variety of contexts, objectives, and levels of complexity [24,25]. Soil erosion modeling is a useful tool for improving our understanding of environmental processes and projecting future potential consequences [26]. Soil erosion models may be used to assess soil loss and runoff rates, design land use policies and plan government strategies and policies on soil erosion mitigation [27,28,29]. Soil loss mathematical equations and the associated modeling tools are well recognized for their efficiency in estimating soil erosion rates [30,31,32]. Furthermore, the use of GIS techniques in combination with mathematical models such as the Universal Soil Loss Equation (USLE) and the Revised Universal Soil Loss Equation (RUSLE) has been revealed to be an efficient tool for estimating both the quantity and spatial variability of soil erosion [33,34,35].
However, reliable and accurate calibration and validation of the erosion models requires sufficient soil erosion measurements and field data. Although, there has been a significant advancement in the creation of models and the respective parameter settings, output uncertainties still exist. The main sources of uncertainty are the non-linear relationships between the erodibility factors and the erosion rate, along with the challenges associated with scaling up of the model results from small (plots) to larger areas [36]. Despite the numerous soil erosion models and software, there is still a lack of knowledge regarding the validity, quality, and trustworthiness of modeling application outcomes [37]. Thus, soil erosion measurements and field data acquisition are vital for the proper implementation of erosion models, contributing to research, management and catastrophic events mitigation purposes.
There are various techniques for monitoring soil erosion, which usually require high cost, time and effort. Many approaches of assessing soil erosion have been developed over the years, but measuring soil erosion in real field circumstances, particularly at the mountainous landscape level, remains a challenge. Examples of these techniques are silt fences, check-dams, various scale field plots, erosion bridges, erosion pins/stakes, Gerlach troughs and small catchment measurement techniques [26,38,39,40,41].
In the present study, erosion measurements and field data were implemented and collected using a combination of silt fences (USLE plots) and cement check-dams monitoring. The silt fences were installed in the suburban forest of Thessaloniki (Seich Sou) to monitor the significant biotic and abiotic disturbances (forest fires, insect outbreaks, logging) that have taken place and have greatly influenced the vegetation cover during the last 25 years. The check-dams were constructed after the wildfire of 1997 as erosion and flood control measures. The specific results of this monitoring process can be found in the published studies of Kastridis et al. [14] and Margiorou et al. [13], while the aim of the specific work is to present in detail a cost-effective and time saving methodology for accurate and reliable soil erosion measurements and field data acquisition. Additionally, the installation details, data collection process, field work, materials and advantages of silt fences and check-dams are discussed here in detail, as well as the limitations of the methods and the difficulties during the installation, maintenance and data collection period, to assist the research community in establishing analogous projects in the future.

2. Materials and Methods

2.1. Description of the Study Area—Biotic and Abiotic Disturbances during the Last 25 Years

The suburban forest “Seich Sou” in located at the north-east side of Thessaloniki city (north Greece) and occupies an area of 3025.25 ha (Figure 1). According to the available meteorological data, the regional climate may be described as typical Mediterranean, with hot and dry summers and relatively temperate winters. The average annual rainfall is 444.5 mm, with higher values recorded in winter (December) and a secondary peak in spring (May). The average yearly temperature is 15.9 °C, the maximum temperature is 20.4 °C, and the minimum temperature is 10.1 °C. Gneiss geological structure prevails in the study area. The specific geological formation is mostly impervious to water and can be found in significant thickness. The largest part of the study area is covered mainly by forest (89.7 %), followed by agricultural areas (6.6 %), artificial surfaces (2.4%), and pastures (1.3 %). The forest topography may be classified as hilly and semi-mountainous and relatively steep, with a mean elevation of 306.3 m a.s.l (maximum 569.5 m, minimum 56.8 m), mean slope of 26.2%, and dominating aspect of SE-S-SW. The prevailing tree species is Pinus brutia L.
In the last decades, “Seich Sou” suburban forest experienced many disastrous events caused by either human interference or other biotic/abiotic factors, such as insect outbreaks, resulting in the constant degradation of the forest ecosystem. Specifically, a wildfire burned more than half of the woodland area in 1997. Following the 1997 wildfire, reforestation was carried out primarily through the planting of various native species, while a significant amount of the burned region recovered naturally. In May 2019, there was a severe insect infestation triggered by the beetle Tomicus piniperda (bark beetle), which was responsible for the necrosis of several Pinus brutia trees. More than 300 ha of woodland were damaged as a result of the infestation, which is still ongoing. In an attempt to minimize and limit the spread of the infestation, selective logging and removal of affected trees from the forest has been carried out lately. In July of 2021, a wildfire took place in the area of “Seich Sou”, burning 9.2 ha of forest area.

2.2. Field Work-Silt Fences and Check-Dams in Disturbed Areas

The first step was a thorough discussion with the experts of the Forestry Service who know very well the areas of the forest that have suffered the destructive action of the various biotic and abiotic factors over time, in order to identify the appropriate points for placing the fences. More specifically, silt-fenced erosion plots were established on typical sites of disturbed and undisturbed forest areas to measure the influence of the aforementioned forest disturbances on soil erosion rates. Silt fences were installed in the following: (1) undisturbed area (as a control), (2) area with insect infestation, (3) area with infestation and subsequent logging of dead trees, (4) naturally reforested area (1997 forest fire), (5) area with reforestation failure (1997 forest fire) and (6) burned area (2021 forest fire). For each of the forest disturbance cases (and for the control area) five (5) silt fenced field plots were established, thirty (30) in total. Each plot covered an area of 110 m2 and extended 5 m along the contour and 22 m along the slope gradient. Consistent field work has been conducted to collect the sediments trapped by the silt fences after each significant rainfall incident or once a month (in the absence of extreme rainfall). Each time, the sediments were weighed and a sample of sediments was taken from the silt fences and dried for 24 h at 105 °C to determine the moisture content of the sediment materials and to calculate the dry weight of the total eroded soil.
Additionally, 18 check-dams were located in the study area. The dimension (height, length, width etc.) of the check-dams were measured and a detailed record of the sediment wedges behind each check-dam, in order to quantify the long-term effects of the 1997 wildfire on soil erosion. Likewise, sediment samples were collected upstream of each check-dam, in order to determine the dry weight of the transported materials trapped behind the check-dams. The sediment samples were weighed and then dried following the above mentioned process (24 h, 105 °C) to calculate their dry weight.

3. Results and Discussion

3.1. Silt Fences Installation—Cost of Materials and Tools

Silt fences are artificial geotextile fabrics (made of polypropylene), which are woven to offer structural stability and have tiny gaps that permit the water but not sediments to flow through. Silt fences can be used to create small temporary retention basins that enable sediments to be accumulated and water to pass through slowly, because of their low water permeability rates. In the current study, the geotextile (polypropylene) that was used, had specific technical characteristics, which provided the appropriate durability and strength to withstand the harsh weather conditions for over three years of monitoring. The geotextile fabric technical characteristics were: 19 kN/m and 10 kN/m tensile strength (EN 10319) for Machine Direction (MD) and Cross Direction (CD), respectively, maximum water rate flow 720 l/min/m2 (EN ISO 11058) and a mass of 90 gr/m2 (EN 9846).
Before the installation of the silt fences, thorough field research is required, in order to identify the most appropriate areas, depending on the scope of the study. In the current study, GIS techniques were applied [42,43], using various raster datasets (land cover, aspect, slope) to locate the average and representative geomorphology conditions of the study area. The resolution of the DEM was of 5 × 5 m provided by the National Cadastre, while the disturbances and land uses were defined by orthophotos interpretation and field investigation. Subsequently, the exact locations of the silt fenced plots were determined, taking into account that the plots should be installed in relatively homogenous slopes with the same average soil properties (mechanical composition, soil depth, pH). For that reason, during the field research, soil properties maps were used to help the team to decide the exact locations of the silt fences. The soil properties maps were provided by the Forest Research Institute of Thessaloniki [44].
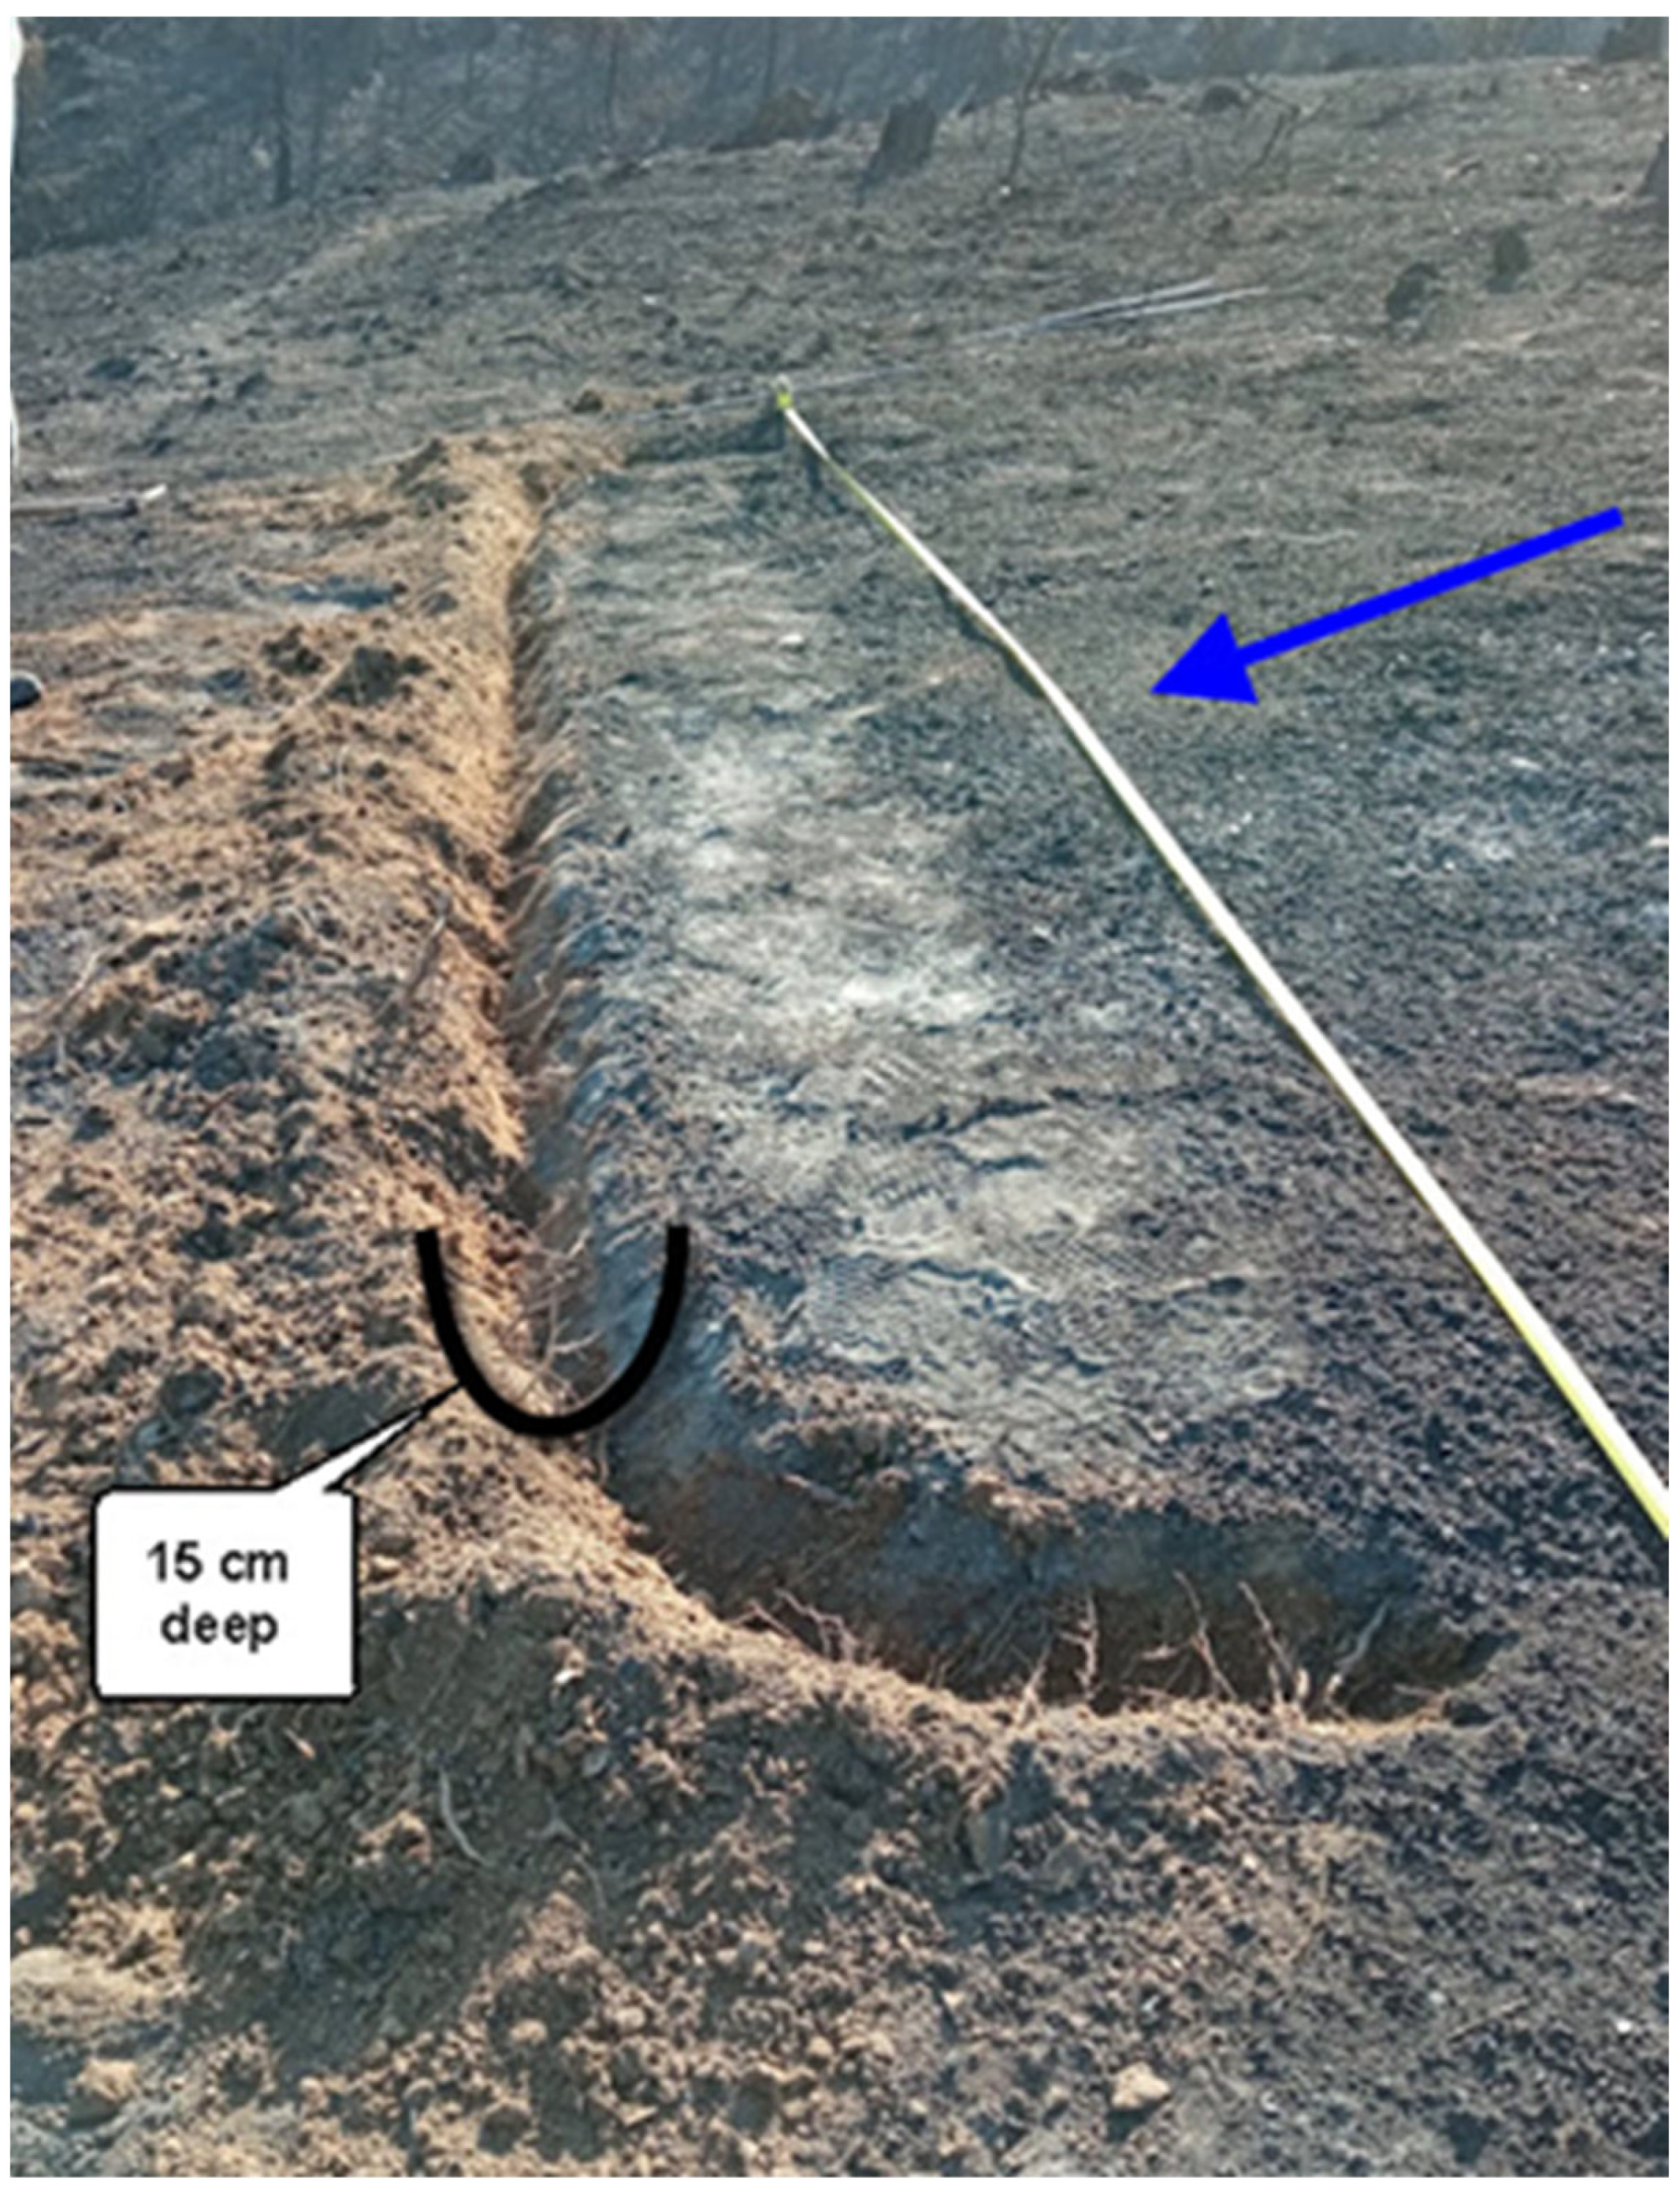
The silt fences were installed in the defined areas for each examined disturbance case. First, a 5 m long trench was opened parallel to the contours, with depth and width of 10–15 cm (Figure 2). The ends of the trench should be slightly inclined to the upslope direction, to avoid the loss of sediments (Figure 2). The excavated earth material was positioned at the downslope side of the trench, for the subsequent use in trench backfilling.
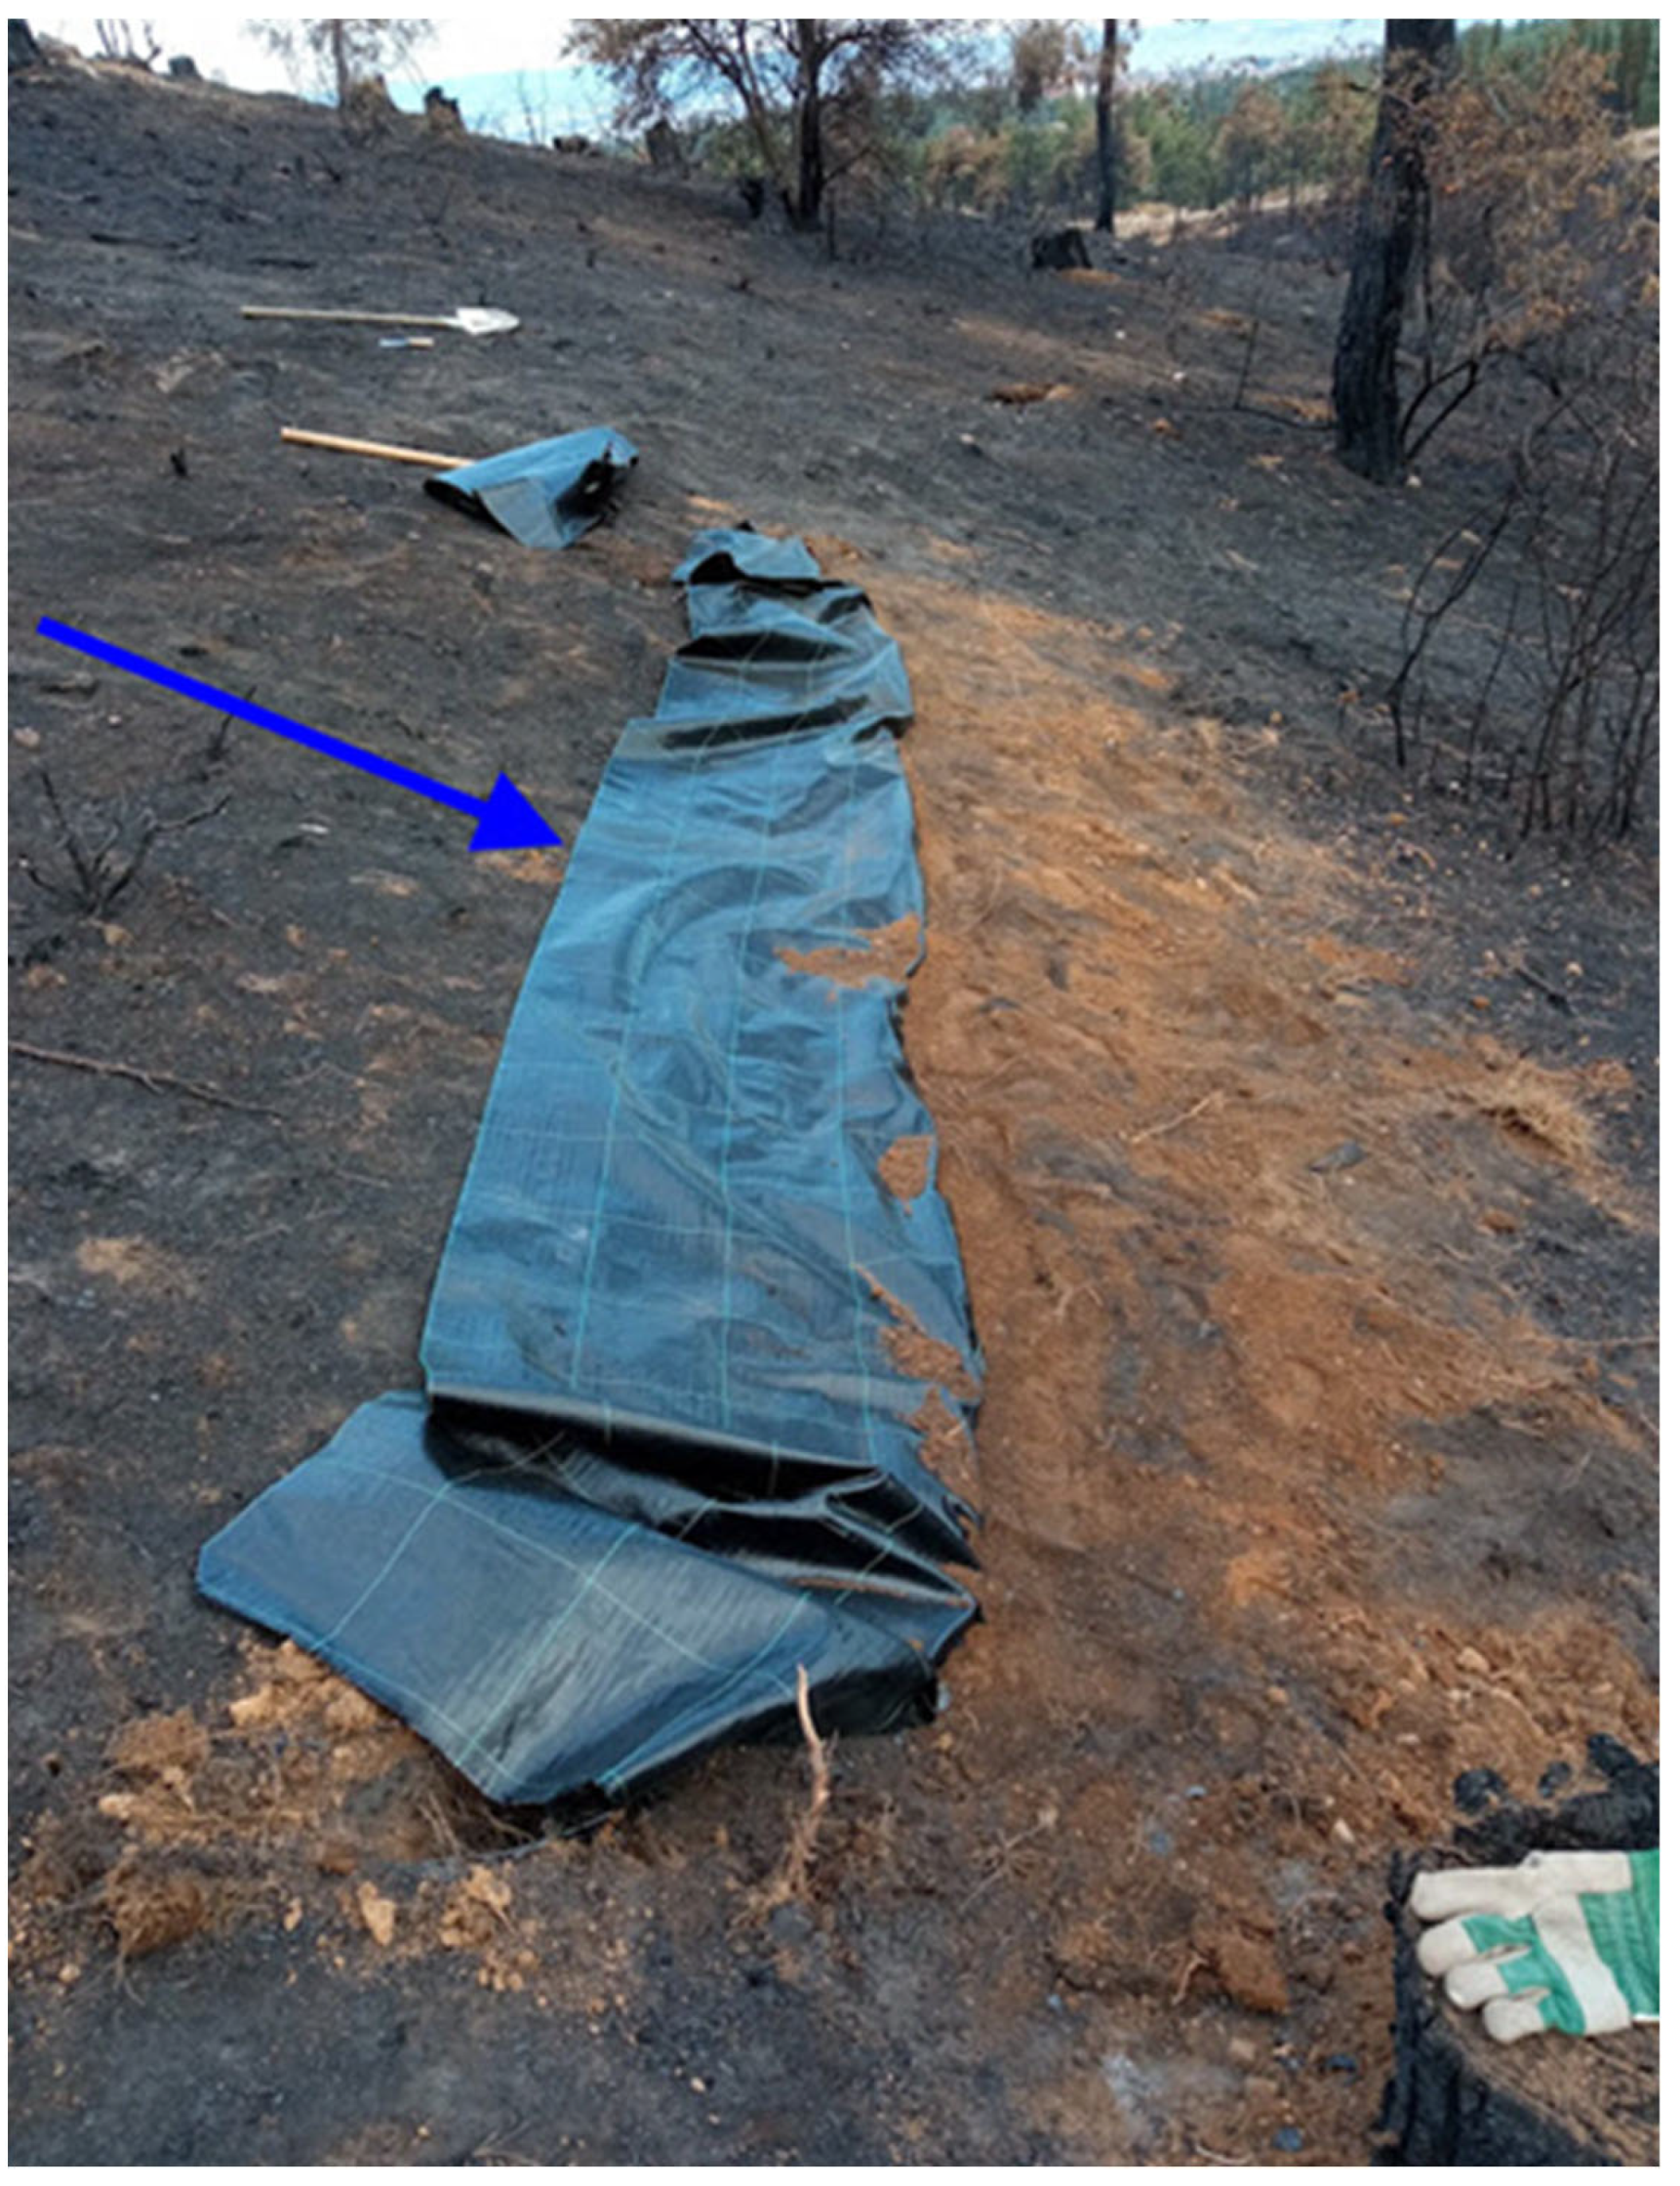
The silt fence is set down along the trench, covering both the bottom and the upslope side of the trench (Figure 3). To avoid the pull out of the silt fence due to water and wind forces, the excavated earth material is used to backfill the trench and a sledgehammer is needed to compact the earth in the trench and seal the silt fence in the ground.
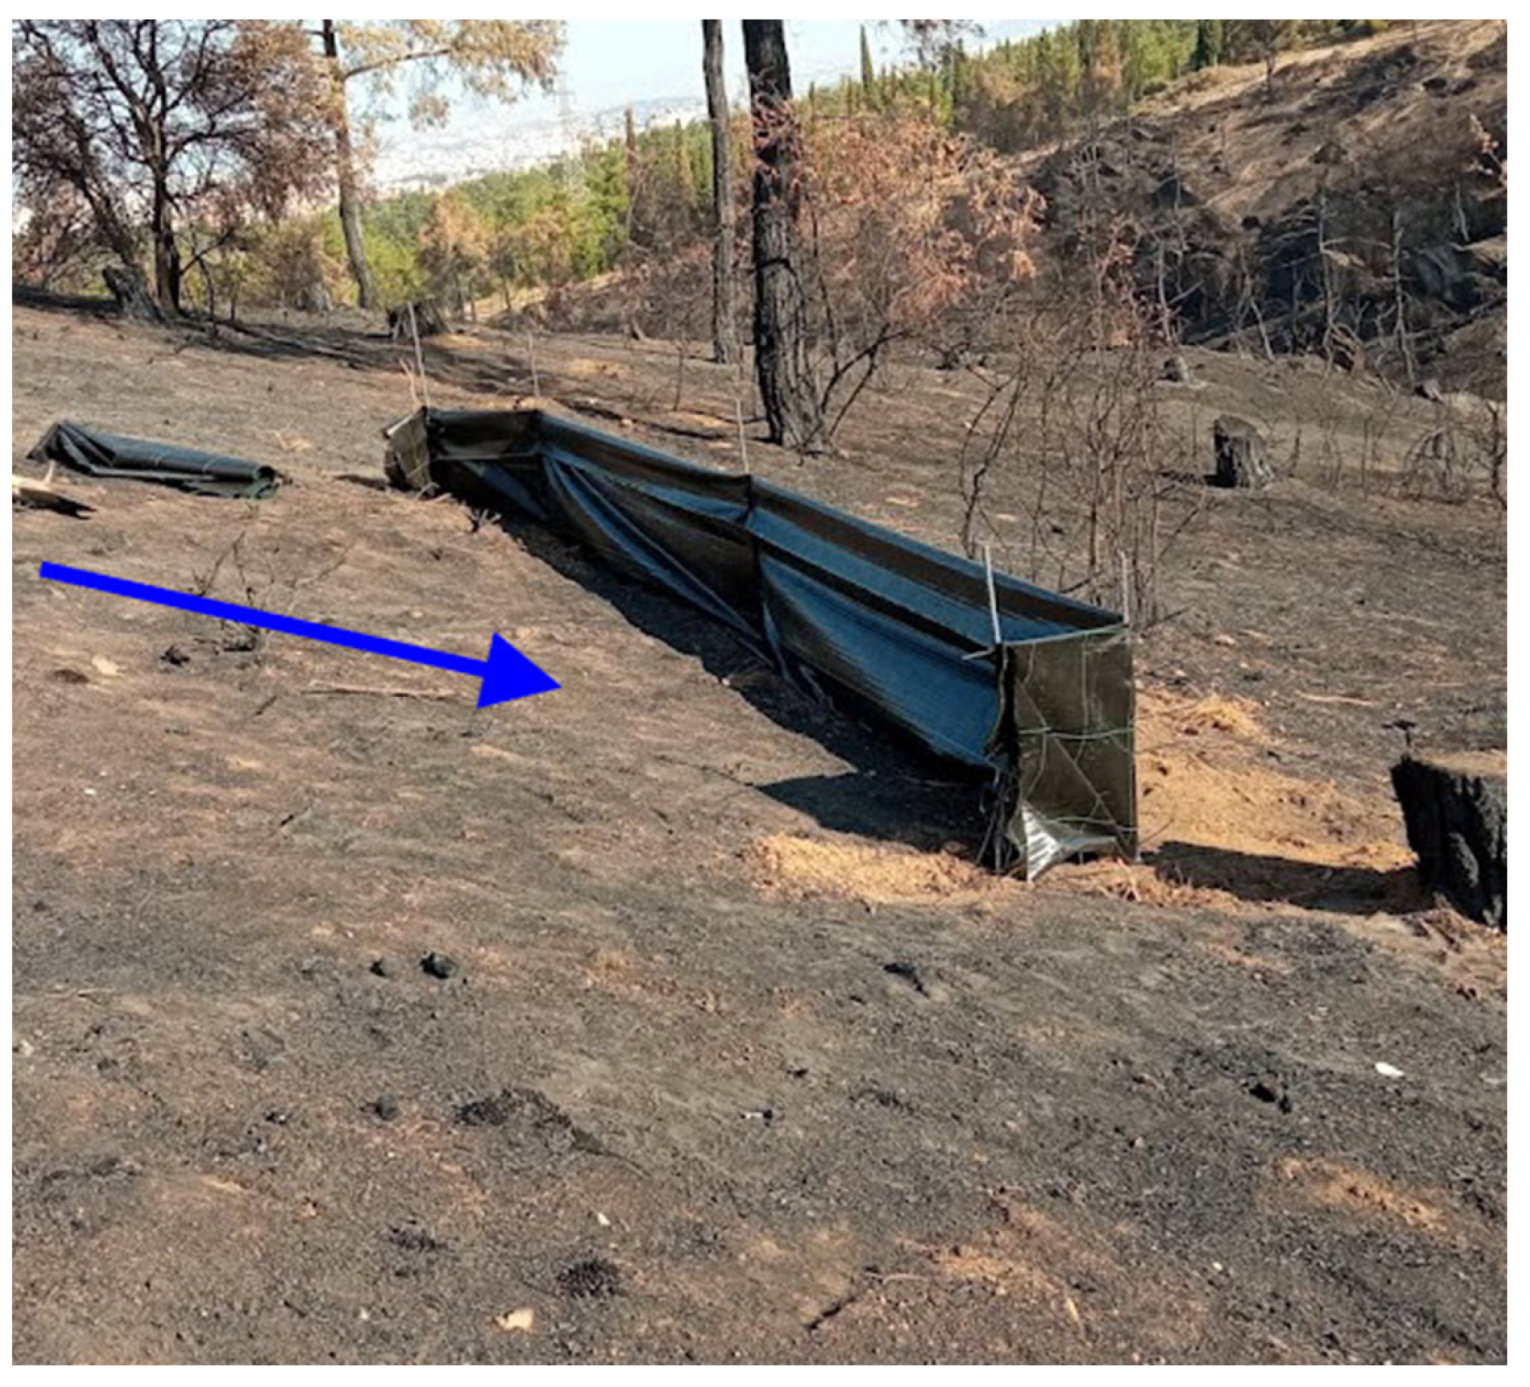
Subsequently, for each plot, five (5) metal rebars of 1.20 m long (10 mm diameter) were inserted in the ground to at least 30 cm depth, in order to uphold the silt fence (Figure 4). The number of the rebars was initially defined taking into account the cost and the transporting difficulties of such heavy equipment. Before the installation, the rebars should be thoroughly sharpened in one edge, to make easier the penetration in the ground. Small cable ties were used to fasten the silt fences on the rebars. Four or five cable ties were used for each rebar, while the lowest cable tie should be 25–30 cm above the ground to avoid tearing in the gathering area of the fence.
The area contributing to the silt fence must be planned in such a way that the water force does not damage or overtop the silt fence. Depending on the study scopes, anticipated water flow and sediment generation, the extent of the contributing area could vary. In the present study, typical USLE-type plots (5 m × 22 m) [45] were installed in the disturbed and undisturbed slopes, to monitor the surface and rill erosion of the forest. The upper boundaries of the plots were determined by digging a slightly inclined trench for each plot. Each trench was about 15–20 cm wide and deep, in order to restrict and divert the overplot water flow. When the contributing area has been defined, the amount of captured sediments can be converted to sediment rates per unit area (t/ha/year).
The materials and tools that are necessary to install the silt fences are presented in Table 1. Table 1 also shows the prices of materials and tools in euros, corresponding to the Greek market. The total cost for all the silt fences of the specific experimental work was 478.64€. The field work has been conducted exclusively by the members of the research team of our Laboratory, so there was no additional cost for labor hours. Two team members have worked to install the silt fences. Approximately, four silt fences were installed per day, with an average working time per day between 6–8 h.

3.2. Silt Fences Operation and Maintenance

To acquire valid erosion measurements, silt fences must be checked on a regular basis. The sediments gathered in the silt fences should be measured after every storm event, weekly, monthly, or at various intervals in a year, depending on the needed precision. In the present study, the field work was conducted after every intense rainfall event, in order to increase the annual measurements and to improve the accuracy of the calculated erosion rate. According to the findings of this study, in areas disturbed by the action of insect outbreaks, selective logging, and reforestation procedures, the sediment generation was very low ranging between 0.02 and 0.065 t/ha/year, which means that after a storm event the generated sediments from each plot were a few grams (5–140 g) [14]. On the other hand, the sediment production in the burned areas (July 2021) and in areas with reforestation failure was very high, ranging between 20 and 55,000 g for each plot, depending on the rainfall intensity. According to the already mentioned results, concerning the sediment generation at erosion plots with low sediment production, it had been decided to collect all the sediment amounts and measure the weight in the laboratory for such cases. For the high sediment production plots, the sediments were measured on the field and a small sample from each plot was obtained to be dried in the laboratory, in order to calculate the dry weight of the whole sediment material. Finally, all the sediment samples immediately after the sampling process were dried in a heating chamber for 24 h at 105 °C to determine the dry weight of the eroded soil as mentioned in Materials and Methods (Figure 5). Therefore, the specific equipment is necessary for these measurements.
In every field survey, the research team should be equipped with the necessary materials and tools to repair and maintain the silt fences, in case there is damage by various factors, such as wind gusts, water runoff power, animal or human disturbances, a quite frequent phenomenon especially in similar suburban forest ecosystems.

3.3. Limitations and Problems during the Operation

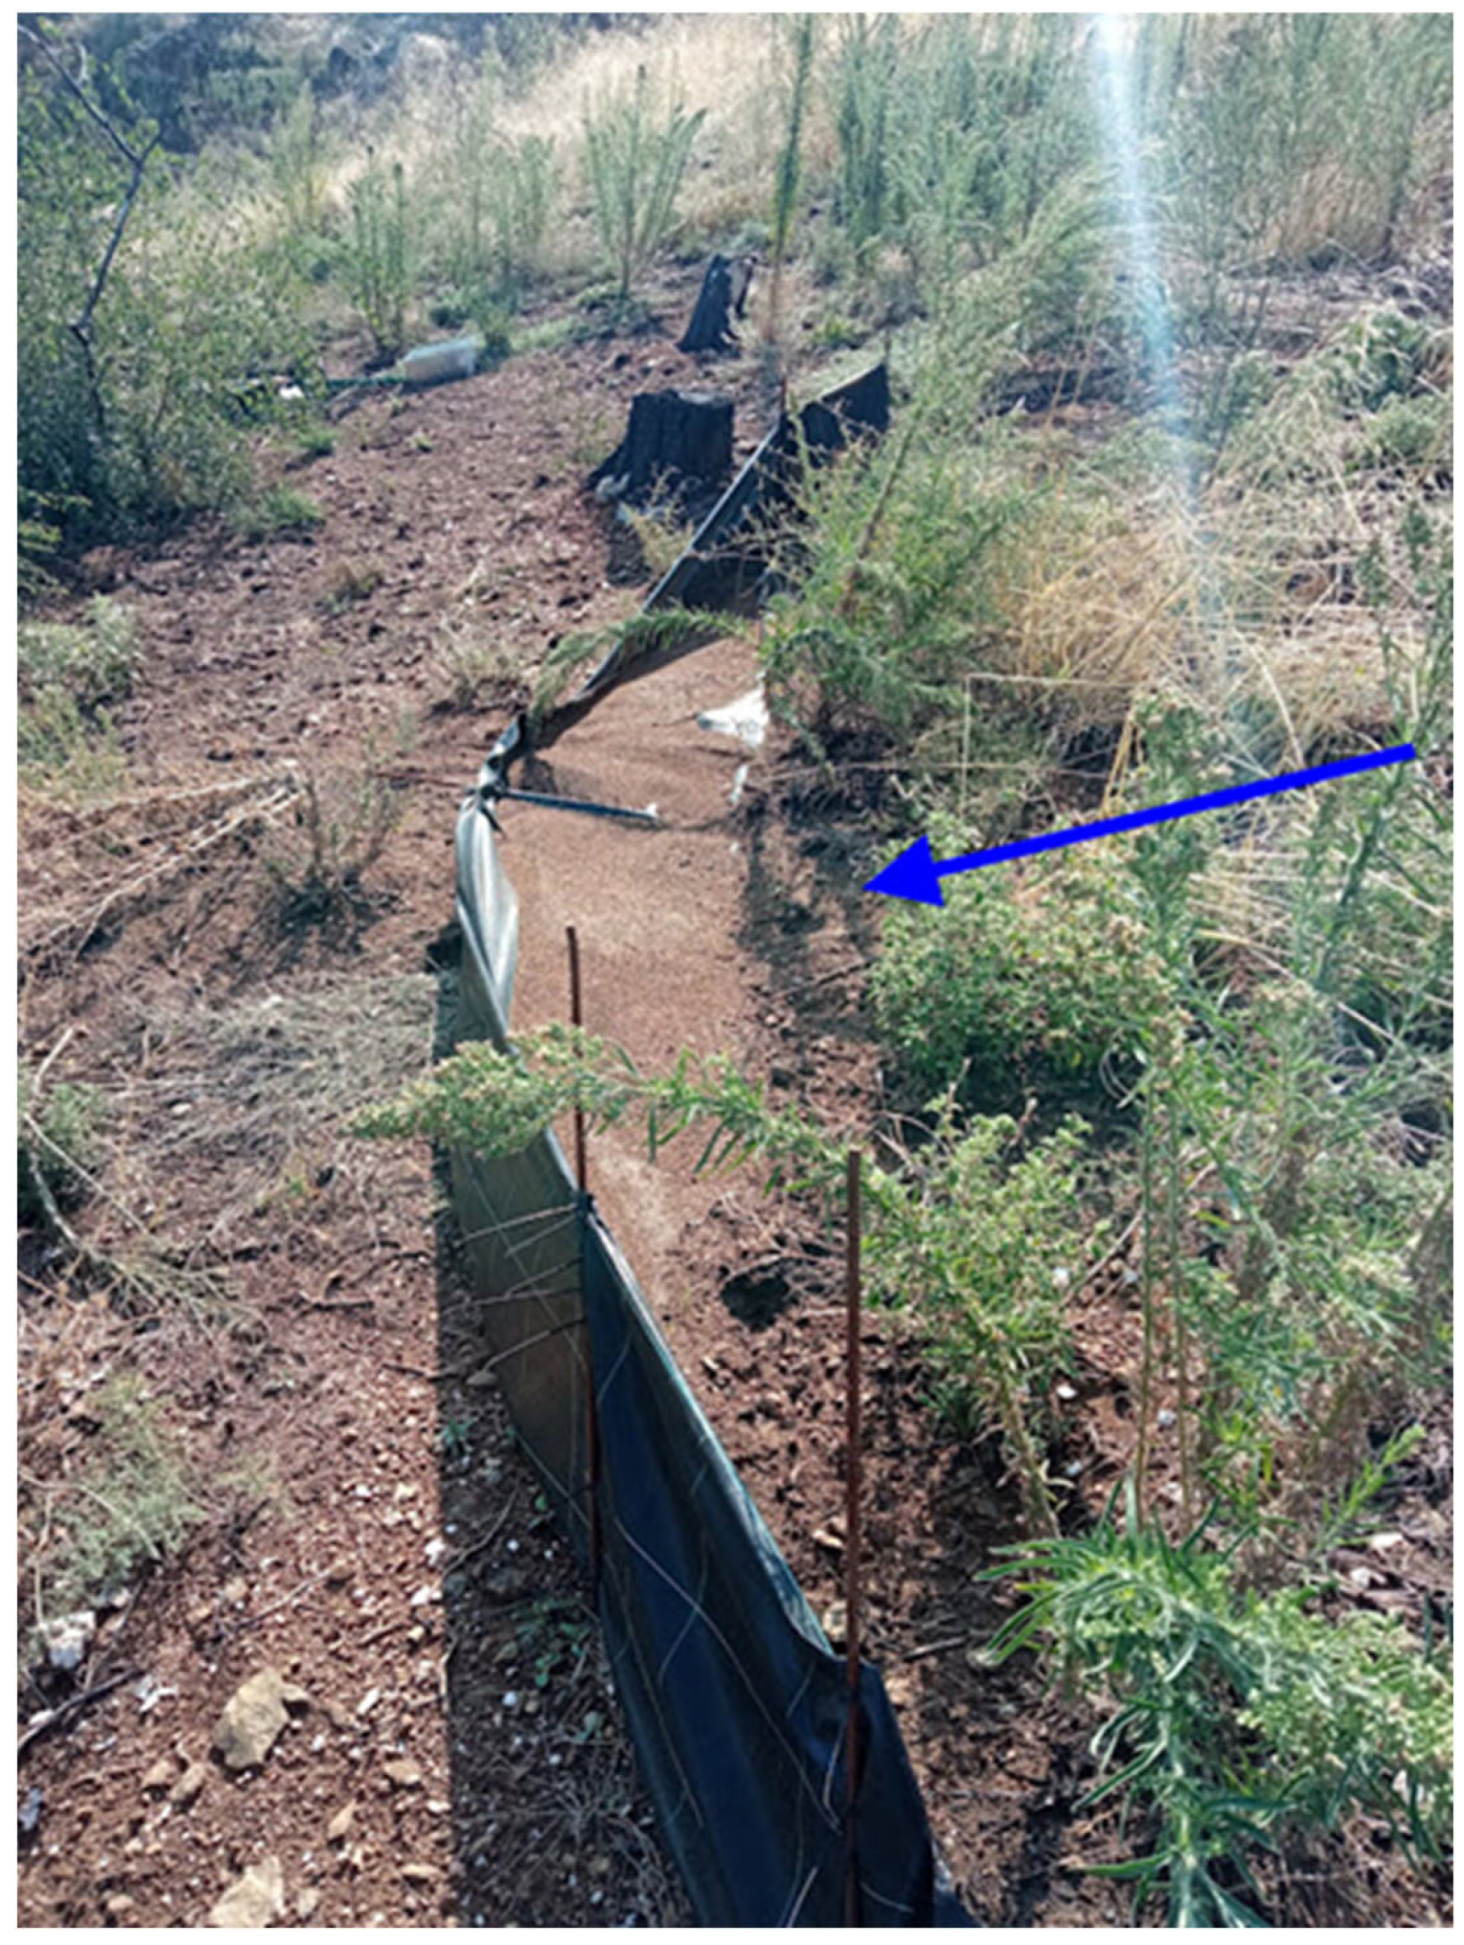
The most significant limitation was recorded in the recently (July 2021) burned areas and mainly after the highly intense rainfall events. During these episodes, the metal rebars in one plot have been proven to be inefficient to withstand the weight of the water and sediments, and eventually bended to the downslope direction, losing an unknown amount of sediments (Figure 6). Thus, denser rebars placement is necessary for study areas of high erosion rates and areas after wildfire. The height of the silt fence is also very crucial in burned plots, since a short silt fence would be easily overtopped. However, a too high fence would be susceptible to the action of wind gusts. An average beneficial solution should be found, depending on the plot characteristics and the expected sediment production. It is proposed that the silt fences should not exceed one meter in height. In cases of extreme sediment production, it is proposed to install a second silt fence just below the first one. Furthermore, based on this failure, it is revealed that at least 3 plots for each examined case are necessary to ensure the consecutiveness and reliability of field measurements.
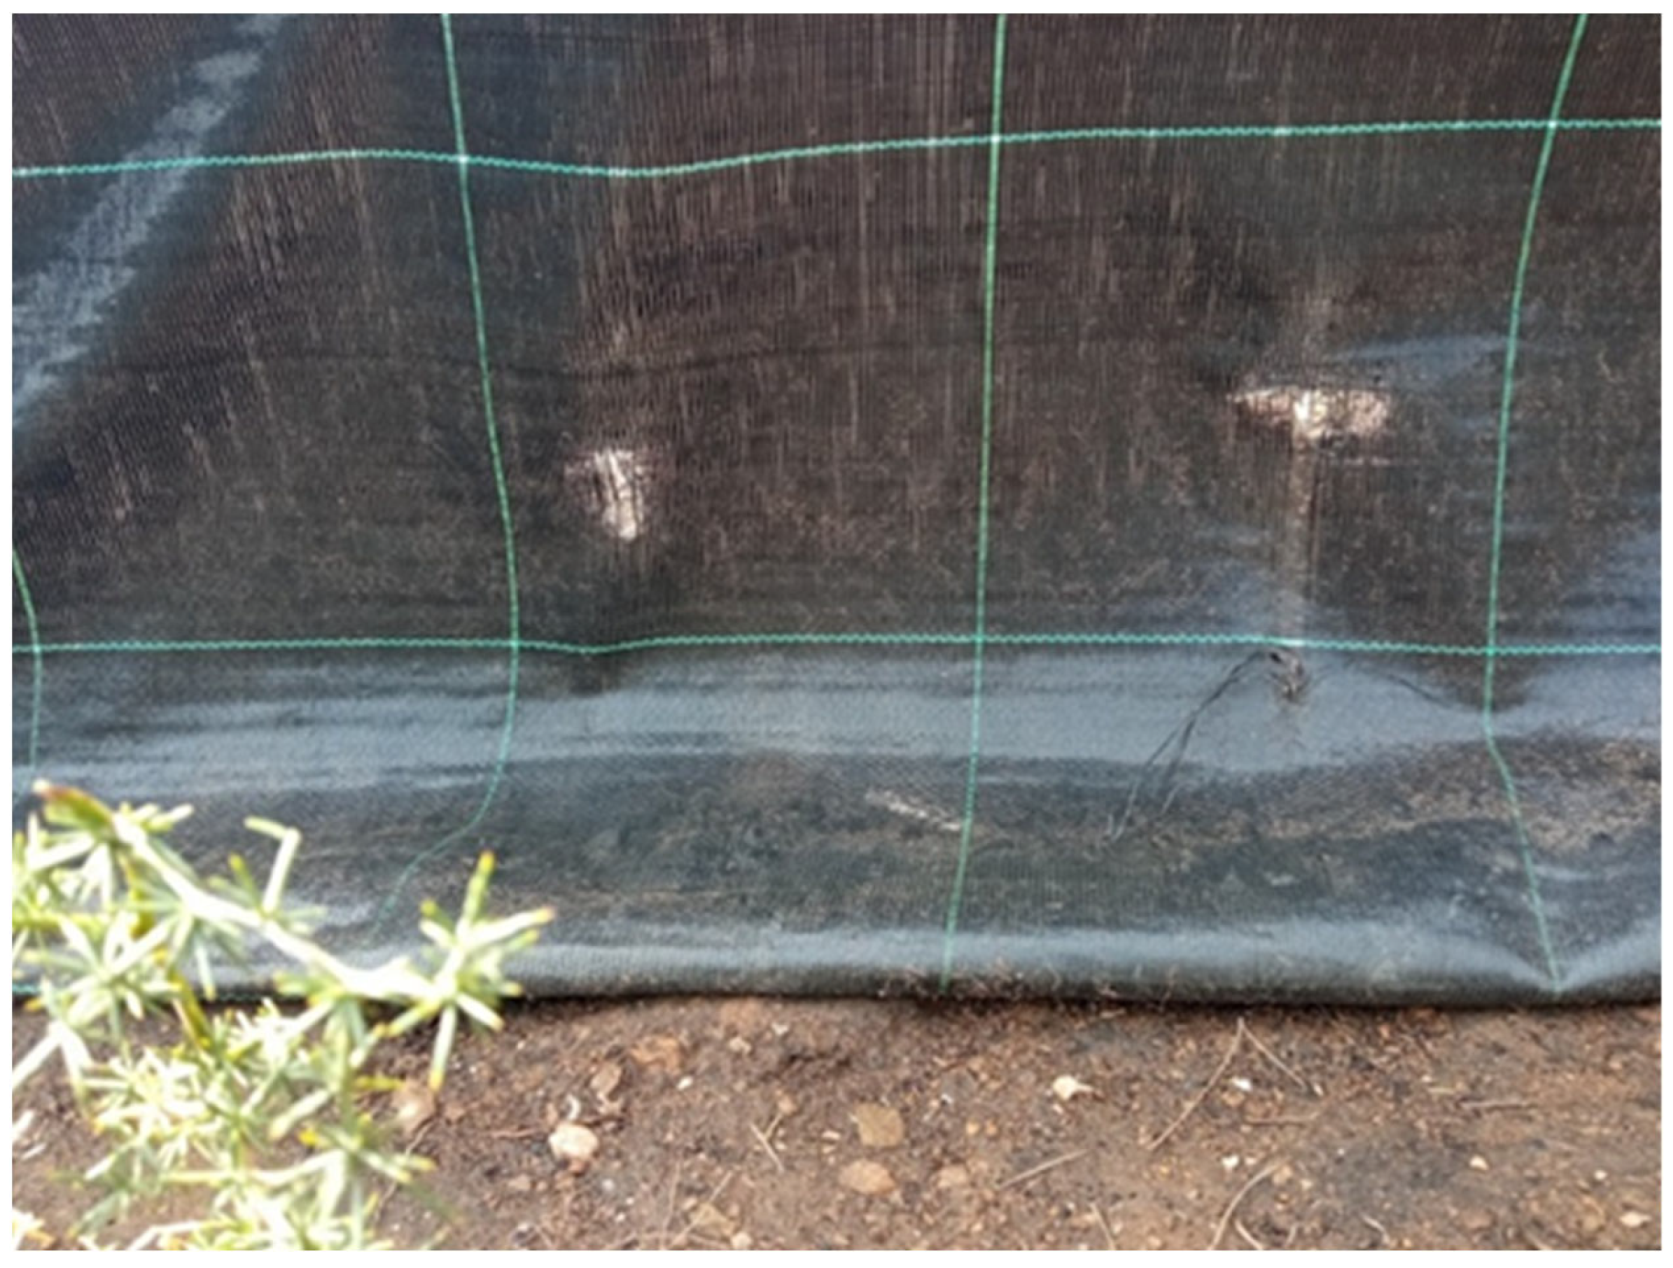
Animal activity and human curiosity/interference have been proven two significant problems during the operation of the silt fences in the study area. Concerning the animals, the most significant problem was caused by wild boars, which in many cases caused damages and holes on the silt fences (Figure 7), while in parallel, disturbed the soil surface. Unfortunately, the management of this threat has not been proven feasible. In fact, the only solution was the frequent check and timely repair of the silt fences regardless of the programmed monitoring attendance after the rainfall events.
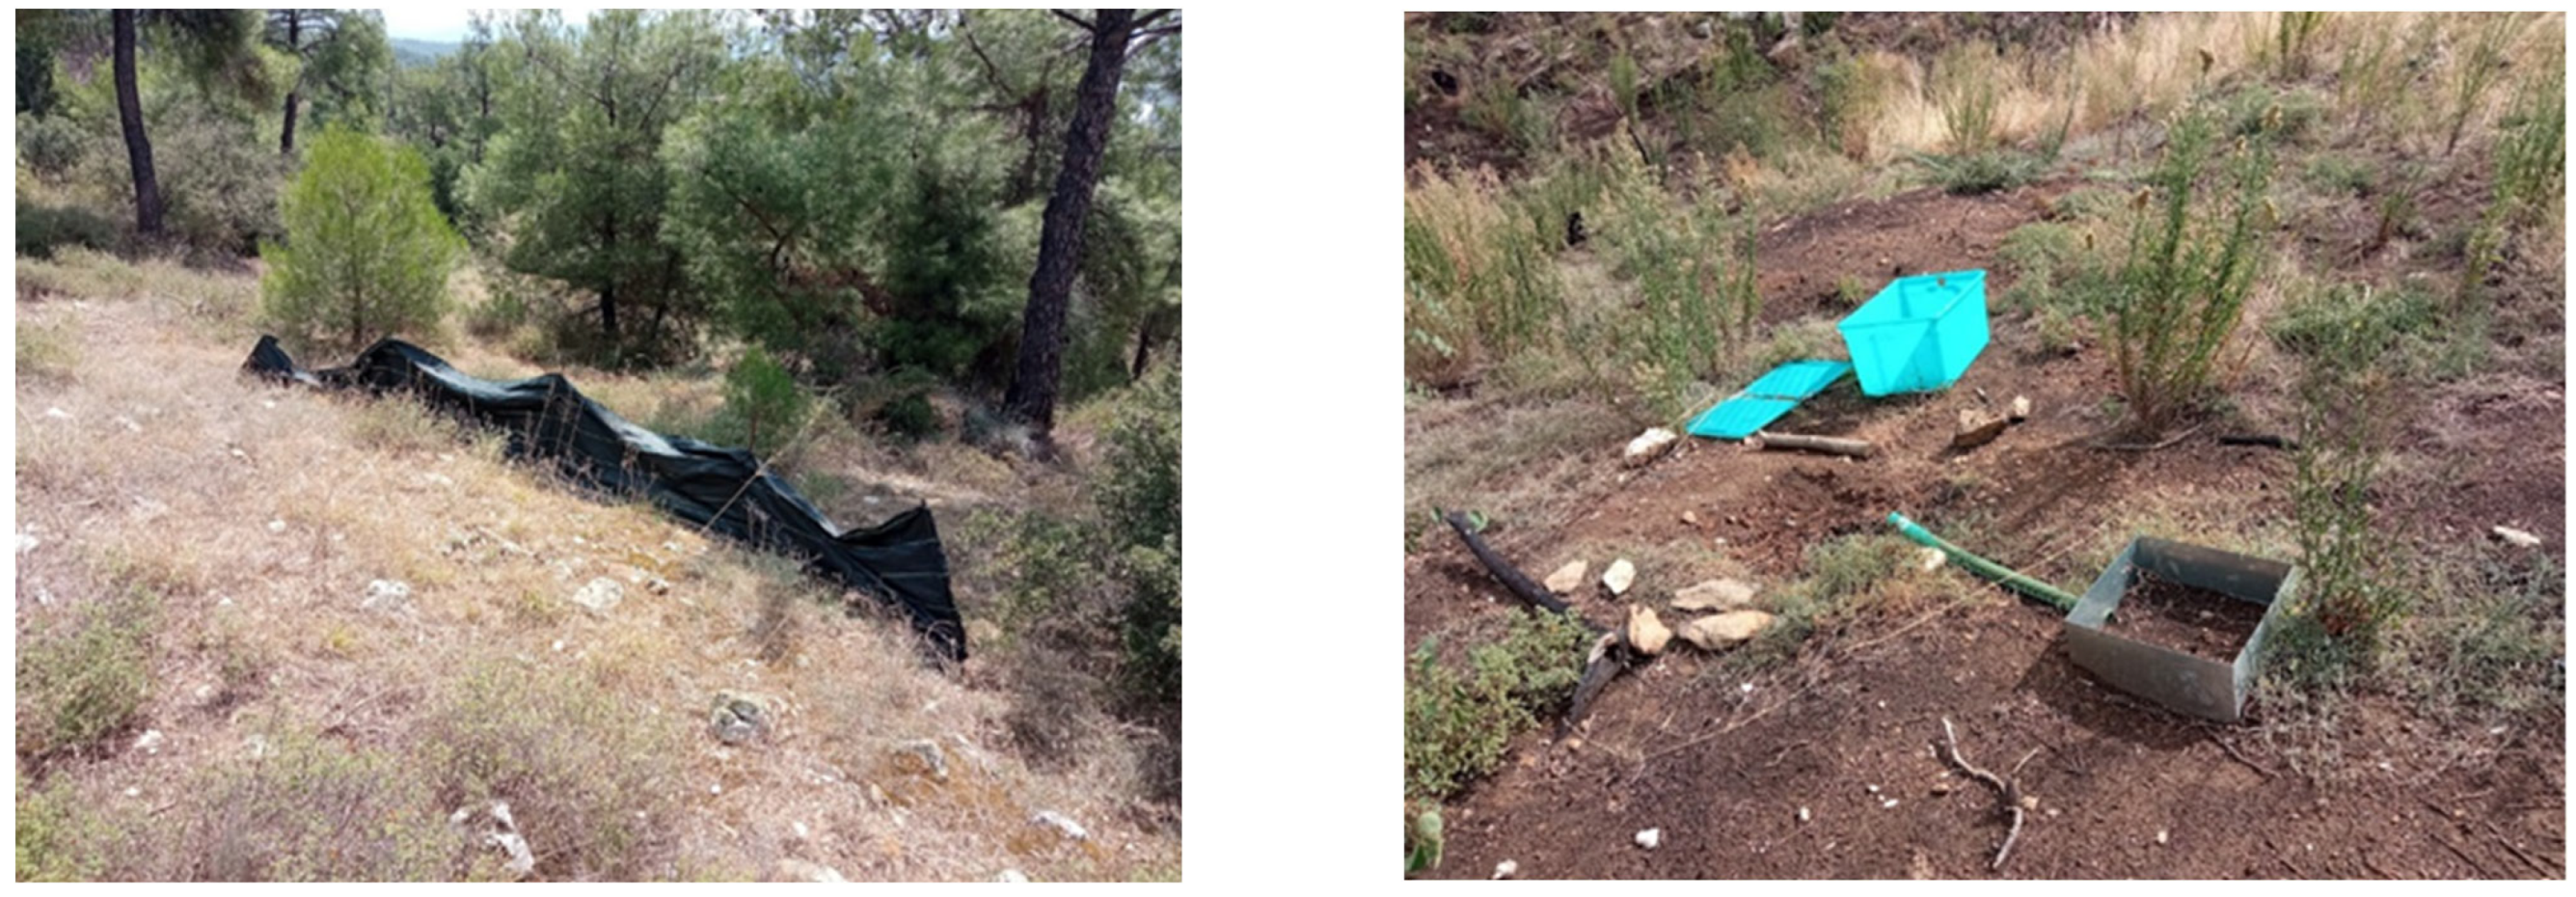
Regarding the human curiosity/interference, the damages mainly concerned stealing of the metal rebars and parts of silt fence materials, and various other types of damage (destruction of the structure), despite the installation of relevant signs and good cooperation and information sharing with the forest service staff (Figure 8). Most of the damages were observed in silt fences that were installed close to paths and forest roads, where the human activity is more intense. The solution to this problem was the relocation of silt fences to locations less adjacent to human activity and less visible to humans.

3.4. Measurements of Check-Dams Dimensions and Sediment Depositions—Limitations and Problems

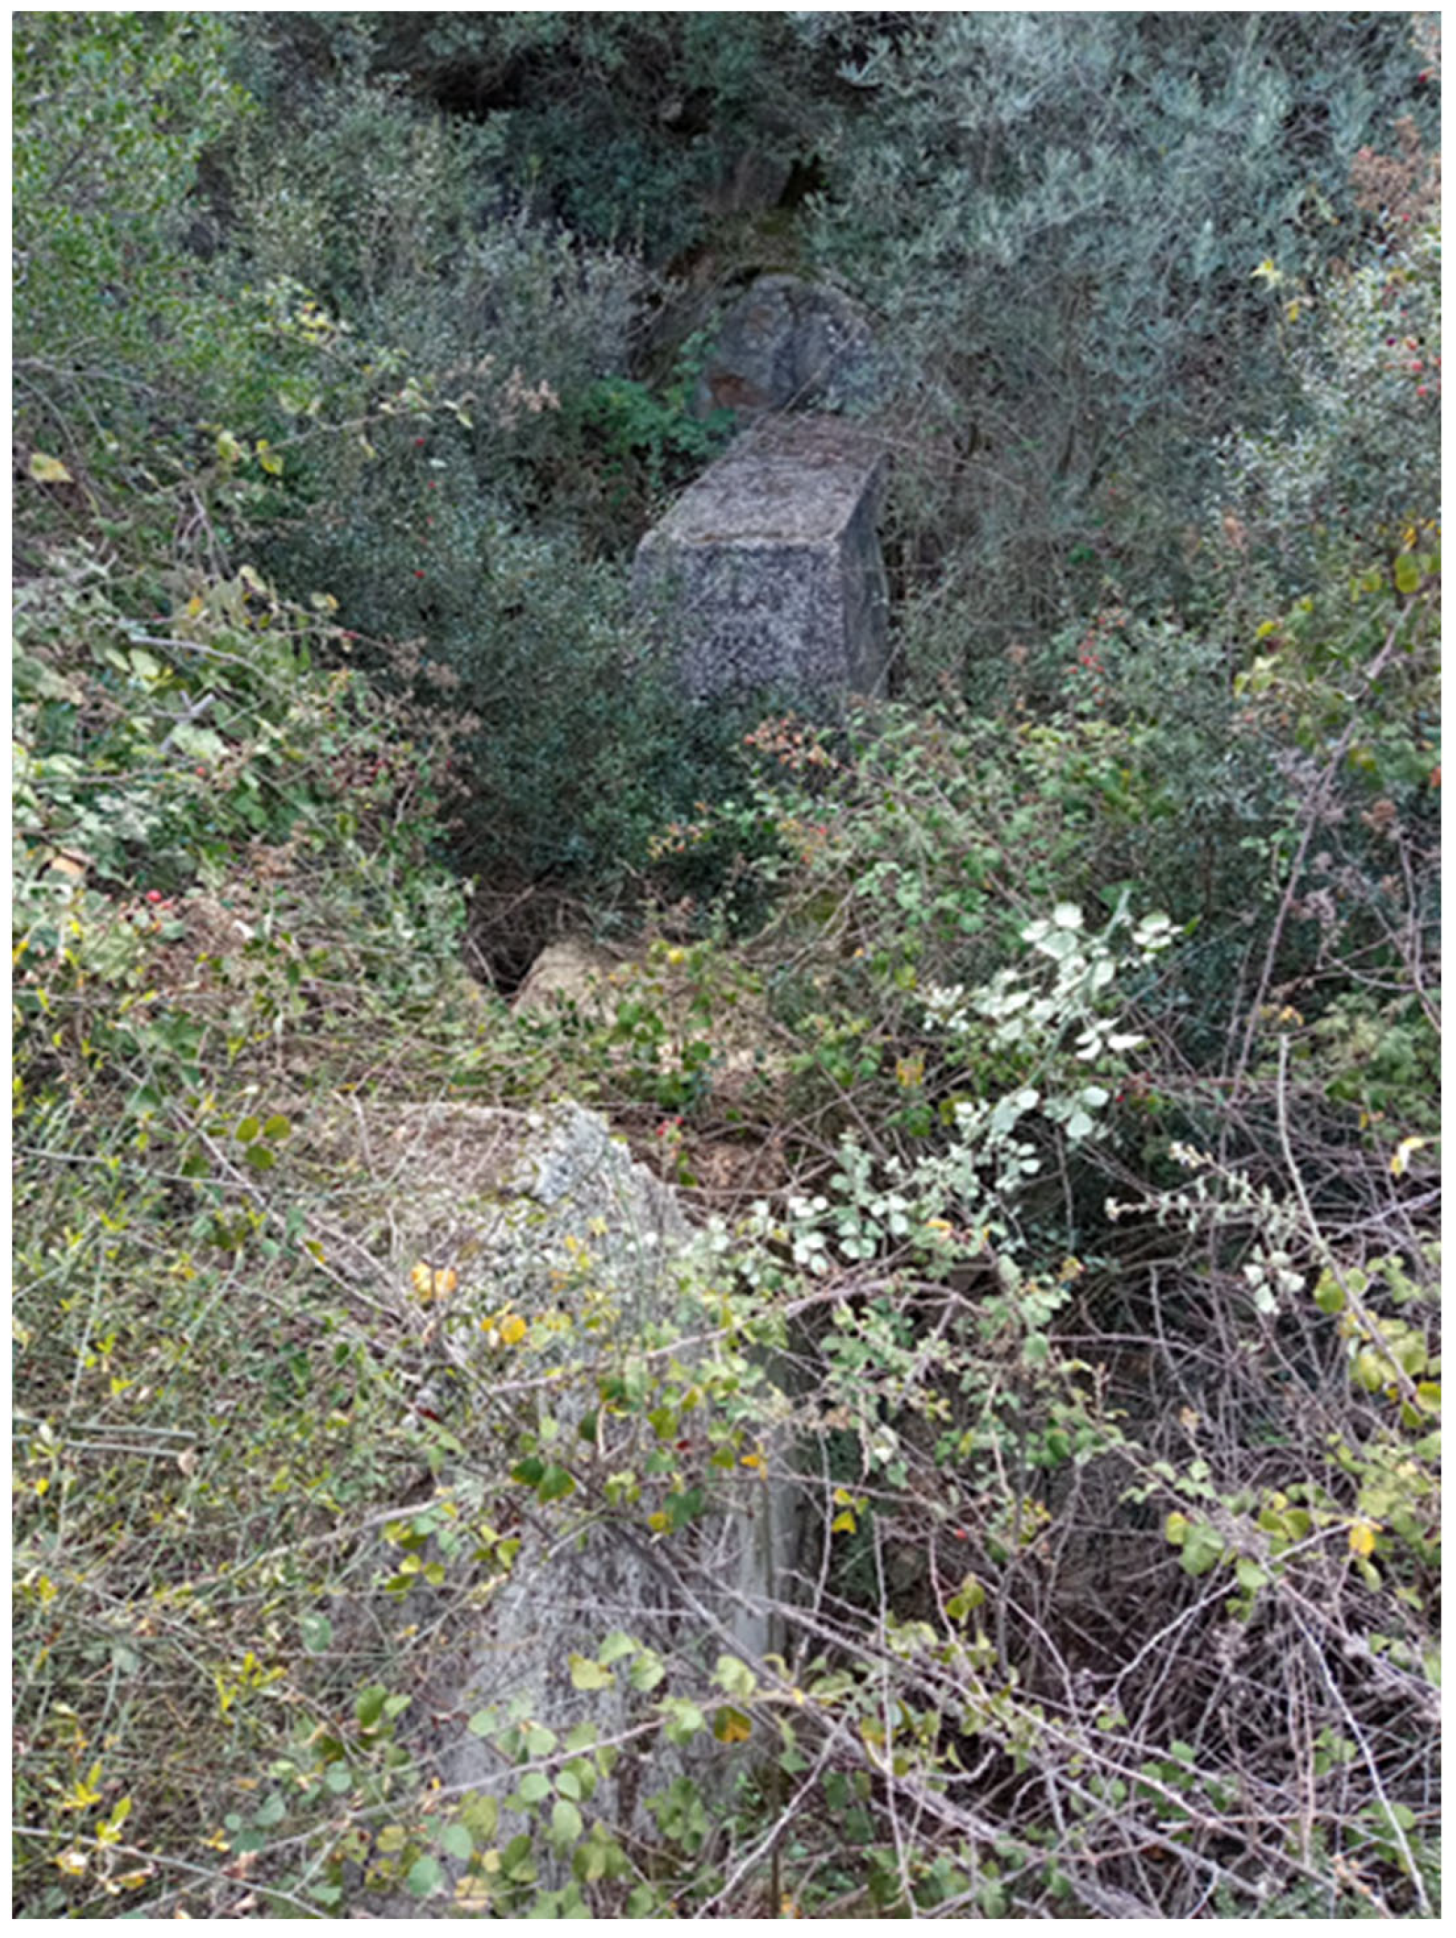
Check-dams were built in 2001, almost 3 years after the forest fire. The dimensions of each check-dam were accurately measured (height, length, width, etc.) and the sediment wedges behind each check-dam were thoroughly recorded. The recommended measurement methodology has been described extensively in the study of Margiorou et al. [13]. At least two persons working as a team are needed to conduct the field work, since it is highly demanding both in detail of recording and physical strength. In general, check-dams are easily accessible in areas that are recently burned or in arid landscapes where the vegetation is sparse [46,47]. However, 20 years after the forest fire and under Mediterranean climate, the vegetation has almost fully recovered in the study area. Moreover, the ability of check-dams to retain significant water amounts during rainfall, resulted in development of extremely dense vegetation on the stream bed and banks, especially upstream of check-dams (Figure 9), causing difficulties of access.
This is the most significant problem and limitation of the methodology, since the difficulties of locating and approaching the check-dams make the monitoring tasks time consuming and laborious. On the other hand, the recording of depositions that have been retained by the check-dams is exceptionally important, because the scarcity of erosion measurements and the absence of sediment transport gauges is a very common problem in many areas [48,49]. Another limitation of this methodology is the importance of knowing the date of check-dams’ construction. The researchers should be aware of the precise time of check-dams construction to avoid miscalculations of mean annual soil erosion rates and their evolution.
The research team conducting the field work should be equipped with a tape measure at least 25 m long, a clinometer, plastic bags for the sediment samples, a GPS device, a tablet and tools for the trimming of the vegetation and path opening (saw, pruning shears, sickle shape tool). The research team should have foreseen enough room in the backpacks, in order to store the sediment samples and transport them to the laboratory for further investigation (calculation of the dry weight). In the case of our experimental work, most of the tools and measuring instruments had been already made available by the Laboratory of Mountainous Water Management and Control, and thus there was no additional cost. From each check-dam, five sediment samples were obtained. The samples were randomly selected from different places in the sediment trapped behind each check-dam. Each sample was derived by digging a hole of 10 × 10 cm and depth of 15 cm. The material from each hole was collected in plastic bags, to be transported to the laboratory to calculate the dry weight. Afterwards, a plastic bag was inserted in the hole and filled with water. The water volume was quantified using a volumetric tube, in order to accurately measure the volume of the hole. Utilizing the volume of the hole and the dry sample weight, the dry bulk density of sediments was calculated.
The measured retained sediment wedges behind the 18 check-dams represent 0.0007–0.181 t/ha/year mean area-specific sediment yield of the study area. The variation of values corresponds mainly to the differences in the upstream vegetation density, slope and management works. The observed sediment values corresponded to modeling application of the study area providing acceptable model efficiency of the statistical analysis [14]. Moreover, previous studies highlighted large variations in the range of values for area-specific sediment yield [50,51]. Determination of erosion rates using retained sediment wedges behind check-dams is considered as an applicable method of model calibration and validation, providing an increase of model efficiency [2,41,46,48,49,50,51].

3.5. Additional Measurements—Surface Runoff—Precipitation

Soil erosion comprises a variety of processes, but the final outcome is particles being moved and deposited from one region to another [4]. Wind, precipitation, rainfall intensity, surface runoff, soil sensitivity to erosion, and land cover and management are factors that all have an impact on soil erosion [52,53]. The knowledge of the volume of surface runoff after a rainfall event, in combination with the soil erosion values, is very important information, which enhance the understanding of soil erosion processes and the quality of soil erosion studies.
In the present study, a low-cost method of measuring runoff is presented. In the study area and very close to the silt fence plots, smaller experimental plots (micro-plots) were installed (one for each examined disturbance case), in order to measure the surface runoff. Specifically, the experimental setup included a stainless steel frame, a flexible plastic tube and a plastic tank (Figure 10).
The dimensions of steel frames were 0.40 × 0.40 m and 0.25 m high. In one of the sides, there was a hole of 4 cm diameter in order for the plastic tube to be attached. The steel frames were inserted in the ground to a 5 cm depth. The tanks had a 100 l capacity and half of the tank inserted in the ground. The flexible plastic tube was used to connect the steel frame with the tanks. The connections between the elements were sealed with silicon. The cost of all the necessary materials is listed in Table 2. The total cost was 560€ and could be considered as relatively low. After the intense rainfall events or periodically (weekly, monthly), along with silt fences evacuation, the tanks were checked and the gathered water (if any) was quantified using a volumetric tube.
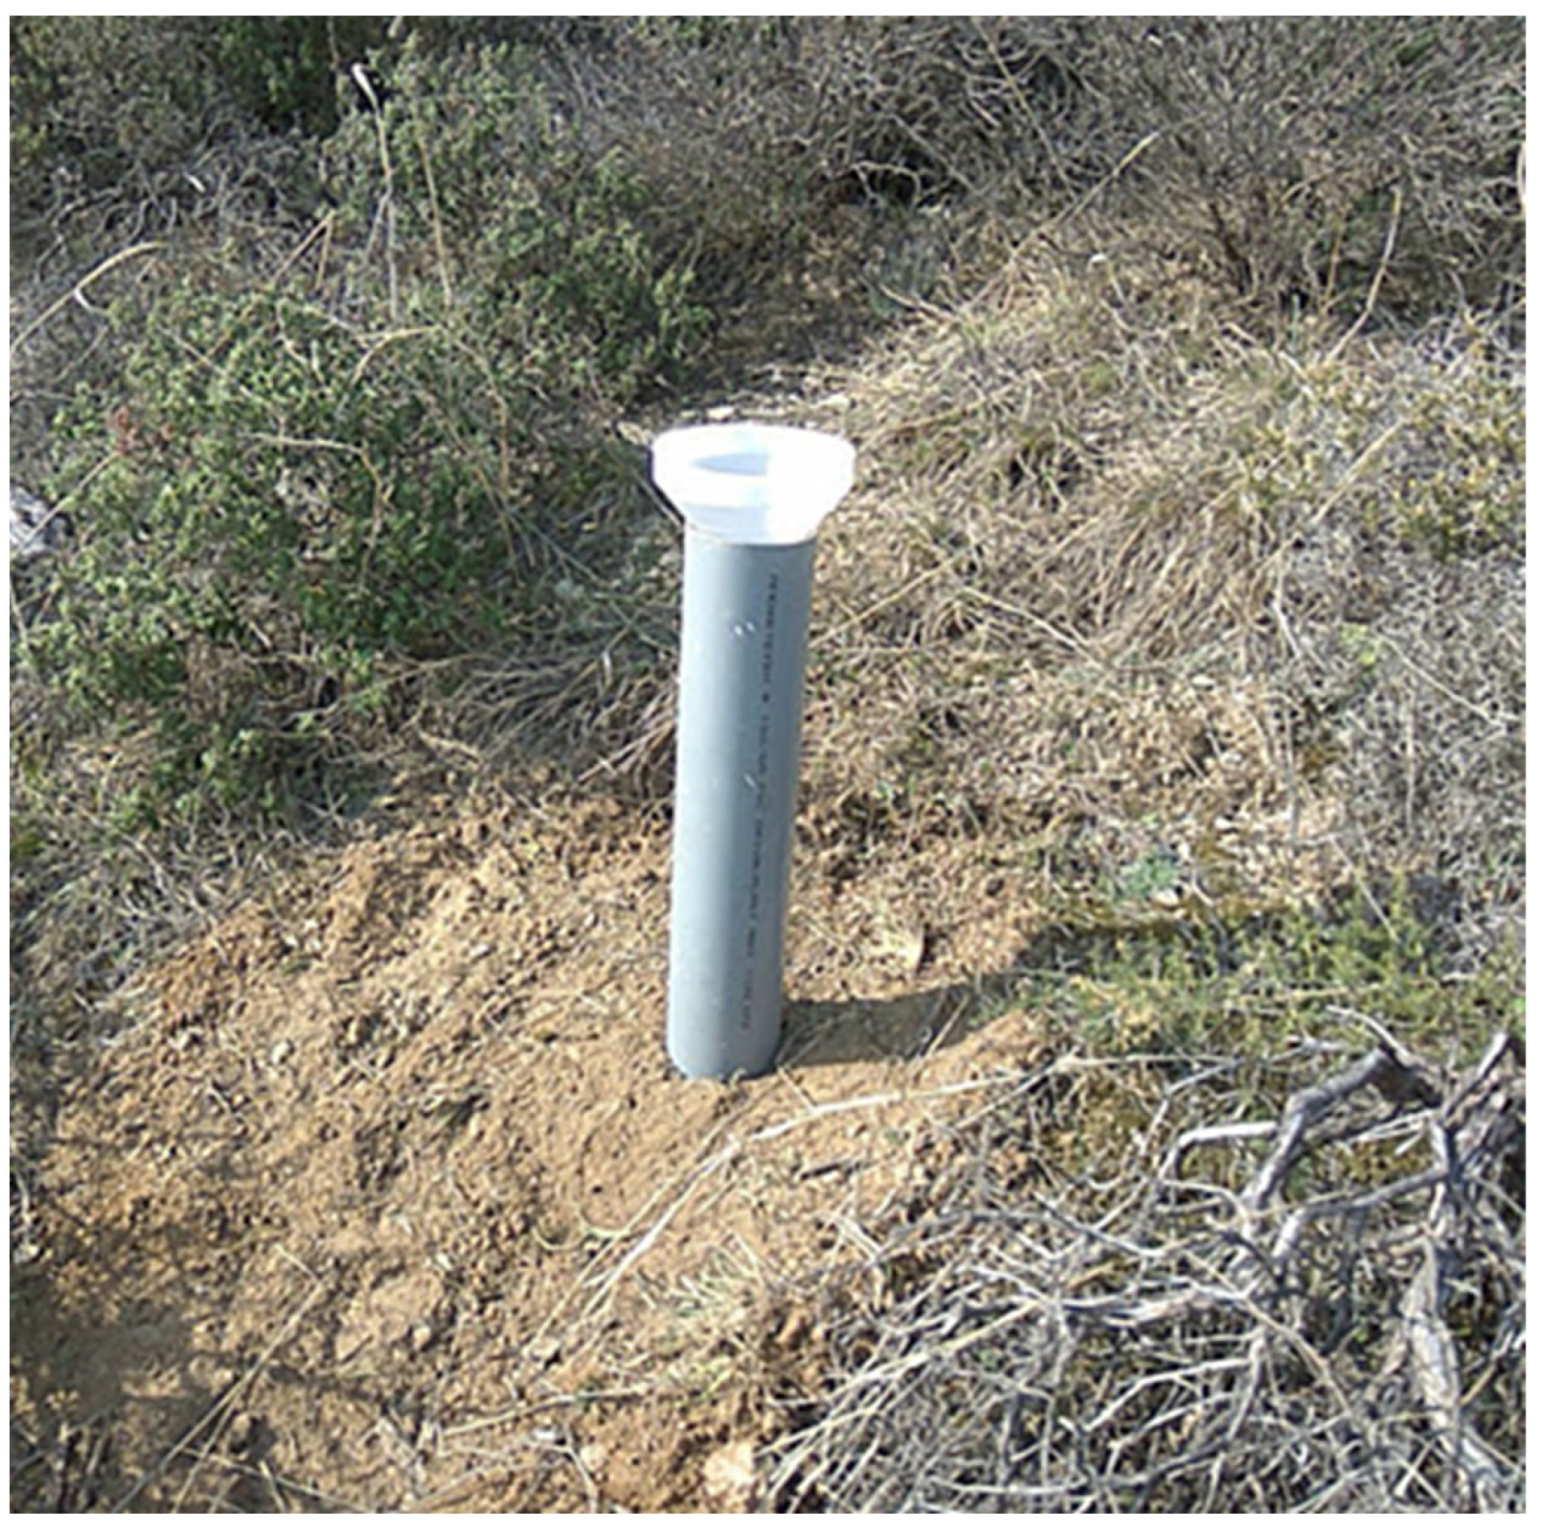
The precipitation data were obtained by the existing automated meteorological station located in the area of “Eptapyrgio”, which is operated by National Observatory of Athens [54]. Due to the distance between the “Eptapyrgio” station and the study area and their altitude difference, a second cumulative rain gauge (Figure 11) was installed in the study area to confirm the data.
It is highly recommended to install a precipitation gauge very close to the field plots. The rain gauge was installed far from large trees or high bushes to ensure that there are no obstacles that would influence the natural rainfall direction. Furthermore, the vegetation in a radius of three meters around the gauge was cleared and maintained in low height. In the present study, we have tried to limit the cost, and for that reason a simple cumulative rainfall gauge was installed near the field plots. The cumulative rainfall gauge consisted of a large plastic cylindrical bottle (of 4 l water capacity), a plastic funnel which was attached on the bottle neck, and a PVC tube aiming to stabilize the rain gauge and protect the bottle (Figure 11). The total cost to construct the rain gauge was 10€. The gathered water in the rain gauge was measured after every rainfall event, in order to collect enough data, aiming to establish a strong linear relation with the data from the “Eptapyrgio” station. During every measurement, the gathered water amount was transferred to a volumetric container, to accurately assess the rainfall height. The correlation between the two stations showed a slight underestimation of precipitation values from the “Eptapyrgio” station, which could be attributed to the altitude difference. More details relevant to that are provided in study [14].

4. Conclusions

In the present study, a cost-effective methodology for erosion data recording and acquisition is presented in detail. Silt fences and check-dams in combination could be considered as a low-cost methodology and particularly efficient towards this direction. Adequacy of time, devotion and physical strength are required for the research team members that would conduct the field work. Most of the materials and tools are easily found in the market and are quite simple in use. The total cost of the experimental setup is modest and the researchers of multiple countries could implement such a thorough experimental work. Many materials and tools could be replaced with other alternative ones, depending on their availability and cost in the different countries. The most important limitations and problems that have arisen during the implementation of the proposed methodology were the unpredictable activity of animals, and human interference (curiosity, stealing of materials, etc.). To avoid the human interference, informative signs should be placed next to the silt fences or an effort made to thoroughly hide the field plots. The damages from animals unfortunately could not be prevented. The only solution is the frequent inspection of the field plots and repairing of the damages to avoid data losses. The proposed methodology could be applied successfully in many environments and for varied purposes, aiming to quantify the erosion and runoff processes with high accuracy. The benefits resulting from the application of such thorough experimental methods seem to be of high importance towards the improvement of the performance, reliability and utility of erosion models in future.
The scientific community emphasizes the necessity of field logs for calibration and validation of erosion modeling. Field measurements increase the accuracy of erosion modeling. Silt fences and check-dams may be considered as an economic solution for measuring erosion rates and transportation of soil at a catchment scale. Silt fences contribute to the measurement of erosion rates on catchment hillslopes. Likewise, check-dams provide details regarding soil transport and erosion on a stream scale. The combination of the two methodologies increases the efficiency of modeling performances, which results in optimization of decision-making for management works.

Author Contributions

Conceptualization, M.S., A.K. and S.M.; methodology, A.K. and S.M.; validation, A.K. and S.M.; formal analysis, A.K. and S.M.; investigation, A.K. and S.M.; data curation, A.K., S.M. and M.S.; writing—original draft preparation, A.K and S.M.; writing—review and editing, A.K., S.M. and M.S.; visualization, A.K. and S.M.; supervision, M.S. All authors have read and agreed to the published version of the manuscript.

Funding

This research received no external funding.

Institutional Review Board Statement

Not applicable.

Informed Consent Statement

Not applicable.

Data Availability Statement

The data that support the findings of this study are available from the corresponding author upon reasonable request.

Conflicts of Interest

The authors declare no conflict of interest.

References

  1. Pastor, A.V.; Nunes, J.P.; Ciampalini, R.; Koopmans, M.; Baartman, J.; Huard, F.; Calheiros, T.; Le-Bissonnais, Y.; Keizer, J.J.; Raclot, D. Projecting Future Impacts of Global Change Including Fires on Soil Erosion to Anticipate Better Land Management in the Forests of NW Portugal. Water 2019, 11, 2617. [Google Scholar] [CrossRef] [Green Version]
  2. Wei, Y.; He, Z.; Li, Y.; Jiao, J.; Zhao, G.; Mu, X. Sediment yield deduction from check-dams deposition in the weathered sandstone watershed on the North Loess Plateau, China. Land Degrad. Dev. 2017, 28, 217–231. [Google Scholar] [CrossRef]
  3. Panagos, P.; Borrelli, P.; Poesen, J.; Ballabio, C.; Lugato, E.; Meusburger, K.; Montanarella, L.; Alewell, C. The new assessment of soil loss by water erosion in Europe. Environ. Sci. Policy 2015, 54, 438–447. [Google Scholar] [CrossRef]
  4. Benavidez, R.; Jackson, B.; Maxwell, D.; Norton, K. A review of the (revised) universal soil loss equation ((R)USLE): With a view to increasing its global applicability and improving soil loss estimates. Hydrol. Earth Syst. Sci. 2018, 22, 6059–6086. [Google Scholar] [CrossRef] [Green Version]
  5. Morgan, R.P.C. Soil Erosion and Conservation, 2nd ed.; Longman: Harlow, UK, 1995. [Google Scholar]
  6. Foster, G.R. Modeling the erosion process. In Hydrologic Modeling of Small Watersheds; Haan, C.T., Johnson, H.P., Brakensiek, D.L., Eds.; American Society of Agricultural Engineers: St. Joseph, MI, USA, 1982; Chapter 8. [Google Scholar]
  7. Dunkerley, D.L. Rainfall intensity bursts and the erosion of soils: An analysis highlighting the need for high temporal resolution rainfall data for research under current and future climates. Earth Surf. Dyn. 2019, 7, 345–360. [Google Scholar] [CrossRef] [Green Version]
  8. Kastridis, A.; Stathis, D. The Effect of Rainfall Intensity on the Flood Generation of Mountainous Watersheds (Chalkidiki Prefecture, North Greece). In Perspectives on Atmospheric Sciences; Karacostas, T., Bais, A., Nastos, P., Eds.; Springer: Cham, Switzerland, 2017; pp. 341–347. [Google Scholar] [CrossRef]
  9. Stefanidis, P.; Sapountzis, M.; Stathis, D. Sheet erosion after fire at the urban forest of Thessaloniki (Northern Greece). Silva Balc. 2002, 2, 65–77. [Google Scholar]
  10. Osterkamp, W.R.; Hupp, C.R.; Stoffel, M. The interactions between vegetation and erosion: New directions for research at the interface of ecology and geomorphology. Earth Surf. Process. Landf. 2012, 37, 23–36. [Google Scholar] [CrossRef]
  11. Günal, H.; Korucu, T.; Birkas, M.; Özgöz, E.; Halbac-Cotoara-Zamfir, R. Threats to Sustainability of Soil Functions in Central and Southeast Europe. Sustainability 2015, 7, 2161–2188. [Google Scholar] [CrossRef] [Green Version]
  12. Adornado, H.A.; Yoshida, M.; Apolinares, H. Erosion Vulnerability Assessment in REINA, Quezon Province, Philippines with Raster-based Tool Built within GIS Environment. Agric. Inf. Res. 2009, 18, 24–31. [Google Scholar] [CrossRef] [Green Version]
  13. Margiorou, S.; Kastridis, A.; Sapountzis, M. Pre/Post-Fire Soil Erosion and Evaluation of Check-Dams Effectiveness in Mediterranean Suburban Catchments Based on Field Measurements and Modeling. Land 2022, 11, 1705. [Google Scholar] [CrossRef]
  14. Kastridis, A.; Stathis, D.; Sapountzis, M.; Theodosiou, G. Insect Outbreak and Long-Term Post-Fire Effects on Soil Erosion in Mediterranean Suburban Forest. Land 2022, 11, 911. [Google Scholar] [CrossRef]
  15. Borrelli, P.; Robinson, D.A.; Fleischer, L.R.; Lugato, E.; Ballabio, C.; Alewell, C.; Meusbuger, K.; Modugno, S.; Schutt, B.; Ferro, V.; et al. An assessment of the global impact of 21st century land use change on soil erosion. Nat. Commun. 2017, 8, 2013. [Google Scholar] [CrossRef] [Green Version]
  16. Panagos, P.; Borrelli, P.; Poesen, J. Soil loss due to crop harvesting in the European Union: A first estimation of an underrated geomorphic process. Sci. Total Environ. 2019, 664, 487–498. [Google Scholar] [CrossRef] [PubMed]
  17. Shakesby, R.A.; Bento, C.P.; Ferreira, C.S.; Ferreira, A.J.; Stoof, C.R.; Urbanek, E.; Walsh, R.P. Impacts of prescribed fire on soil loss and soil quality: An assessment based on an experimentally-burned catchment in Central Portugal. Catena 2015, 128, 278–293. [Google Scholar] [CrossRef]
  18. Ferreira, C.S.S.; Seifollahi-Aghmiuni, S.; Destouni, G.; Ghajarnia, N.; Kalantari, Z. Soil degradation in the European Mediterranean region: Processes, status and consequences. Sci. Total Environ. 2022, 805, 150106. [Google Scholar] [CrossRef] [PubMed]
  19. Depountis, N.; Michalopoulou, M.; Kavoura, K.; Nikolakopoulos, K.; Sabatakakis, N. Estimating Soil Erosion Rate Changes in Areas Affected by Wildfires. ISPRS Int. J. Geo-Inf. 2020, 9, 562. [Google Scholar] [CrossRef]
  20. Kastridis, A.; Stathis, D. The effect of small earth dams and reservoirs on water management in North Greece (Kerkini municipality). Silva Balc. 2015, 16, 71–84. [Google Scholar]
  21. Iradukunda, P.; Bwambale, E. Reservoir sedimentation and its effect on storage capacity—A case study of Murera reservoir, Kenya. Cogent Eng. 2021, 8, 1917329. [Google Scholar] [CrossRef]
  22. Kalinderis, M.; Sapountzis, D.; Stathis, F.; Tziaftani, P.; Kourakli, P.; Stefanidis, P. The Risk of Sedimentation of Artificial Lakes, Following the Soil Loss and Degradation Process in the Wider Drainage Basin—Artificial Lake of Smokovo Case Study (Central Greece). In Proceedings of the International Conference on Land Conservation (LANDCON), Tara Mountain, Serbia, 26–30 May 2009; Zlatić, M., Ed.; Global Change: Challenges for Soil Management. Catena Verlag: Stuttgart, Germany, 2009; pp. 129–140, ISBN 978-3-923381-57-9. [Google Scholar]
  23. Sapountzis, M.; Myronidis, D.; Stathis, D.; Stefanidis, P. Comparison of the results of the application of the USLE and Gavrilović erosion prediction methods with actual measurements in a watershed. In Proceedings of the EYE & EDYP Joint Conference Integrated Management of Water Resources in Conditions of Climate Change, Volos, Greece, 27–30 May 2009; pp. 155–163. [Google Scholar]
  24. Deng, Z.Q.; de Lima, J.L.; Jung, H.S. Sediment transport rate-based model for rainfall-induced soil erosion. Catena 2008, 76, 54–62. [Google Scholar] [CrossRef] [Green Version]
  25. Rose, C.W. Soil erosion models and implications for conservation of sloping tropical lands. In Proceedings of the 10th International Soil Conservation Organization Meeting, Purdue University, West Lafayette, IN, USA, 24–29 May 1999; pp. 24–29. [Google Scholar]
  26. Zema, D.A.; Carrà, B.G.; Lucas-Borja, M.E.; Filianoti, P.G.F.; Pérez-Cutillas, P.; Conesa-García, C. Modelling Water Flow and Soil Erosion in Mediterranean Headwaters (with or without Check Dams) under Land-Use and Climate Change Scenarios Using SWAT. Water 2022, 14, 2338. [Google Scholar] [CrossRef]
  27. Haregeweyn, N.; Tsunekawa, A.; Poesen, J.; Tsubo, M.; Meshesha, D.T.; Fenta, A.A.; Nyssen, J.; Adgo, E. Comprehensive assessment of soil erosion risk for better land use planning in river basins: Case study of the Upper Blue Nile River. Sci. Total Environ. 2017, 574, 95–108. [Google Scholar] [CrossRef] [PubMed]
  28. Molla, T.; Sisheber, B. Estimating soil erosion risk and evaluating erosion control measures for soil conservation planning at Koga watershed in the highlands of Ethiopia. Solid Earth 2017, 8, 13–25. [Google Scholar] [CrossRef] [Green Version]
  29. Smith, H.J. Application of Empirical Soil Loss Models in Southern Africa: A Review. South Afr. J. Plant Soil 1999, 16, 158–163. [Google Scholar] [CrossRef]
  30. Ebrahimzadeh, S.; Motagh, M.; Mahboub, V.; Mirdar Harijani, F. An improved RUSLE/SDR model for the evaluation of soil erosion. Environ. Earth Sci. 2018, 77, 454. [Google Scholar] [CrossRef]
  31. Hao, C.H.E.N.; Oguchi, T.; Pan, W.U. Assessment for soil loss by using a scheme of alterative sub-models based on the RUSLE in a Karst Basin of Southwest China. J. Integr. Agric. 2017, 16, 377–388. [Google Scholar] [CrossRef] [Green Version]
  32. Xu, Y.-Q.; Shao, X.-M.; Kong, X.-B.; Peng, J.; Cai, Y.-L. Adapting the RUSLE and GIS to model soil erosion risk in a mountains karst watershed, Guizhou Province, China. Environ. Monit. Assess. 2008, 141, 275–286. [Google Scholar] [CrossRef]
  33. Phinzi, K.; Ngetar, N.S. The assessment of water-borne erosion at catchment level using GIS-based RUSLE and remote sensing: A review. Int. Soil Water Conserv. Res. 2019, 7, 27–46. [Google Scholar] [CrossRef]
  34. Devatha, C.P.; Deshpande, V.; Renukaprasad, M.S. Estimation of soil loss using USLE model for Kulhan Watershed, Chat-tisgarh—A case study. Aquat. Procedia 2015, 4, 1429–1436. [Google Scholar] [CrossRef]
  35. Kouli, M.; Soupios, P.; Vallianatos, F. Soil erosion prediction using the revised universal soil loss equation (RUSLE) in a GIS framework, Chania, Northwestern Crete, Greece. Environ. Geol. 2009, 57, 483–497. [Google Scholar] [CrossRef]
  36. De Vente, J.; Poesen, J. Predicting soil erosion and sediment yield at the basin scale: Scale issues and semi-quantitative models. Earth-Sci. Rev. 2005, 71, 95–125. [Google Scholar] [CrossRef]
  37. Batista, P.V.; Davies, J.; Silva, M.L.; Quinton, J.N. On the evaluation of soil erosion models: Are we doing enough? Earth-Sci. Rev. 2019, 197, 102898. [Google Scholar] [CrossRef]
  38. Robichaud, P.R.; Brown, R.E. Silt Fences: An Economical Technique for Measuring Hillslope Soil Erosion; General Technical Report RMRSGTR-94; US Department of Agriculture, Forest Service, Rocky Mountain Research Station: Fort Collins, CO, USA, 2002; p. 24.
  39. Hsieh, Y.P.; Grant, K.T.; Bugna, G.C. A field method for soil erosion measurements in agricultural and natural lands. J. Soil Water Conserv. 2009, 64, 374–382. [Google Scholar] [CrossRef] [Green Version]
  40. Boix-Fayos, C.; Martínez-Mena, M.; Arnau-Rosalén, E.; Calvo-Cases, A.; Castillo, V.; Albaladejo, J. Measuring soil erosion by field plots: Understanding the sources of variation. Earth-Sci. Rev. 2006, 78, 267–285. [Google Scholar] [CrossRef]
  41. Bussi, G.; Rodríguez-Lloveras, X.; Francés, F.; Benito, G.; Sánchez-Moya, Y.; Sopeña, A. Sediment yield model implementation based on check dam infill stratigraphy in a semiarid Mediterranean catchment. Hydrol. Earth Syst. Sci. 2013, 17, 3339–3354. [Google Scholar] [CrossRef] [Green Version]
  42. Tzioutzios, C.; Kastridis, A. Multi-Criteria Evaluation (MCE) Method for the Management of Woodland Plantations in Floodplain Areas. ISPRS Int. J. Geo-Inf. 2020, 9, 725. [Google Scholar] [CrossRef]
  43. Cheng, C.H.; Thompson, R.G. Application of Boolean Logic and GIS for Determining Suitable Locations for Temporary Disaster Waste Management Sites. Int. J. Disaster Risk Reduct. 2016, 20, 78–92. [Google Scholar] [CrossRef]
  44. Forest Research Institute of Thessaloniki. Installation of a System for Monitoring the Developments in the Suburban Forest of Thessaloniki (Seich Sou) and Preparation of a Study for the Selection of Forest Species in Fire-Affected Areas; Forest Research Institute of Thessaloniki: Thessaloniki, Greece, 2001.
  45. Yoshimura, K.; Onda, Y.; Kato, H. Evaluation of radiocaesium wash-off by soil erosion from various land uses using USLE plots. J. Environ. Radioact. 2015, 139, 362–369. [Google Scholar] [CrossRef] [PubMed]
  46. Vaezi, A.R.; Abbasi, M.; Keesstra, S.; Cerdà, A. Assessment of soil particle erodibility and sediment trapping using check dams in small semi-arid catchments. Catena 2017, 157, 227–240. [Google Scholar] [CrossRef] [Green Version]
  47. Rodrigues, B.T.; Zema, D.A.; González-Romero, J.; Rodrigues, M.T.; Campos, S.; Galletero, P.; Plaza-Álvarez, P.A.; Lucas-Borja, M.E. The Use of Unmanned Aerial Vehicles (UAVs) for Estimating Soil Volumes Retained by Check Dams after Wildfires in Mediterranean Forests. Soil Syst. 2021, 5, 9. [Google Scholar] [CrossRef]
  48. Quiñonero-Rubio, J.M.; Nadeu, E.; Boix-Fayos, C.; de Vente, J. Evaluation of the effectiveness of forest restoration and check-dams to reduce catchment sediment yield. Land Degrad. Dev. 2016, 27, 1018–1031. [Google Scholar] [CrossRef]
  49. Ramos-Diez, I.; Navarro-Hevia, J.; San Martín Fernández, R.; Díaz-Gutiérrez, V.; Mongil-Manso, J. Analysis of methods to determine the sediment retained by check dams and to estimate erosion rates in badlands. Environ. Monit. Assess. 2016, 188, 405. [Google Scholar] [CrossRef] [PubMed]
  50. Boix-Fayos, C.; de Vente, J.; Martínez-Mena, M.; Barberá, G.G.; Castillo, V. The impact of land use change and check-dams on catchment sediment yield. Hydrol. Process. Int. J. 2008, 22, 4922–4935. [Google Scholar] [CrossRef]
  51. De Vente, J.; Poesen, J.; Verstraeten, G.; Van Rompaey, A.; Govers, G. Spatially distributed modelling of soil erosion and sediment yield at regional scales in Spain. Glob. Planet. Change 2008, 60, 393–415. [Google Scholar] [CrossRef]
  52. Panagos, P.; Borrelli, P.; Meusburger, K.; Alewell, C.; Lugato, E.; Montanarella, L. Estimating the soil erosion cover-management factor at the European scale. Land Use Policy 2015, 48, 38–50. [Google Scholar] [CrossRef]
  53. Aksoy, H.; Kavvas, M.L. A review of hillslope and watershed scale erosion and sediment transport models. Catena 2005, 64, 247–271. [Google Scholar] [CrossRef]
  54. Lagouvardos, K.; Kotroni, V.; Bezes, A.; Koletsis, I.; Kopania, T.; Lykoudis, S.; Vougioukas, S. The automatic weather stations NOANN network of the National Observatory of Athens: Operation and database. Geosci. Data J. 2017, 4, 4–16. [Google Scholar] [CrossRef]
Figure 1. Study area. Thessaloniki suburban forest (Seich Sou).
Land 11 02129 g001
Figure 2. Silt fence installation process: hand-dug trench to insert the geotextile. The blue arrow indicates the runoff direction.
Land 11 02129 g002
Figure 3. Silt fence installation process: the geotextile compacted with earth material in the trench. The blue arrow indicates the runoff direction.
Land 11 02129 g003
Figure 4. Silt fence installation process: the silt fence was fastened on 5 metal rebars. The blue arrow indicates the runoff direction.
Land 11 02129 g004
Figure 5. Drying of soil samples in a heating chamber and a scale of high accuracy (4 decimal places) for weighing the samples.
Land 11 02129 g005
Figure 6. Silt fence operation: the silt fence has bended under the weight of sediment material. The blue arrow indicates the runoff direction.
Land 11 02129 g006
Figure 7. Large holes on the geotextile caused by wild boars.
Land 11 02129 g007
Figure 8. Silt fence which was damaged by humans trying to pullout the metal rebars and geotextile (left). Damage to the experimental setup for the measurement of runoff (right).
Land 11 02129 g008
Figure 9. Check-dam in the study area which is almost totally covered by dense vegetation.
Land 11 02129 g009
Figure 10. Experimental setup for the measurement of surface runoff (left). Water gathered in the plastic tank after an intense rainfall event (right).
Land 11 02129 g010
Figure 11. View of the installed cumulative rain gauge in the study area.
Land 11 02129 g011
Table 1. Materials and tools that are necessary to install the silt fences and the respective cost of each item (based on the Greek market). The purchase of the materials and tools was undertaken in the year 2019.
Materials and ToolsQuantityCost Per Item (€)Total Cost (€)
Shovel with sharp edge11515
Pick mattock12828
Hand trowels22.55
Sledgehammer (3 kg)13030
Cable ties (140 × 2.5 mm)3 × 100 pcs13
Steel cap for driving the metal rebars12020
Metal rebars (1200 × 10 mm)180 m1.138204.84
Silt fence geotextile (1 m high)170 m0.7119
Labor gloves34.112.3
Silicon34.513.5
Small plastic bags for soil samples1000.2828
Measuring tape1Provided by the Laboratory0
GPS device1Provided by the Laboratory0
Clinometer1Provided by the Laboratory0
Plastic backets (20 l)3Provided by the Laboratory0
Scale (20 kg capacity)1Provided by the Laboratory0
Total cost for silt fence installation and maintenance--------478.64
Table 2. Materials and tools that are necessary to install the runoff micro-plots and the cost of each item (Greek market, year of 2019).
Materials and ToolsQuantityCost Per Item (€)Total Cost
Steel frames (0.4 × 0.4 × 0.25 m)640240
Plastic flexible tube10 m1.717
Plastic tanks for water gathering (100 l)645270
Plastic linoleum for covering the tanks10 m23.333
Total cost--------560
Publisher’s Note: MDPI stays neutral with regard to jurisdictional claims in published maps and institutional affiliations.