

Deconstruction of Dryness and Wetness Patterns with Drought Condition Assessment over the Mun River Basin, Thailand
Abstract
:1. Introduction
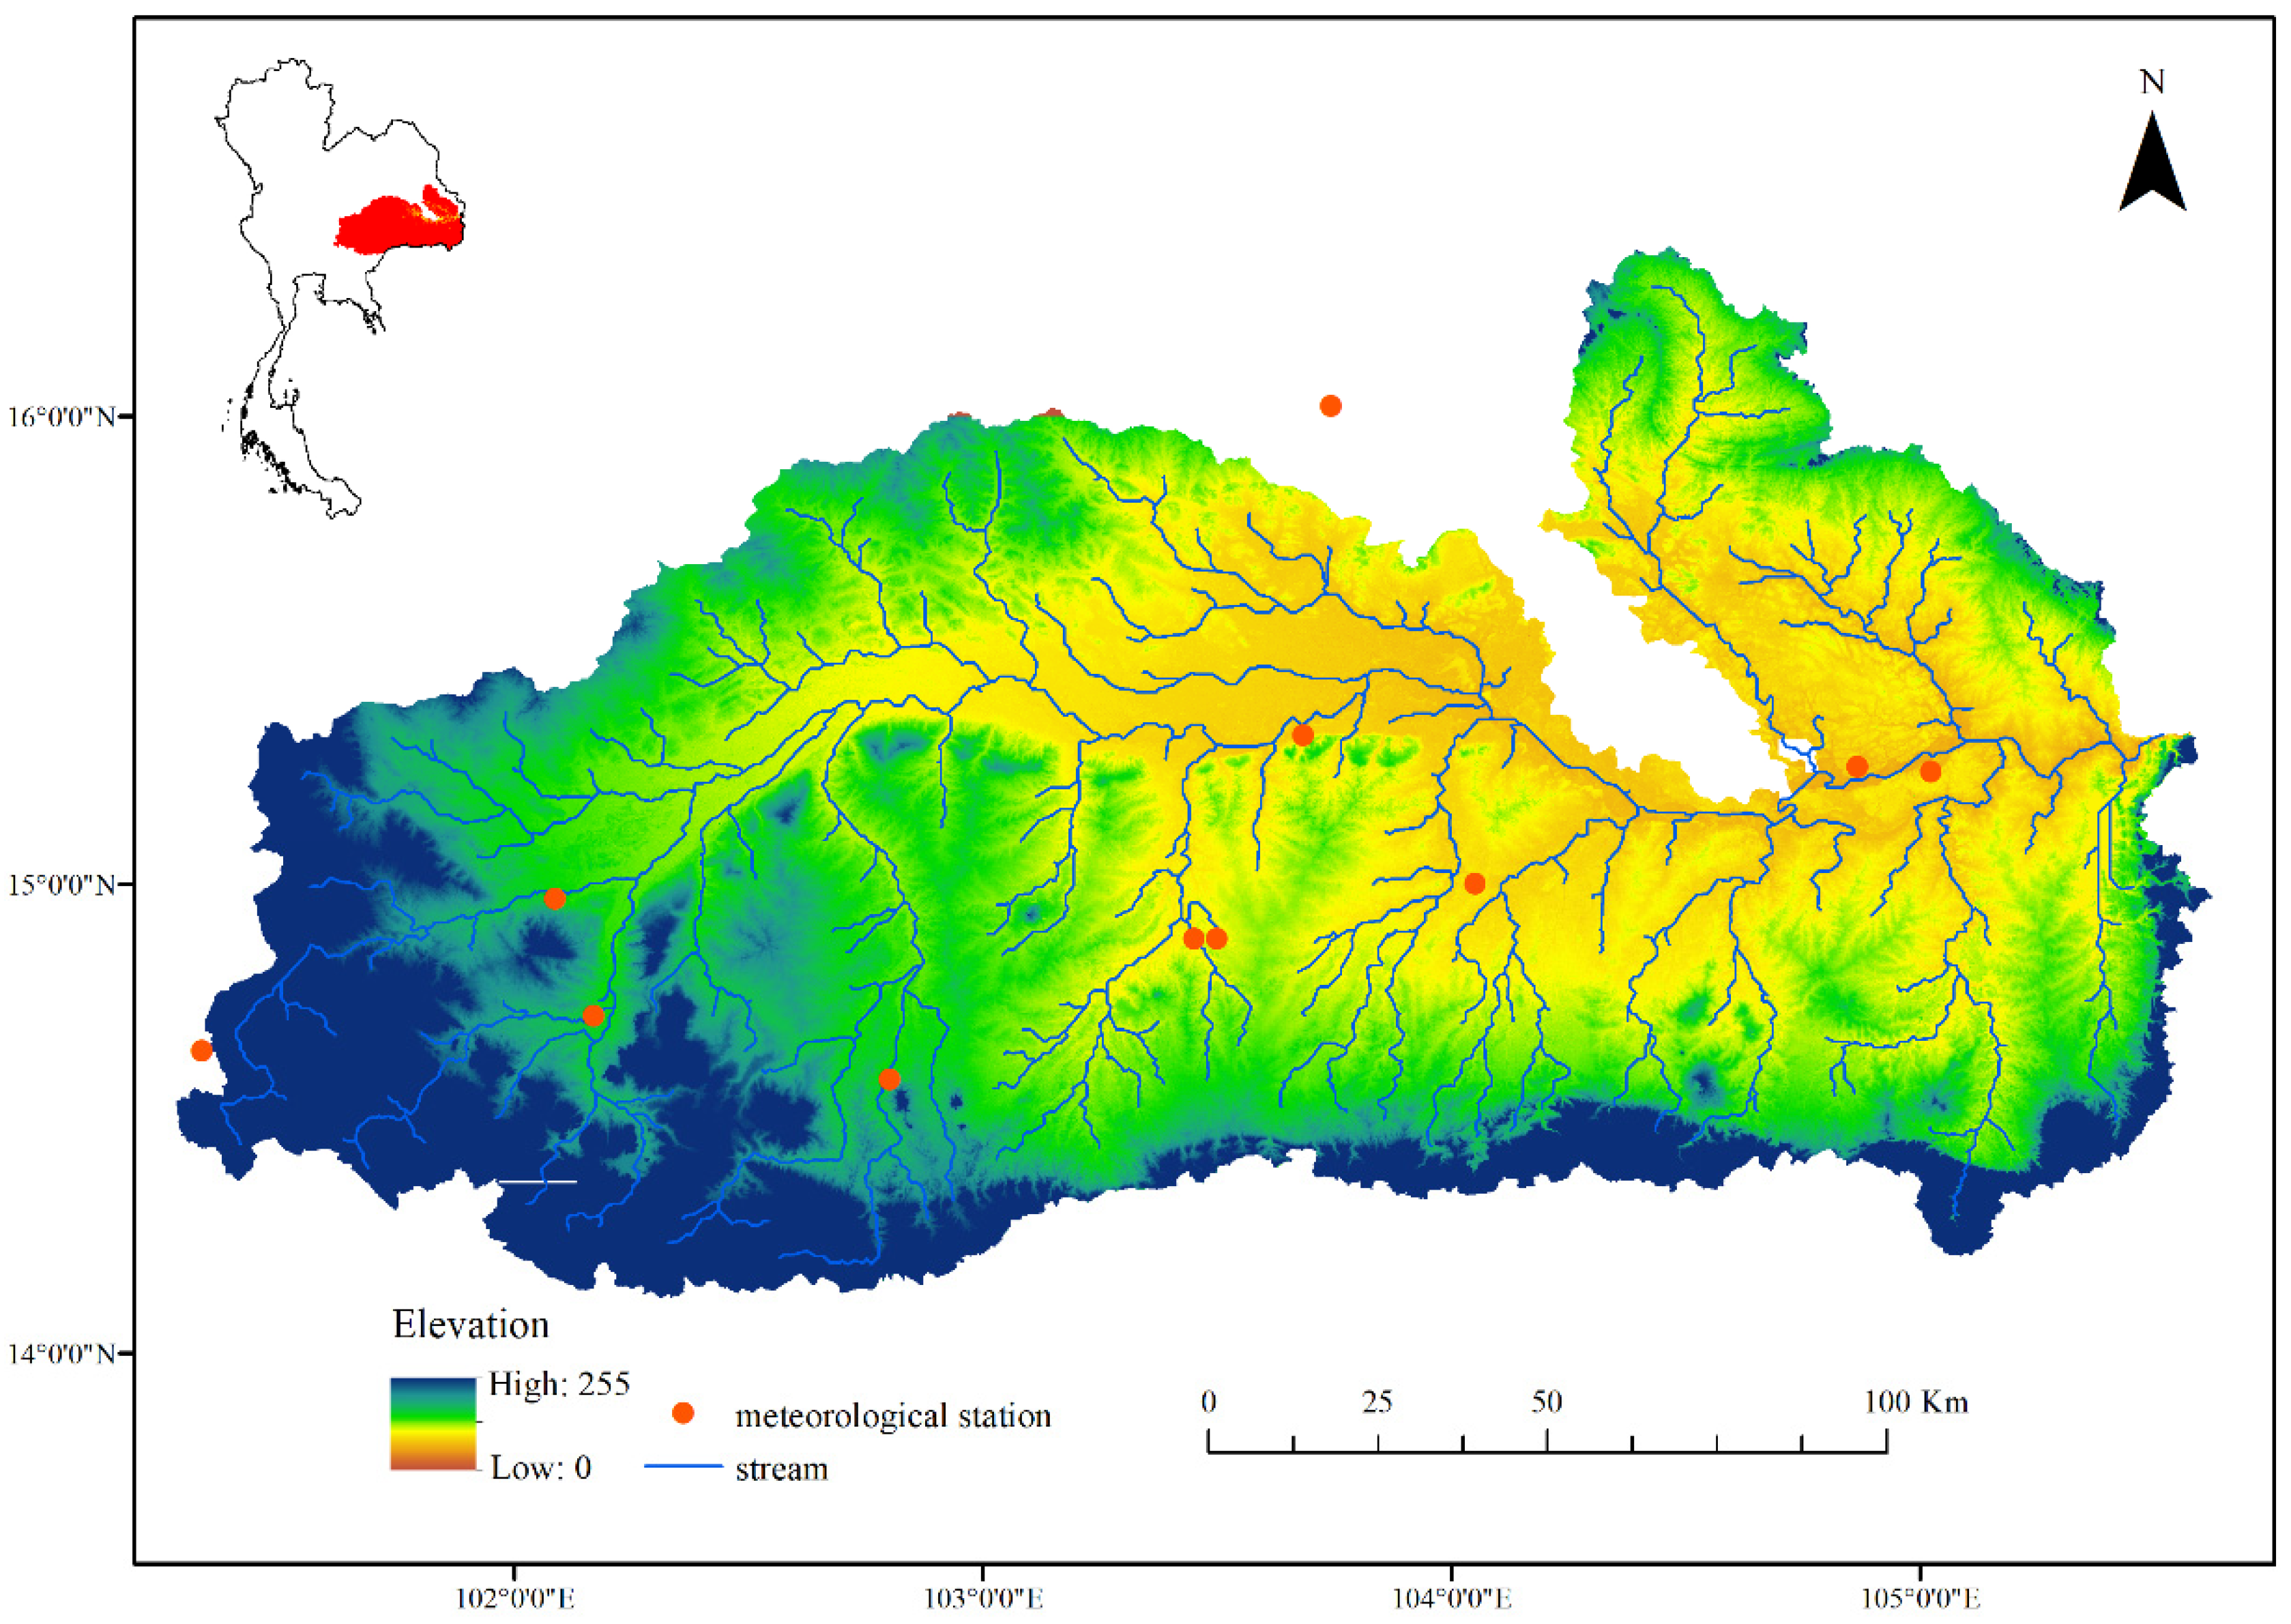
2. Study Area
3. Data and Methods
3.1. Data Processing
3.2. Methodology
3.2.1. Thornthwaite Equation
3.2.2. Standardized Precipitation Evapotranspiration Index (SPEI)
3.2.3. Ensemble Empirical Mode Decomposition (EEMD)
- (1)
- The standard normal distribution white-noise series is added to the targeted data.
- (2)
- The targeted data with additional white noise is decomposed into IMFs.
- (3)
- Repeat steps (1) and (2) n times with a different white-noise series each time.
- (4)
- Obtain the final results based on the ensemble means of corresponding IMFs.
4. Results and Discussion
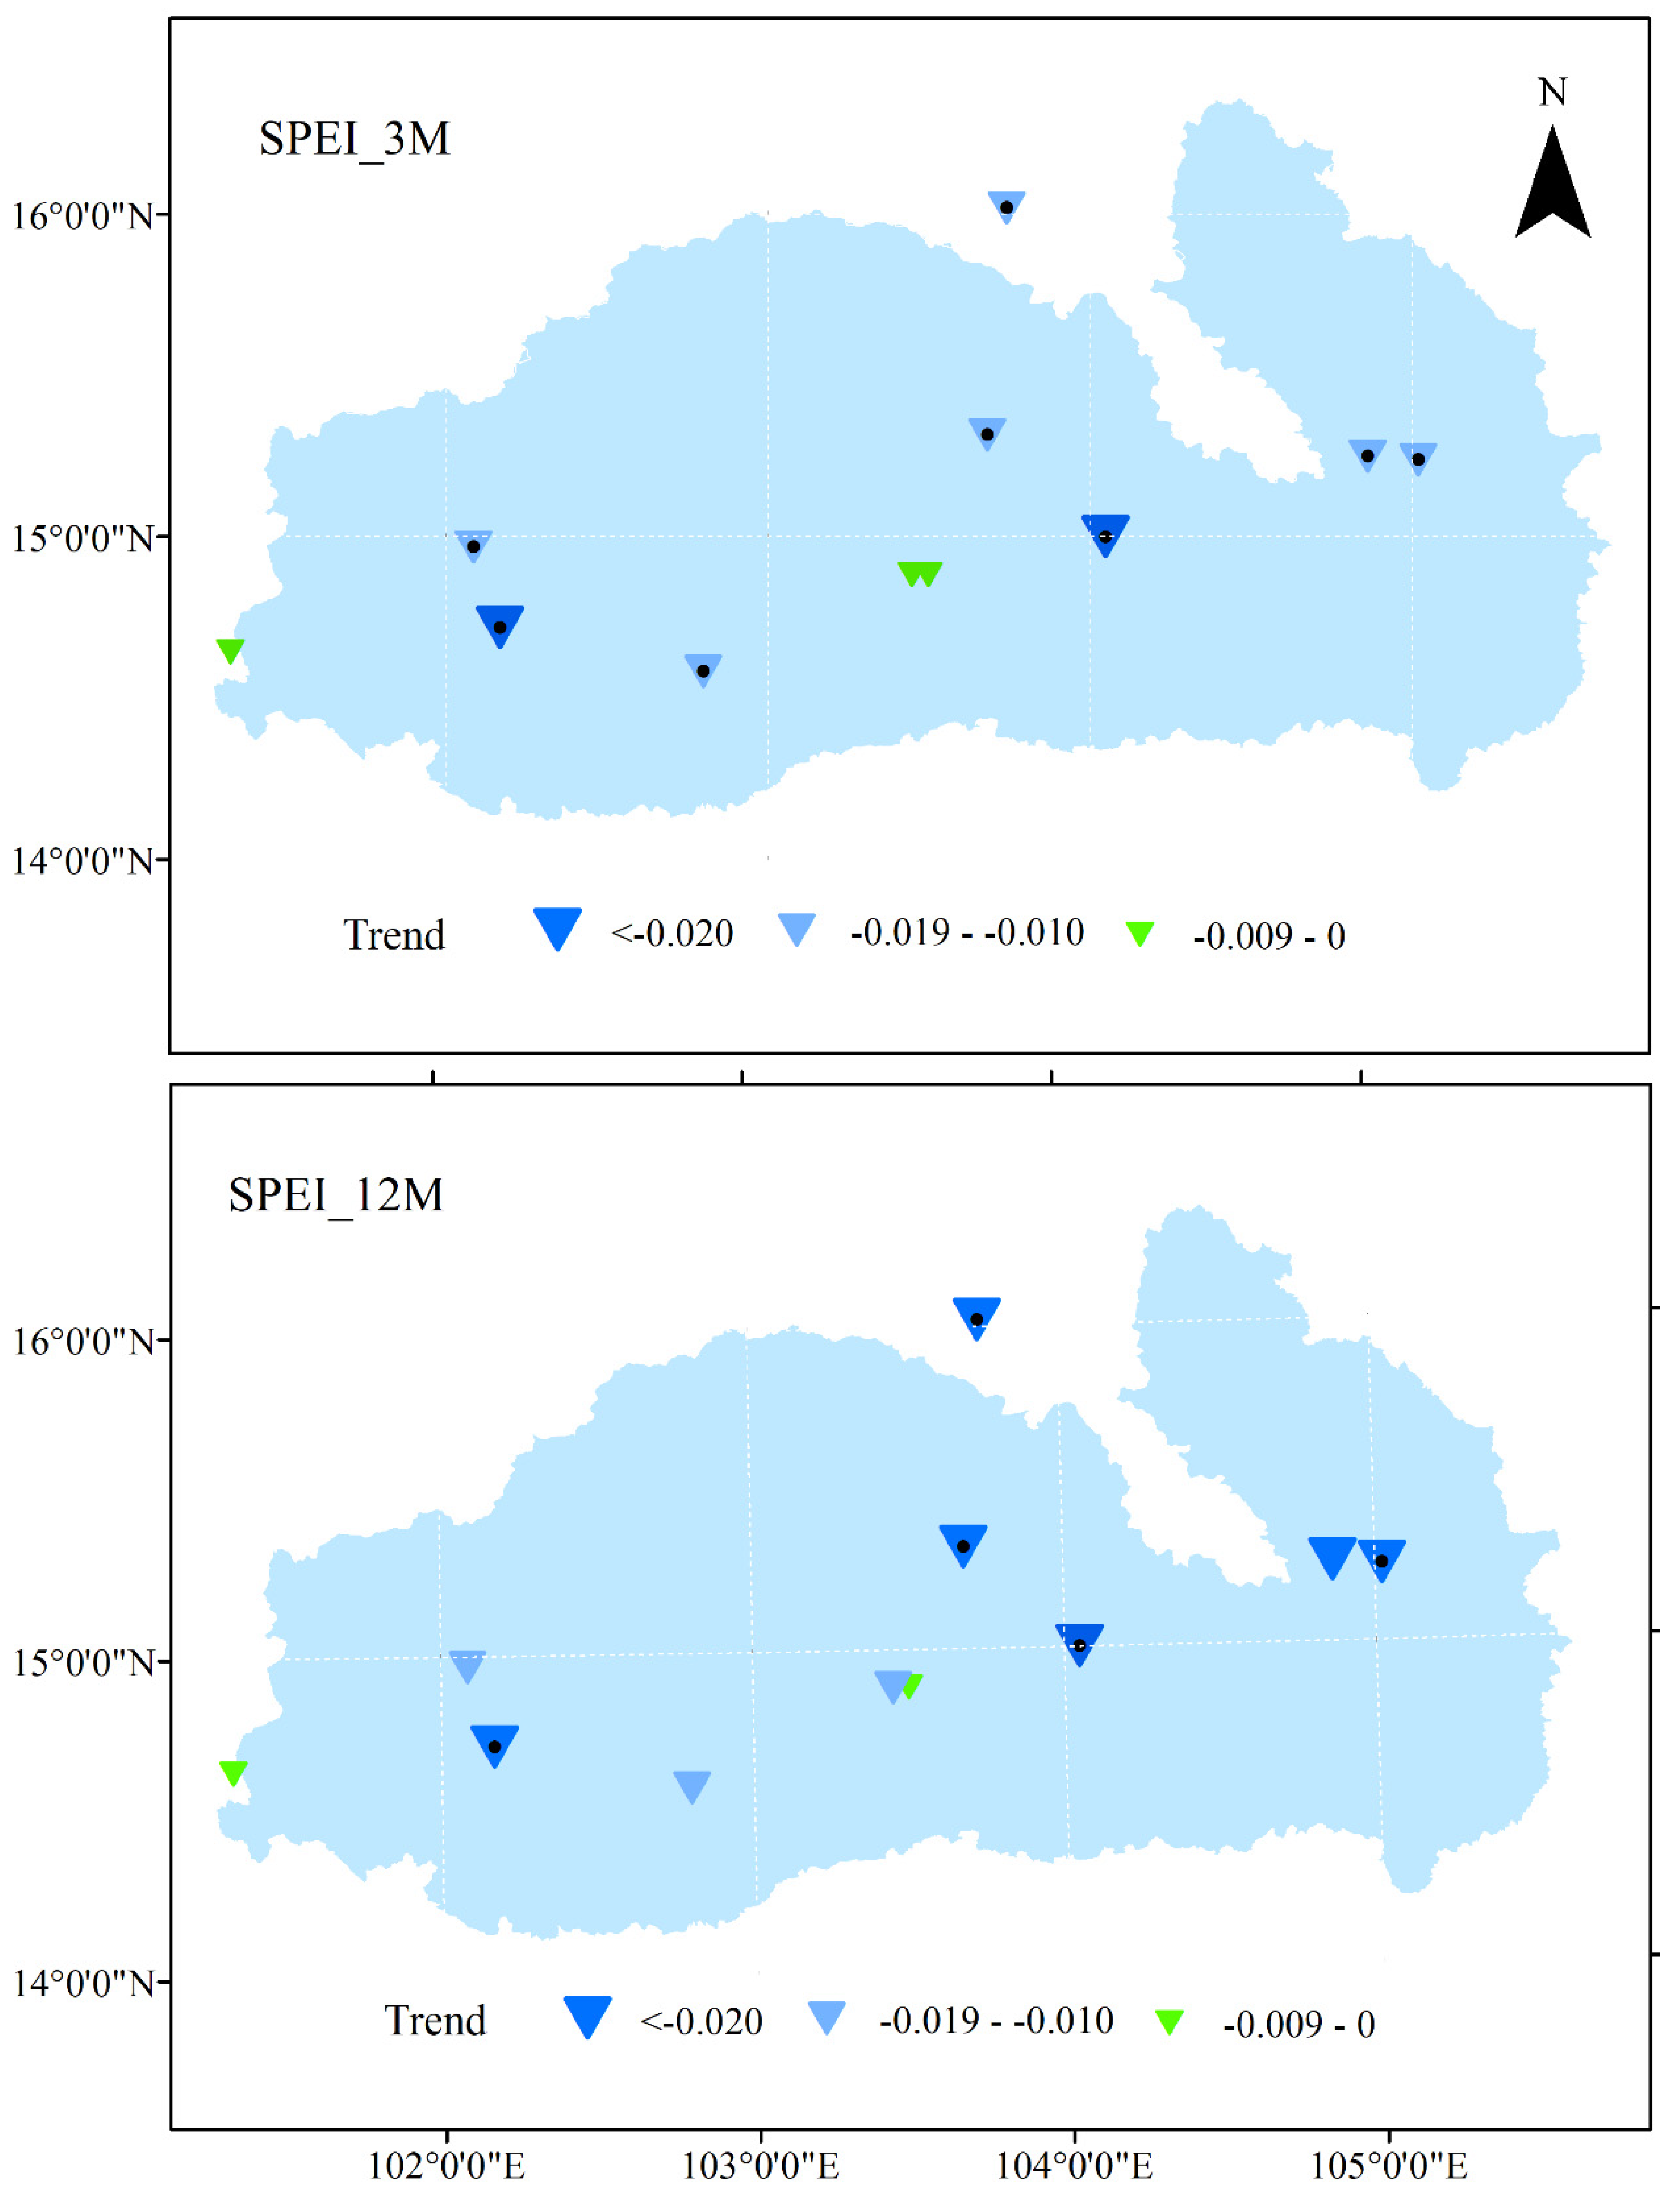
4.1. Dryness and Wetness Pattern Detection
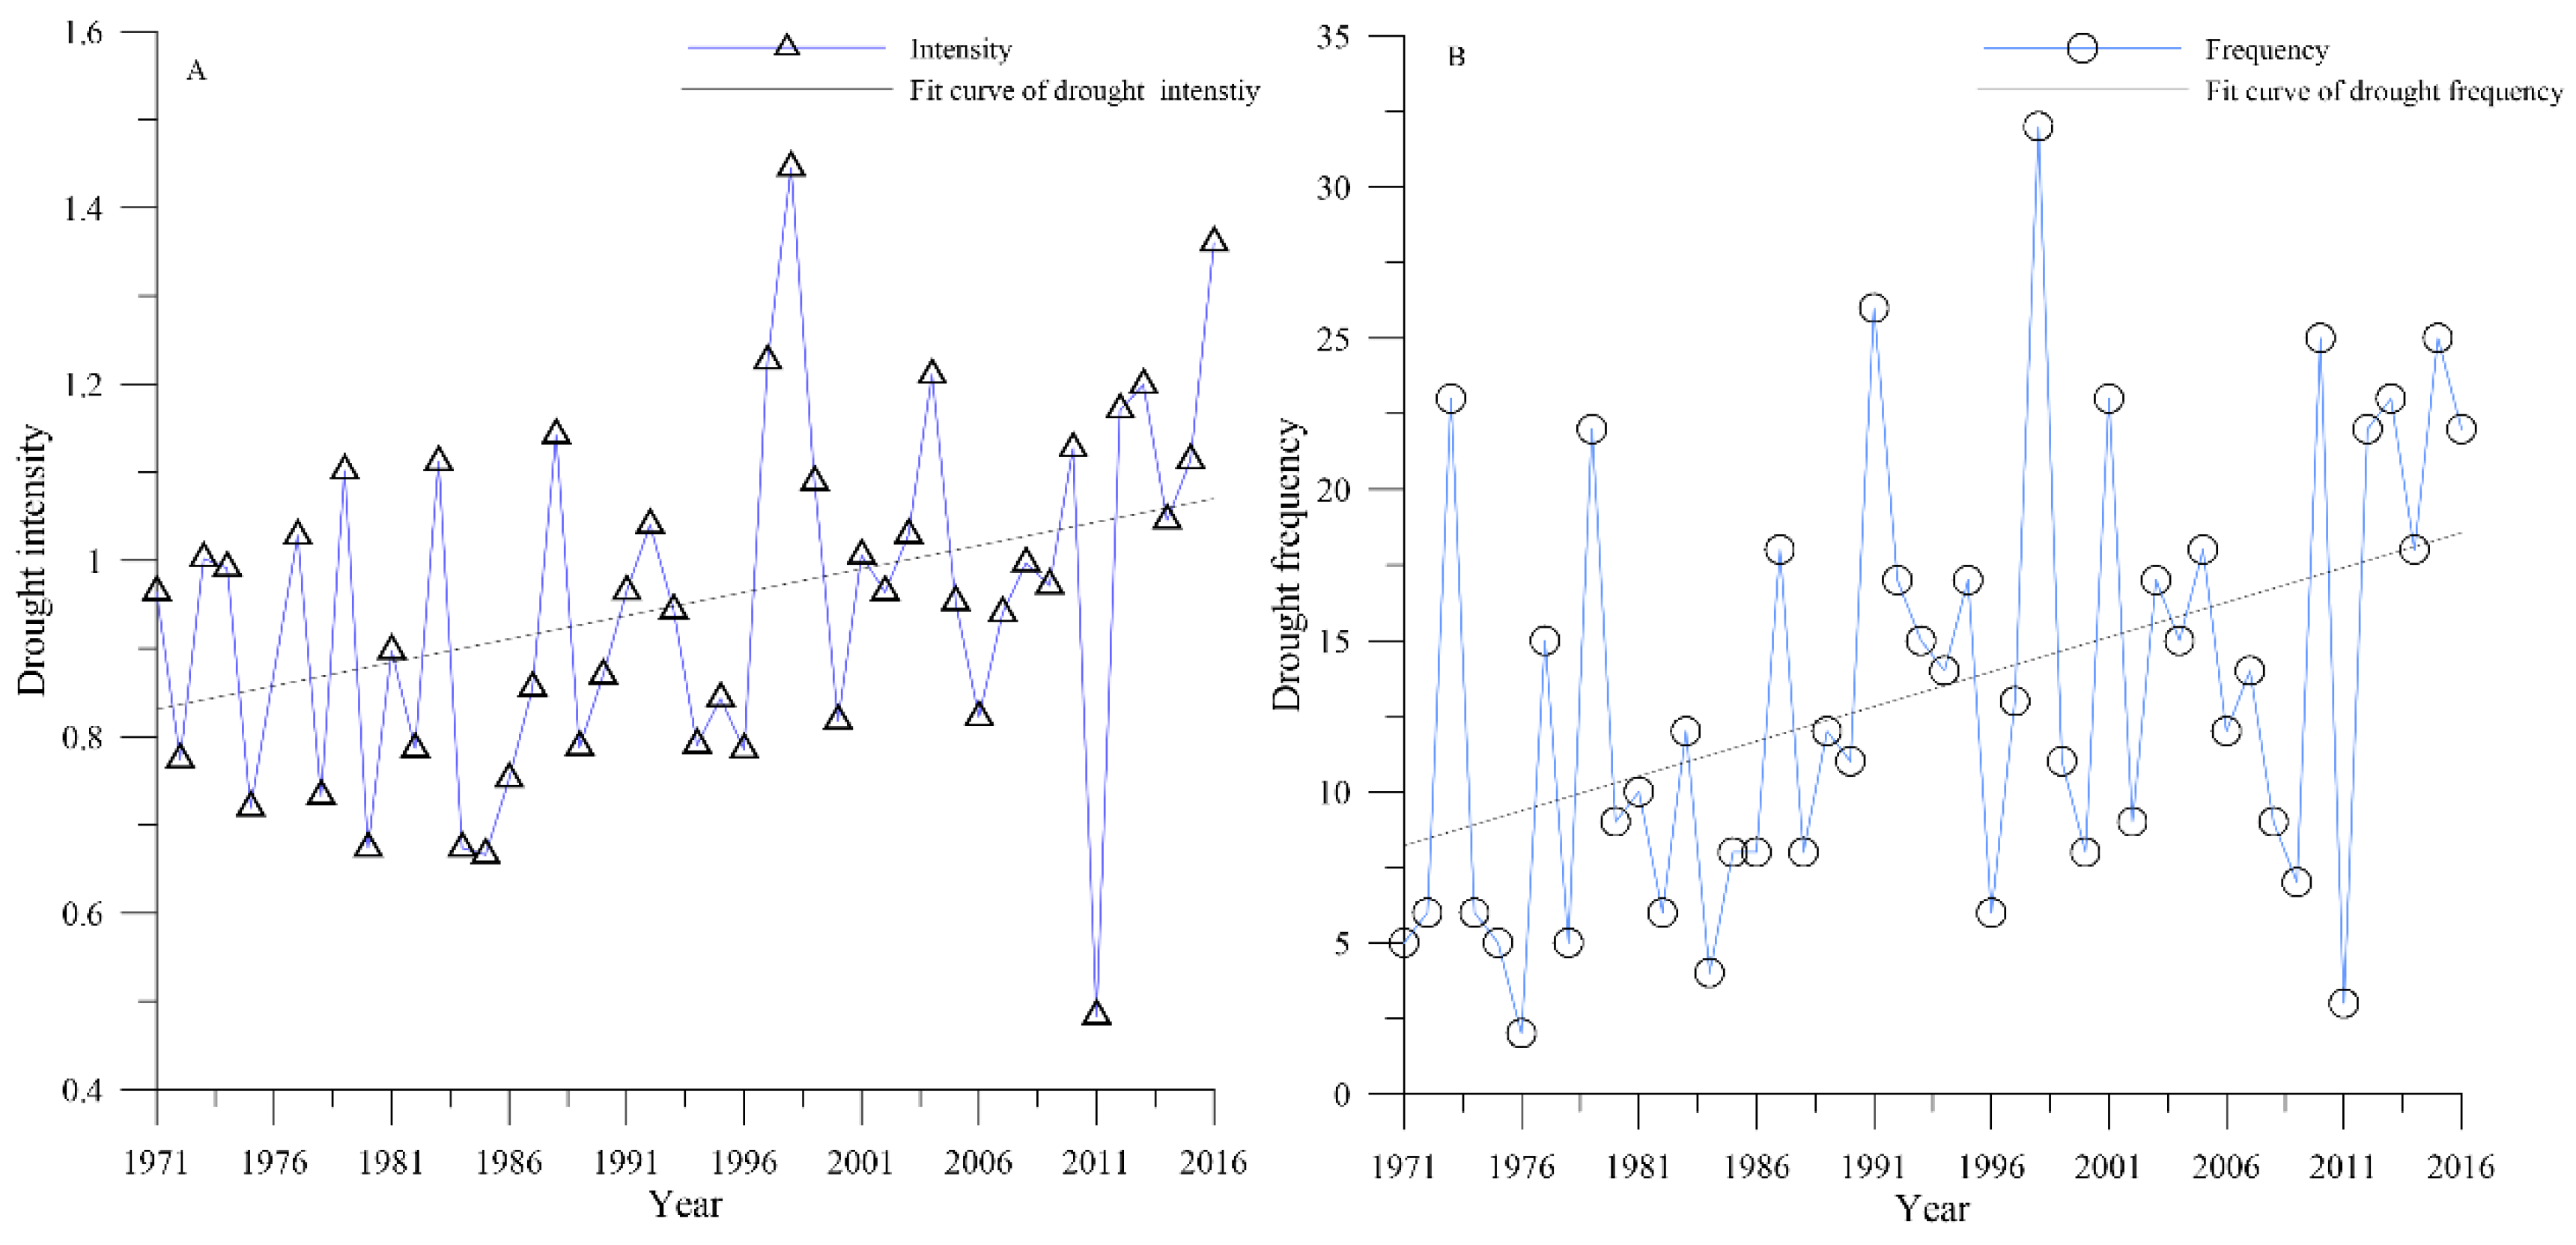
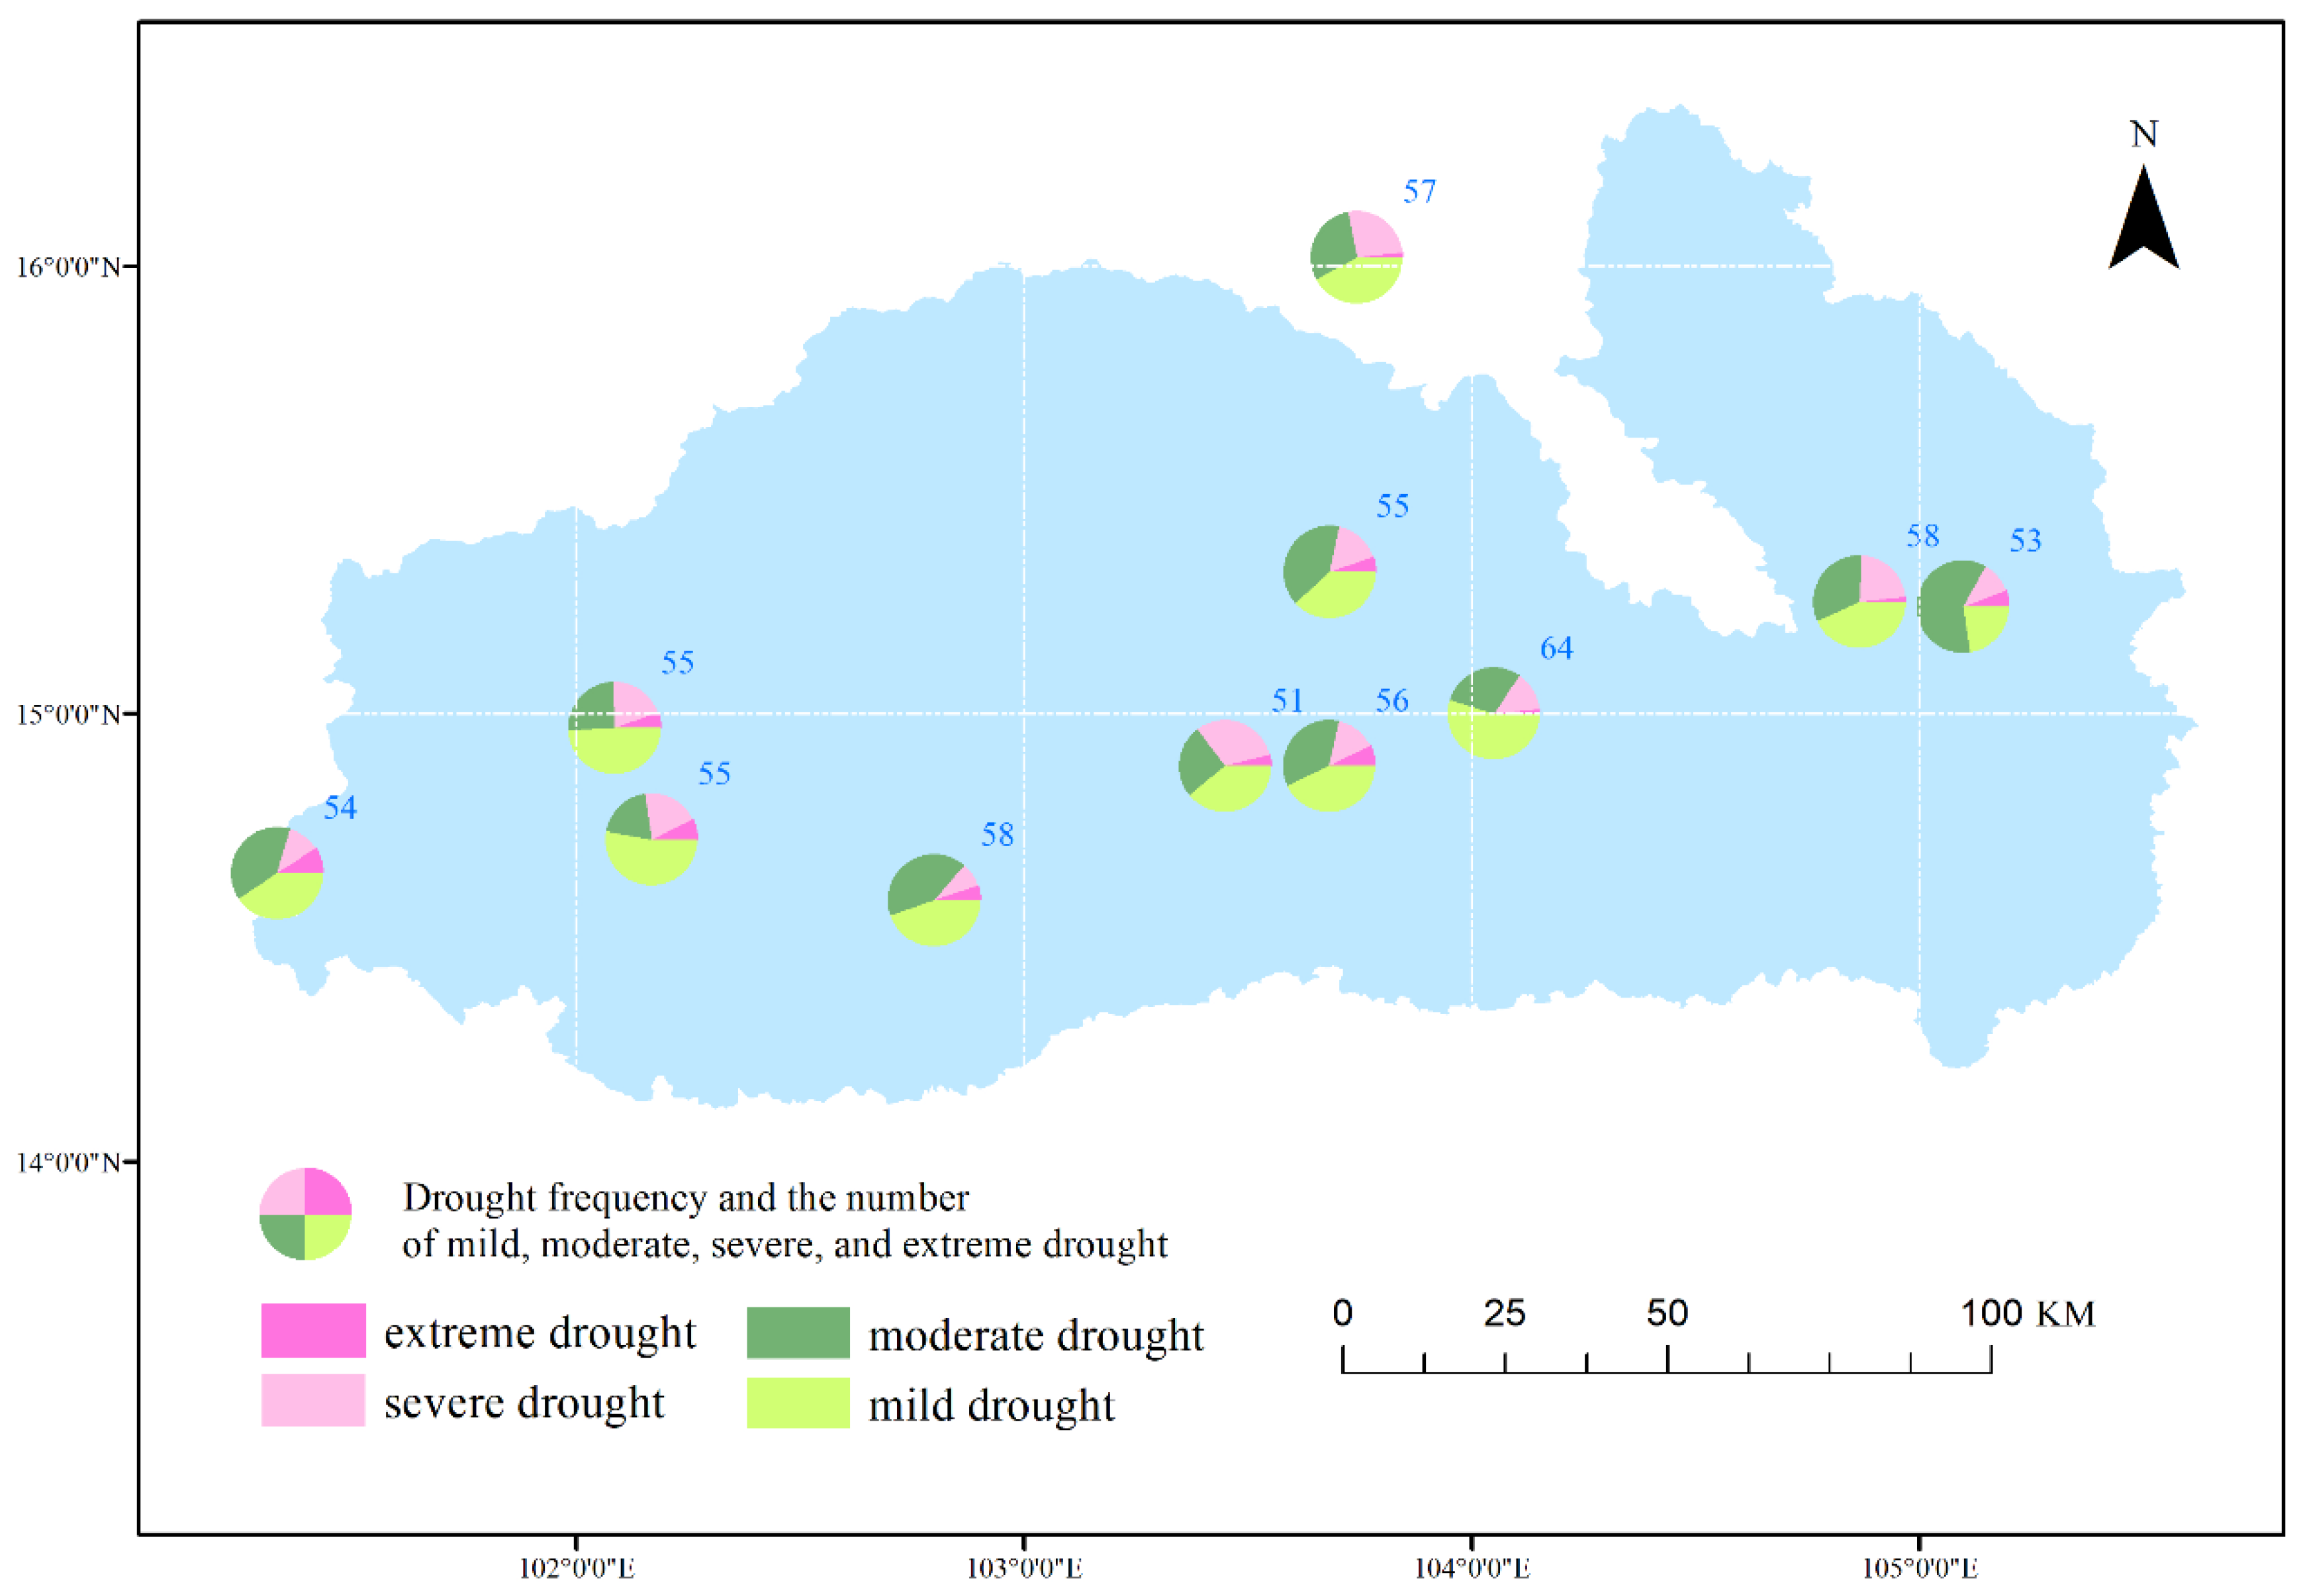
4.2. Drought Intensity, Frequency, and Duration
4.3. The Potential Influencing Factors for the Drought Condition
5. Conclusions
Author Contributions
Funding
Data Availability Statement
Conflicts of Interest
References
- Li, X.; Zhou, W.; Chen, Y.D. Assessment of Regional Drought Trend and Risk over China: A Drought Climate Division Perspective. J. Clim. 2015, 28, 7025–7037. [Google Scholar] [CrossRef]
- Liu, W.; Sun, F.; Lim, W.H.; Zhang, J.; Wang, H.; Shiogama, H.; Zhang, Y. Global Drought and Severe Drought-Affected Populations in 1.5 and 2 C Warmer Worlds. Earth Syst. Dyn. 2018, 9, 267–283. [Google Scholar] [CrossRef] [Green Version]
- Naumann, G.; Alfieri, L.; Wyser, K.; Mentaschi, L.; Betts, R.; Carrao, H.; Spinoni, J.; Vogt, J.; Feyen, L. Global Changes in Drought Conditions under Different Levels of Warming. Geophys. Res. Lett. 2018, 45, 3285–3296. [Google Scholar] [CrossRef]
- Faiz, M.A.; Zhang, Y.; Zhang, X.; Ma, N.; Aryal, S.K.; Ha, T.T.V.; Baig, F.; Naz, F. A Composite Drought Index Developed for Detecting Large-Scale Drought Characteristics. J. Hydrol. 2022, 605, 127308. [Google Scholar] [CrossRef]
- Wang, W.; Vinocur, B.; Altman, A. Plant Responses to Drought, Salinity and Extreme Temperatures: Towards Genetic Engineering for Stress Tolerance. Planta 2003, 218, 1–14. [Google Scholar] [CrossRef] [PubMed]
- Sheffield, J.; Wood, E.F.; Roderick, M.L. Little Change in Global Drought over the Past 60 Years. Nature 2012, 491, 435–438. [Google Scholar] [CrossRef] [PubMed]
- Trenberth, K.E.; Dai, A.; Van Der Schrier, G.; Jones, P.D.; Barichivich, J.; Briffa, K.R.; Sheffield, J. Global Warming and Changes in Drought. Nat. Clim. Change 2014, 4, 17–22. [Google Scholar] [CrossRef]
- Su, B.; Huang, J.; Fischer, T.; Wang, Y.; Kundzewicz, Z.W.; Zhai, J.; Sun, H.; Wang, A.; Zeng, X.; Wang, G.; et al. Drought Losses in China Might Double between the 1.5 C and 2.0 C Warming. Proc. Natl. Acad. Sci. USA 2018, 115, 10600–10605. [Google Scholar] [CrossRef] [PubMed] [Green Version]
- Páscoa, P.; Gouveia, C.M.; Russo, A.; Ribeiro, A.F. Summer Hot Extremes and Antecedent Drought Conditions in Australia. Int. J. Climatol. 2022, 42, 5487–5502. [Google Scholar] [CrossRef]
- Svoboda, M.; LeComte, D.; Hayes, M.; Heim, R.; Gleason, K.; Angel, J.; Rippey, B.; Tinker, R.; Palecki, M.; Stooksbury, D.; et al. The Drought Monitor. Bull. Am. Meteorol. Soc. 2002, 83, 1181–1190. [Google Scholar] [CrossRef]
- Spinoni, J.; Naumann, G.; Carrao, H.; Barbosa, P.; Vogt, J. World Drought Frequency, Duration, and Severity for 1951–2010. Int. J. Climatol. 2014, 34, 2792–2804. [Google Scholar] [CrossRef] [Green Version]
- Zhang, L.; Zhou, T. Drought over East Asia: A Review. J. Clim. 2015, 28, 3375–3399. [Google Scholar] [CrossRef]
- Peltonen-Sainio, P.; Juvonen, J.; Korhonen, N.; Parkkila, P.; Sorvali, J.; Gregow, H. Climate Change, Precipitation Shifts and Early Summer Drought: An Irrigation Tipping Point for Finnish Farmers? Clim. Risk Manag. 2021, 33, 100334. [Google Scholar] [CrossRef]
- Vicente-Serrano, S.M.; Beguería, S.; López-Moreno, J.I. A Multiscalar Drought Index Sensitive to Global Warming: The Standardized Precipitation Evapotranspiration Index. J. Clim. 2010, 23, 1696–1718. [Google Scholar] [CrossRef] [Green Version]
- Beguería, S.; Vicente-Serrano, S.M.; Reig, F.; Latorre, B. Standardized Precipitation Evapotranspiration Index (SPEI) Revisited: Parameter Fitting, Evapotranspiration Models, Tools, Datasets and Drought Monitoring. Int. J. Climatol. 2014, 34, 3001–3023. [Google Scholar] [CrossRef] [Green Version]
- Mukherjee, S.; Mishra, A.; Trenberth, K.E. Climate Change and Drought: A Perspective on Drought Indices. Curr. Clim. Chang. Rep. 2018, 4, 145–163. [Google Scholar] [CrossRef]
- Tian, L.; Leasor, Z.T.; Quiring, S.M. Developing a Hybrid Drought Index: Precipitation Evapotranspiration Difference Condition Index. Clim. Risk Manag. 2020, 29, 100238. [Google Scholar] [CrossRef]
- Thilakarathne, M.; Sridhar, V. Characterization of Future Drought Conditions in the Lower Mekong River Basin. Weather Clim. Extrem. 2017, 17, 47–58. [Google Scholar] [CrossRef]
- Zhang, Y.; Hao, Z.; Feng, S.; Zhang, X.; Xu, Y.; Hao, F. Agricultural drought prediction in China based on drought propagation and large-scale drivers. Agricultural Water Management. Agric. Water Manag. 2021, 255, 107028. [Google Scholar] [CrossRef]
- Fang, B.; Kansara, P.; Dandridge, C.; Lakshmi, V. Drought Monitoring Using High Spatial Resolution Soil Moisture Data over Australia in 2015–2019. J. Hydrol. 2021, 594, 125960. [Google Scholar] [CrossRef]
- Morán-Tejeda, E.; Ceglar, A.; Medved-Cvikl, B.; Vicente-Serrano, S.M.; López-Moreno, J.I.; González-Hidalgo, J.C.; Revuelto, J.; Lorenzo-Lacruz, J.; Camarero, J.; Pasho, E. Assessing the Capability of Multi-Scale Drought Datasets to Quantify Drought Severity and to Identify Drought Impacts: An Example in the Ebro Basin. Int. J. Climatol. 2013, 33, 1884–1897. [Google Scholar] [CrossRef] [Green Version]
- Pham, Y.; Reardon-Smith, K.; Mushtaq, S.; Deo, R.C. Feedback Modelling of the Impacts of Drought: A Case Study in Coffee Production Systems in Viet Nam. Clim. Risk Manag. 2020, 30, 100255. [Google Scholar] [CrossRef]
- Gupta, A.; Rico-Medina, A.; Caño-Delgado, A.I. The Physiology of Plant Responses to Drought. Science 2020, 368, 266–269. [Google Scholar] [CrossRef] [PubMed]
- Ilyas, M.; Nisar, M.; Khan, N.; Hazrat, A.; Khan, A.H.; Hayat, K.; Fahad, S.; Khan, A.; Ullah, A. Drought Tolerance Strategies in Plants: A Mechanistic Approach. J. Plant Growth Regul. 2021, 40, 926–944. [Google Scholar] [CrossRef]
- Mitchell, K.E.; Lohmann, D.; Houser, P.R.; Wood, E.F.; Schaake, J.C.; Robock, A.; Cosgrove, B.A.; Sheffield, J.; Duan, Q.; Luo, L.; et al. The Multi-Institution North American Land Data Assimilation System (NLDAS): Utilizing Multiple GCIP Products and Partners in a Continental Distributed Hydrological Modeling System. J. Geophys. Res. Atmos. 2004, 109, D7. [Google Scholar] [CrossRef] [Green Version]
- Nasri, M.; Modarres, R. Hydrologic Drought Change Detection. Nat. Hazards Rev. 2019, 20, 04018022. [Google Scholar] [CrossRef]
- Jiao, W.; Wang, L.; McCabe, M.F. Multi-Sensor Remote Sensing for Drought Characterization: Current Status, Opportunities and a Roadmap for the Future. Remote Sens. Environ. 2021, 256, 112313. [Google Scholar] [CrossRef]
- Dai, M.; Huang, S.; Huang, Q.; Leng, G.; Guo, Y.; Wang, L.; Fang, W.; Li, P.; Zheng, X. Assessing Agricultural Drought Risk and Its Dynamic Evolution Characteristics. Agric. Water Manag. 2020, 231, 106003. [Google Scholar] [CrossRef]
- King, A.D.; Pitman, A.J.; Henley, B.J.; Ukkola, A.M.; Brown, J.R. The Role of Climate Variability in Australian Drought. Nat. Clim. Change 2020, 10, 177–179. [Google Scholar] [CrossRef]
- Wang, Y.; Quan, Q.; Shen, B. Spatio-Temporal Variability of Drought and Effect of Large Scale Climate in the Source Region of Yellow River. Geomat. Nat. Hazards Risk 2019, 10, 678–698. [Google Scholar] [CrossRef]
- Li, S.; Yao, Z.; Wang, R.; Liu, Z. Dryness/Wetness Pattern over the Three-River Headwater Region: Variation Characteristic, Causes, and Drought Risks. Int. J. Climatol. 2020, 40, 3550–3566. [Google Scholar] [CrossRef]
- Wang, Q.; Shi, P.; Lei, T.; Geng, G.; Liu, J.; Mo, X.; Li, X.; Zhou, H.; Wu, J. The Alleviating Trend of Drought in the Huang-Huai-Hai Plain of China Based on the Daily SPEI. Int. J. Climatol. 2015, 35, 3760–3769. [Google Scholar] [CrossRef]
- Ficklin, D.L.; Maxwell, J.T.; Letsinger, S.L.; Gholizadeh, H. A Climatic Deconstruction of Recent Drought Trends in the United States. Environ. Res. Lett. 2015, 10, 044009. [Google Scholar] [CrossRef]
- Spinoni, J.; Naumann, G.; Vogt, J.; Barbosa, P. European Drought Climatologies and Trends Based on a Multi-Indicator Approach. Glob. Planet. Change 2015, 127, 50–57. [Google Scholar] [CrossRef]
- Artlert, K.; Chaleeraktrakoon, C.; Nguyen, V.-T.-V. Modeling and Analysis of Rainfall Processes in the Context of Climate Change for Mekong, Chi, and Mun River Basins (Thailand). J. Hydro-Environ. Res. 2013, 7, 2–17. [Google Scholar] [CrossRef]
- Qaisrani, Z.N.; Nuthammachot, N.; Techato, K. Drought Monitoring Based on Standardized Precipitation Index and Standardized Precipitation Evapotranspiration Index in the Arid Zone of Balochistan Province, Pakistan. Arab. J. Geosci. 2021, 14, 11. [Google Scholar] [CrossRef]
- Kuwayama, Y.; Thompson, A.; Bernknopf, R.; Zaitchik, B.; Vail, P. Estimating the impact of drought on agriculture using the US Drought Monitor. Am. J. Agric. Econ. 2019, 101, 193–210. [Google Scholar] [CrossRef]
- Dar, J.; Dar, A.Q. Spatio-temporal variability of meteorological drought over India with footprints on agricultural production. Environ. Sci. Pollut. Res. 2021, 28, 55796–55809. [Google Scholar] [CrossRef]
- Wang, Y.; Wang, S.; Zhao, W.; Liu, Y. The Increasing Contribution of Potential Evapotranspiration to Severe Droughts in the.Yellow River Basin. J. Hydrol. 2022, 605, 127310. [Google Scholar] [CrossRef]
- Prabnakorn, S.; Maskey, S.; Suryadi, F.; de Fraiture, C. Assessment of Drought Hazard, Exposure, Vulnerability, and Risk for Rice Cultivation in the Mun River Basin in Thailand. Nat. Hazards 2019, 97, 891–911. [Google Scholar] [CrossRef]
- Yadav, S.; Babel, M.S.; Shrestha, S.; Deb, P. Land Use Impact on the Water Quality of Large Tropical River: Mun River Basin, Thailand. Environ. Monit. Assess. 2019, 191, 614. [Google Scholar] [CrossRef] [PubMed]
- Deng, H.; Chen, Y.; Chen, X. Driving factors and changes in components of terrestrial water storage in the endorheic Tibetan Plateau. J. Hydrol. 2022, 612, 128225. [Google Scholar] [CrossRef]
- Deng, H.; Pepin, N.C.; Chen, Y. Changes of snowfall under warming in the Tibetan Plateau. J. Geophys. Res. Atmos. 2017, 122, 7323–7341. [Google Scholar] [CrossRef] [Green Version]
- Thornthwaite, C.W. An Approach toward a Rational Classification of Climate. Geogr. Rev. 1948, 38, 55–94. [Google Scholar] [CrossRef]
- Willmott, C.J.; Rowe, C.M.; Mintz, Y. Climatology of the Terrestrial Seasonal Water Cycle. J. Climatol. 1985, 5, 589–606. [Google Scholar] [CrossRef]
- Pereira, A.R.; Pruitt, W.O. Adaptation of the Thornthwaite Scheme for Estimating Daily Reference Evapotranspiration. Agric. Water Manag. 2004, 66, 251–257. [Google Scholar] [CrossRef]
- Yang, Y.; Luo, Y.; Wu, C.; Zheng, H.; Zhang, L.; Cui, Y.; Sun, N.; Wang, L. Evaluation of Six Equations for Daily Reference Evapotranspiration Estimating Using Public Weather Forecast Message for Different Climate Regions across China. Agric. Water Manag. 2019, 222, 386–399. [Google Scholar] [CrossRef]
- Zhou, S.; Wang, Y.; Li, Z.; Chang, J.; Guo, A.; Zhou, K. Characterizing Spatio-Temporal Patterns of Multi-Scalar Drought Risk in Mainland China. Ecol. Indic. 2021, 131, 108189. [Google Scholar] [CrossRef]
- Li, S.; Yao, Z.; Liu, Z.; Wang, R.; Liu, M.; Adam, J.C. The Spatio-Temporal Characteristics of Drought across Tibet, China: Derived from Meteorological and Agricultural Drought Indexes. Theor. Appl. Climatol. 2019, 137, 2409–2424. [Google Scholar] [CrossRef]
- Lloyd-Hughes, B.; Saunders, M.A. A Drought Climatology for Europe. Int. J. Climatol. J. R. Meteorol. Soc. 2002, 22, 1571–1592. [Google Scholar] [CrossRef]
- Chen, S.; Zhang, L.; Liu, X.; Guo, M.; She, D. The Use of SPEI and TVDI to Assess Temporal-Spatial Variations in Drought Conditions in the Middle and Lower Reaches of the Yangtze River Basin, China. Adv. Meteorol. 2018, 2018, 9362041. [Google Scholar] [CrossRef]
- Huang, N.E.; Shen, Z.; Long, S.R.; Wu, M.C.; Shih, H.H.; Zheng, Q.; Yen, N.-C.; Tung, C.C.; Liu, H.H. The Empirical Mode Decomposition and the Hilbert Spectrum for Nonlinear and Non-Stationary Time Series Analysis. R. Soc. Lond. Ser. A Math. Phys. Eng. Sci. 1998, 454, 903–995. [Google Scholar] [CrossRef]
- Liu, Y.; Feng, J.; Ma, Z. An analysis of historical and future temperature fluctuations over China based on CMIP5 simulations. Adv. Atmos. Sci. 2014, 31, 457–467. [Google Scholar] [CrossRef]
- Qian, C.; Yan, Z.; Wu, Z.; Fu, C.; Tu, K. Trends in temperature extremes in association with weather-intraseasonal fluctuations in eastern.China. Adv. Atmos. Sci. 2011, 28, 297–309. [Google Scholar] [CrossRef]
- Jin, J.; Wang, Q.; Li, L. Long-term oscillation of drought conditions in the western China: An analysis of PDSI on a decadal scale. J. Arid. Land 2016, 8, 819–831. [Google Scholar] [CrossRef] [Green Version]
- Yuan, J.; Xu, Y.; Xiang, J.; Wu, L.; Wang, D. Spatiotemporal Variation of Vegetation Coverage and Its Associated Influence Factor Analysis in the Yangtze River Delta, Eastern China. Environ. Sci. Pollut. Res. 2019, 26, 32866–32879. [Google Scholar] [CrossRef]
- Martinez, M.D.; Serra, C.; Burgueño, A.; Lana, X. Time Trends of Daily Maximum and Minimum Temperatures in Catalonia (Ne Spain) for the Period 1975–2004. Int. J. Climatol. J. R. Meteorol. Soc. 2010, 30, 267–290. [Google Scholar] [CrossRef] [Green Version]
- Zuo, D.; Xu, Z.; Liu, X.; Cheng, L. Spatiotemporal Variation and Abrupt Changes of Potential Evapotranspiration in the Wei River Basin. IAHS-AISH Publ. 2011, 350, 28–37. [Google Scholar]
- Dahal, P.; Shrestha, N.S.; Shrestha, M.L.; Krakauer, N.Y.; Panthi, J.; Pradhanang, S.M.; Jha, A.; Lakhankar, T. Drought Risk Assessment in Central Nepal: Temporal and Spatial Analysis. Nat. Hazards 2016, 80, 1913–1932. [Google Scholar] [CrossRef] [Green Version]
- McGree, S.; Schreider, S.; Kuleshov, Y. Trends and Variability in Droughts in the Pacific Islands and Northeast Australia. J. Clim. 2016, 29, 8377–8397. [Google Scholar] [CrossRef]
- Tong, S.; Lai, Q.; Zhang, J.; Bao, Y.; Lusi, A.; Ma, Q.; Li, X.; Zhang, F. Spatiotemporal Drought Variability on the Mongolian Plateau from 1980–2014 Based on the SPEI-PM, Intensity Analysis and Hurst Exponent. Sci. Total Environ. 2018, 615, 1557–1565. [Google Scholar] [CrossRef] [PubMed]
- Limsakul, A.; Singhruck, P. Long-term trends and variability of total and extreme precipitation in Thailand. Atmos. Res. 2016, 169, 301–317. [Google Scholar] [CrossRef]
- Limjirakan, S.; Limsakul, A. Spatio-temporal changes in total annual rainfall and the annual number of rainy days. In Proceedings of the Conference Handbook, Sydney, Australia, 2–5 October 2007; Volume 29, pp. 1–21. [Google Scholar]
- Mantua, N.J.; Hare, S.R.; Zhang, Y.; Wallace, J.M.; Francis, R.C. A Pacific interdecadal climate oscillation with impacts on salmon production. Bull. Am. Meteorol. Soc. 1997, 78, 1069–1080. [Google Scholar] [CrossRef]
- Takahashi, H.G.; Yasunari, T. Decreasing trend in rainfall over Indochina during the late summer monsoon: Impact of tropical cyclones. J. Meteorol. Soc. Japan. Ser. II 2008, 86, 429–438. [Google Scholar] [CrossRef] [Green Version]
- Zhao, Z.; Liu, G.; Liu, Q.; Huang, C.; Li, H.; Wu, C. Distribution characteristics and seasonal variation of soil nutrients in the Mun River Basin, Thailand. Int. J. Environ. Res. Public Health 2018, 15, 1818. [Google Scholar] [CrossRef] [Green Version]
- Tangang, F.; Santisirisomboon, J.; Juneng, L.; Salimun, E.; Chung, J.; Supari, S.; Cruz, F.; Ngai, S.; Ngo-Duc, T.; Singhruck, P.; et al. Projected future changes in mean precipitation over Thailand based on multi-model regional climate simulations of CORDEX Southeast Asia. Int. J. Climatol. 2019, 39, 5413–5436. [Google Scholar] [CrossRef]
- Khadka, D.; Babel, M.S.; Shrestha, S.; Virdis, S.G.; Collins, M. Multivariate and Multi-Temporal Analysis of Meteorological Drought in the Northeast of Thailand. Weather Clim. Extrem. 2021, 34, 100399. [Google Scholar] [CrossRef]


| Drought Grade | SPEI | Probability (%) |
|---|---|---|
| Extreme drought Severe drought Moderate drought Mild drought No drought | SPEI ≤ −2.0 −2.0 < SPEI ≤ −1.5 −1.5 < SPEI ≤ −1.0 −1.0 < SPEI ≤ −0.5 −0.5 < SPEI ≤ 0.5 | 2.3 4.4 9.2 17.05 17.05 |
| 1971–2016 | 1978–2016 | 1987–2016 | |
|---|---|---|---|
| Mean (mm) Trend (mm decade−1) Trend (% decade−1) | 1826.2 119.7 5.7 | 1872.3 112.6 7.4 | 1932.0 81.3 1.6 |
| Precipitation Amount | Precipitation Days | ETr | |
|---|---|---|---|
| Intensity Frequency | −0.38 ** −0.48 ** | −0.58 ** −0.42 ** | 0.62 ** 0.81 ** |
Publisher’s Note: MDPI stays neutral with regard to jurisdictional claims in published maps and institutional affiliations. |
© 2022 by the authors. Licensee MDPI, Basel, Switzerland. This article is an open access article distributed under the terms and conditions of the Creative Commons Attribution (CC BY) license (https://creativecommons.org/licenses/by/4.0/).
Share and Cite
Li, S.; Pi, H. Deconstruction of Dryness and Wetness Patterns with Drought Condition Assessment over the Mun River Basin, Thailand. Land 2022, 11, 2244. https://doi.org/10.3390/land11122244
Li S, Pi H. Deconstruction of Dryness and Wetness Patterns with Drought Condition Assessment over the Mun River Basin, Thailand. Land. 2022; 11(12):2244. https://doi.org/10.3390/land11122244
Chicago/Turabian StyleLi, Sisi, and Huawei Pi. 2022. "Deconstruction of Dryness and Wetness Patterns with Drought Condition Assessment over the Mun River Basin, Thailand" Land 11, no. 12: 2244. https://doi.org/10.3390/land11122244