Article

Crime under the Light? Examining the Effects of Nighttime Lighting on Crime in China

1
School of Economics, Nanjing Audit University, Nanjing 211815, China
2
School of Economics, Central University of Finance and Economics, Beijing 100081, China
*
Author to whom correspondence should be addressed.
Land 2022, 11(12), 2305; https://doi.org/10.3390/land11122305
Submission received: 15 November 2022 / Revised: 6 December 2022 / Accepted: 12 December 2022 / Published: 15 December 2022

Abstract

:
With Chinese people’s increasing willingness to participate in night activities, local governments have begun regarding the nighttime economy as an important means to stimulate urban vitality and increase social employment. This study uses changes in urban nighttime light brightness as a measure of environmental factors to examine the social effects of nighttime activities. Based on panel data for 227 prefecture-level cities in China from 2000 to 2013, this study empirically investigates the effect and mechanism of nighttime light brightness on the urban crime rate. Empirical results show that (1) a 1% increase in nighttime light brightness increases criminal arrest rate and prosecution rate by 1.474% and 2.371%, respectively; (2) the effects are larger in developed areas with higher levels of lighting and economic development, or in urban areas (compared with rural areas), and (3) the mechanism test shows that such effects are more pronounced in cities with more nighttime business, confirming the existence of a crime opportunity effect.

1. Introduction

The urban function in the post-industrial era began to change from one of traditional production center to that of consumption center, and the “consumption city” was born [1]. With people’s increasing willingness to participate in nightlife, local governments have come to regard the nighttime economy as an important means to stimulate urban vitality and increase employment [2,3]. At present, the nighttime economy, as an important measure to “stimulate a new round of consumption upgrading potential” in China, has been upgraded to a strategic level. In July 2019, Beijing introduced thirteen specific measures aimed at lighting up the “Night Capital City”. In this context, the economic and social effects of the nighttime economy have increasingly attracted academic interest in recent years. In 2002, Chatterton and Hollands first proposed the concept of nighttime economy and elaborated a systematic theory of production, regulation, and consumption of urban nightlife space [4].
However, the nighttime economy is a double-edged sword. The routine activity theory suggests that increased nighttime activity can provide cover or opportunities for potential criminals, thereby increasing the crime rate. Indeed, a more restricted nightlife economy, including earlier closing times, may prevent crime, especially in areas with a high density of alcohol outlets [5]. The nighttime economy helps meet people’s demand for quality and diversity of consumption [6,7,8]. However, the excessive development of the nighttime economy has also brought about a series of problems, such as land use conflicts and labor hiring difficulties [9,10,11]. At the same time, the hedonistic culture fostered by nightlife can also induce crimes such as theft and robbery [12,13,14].
Notably, the higher the nighttime economic vitality of a city, the greater the brightness of its nighttime lighting. Behavioral economists believe that people’s emotions and behaviors are susceptible to environmental influences [15,16]. Levitt pointed out that changing the physical design of public spaces can provide opportunities for crime [17]. Weisburd and Eck confirmed that the social and physical characteristics of urban landscapes might play an important role in criminal activity [18]. Based on the crime pattern theory, Liu et al. found that a nighttime lighting gradient affects the street robbery rate [19].
China is currently shifting from a manufacturing- to a service-dominated economy. Local governments have introduced various policies to develop the nighttime economy, which is highly service-oriented, to promote economic growth.1 In 2020, the National People’s Procuratorates approved 7.71 arrests and 15.73 arrests per 10,000 people, an increase of 10.9% and 77.3%, respectively, compared with 2000. Meanwhile, the number of nationwide arrests and prosecutions by the People’s Prosecutor’s Office are, respectively, 7.71 per 10,000 people and 15.73 per 10,000 people in 2020, with an increase of 10.9% and 77.3%, respectively, compared with 2000.2 Thus, for China, which is also undergoing rapid urbanization, whether prosperous nightlife will increase urban crime rate is an interesting topic.
Literature has primarily discussed why the urban crime rate has experienced a rapid increase in China from the perspectives of population, systems, and policy. These include social and physical environments [20,21], imbalances in education, population mobility, and migration [22,23], income inequality and widening urban–rural income gaps [24], rising unemployment [25], gender ratio imbalance [26], insufficient investment in justice and public safety [27], and cuts in social security and social welfare [28,29]. In terms of policy design, public management scholars have tried to put forward targeted public policies to reduce crime from the perspective of societal law enforcement [30].
However, few studies have investigated the motivation behind criminal behavior in China from the perspective of ecological landscape design. In fact, this paper mainly uses nighttime light as an environmental factor to investigate the influence of night light brightness on crime rate. Based on panel data for 227 prefecture-level cities in China from 2000 to 2013, this study attempts to test the impact of nighttime lighting brightness on urban crime rate.3 Empirical results show that increase in nighttime light brightness has a significantly positive effect on the urban crime rate, implying that people increase crime risk by participating in abundant nighttime activities.
The main contributions of this study are as follows. First, it explores the impact of nighttime light brightness on urban crime rates taking China as an example. This study constructs the instrumental variable of the average change in nighttime light and identifies the causal effect of nighttime light brightness on urban crime by following the structural breakpoint method of Charles et al. [31]. Literature has paid little attention to the environmental factor of nighttime light as a cause of crime. This paper analyzes the data for China, the most populous country in the world, which enriches previous research. Second, this study incorporates big data provided by China’s largest life service information platform, Dianping.com (https://www.dianping.com/ (accessed on 10 June 2021)), to verify the mechanism of the impact of nighttime light brightness on the crime rate. This mechanism validates the ways in which increased economic activity affects crime rates at a macro level, complementing existing evidence on environmental impact crime rates. Finally, this paper evaluates the stability and reliability of nighttime lighting data, providing an important reference for subsequent research [32,33].
The remainder of this paper is structured as follows: Section 2 reviews the relevant literature; Section 3 elaborates on the research design and the empirical methods; in addition, the variables and data are described; Section 4 discusses the estimation results and also presents robustness checks and extensions. Finally, Section 5 presents the conclusions and proposes policy suggestions.

2. Literature Review

The criminal theory employed by this paper builds on three main threads. First, Brantingham and Brantingham investigated the sources of mechanisms of crime hotspots from the perspective of routine activity theory, including places that attract crime (i.e., where crime tends to occur), places that function as crime generators (by attracting many suitable targets), and areas where alcohol outlets are concentrated [34]. For example, within the spatial extent of certain criminogenic places, criminals tend to gather in certain areas (such as bars), but upon reaching a certain distance away from these places, the degree of crime concentration decreases with the expansion of the location. Ratcliffe conducted a case study of violent crime around 1282 bars in Philadelphia and revealed that violence was highly clustered within 25.9 m (85 feet) of bars, then decreased rapidly [35]. Second, in the environmental design theory proposed by Newman, urban spatial environmental factors are closely related to urban crime [36,37]. Various criminology theories and empirical studies have linked the urban environment to crime; in particular, copious studies demonstrate that most criminal cases are related to social environments, physical environments, or composite (i.e., the combination of the above two) edges; edges attract more crimes because they may be sites of increases in potential conflict and decreases in spatial ownership [38]. For example, the concentration of certain land uses has been linked to crime rates; Wo found that mixed land use exerted a deleterious influence on crime. In addition, different land types adjacent or close to each other are consistently related to more crime [39,40]. It can be inferred that in both land-use planning and community environmental planning, the importance of crime prevention through environmental design (CPTED) for urban planning is evident. Third, the crime pattern theory argues that edges—social, physical, or both (the composite edge)—are the key urban features related to individual daily movements and can affect crime [41]. The crime pattern theory is important in that it links urban environments to the distribution of crime [42,43,44]. However, there is no scholarly consensus on the impact of nighttime lighting brightness, an important environmental factor, on the urban crime rate [45,46]. For example, closed-circuit television and street lighting both play an important role in alleviating the fear of crime [47].
Prosperous nightlife has become an important symbol of urban attractiveness and vitality under rapid urbanization [48]. Nightlife in this paper refers to leisure activities that usually occur from 6:00 p.m. to 6:00 a.m. the next day, including shopping, live performances, clubs, dining, cafe culture, art exhibitions, theaters, museums, and other activities. The continuous improvement of lighting facilities is the basic condition for economic development at night. Lovatt and O’Connor suggested that the improvement of modern lighting facilities means that the night becomes “night”—people no longer suspend work because of darkness, that is, people take a more flexible and casual approach to time [49]. The continuous improvement of lighting facilities has brought about changes in people’s perceptions of time, and caused great changes in economic and social life, such as in the public safety of cities. Combining the above three theories suggests that the impact of nighttime light on the urban crime rate may have either a positive opportunity effect or negative cost effect.

2.1. Positive Opportunity Effect: Nighttime Lightness and Increased Criminal Activity

First, rich nighttime activities extend the duration of nighttime [50], which increases the probability of crime. For example, it has long been recognized that the development of nighttime economy expands and commoditizes urban nightlife, while alcohol-based nighttime economy brings about negative social impacts such as noise, violence, and garbage. However, from the perspective of the development of the alcohol industry, the profits brought by excessive or harmful drinking account for 60% of the entire alcohol industry. Local alcohol policies recently implemented in New Zealand from July 2014 to January 2019 did not appear to have reduced crime; it may partly reflect that the policies were ineffective [51]. At the same time, the presence of alcohol and drugs in nightlife areas also encourages various deviant behaviors, including sexual assault, which often occurs in public [52]. Second, when urban planning is improper, activities related to leisure and entertainment may occur in residential areas, bringing about social problems such as urban noise, violence, garbage, and public safety issues. These problems may lead to crime. Conversely, concentrating this activity in specific districts away from residential areas may also be suboptimal, though [53]. For example, the noise exposure produces biological responses and annoyance, stress reactions play a crucial role in the way noise pollution affects violent behavior. The violent crime brought about by noise pollution causes a heavy social burden [54]. Third, the nighttime economy leads more enterprises to participate in upgrading the service industry and consumption, and it is more likely to induce crimes of property infringing [55]. Chaotic urban management and insecurity can exacerbate nocturnal urban crime, especially violence and property crime [56]. Fourth, nightlife involves many legitimate industries, and it is difficult to prevent or identify criminal acts due to their overlap with legitimate activity. For example, some taxi drivers also provide transportation services for prostitutes to find hotels or other venues for transactions after meeting clients in public entertainment venues [23]. Some literature has discussed that the nighttime environment will affect the psychological changes of criminals, which will lead to criminal activities. In fact, environmental stress theory points out that people may feel stressed, frustrated, or provoked by nighttime environmental factors, which increases the possibility of antisocial behavior [57].

2.2. Negative Cost Effect: Nighttime Lighting and Reduced Criminal Activity

First, nighttime lighting can be used as a traditional strategy of deterring criminal activities by increasing criminal cost. Lighting may reduce potential crime participants’ motive for crime by increasing their awareness of the cost of crime, such as by informing them of the presence of witnesses or police in public places, thereby ultimately reducing urban crime rates [58]. Second, nighttime lighting can improve residents’ sense of safety when going out, and reduce criminal activities [59,60]. People experiencing fear of crime or threat to their personal security due to crime prefer to stay in closed and safeguarded places, avoiding spaces such as urban streets, parks, and squares [61]. Steinbach et al. have argued that residents generally believe brightly lit streets are an important reflection of modern governance by street authorities and government, which greatly improve residents’ sense of safety [62]. Third, street lighting can increase the psychological fear of criminals, thereby reducing crime. Additionally, the implementation of bright nighttime lighting in different periods plays a significant role in reducing night crime and road traffic injury [63,64]. Especially during the COVID-19 pandemic, restrictions on the nightlife economy and the cancellation of public events, including earlier closing times, may have some degree of crime prevention effect [65].
In summary, there is no scholarly consensus on the impact of nighttime light brightness on criminal activities. Specifically, the following research gaps remain to be filled. First, few studies have systematically investigated the effect of nighttime light brightness on criminal activities and its potential mechanisms. Second, studies based on developing countries are more limited. Finally, studies focusing on China are mainly based on cross-sectional data [66]. The above gaps provide many novel vantages for this study, which can help enrich the research on the relationship between urban nighttime environment and crime rate.

3. Study Design

3.1. Model and Method

The regression equation employed in this study is as follows:
ln ( c r i m e i t ) = α 0 + α 1 ln ( l i g h t i t ) + α 2 X i t + δ i + τ t + ε i t ,
where i denotes the city, t denotes the year; crime represents city i’s crime rate, expressed by the number of criminal suspects arrested per 10,000 people in the city (arrest, hereinafter referred to as the “arrest rate”) and the number of criminal suspects per 10,000 people who filed lawsuits (sue, hereinafter referred to as “prosecution rate”); l i g h t i t denotes the average value of nighttime light brightness. We divide the total raster light intensity in the area by the resident population (in 10,000 units); δ i is the city fixed effect,   τ t is the time fixed effect, and ε i t is the random error term. To reduce the estimation bias caused by omitted variables, we added a series of control variables ( X i t ), which may affect the crime rate [37]. The first set is demographic characteristics, including sex ratio (sexratio), education level (edu), and population density (upd). The second set of control variables considers proportion of floating population (migrant). The third group represents economic and social characteristics, including GDP growth rate (rgdp), GDP per capita (gdppc), unemployment rate (unemployment), urbanization level (urbanrate), urban–rural income gap (income gap), public financial expenditure (pee), and public security expenditure (police). We also control for natural characteristics, such as precipitation (rainfall) and temperature (temperature). Standard errors are clustered at the city level.

3.2. Endogeneity Problem

The effect of nighttime lighting on crime may exhibit an endogeneity problem (mainly due to reverse causality), which leads to biased estimates of the coefficient of our interest. Although we include various control variables, it is still possible that some unobservable variables that influence crime are omitted in our specifications. To mitigate possible endogeneity bias, we employ the instrumental variable (IV) method.
A valid IV needs to satisfy the correlation and exogeneity assumptions: (1) the IV should have a high correlation with nighttime light brightness; (2) this variable cannot affect the urban crime rate through channels other than nighttime light. Following the method of Charles et al., we first calculate the structural breakpoints of the average changes in nighttime light in each city from 2000 to 2013 and then use the difference in slopes on both sides of the structural breakpoint as the instrumental variable [31]. This is because the economic fundamentals of a city usually do not change drastically in a short period—these include influx of new urban population, surge in per capita income, sudden increase in public financial expenditure, and so on. The short-term structural changes in the average value of nighttime light mainly come from exogenous shocks, such as the increase in streetlights in urban streets [67]. This kind of impact does not affect crime rates through channels other than lights and is highly correlated with nighttime light brightness; thus, it is a suitable IV. The estimation equation for structural breakpoints is as follows:
ln ( l i g h t i t ) = k i + τ i × t + π i × ( t t i * ) { t > t i * } + ξ i t .
In the model, t denotes the specific year, ti* is the initial year of the nighttime light breakpoint in city i, and the coefficient π i reflects the difference in the growth rate of nighttime light before and after the breakpoint, which is the IV in this study. Specifically, for the sample points in each city, we select each year from 2000 to 2013 as ti* to estimate model (2). Then, the corresponding ti* with the best fitting degree of the model is selected as the structural breakpoint of the city, and the corresponding π is used as the IV.
In Figure 1, we select the fitting results of four representative cities to better illustrate the construction process of the IV for each context. The solid line in the figure represents the logarithmic value of the actual nighttime light in the city, and the dashed line is the optimal fitting curve for the nighttime light based on model (2). The structural breakpoint of nighttime light in Beijing appeared in 2003. After the breakpoint, nighttime light fluctuated and decreased, and the corresponding π i value was −0.025. The structural breakpoint of nighttime light in Shanghai appeared in 2007, with the corresponding π i value being −0.029. In Dingxi, the structural breakpoint appeared in 2008, and the corresponding π i value was 0.133. A similar situation occurred in Jinchang, whose structural breakpoint appeared in 2003. After the breakpoint, the nighttime light increased significantly, and the corresponding π i value was 0.058.

3.3. Data

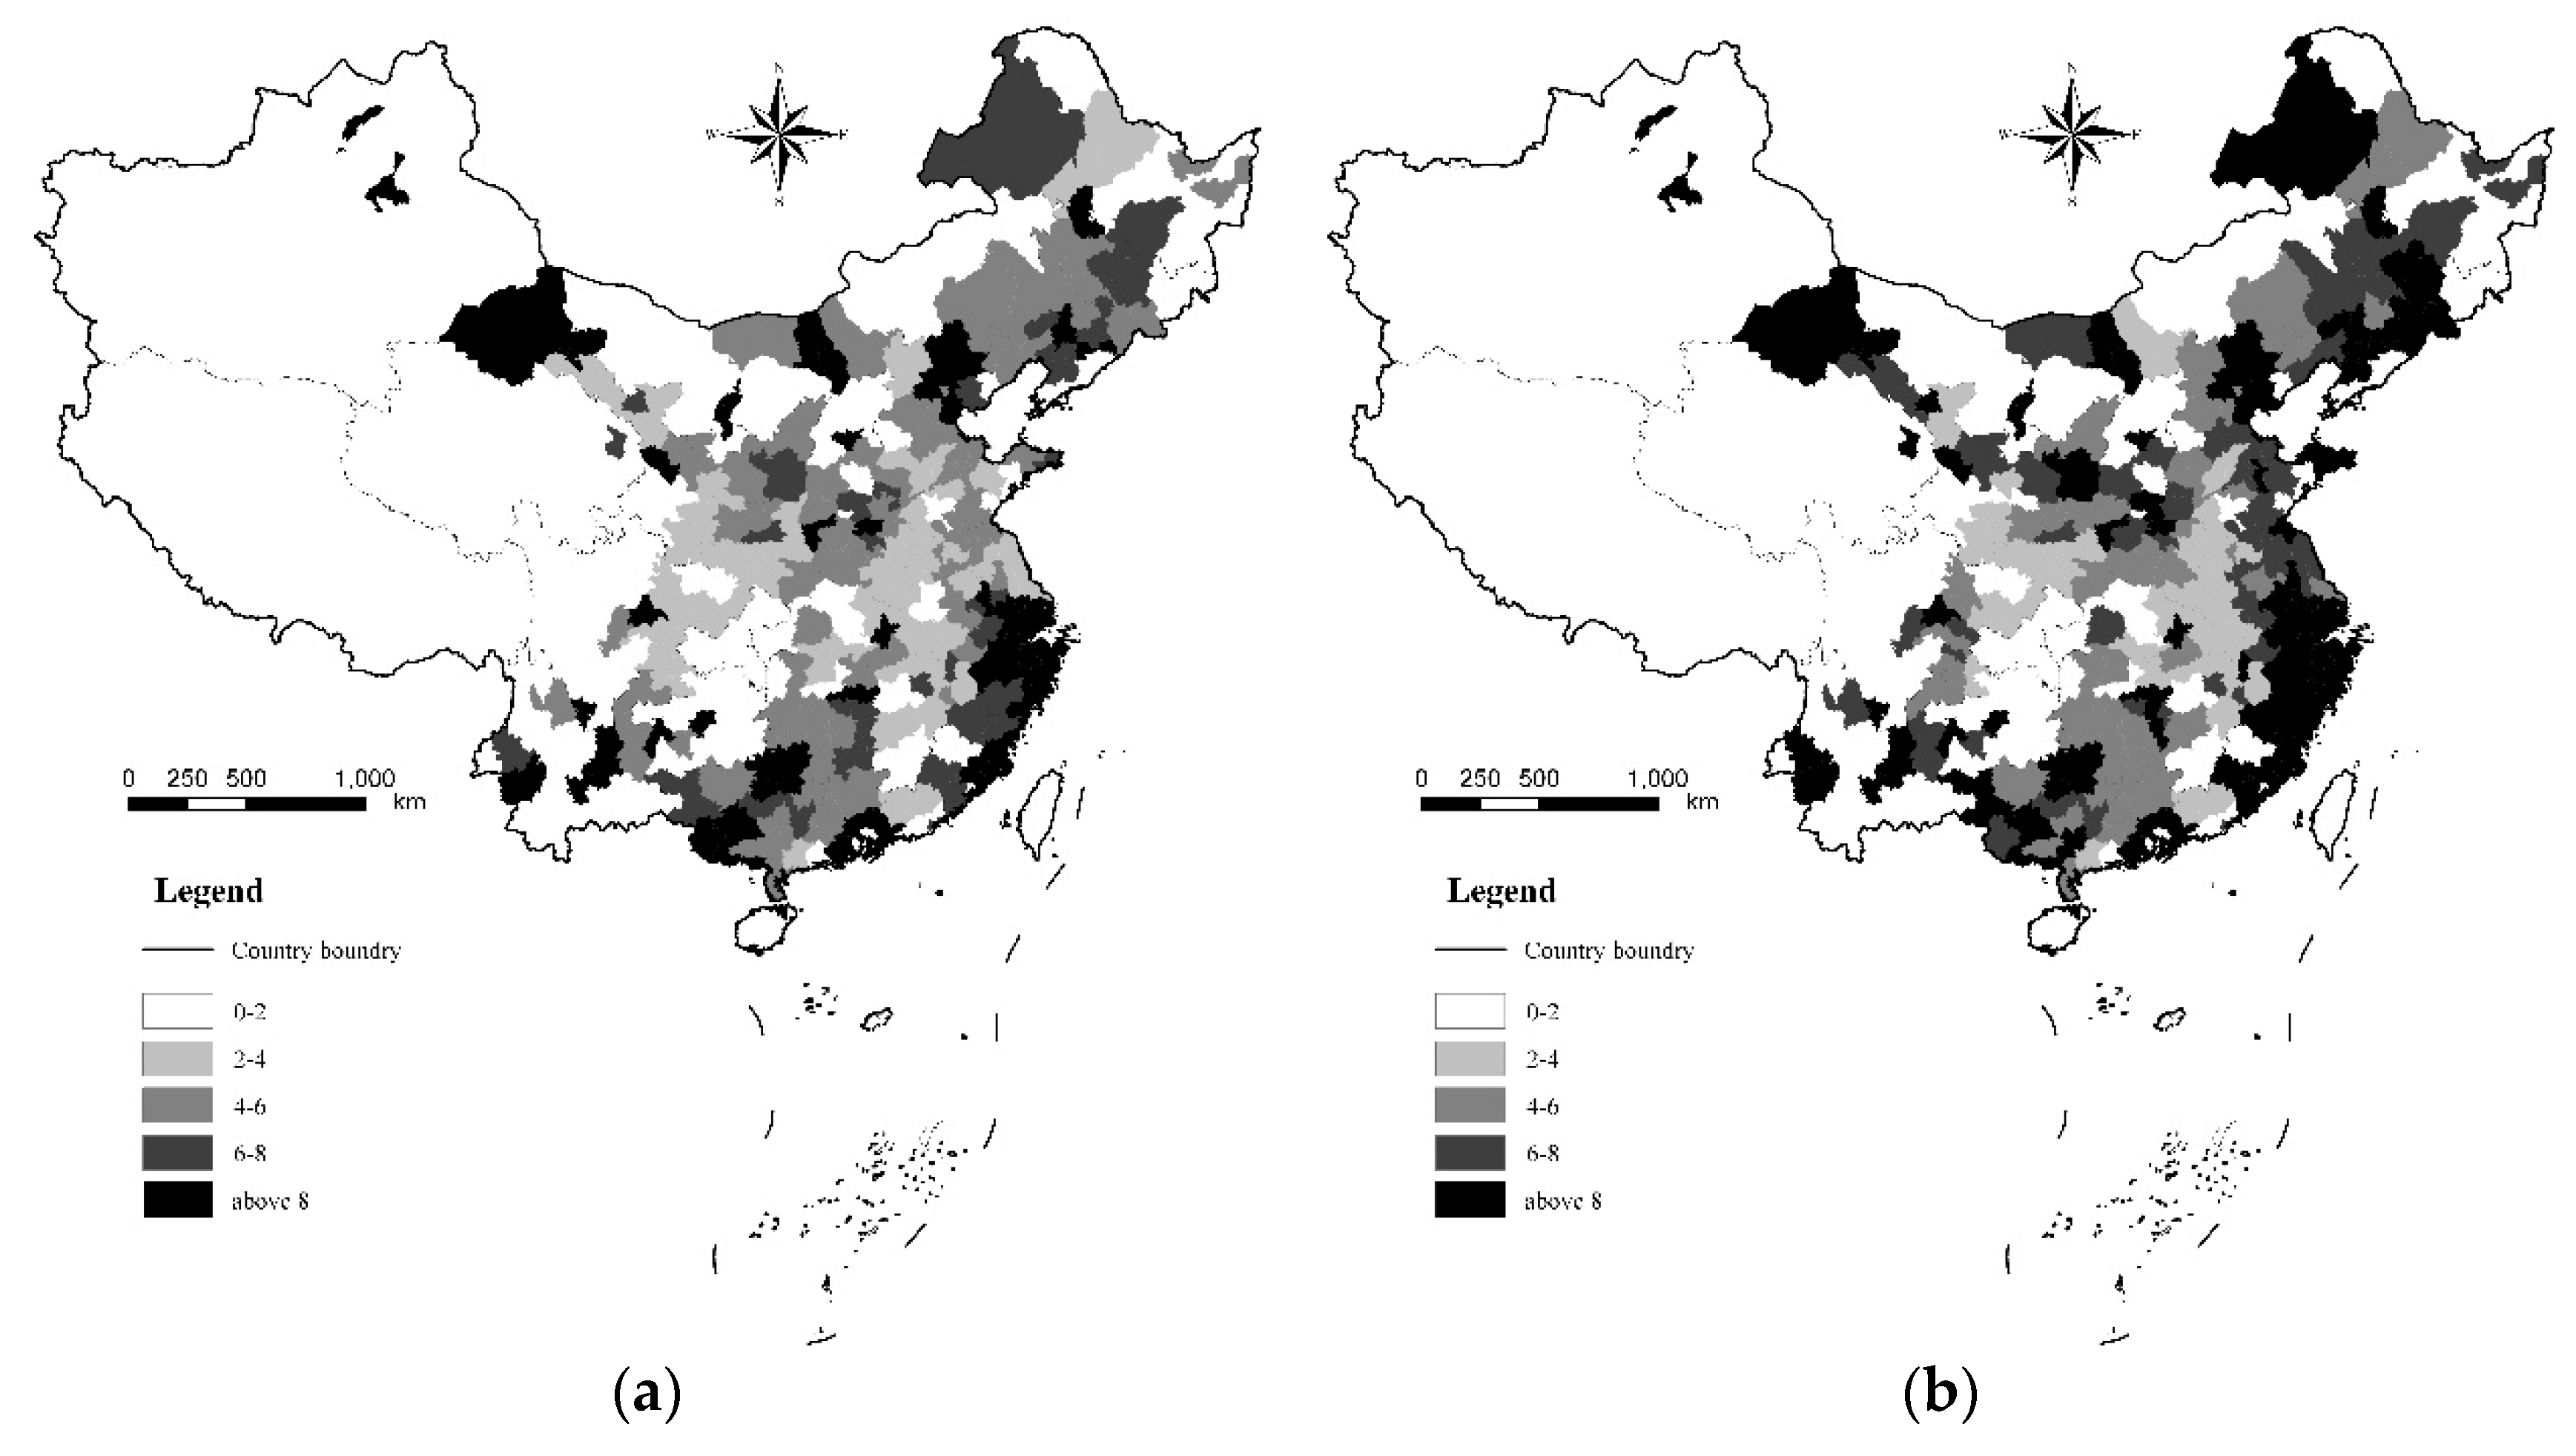
3.3.1. Nighttime Light Data

The nighttime light data are extracted from the U.S. Defense Meteorological Satellite Program (DMSP/OLS) database, which has been widely used in existing research on urban activity, environmental pollution, and disaster assessment [66,68]. The spatial resolution of the nighttime light image data is 1 km × 1 km.
Notably, DMSP/OLS data face the following problems which can lead to a certain bias in the DMSP estimation results 4 [69,70]. First, the 34th period of non-radiometric calibration nighttime light data from 1992 to 2013 was conducted by six sensors, and there are sensor differences in data collection. Second, the data obtained by different sensors in the same year have fluctuations in the digital number (hereinafter, DN) value of the pixel at the same position, and may face saturation of the pixel DN value. Third, different sensors face interference from various factors when acquiring nighttime light images. To solve these problems, we follow the method of Elvidge et al. and correct the extracted nighttime light data for each period in China by using the constant target area correction method [68]. The specific method used is to carry out internal calibration and comprehensive processing of nighttime light data for the same year, to reduce data measurement error [19]. This method not only considers the pixel DN value saturation problem, but also solves the issue of discontinuity between images. After calibration, the light image data has stronger continuity, light brightness accuracy is significantly improved, and the difference in light brightness between cities is reduced.
Figure 2 plots the average nighttime lightness in 2000–2013 and relative change in this period. Geographically, the areas with the highest brightness at night in the eastern coastal areas are mainly concentrated in megacities and large cities, such as Shanghai, Shenzhen, Foshan, and Guangzhou, and for the central and western regions, in the provincial capital cities, such as Zhengzhou, Wuhan, and Taiyuan. These cities show high levels of agglomeration of economic activities, economic development, and economic vitality at night. As for temporal change, cities with the fastest growth in night brightness change were mainly concentrated in the central and western regions in 2000–2013; the top five cities were Longnan, Qingyang, Guyuan, Chizhou, and Yan’an, the significant growth of which occurred from the implementation of the strategy of the “Rise of Central China” since 2004 and the “Development of West Regions” since 2000.

3.3.2. Crime Rate Data

The crime rate data are obtained from the annual statistical yearbooks of cities and the work reports of local prosecutor’s offices. Since the crime data recorded by the public security, procuratorate, and court are highly correlated horizontally and vertically, we choose one of them for analysis [71,72]. The data include information on murder and non-manslaughter, robbery, and theft; rape and arson crimes are not included because of data limitations. As the annual reports of the local procuratorates in China do not publish information on specific criminal events, we cannot conduct a more detailed analysis in this regard. Among these crime types, the most common are assault and robbery, accounting for more than 70% of all crimes.
Figure 3 plots the average crime rate and change in crime rate between 2000 and 2013. From the perspective of spatial distribution, the areas with higher average arrest rate and prosecution rate are mainly concentrated in the eastern coastal areas (refer to Figure 2a,b). Among them, the average arrest rate in the metropolitan areas represented by Shenzhen, Beijing, Shanghai, and Guangzhou is relatively high, which is closely related to the high concentration of population and economic activities as well as developed nighttime economy. Meanwhile, the average arrest rate in some central and western provincial capitals, such as Guiyang and Urumqi, is also relatively high. In terms of the average prosecution rate, which is similar to the spatial distribution of nighttime lights, the areas with high prosecution rate are mainly concentrated in the eastern coastal areas and some provincial capitals in the central and western regions.
From the perspective of time variation characteristics, as a whole, the variation range of arrest rate from 2000 to 2013 is small, and the greatest change is concentrated in some central and western regions. However, the prosecution rate varies greatly. In eastern coastal areas, the prosecution rate is relatively high, which is related to the continuous improvement in urban governance capacity in economically developed areas. Due to the rapid growth in the arrest rate in some central and western regions, the local prosecution rate has also increased accordingly. For instance, the arrest rate increased by 15.87% from 2000 to 2013, and the corresponding prosecution rate by 19.05% in Yueyang of Hunan Province. Notably, in some underdeveloped central and western regions, such as the city of Chizhou, although the arrest rate increased by 319.59% from 2000 to 2013, the prosecution rate increased by only 136.09%. Simultaneously, the arrest rate in Chizhou increased by 40.08%, but the prosecution rate decreased by 5%. There are many similar examples in other cities. The possible reason is that as urban economic vitality improves, so does the urban crime rate. Therefore, the corresponding arrest rate has increased. However, there may be two situations at the prosecution stage: (1) the arrest rate is high, and the base number is large, but the prosecution rate is relatively low in some areas with high levels of economic development; (2) the filing rate of cases is high, but the prosecution rate is low due to the difficulty of subjective malignant identification and insufficient funds in some places [73]. In the subsequent heterogeneity econometric regression, we indeed draw a similar conclusion to the one outlined here (refer to “Lighting effects”, etc., below).

3.3.3. Data on Other Control Variables

The control variables are mainly collected from the China City Statistical Yearbook and other provincial and city-level statistical yearbooks in China. Table 1 reports descriptive statistics of variables used in our analysis.

4. Estimation Results

4.1. Main Results

4.1.1. Benchmark OLS Regression Results

The estimated coefficient of ln(light) shown in Table 2 is positive and statistically significant at the 5% level, suggesting that nighttime light brightness is positively related to the crime rate (Models 1 and 2). This empirical result is inconsistent with most existing research results [67]. An endogeneity issue may account for the current results. As mentioned above, the brightness of nighttime light represents the degree of nighttime economic prosperity. On the one hand, the brighter the nighttime lights, the richer the nighttime activities and the more complex the participants, which makes it easy to trigger criminal activities such as theft, robbery, and rape [74]. On the other hand, the nighttime environment can also make people feel stressed, depressed, or provoked, which increases the possibility of antisocial behavior [57].

4.1.2. SLS Estimation Results

As mentioned in the Data section above, the estimated results may be subject to endogeneity bias. To address this problem, we use the structural breakpoints as instruments for nighttime light. As shown in Table 2, the 2SLS estimates in the table suggest that nighttime light increase arrest and prosecution rates by 1.474% and 2.371%, respectively (Models 3 and 4). Further, after controlling for other factors, the IV has a significant positive correlation with nighttime light in the regression results of the first stage. At the same time, the F value was 20.78, indicating that there was no weak instrumental variable problem. However, the estimated coefficients increased significantly in the second-stage regression results, indicating the presence of an endogeneity problem.
Three potential sources can bias OLS estimates downward. The first is omitted variables: there may be unobservable variables affecting urban crime; for example, the improvement of road development planning or increase in urban public service facilities, streetlights, and cameras. Second is attenuation bias caused by measurement error of the urban nighttime light index. Third, the 2SLS estimate is a LATE (local average treatment effect), that is, the IV only reflects the average change in nighttime lighting trends in two periods—from before to after the breakpoint—and cannot capture detailed changes in nighttime lighting within the two periods, which may also lead to overestimated results.

4.1.3. Difference-in-Differences (DID) Regression Results

We also use structural breakpoints to construct a DID equation to test the robustness of our findings. The specific model specification is as follows:
ln ( c r i m e i t ) = β 0 + β 1 ( π i × P o s t i t ) + β 2 X i t + δ i + τ t + ε i t .
Postit is a dummy variable for whether the t period of the observation value is after the breakpoint period t* period, that is, it represents the double-difference term, which is used to measure the impact of nighttime lighting changes. Next, πi reflects the strength of the shock. The coefficient β1 reflects the exogenous impact of structural changes in nighttime lighting on crime rates.
Table 2 shows that the estimated coefficient of the interaction term (did_break) is positive at the 1% statistical significance level (Models 5 and 6). It is concluded that there is a significantly positive relationship between nighttime light and crime rate. Not surprisingly, the new estimates are generally consistent with the 2SLS, which confirms the robustness of the test results.

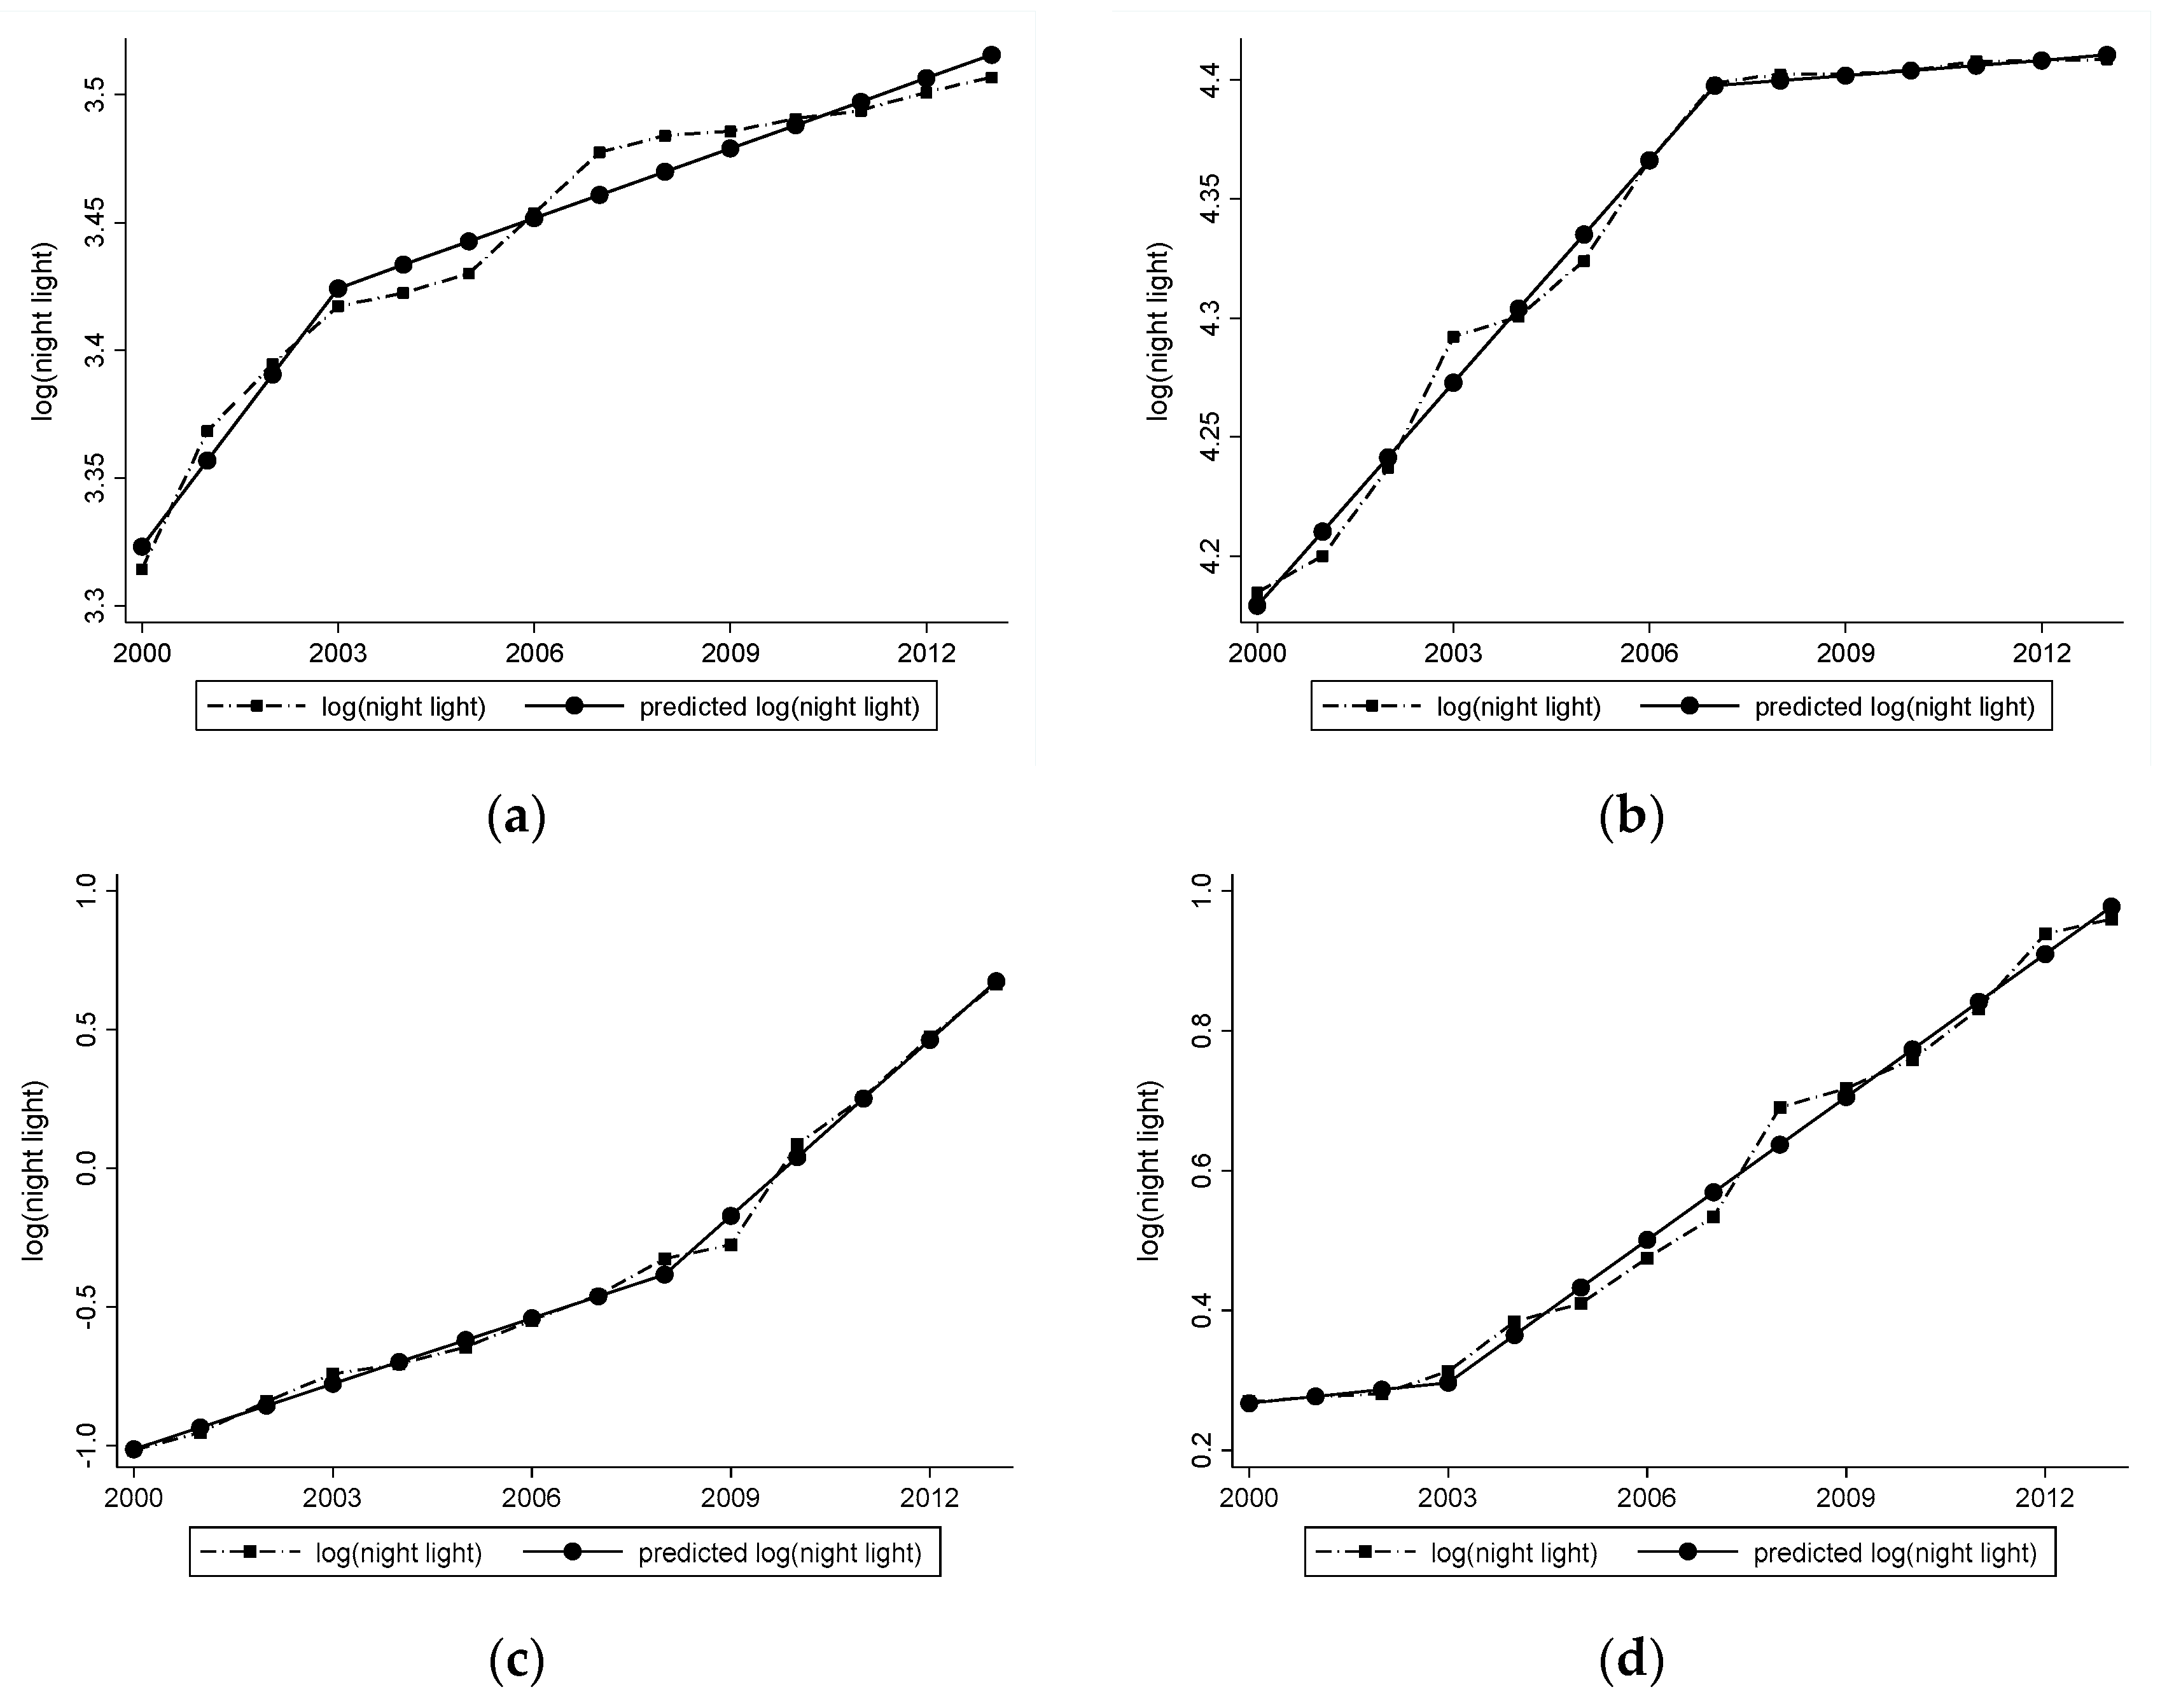
4.2. Exogenous Testing of Structural Breakpoints

We use two methods to test the validity of our identification strategies. First, we examine the correlations between structural breakpoints and changes in urban nighttime light and other major economic fundamental characteristics during 2000 and 2013, as a placebo test. The regression results in Table 3 show that after controlling for the fixed effects of city and year, the economic characteristics of other cities did not change significantly before the breakpoint. This shows that the calculated breakpoint of the nighttime lighting structure is independent of other economic fundamentals and can better satisfy the exclusivity condition.
The other method is the parallel trend test. Specifically, we replace Postit in Equation (3) with a set of time dummy variables that characterize each city relative to the starting year of breakpoint and judge whether parallel trends are satisfied based on the significance of the coefficient of its interaction term with the interaction term breakpoint strength. The model is as follows:
ln ( c r i m e i t ) = β 0 + n = 6 , 1 6 β 1 n · ( π i × T i m e i t n ) + β 2 X i t + δ i + τ t + ε i t
where Time is a dummy variable with the observation time point t relative to the start year of the city breakpoint n. For example, if the breakpoint of the city i occurs in 2010, then the Timeit2 observation for this city in 2008 takes the value 1, and the Timeitn (n ≠ −2) takes the value 0. To avoid estimation bias caused by the small number of samples when n takes the extreme value, we merge the samples over 6 years before and after the breakpoint in the empirical estimation. The coefficient β1n in Equation (4) reflects the difference in the effect of nighttime light on the treatment group and the control group in different time dimensions, and its magnitude and significance can be used to test the parallel trend hypothesis. Figure 4 visually shows the results of the parallel trend test. It can be seen that before the breakpoint occurs, the crime rates of the treatment and the control groups are not significantly different in trend, which satisfies the parallel trend hypothesis and confirms the exogenous nature of the structural breakpoint. After the breakpoint, we find that the crime rate of the treatment group increases significantly relative to the control group, which further verifies the effect of nighttime lighting changes on the crime rate.

4.3. Heterogeneous Analysis

4.3.1. Brightness of Light

First, we examine whether the effect of nighttime light brightness on urban crime rates varies across different light brightness levels. We divided cities equally into two groups based on their average nighttime light brightness, and set Bright cities = 1 for cities whose nighttime light brightness is larger than average and 0 for other cities. Table 4 reports the regression results. We mainly focused on the cross-term coefficient between nighttime light and brighter cities. The coefficient of ln(light) × Bright cities is positive and significant at the 1% statistical level. The 2SLS estimation results show that compared to cities with lower nighttime lights, a 1% increase in nighttime light brightness in cities with brighter nighttime lights will increase urban crime rate by 0.513%–0.69% (Models 3 and 4). A possible reason is that the brighter the light in the city, the more abundant people’s night activities and the more complex the structure of participants in night activities; this is more likely to lead to an increase in nighttime criminal activities. The conclusions are consistent with the benchmark model in Table 2.

4.3.2. Lighting Effects in the Different Levels of Crime Rate

We examine the heterogenous effects of nighttime light brightness on crime rate in cities with different crime rate levels. Specifically, we divide the samples into two groups based on the median urban crime rate from 2000 to 2013. Table 5 reports the regression results. Overall, nighttime light had a positive effect on the urban crime rate, which is consistent with the benchmark regression results. In addition, we mainly focus on the cross-term coefficient between nighttime light and cities with higher crime rates. The coefficients of ln(light) × High-crime cities are positive but not significant. This shows that there is no difference in the impact of nighttime light brightness on the crime rate between cities with different crime rates. Environmental factors will not be constrained by the existing level of crime in the city.

4.3.3. Lighting Effects in Different Levels of Economic Development

As the level of economic development reflects the ability of urban governance, we examine the effect of nighttime light brightness on urban crime rates across different levels of economic development, which is measured by GDP per capita. Table 6 shows that urban nighttime light has a significant positive effect on the urban crime rate and that this effect is more pronounced in economically developed cities. The heterogenous effect is significant for the prosecution rate.
A possible reason for these findings is that cities with higher economic development levels are also attractive for the migrant population, in terms of per capita income, education level, medical resources, and social welfare. Population mobility brings not only vitality to urban development but also a series of social problems. Migrants cannot enjoy the same welfare as registered residents and cannot integrate in terms of survival opportunities, social capital, or cultural adaptation. As a result, urban migrants are prone to illness, unemployment, and poverty, even as the income gap widens between them and urban residents, leading to a strong sense of exclusion, injustice, and frustration. Under the dual effects of these environmental and psychological factors, nocturnal activities make it easier to foster criminal activity [75,76]. As shown in Figure 2, the reason the prosecution rate is not significant may be that the arrest rate is higher in some areas, with relatively high economic development levels. At the same time, many cases have high filing rates and low prosecution rates due to the difficulty of subjective malignant identification and insufficient handling of funds in some places [73].

4.3.4. Lighting Effects in Urban and Rural Areas

Areas economically active at night are often the ones where economic activities and population are relatively concentrated. There may be regional differences in crime rates due to differences in nighttime activities and social security where residents are located. Therefore, we distinguish between urban area and county area for estimation. Table 7 reports the regression results. Overall, the effect of nighttime light on urban crime rates only exists in urban areas.
One explanation may be that compared with the counties, the urban nighttime economy is more developed, people’s nighttime activities are more abundant, population mobility is greater, and it is easier to gather a large amount of property, which can lead to pickpocketing, fraud, robbery, and other cases [77]. From the perspective of cost-benefit, more benefits can be obtained by committing crimes in urban areas. Additionally, some underground passages, elevators, small streets, and alleys in the city are prone to criminal activities such as theft and rape.

4.4. Mechanism Analysis

As explained in Section 2, the nighttime light brightness has two potential effects on urban crime: positive opportunity effect and negative cost effect. Previous analysis confirms that nighttime light significantly increases urban crime rates, suggesting that the opportunity effect outweighs the cost effect. We test the chance effect in this part. The logic we test is that if there are more nighttime businesses, nighttime light would intensify people’s nighttime outings, which in turn would intensify crime. To measure the number of nighttime businesses, we count the average closing time of various stores provided by China’s most popular life service information platform, Dianping.com (https://www.dianping.com/ (accessed on10 June 2021)); then, we calculate the proportion of shops closed after 20:00, 22:00, and 24:00, which reflects the quantity of nighttime activities in each city.
Dianping.com was established in Shanghai in 2003, and is the earliest online platform in China dedicated to providing food service information. Dianping.com and Meituan announced their merger on 8 October 2015, becoming the largest company in the industry; its user scale also makes its data highly representative. Due to limitations in the availability of earlier data, we used data from 2015 to calculate the above indicators. Although the data are older than the research period of this study, considering the path dependence of urban business culture and the representativeness of the data in 2015, such processing is also reasonable. According to the statistics, shops closing between 20:00 and 22:00 mainly include gourmet restaurants, beauty salons, shopping malls, and fitness centers; shops closing between 22:00 and 24:00 mainly include pedicure shops, party halls, and cinemas, and shops closing after 24:00 mainly include those providing services related to bathing and steaming, KTV, bars, billiard halls, and hotels.
Next, we specify the following model:
ln ( c r i m e i t ) = γ 0 + γ 1 ln ( l i g h t i t ) × s h a r e i + γ 2 X i t + δ i + τ t + ε i t ,
where sharei represents the proportion of active nighttime shops in city i, and other variables are identical to Equation (1). Table 8 reports the estimation results. Here, we mainly focus on the coefficient of the cross term (ln(light) × share) between nighttime light and nighttime activities at different periods. As shown in the table, the coefficients of ln(light) × share are generally positive in all models. There are also some interesting findings that need to be discussed. First, Panel A reports the estimated results of the model. In the model of OLS, the coefficient of ln(light) × share 20:00 is positive, and the arrest rate and prosecution rate are significant at the 1% and 10% levels, respectively. The 2SLS estimation results are significant at the 5% level, the same as the DID estimation results. This means that the more people are active at night, the greater the positive effect of nighttime light on the urban crime rate. Second, after 22:00, the results in Panel B are consistent with those in Panel A. Finally, in Panel C, the estimated results are significantly larger. For every 1% increase in nighttime light brightness, the arrest rate increases from 1.72% to 4.6% (Model 1), while the prosecution rate increases from 1.5% to 6.108% (Model 2), and all these findings are statistically significant at the 1% level.
Table 8 shows that people increase crime risk by participating in abundant nighttime activities. Theoretically, a prosperous nighttime economy accompanies urban evolution, representing the fusion of urban space and nighttime life. As the leisure time of most people, nightlife creates an inclusive, free, and relaxing social space, but also causes negative social effects and increases the urban crime rate due to the diversity of nightlife, the complicated profile of the participants, and the extensiveness of nightlife [78].
Unfortunately, it is difficult for us to verify the reasons behind nighttime light brightness affecting individual crime from the perspective of criminal behavior due to the lack of micro data on individual crimes. Nevertheless, we can understand the impact of nighttime light brightness on crime rates in different periods from the different level of nighttime economic activity. This in itself constitutes an important mechanism.

4.5. Discussion

The nighttime economy is a growing part of the economy of many countries. Scholars have conducted extensive discussions on the social impact of the nighttime economy and have gradually recognized the dangers that nightlife brings to social stability [79]. However, few studies have directly discussed the impact of nighttime light brightness on urban crime rates and the mechanisms of this effect.
This study measures the impact of the increase in nighttime light brightness on the urban crime rate through a rigorous empirical design, which can support the comprehensive assessment of the impact of nighttime light brightness changes on the economic and social environment; it also provides quantitative information to help local governments optimize lighting design at the environmental level and adjust policy accordingly. This study verifies the differential impact of nighttime light brightness on urban crime rates from different perspectives, providing strong support to better balance the relationship between the economic and social benefits of the nighttime economy and its social costs. The mechanism analysis shows that people’s nighttime activities across different periods of the night are one of the main reasons for the differences in nighttime crime rates.
Our paper has some limitations. Firstly, due to the limits in the availability of data, it is difficult to verify all the mechanisms of the positive opportunity effect mentioned above. Secondly, this study used crime record data of the three major criminal judicial organs of China’s Public Prosecutor Law on the basis of prefecture-level cities as the proxy variable to construct the crime rate index; this is reasonable to a certain extent, but more accurate results require more micro crime data, which remains a direction for future research. Moreover, the impact of specific night scenes on the crime rate can be used in scenarios/case studies to extend and verify the research in this paper; this is another direction for future research. For example, some studies have found that street cameras, especially in inner-city areas, can effectively reduce planned crime, that is, pickpocketing and robbery, thereby reducing anti-crime spending [80]. In addition, closed-circuit television (CCTV) surveillance cameras can effectively reduce crime in residential areas, such as property crime and vehicle crime [81]. With the development of big data technology, further research can be conducted to examine the causal relationship and mechanism of the influence of nighttime light intensity on crime rate from the perspective of inner-city block level and environmental design based on micro crime data.

5. Conclusions

Nighttime light brightness not only reflects nighttime economic activity, but also represents the characteristics of the urban environment. A healthy and well-developed nighttime economy plays an important role in enhancing economic development and enriching residents’ lives. Therefore, reducing the crime rate is not only an economic problem, but also a social one. This study empirically examined the effect and mechanism of nighttime light brightness on urban crime using panel data for 227 prefecture-level cities in China from 2000 to 2013. We found that an increase in nighttime light brightness has a significantly positive effect on the urban crime rate. A 1% increase in nighttime light brightness increases criminal arrest rate and prosecution rate by 1.474% and 2.371%, respectively. Next, we employed the instrumental variable method to ensure that our results do not suffer from an endogeneity issue. The mechanism analysis suggests that people increase crime risk by participating in abundant night activities at different nighttime hours, which confirms the rationality of the existence of this path. It is worth reiterating that we investigated the impact of the night environment on the crime rate at the (prefecture-level) city level.

Author Contributions

Conceptualization, Methodology, W.S.; Writing—original draft preparation, X.Z. and C.P.; Writing—review & editing, C.P. and W.S. All authors have read and agreed to the published version of the manuscript.

Funding

Chong Peng acknowledges funding support from the National Science Foundation of China (No. 72074116), Weizeng Sun acknowledges funding support from the National Science Foundation of China (No.71903210, 72274228).

Data Availability Statement

Not applicable.

Conflicts of Interest

The authors declare that they have no known competing financial interest or personal relationships that could have appeared to influence the work reported in this paper.

References

  1. Glaeser, E.L.; Kolko, J.; Saiz, A. Consumer city. J. Econ. Geogr. 2001, 1, 27–50. [Google Scholar] [CrossRef]
  2. Brabazon, T.; Mallinder, S. Into the night-time economy: Work, leisure, urbanity and the creative industries. Nebula 2007, 4, 161–178. [Google Scholar]
  3. Rowe, D.; Lynch, R. Work and play in the city: Some reflections on the night-time leisure economy of Sydney. Ann. Leis. Res. 2012, 15, 132–147. [Google Scholar] [CrossRef]
  4. Chatterton, P.; Hollands, R. Theorising urban playscapes: Producing, regulating and consuming youthful nightlife city spaces. Urban Stud. 2002, 39, 95–116. [Google Scholar] [CrossRef]
  5. Ejrnæs, A.; Scherg, R.H. Nightlife activity and crime: The impact of COVID-19 related nightlife restrictions on violent crime. J. Crim. Justice 2022, 79, 101884. [Google Scholar] [CrossRef] [PubMed]
  6. Lee, S. Ability sorting and consumer city. J. Urban Econ. 2010, 68, 20–33. [Google Scholar] [CrossRef]
  7. Lee, J.G.; Fisher, D. The influence of scope, frames, and extreme willingness to pay responses on cost of crime estimates. Am. J. Crim. Justice 2020, 45, 236–272. [Google Scholar] [CrossRef]
  8. Philpot, R.; Liebst, L.S.; Møller, K.K.; Lindegaard, M.R.; Levine, M. Capturing violence in the night-time economy: A review of established and emerging methodologies. Aggress. Violent Behav. 2019, 46, 56–65. [Google Scholar] [CrossRef] [Green Version]
  9. Lindsay, J. Young Australians and the staging of intoxication and self-control. J. Youth Stud. 2009, 12, 371–384. [Google Scholar] [CrossRef]
  10. McArthur, J.; Robin, E.; Smeds, E. Socio-spatial and temporal dimensions of transport equity for London’s night time economy. Transp. Res. A Pol. 2019, 121, 433–443. [Google Scholar] [CrossRef] [Green Version]
  11. Tiesdell, S.; Slater, A.M. Calling time: Managing activities in space and time in the evening/night-time economy. Plan. Theory Pract. 2006, 7, 137–157. [Google Scholar] [CrossRef]
  12. Hunt, P.E.; Saunders, J.; Kilmer, B. Estimates of law enforcement costs by crime type for benefit-cost analyses. J. Benefit Cost Anal. 2019, 10, 95–123. [Google Scholar] [CrossRef] [Green Version]
  13. Perkins, C.; Steinbach, R.; Tompson, L.; Green, J.; Edwards, P. What is the effect of reduced street lighting on crime and road traffic injuries at night? A mixed-methods study. Public Health Res. 2015, 3, 1–108. [Google Scholar] [CrossRef] [PubMed] [Green Version]
  14. Soares, R.R.; Naritomi, J. Understanding High Crime Rates in Latin America: The Role of Social and Policy Factors; University of Chicago Press: Chicago, IL, USA, 2010; pp. 19–55. [Google Scholar]
  15. Kemperman, A.; Timmermans, H. Environmental correlates of active travel behavior of children. Environ. Behav. 2014, 46, 583–608. [Google Scholar] [CrossRef]
  16. Kormos, C.; Gifford, R.; Brown, E. The influence of descriptive social norm information on sustainable transportation behavior: A field experiment. Environ. Behav. 2015, 47, 479–501. [Google Scholar] [CrossRef]
  17. Levitt, A. Measuring positive externalities from unobservable victim precaution: An empirical analysis of Lojack. Q. J. Econ. 1998, 113, 43–77. [Google Scholar]
  18. Weisburd, D.; Eck, J.E. What can police do to reduce crime, disorder, and fear? Ann. Am. Acad. Polit. Soc. Sci. 2015, 593, 42–65. [Google Scholar] [CrossRef]
  19. Liu, L.; Zhou, H.; Lan, M.; Wang, Z. Linking Luojia 1-01 nightlight imagery to urban crime. Appl. Geogr. 2020, 125, 102267. [Google Scholar] [CrossRef]
  20. Bernasco, W.; Block, R. Robberies in Chicago: A block-level analysis of the influence of crime generators, crime attractors, and offender anchor points. J. Res. Crime Delinq. 2011, 48, 33–57. [Google Scholar] [CrossRef] [Green Version]
  21. Zhou, H.; Liu, L.; Lan, M.; Yang, B.; Wang, Z. Assessing the impact of nightlight gradients on street robbery and burglary in Cincinnati of Ohio state, USA. Remote Sens. 2019, 11, 1958. [Google Scholar] [CrossRef] [Green Version]
  22. Heller, S.B.; Shah, A.K.; Guryan, J.; Ludwig, J.; Mullainathan, S.; Pollack, H.A. Thinking, fast and slow? Some field experiments to reduce crime and dropout in Chicago. Q. J. Econ. 2017, 132, 1–54. [Google Scholar] [CrossRef] [PubMed] [Green Version]
  23. Lee, D.S.; Mccrary, J. The deterrence effect of prison: Dynamic theory and evidence. Adv. Economet. 2017, 38, 73–146. [Google Scholar]
  24. Enamorado, T.; López-Calva, L.F.; Rodríguez-Castelán, C.; Winkler, H. Income inequality and violent crime: Evidence from Mexico’s drug war. J. Dev. Econ. 2016, 120, 128–143. [Google Scholar] [CrossRef]
  25. Nordin, M.; Almén, D. Long-term unemployment and violent crime. Empir. Econ. 2017, 52, 1–29. [Google Scholar] [CrossRef]
  26. Fajnzylber, P.; Lederman, D.; Loayza, N. What causes violent crime? Eur. Econ. Rev. 2004, 46, 1323–1357. [Google Scholar] [CrossRef] [Green Version]
  27. Lofstrom, M.; Raphael, S. Incarceration and crime: Evidence from California’s public safety realignment reform. Cesifo Dice Rep. 2015, 12, 196–220. [Google Scholar] [CrossRef]
  28. Costantini, M.; Meco, I.; Paradiso, A. Do inequality, unemployment and deterrence affect crime over the long run? Reg. Stud. 2018, 52, 558–571. [Google Scholar] [CrossRef] [Green Version]
  29. Kang, S. Inequality and crime revisited: Effects of local inequality and economic segregation on crime. J. Popul. Econ. 2016, 29, 593–626. [Google Scholar] [CrossRef]
  30. Morgan, R. Crime Control and Community: The New Politics of Public Safety; Oxford University Press: Oxford, UK, 2004. [Google Scholar]
  31. Charles, K.K.; Hurst, E.; Notowidigdo, M.J. Housing booms and busts, labor market opportunities, and college attendance. Am. Econ. Rev. 2018, 108, 2947–2994. [Google Scholar] [CrossRef] [Green Version]
  32. Henderson, J.V.; Storeygard, A.; Weil, D.N. Measuring economic growth from outer space. Am. Econ. Rev. 2012, 102, 994–1028. [Google Scholar] [CrossRef] [Green Version]
  33. Roland, H.; Raschky, P.A. Regional favoritism. Q. J. Econ. 2014, 129, 995–1033. [Google Scholar]
  34. Brantingham, P.; Brantingham, P. Criminality of place. Eur. J. Crim. Policy Rev. 1995, 3, 5–26. [Google Scholar] [CrossRef]
  35. Ratcliffe, J.H. The spatial extent of criminogenic places: A changepoint regression of violence around bars. Geogr. Anal. 2012, 44, 302–320. [Google Scholar] [CrossRef]
  36. Newman, O. Defensible Space: Crime Prevention through Urban Design; Macmillan: New York, NY, USA, 1972. [Google Scholar]
  37. Bonner, H.; Stacey, M. The effectiveness of increased lighting on crime reduction and calls for service in a single jurisdiction. Crime Prev. Community Saf. 2021, 23, 39–55. [Google Scholar] [CrossRef]
  38. Song, J.; Spicer, V.; Brantingham, P. The edge effect: Exploring high crime zones near residential neighborhoods. In Proceedings of the 2013 IEEE International Conference on Intelligence and Security Informatics, Seattle, WA, USA, 4–7 June 2013; pp. 245–250. [Google Scholar]
  39. Wo, J.C. Mixed land use and neighborhood crime. Soc. Sci. Res. 2019, 78, 170–186. [Google Scholar] [CrossRef]
  40. Wo, J.C.; Kim, Y.A. Neighborhood effects on crime in San Francisco: An examination of residential, nonresidential, and “mixed” land uses. Deviant Behav. 2022, 43, 61–78. [Google Scholar] [CrossRef]
  41. Liu, J.; Deng, Y.; Wang, Y.; Huang, H.; Du, Q.; Ren, F. Urban nighttime leisure space mapping with nighttime light images and POI data. Remote Sens. 2020, 12, 541. [Google Scholar] [CrossRef] [Green Version]
  42. Brantingham, P.; Brantingham, P. Crime pattern theory. In Environmental Criminology and Crime Analysis; Willan: London, UK, 2013; pp. 100–116. [Google Scholar]
  43. Groff, E.R.; Taylor, R.B.; Elesh, D.B.; McGovern, J.; Johnson, L. Permeability across a metropolitan area: Conceptualizing and operationalizing a macrolevel crime pattern theory. Environ. Plan. A 2014, 46, 129–152. [Google Scholar] [CrossRef] [Green Version]
  44. Summers, L.; Johnson, S.D. Does the configuration of the street network influence where outdoor serious violence takes place? Using space syntax to test crime pattern theory. J. Quant. Criminol. 2017, 33, 397–420. [Google Scholar] [CrossRef] [Green Version]
  45. Welsh, B.C.; Farrington, D.P. Effects of improved street lighting on crime. Campbell Syst. Rev. 2008, 4, 1–51. [Google Scholar] [CrossRef]
  46. Haleem, M.S.; Do Lee, W.; Ellison, M.; Bannister, J. The ‘exposed’ population, violent crime in public space and the night-time economy in Manchester, UK. Eur. J. Crim. Policy Res. 2021, 27, 335–352. [Google Scholar] [CrossRef]
  47. Lee, J.; Park, S.; Jung, S. Effect of crime prevention through environmental design (CPTED) measures on active living and fear of crime. Sustainability 2016, 8, 872. [Google Scholar] [CrossRef] [Green Version]
  48. Pinke-Sziva, I.; Smith, M.; Olt, G.; Berezvai, Z. Overtourism and the night-time economy: A case study of Budapest. Int. J. Tour. Cities 2019, 5, 1–16. [Google Scholar] [CrossRef]
  49. Lovatt, A.; O’Connor, J. Cities and the night-time economy. Plan. Pract. Res. 1995, 10, 127–134. [Google Scholar] [CrossRef]
  50. Seijas, A.; Gelders, M.M. Governing the night-time city: The rise of night mayors as a new form of urban governance after dark. Urban Stud. 2021, 58, 316–334. [Google Scholar] [CrossRef]
  51. Tyler-Harwood, L.; Menclova, A.K. Local Alcohol Policies in New Zealand: An overview of their implementation and effects on crime. Policy Q. 2021, 17, 73–79. [Google Scholar] [CrossRef]
  52. Bulovec, T.; Eman, K. Nightlife entertainment spots in cities as a potential criminogenic focus of sexual harassment. J. Crim. Just. Secur. 2020, 3, 255–285. [Google Scholar]
  53. Brands, J.; Schwanen, T.; Van Aalst, I. Fear of crime and affective ambiguities in the night-time economy. Urban Stud. 2015, 52, 439–455. [Google Scholar] [CrossRef] [Green Version]
  54. Hener, T. Noise pollution and violent crime. J. Public Econ. 2022, 215, 104748. [Google Scholar] [CrossRef]
  55. Van Liempt, I. Safe nightlife collaborations: Multiple actors, conflicting interests and different power distributions. Urban Stud. 2015, 52, 486–500. [Google Scholar] [CrossRef]
  56. Camacho Doyle, M.; Gerell, M.; Andershed, H. Perceived unsafety and fear of crime: The role of violent and property crime, neighborhood characteristics, and prior perceived unsafety and fear of crime. Deviant Behav. 2021, 53, 1347–1365. [Google Scholar] [CrossRef]
  57. Huisman, W.; Van Erp, J. Opportunities for environmental crime. a test of situational crime prevention theory. Br. J. Criminol. 2013, 53, 1178–1200. [Google Scholar] [CrossRef]
  58. Dillbeck, M.C.; Cavanaugh, K.L. Societal violence and collective consciousness: Reduction of U.S. homicide and urban violent crime rates. SAGE Open 2016, 6, 2–6. [Google Scholar] [CrossRef] [Green Version]
  59. Chalfin, A.; Kaplan, J.; LaForest, M. Street Light Outages, Public Safety and Crime Displacement: Evidence from Chicago; Working Paper; University of Pennsylvania: Philadelphia, PA, USA, 2020. [Google Scholar]
  60. Kaplan, J.; Chalfin, A. Ambient lighting, use of outdoor spaces and perceptions of public safety: Evidence from a survey experiment. Secur. J. 2021, 2, 1–31. [Google Scholar]
  61. Tandogan, O.; Ilhan, B.S. Fear of crime in public spaces: From the view of women living in cities. Procedia Eng. 2016, 161, 2011–2018. [Google Scholar] [CrossRef] [Green Version]
  62. Steinbach, R.; Perkins, C.; Tompson, L.; Johnson, S.; Armstrong, B.; Green, J.; Edwards, P. The effect of reduced street lighting on road casualties and crime in England and Wales: Controlled interrupted time series analysis. J. Epidemiol. Community Health 2015, 69, 1118–1124. [Google Scholar] [CrossRef]
  63. Singh, M.B.; Paliwal, V. An exploratory study of the selected psychological factors among criminals. Psychology 2015, 4, 128–129. [Google Scholar]
  64. Belloni, A.; Mit, V.C.; Hansen, C. Inference on treatment effects after selection among high-dimensional controls. Rev. Econ. Stud. 2014, 81, 608–650. [Google Scholar] [CrossRef]
  65. Ashby, M.P. Initial evidence on the relationship between the coronavirus pandemic and crime in the United States. Crime Sci. 2020, 9, 6. [Google Scholar] [CrossRef]
  66. Klomp, J. Economic development and natural disasters: A satellite data analysis. Glob. Environ. Chang. 2016, 36, 67–88. [Google Scholar] [CrossRef]
  67. Chalfin, A.; Hansen, B.; Lerner, J.; Parker, L. Reducing crime through environmental design: Evidence from a randomized experiment of street lighting in New York City. J. Quant. Criminol. 2022, 38, 127–157. [Google Scholar] [CrossRef]
  68. Elvidge, C.D.; Ziskin, D.; Baugh, K.E.; Tuttle, B.T.; Ghosh, T.; Pack, D.W.; Zhizhin, M. A fifteen-year record of global natural gas flaring derived from satellite data. Energies 2009, 2, 595–622. [Google Scholar] [CrossRef]
  69. Abrahams, A.; Oram, C.; Lozano-Gracia, N. Deblurring DMSP nighttime lights: A new method using Gaussian filters and frequencies of illumination. Remote Sens. Environ. 2018, 210, 242–258. [Google Scholar] [CrossRef]
  70. Gibson, J.K.; Boe-Gibson, G. Three Facts about Night Lights Data; University of Waikato: Hamilton, New Zealand, 2020. [Google Scholar]
  71. Levin, N.; Zhang, Q. A global analysis of factors controlling VIIRS nighttime light levels from densely populated areas. Remote Sens. Environ. 2017, 190, 366–382. [Google Scholar] [CrossRef] [Green Version]
  72. Li, W.; Zhang, K. Does air pollution affect crime rates: Estimation based on breakpoint regression method. World Econ. 2021, 44, 151–177. [Google Scholar]
  73. Cai, Z. An empirical analysis on conviction and measurement of penalty in traffic accident crimes—Based on 139 traffic accident crimes in east China. Present Day Law Sci. 2015, 2, 108–115. [Google Scholar]
  74. Anitha, S.; Jordan, A.; Jameson, J.; Davy, Z. A balancing act: Agency and constraints in university students’ understanding of and responses to sexual violence in the night-time economy. Violence Against Woman 2021, 27, 2043–2065. [Google Scholar] [CrossRef]
  75. Anatol, M.; Kangalee, Q.M. Crime in Trinidad and Tobago: The possible impacts of increased crime due to migration from Venezuela. Migr. Dev. 2021, 10, 260–272. [Google Scholar] [CrossRef]
  76. Fontana, I. Migration Crisis, Organised crime and domestic politics in Italy: Unfolding the interplay. South Eur. Soc. Polit. 2020, 1, 49–74. [Google Scholar] [CrossRef]
  77. Barberet, R.; Fisher, B.S. Can security beget insecurity? Security and crime prevention awareness and fear of burglary among university students in the East Midlands. Secur. J. 2009, 22, 3–23. [Google Scholar] [CrossRef]
  78. Tomsen, S.; Payne, J. Homicide and the night-time economy. Trends Issues Crime Cri. 2016, 521, 1–15. [Google Scholar]
  79. Hobbs, D.; Winlow, S.; Hadfield, P.; Lister, S. Violent hypocrisy: Governance and the night-time economy. Eur. J. Criminol. 2005, 2, 161–183. [Google Scholar] [CrossRef]
  80. Priks, M. The effects of surveillance cameras on crime: Evidence from the Stockholm subway. Econ. J. 2015, 125, F289–F305. [Google Scholar] [CrossRef]
  81. Piza, E.L.; Welsh, B.C.; Farrington, D.P.; Thomas, A.L. CCTV surveillance for crime prevention: A 40-year systematic review with meta-analysis. Criminol. Public Policy 2019, 18, 135–159. [Google Scholar] [CrossRef]
Figure 1. Estimating city-level structural breaks in nighttime light. (a) Beijing; (b) Shanghai; (c) Dingxi; (d) Jinchang.
Land 11 02305 g001
Figure 2. Nighttime lighting in Chinese cities (2000–2013). (a) Average nighttime light; (b) Annual change in nighttime light.
Land 11 02305 g002
Figure 3. The crime rate of Chinese cities (2000–2013). (a) Average arrest rate; (b) Average prosecution rate; (c) Annual change in arrest rate; (d) Annual change in prosecution rate.
Land 11 02305 g003aLand 11 02305 g003b
Figure 4. Parallel trend test.
Land 11 02305 g004
Table 1. Definitions of variables and statistics.
VariableDefinitionMeanStd devMinMax
arrestapproval rate7.377.700118.73
suepublic prosecution rate8.878.180114.33
urbanrateurbanization rate0.390.190.071.00
updpopulation density (person/km2)423.08371.884.7011,564
peeper capita public financial expenditure (RMB)3076.104014.1414.2759,371.4
edunumber of college students per 10,000 people125.15185.810.5921261.05
income gapthe ratio of urban to rural per capita income2.721.200.3452.67
gdppcGDP per capita35,057.1930,594.311226467,749
policeproportion of expenditure on public security0.060.010.030.11
sexratiosex ratio1.183.480.12107.62
migrantproportion of floating population0.080.11−0.130.89
rgdpGDP growth rate12.784.34−39.8108.8
unemploymenturban registered unemployment rate62.3255.131.091154.37
rainfallaverage annual precipitation (mm)28.2821.560.00118.18
temperaturetemperature (Fahrenheit)57.959.9013.0491.93
Table 2. Regression results for the effect of nighttime light on urban crime rate.
VariableOLS2SLSDID
Model 1Model 2Model 3Model 4Model 5Model 6
ln(arrest)ln(sue)ln(arrest)ln(sue)ln(arrest)ln(sue)
ln(light)0.195 **0.234 **1.474 ***2.371 **
(0.098)(0.099)(0.494)(0.971)
did_break 0.387 ***0.572 ***
(0.141)(0.165)
ln(urbanrate)0.017−0.017−0.520 ***−0.836 **0.0310.000
(0.043)(0.043)(0.182)(0.356)(0.041)(0.038)
ln(upd)0.0200.001−1.514 ***−2.431 **0.0200.002
(0.030)(0.038)(0.509)(0.998)(0.030)(0.038)
ln(pee)−0.017−0.020−0.271−0.658−0.009−0.016
(0.029)(0.040)(0.201)(0.418)(0.028)(0.037)
ln(edu)−0.0040.0380.047 *0.069−0.0010.041
(0.023)(0.027)(0.027)(0.047)(0.023)(0.026)
ln(incomegap)−0.0420.0560.161−0.050−0.0510.046
(0.065)(0.071)(0.101)171)(0.064)(0.071)
ln(gdppc)0.029−0.026−0.397 **−0.605 **0.039−0.014
(0.048)(0.050)(0.157)(0.301)(0.048)(0.048)
ln(police)−0.085−0.257 **−0.516−1.332 *−0.069−0.238 *
(0.102)(0.121)(0.372)(0.741)(0.104)(0.121)
ln(sexratio)1.051 **0.2128.042 ***10.744 **1.081 **0.252
(0.525)(0.599)(2.566)(4.918)(0.521)(0.588)
ln(migrant)0.051 **0.0350.108 *−0.0100.048 **0.030
(0.023)(0.025)(0.062)(0.112)(0.023)(0.025)
ln(rgdp)−0.127 ***−0.112 ***−0.130 *−0.107−0.118 ***−0.10 ***
(0.031)(0.035)(0.075)(0.121)(0.030)(0.034)
ln(unemployment)0.0340.0020.311 ***0.491 **0.0320.002
(0.025)(0.025)(0.108)(0.214)(0.025)(0.025)
ln(rainfall)−0.007−0.0130.203 **0.350 **−0.004−0.008
(0.014)(0.016)(0.087)(0.159)(0.014)(0.016)
ln(temperature)0.211 *0.1141.136 ***1.477 **0.205 *0.111
(0.107)(0.085)(0.343)(0.655)(0.105)(0.085)
Constants0.0070.6925.569 **9.793 **0.2060.939
(0.773)(0.888)(2.192)(4.253)(0.792)(0.897)
City fixed effectsyesyesyesyesyesyes
Year fixed effectsyesyesyesyesyesyes
N244824212448242124482421
R20.8810.858--0.8810.859
First-stage results
IV 0.481 ***
(0.151)
Kleibergen–Paap F statistic 20.78
Notes: Robust standard errors clustered at the city level are reported in parentheses. * p < 0.10, ** p < 0.05, *** p < 0.01.
Table 3. Placebo tests.
VariableModel 1Model 2Model 3Model 4Model 5
ln(urbanrate)ln(upd)ln(pee)ln(edu)ln(incomegap)
did_break0.0230.0020.0230.042−0.001
(0.021)(0.008)(0.024)(0.031)(0.011)
City fixed effectsyesyesyesyesyes
Year fixed effectsyesyesyesyesyes
N36713781377936383750
R20.8300.9790.9450.9350.732
Model 6Model 7Model 8Model 9Model 10
ln(gdppc)ln(police)ln(sexratio)ln(migrant)ln(rgdp)
did_break0.020−0.0020.0030.0450.012
(0.019)(0.006)(0.002)(0.036)(0.022)
City fixed effectsyesyesyesyesyes
Year fixed effectsyesyesyesyesyes
N38223836353538043688
R20.9310.8880.8960.8710.369
Model 11Model 12Model 13
ln(unemployment)ln(rainfall)ln(temperature)
did0.0290.025−0.002
(0.033)(0.037)(0.005)
City fixed effectsyesyesyes
Year fixed effectsyesyesyes
N377737233836
R20.7570.8010.833
Notes: (1) Robust standard errors clustered at the city level are reported in parentheses. (2) All control variables are the same as Table 2.
Table 4. Regression results based on light brightness.
VariableOLS2SLSDID
Model 1Model 2Model 3Model 4Model 5Model 6
ln(arrest)ln(sue)ln(arrest)ln(sue)ln(arrest)ln(sue)
ln(light)0.189 **0.225 **0.445 **1.019 ***−0.0020.054
(0.092)(0.093)(0.225)(0.309)(0.027)(0.034)
ln(light) × Bright cities0.461 ***0.530 ***0.513 ***0.690 ***0.093 ***0.074 **
(0.104)(0.113)(0.116)(0.145)(0.034)(0.037)
Control variablesyesyesyesyesyesyes
City fixed effectsyesyesyesyesyesyes
Year fixed effectsyesyesyesyesyesyes
N244824212448242124482421
R20.8840.862--0.8810.859
Notes: (1) Robust standard errors clustered at the city level are reported in parentheses. (2) All control variables are the same as Table 2. (3) ** p < 0.05, *** p < 0.01.
Table 5. Regression results based on crime rate levels.
VariableOLS2SLSDID
Model 1Model 2Model 3Model 4Model 5Model 6
ln(arrest)ln(sue)ln(arrest)ln(sue)ln(arrest)ln(sue)
ln(light)0.186 *0.265 **0.818 ***1.596 ***0.047 *0.109 ***
(0.097)(0.107)(0.301)(0.435)(0.027)(0.033)
ln(light) × High-crime cities0.021−0.0690.0900.0100.013−0.019
(0.083)(0.095)(0.103)(0.137)(0.032)(0.037)
Control variablesyesyesyesyesyesyes
City fixed effectsyesyesyesyesyesyes
Year fixed effectsyesyesyesyesyesyes
N244824212448242124482421
R20.8810.858--0.8810.859
Notes: (1) Robust standard errors clustered at the city level are reported in parentheses. (2) All control variables are the same as Table 2. (3) * p < 0.10, ** p < 0.05, *** p < 0.01.
Table 6. Regression results based on the economic development level.
VariableOLS2SLSDID
Model 1Model 2Model 3Model 4Model 5Model 6
ln(arrest)ln(sue)ln(arrest)ln(sue)ln(arrest)ln(sue)
ln(light)0.162 *0.232 **0.670 **1.496 ***0.0210.123 ***
(0.094)(0.099)(0.269)(0.405)(0.026)(0.035)
ln(light) × Developed cities0.227 **0.0090.352 ***0.1920.057 *−0.041
(0.093)(0.108)(0.099)(0.133)(0.031)(0.037)
Control variablesyesyesyesyesyesyes
City fixed effectsyesyesyesyesyesyes
Year fixed effectsyesyesyesyesyesyes
N244824212448242124482421
R20.8810.858--0.8810.859
Notes: (1) Robust standard errors clustered at the city level are reported in parentheses. (2) All control variables are the same with Table 2. (3) * p < 0.10, ** p < 0.05, *** p < 0.01.
Table 7. Regression results based on urban and county areas.
VariableOLS2SLSDID
Model 1Model 2Model 3Model 4Model 5Model 6
ln(arrest)ln(sue)ln(arrest)ln(sue)ln(arrest)ln(sue)
ln(urban_light)0.089 **0.095 *0.748−0.4060.033 **0.020
(0.044)(0.051)(0.847)(1.035)(0.016)(0.019)
ln(rural_light)0.0440.047−0.6231.365−0.0270.011
(0.032)(0.037)(1.533)(1.977)(0.017)(0.019)
Control variablesyesyesyesyesyesyes
City fixed effectsyesyesyesyesyesyes
Year fixed effectsyesyesyesyesyesyes
N244824212448242124482421
R20.8570.837--0.8810.859
Notes: (1) Robust standard errors clustered at the city level are reported in parentheses. (2) All control variables are the same as Table 2. (3) * p < 0.10, ** p < 0.05.
Table 8. Analysis of mechanism.
VariableOLS2SLSDID
Model 1Model 2Model 3Model 4Model 5Model 6
ln(arrest)ln(sue)ln(arrest)ln(sue)ln(arrest)ln(sue)
Panel A
ln(light)−1.101 **−0.899−0.187−0.317−1.235−2.137
(0.452)(0.610)(0.199)(0.259)(0.987)(1.428)
ln(light) × share 20:001.720 ***1.500 *0.513 **0.732 **2.760 *4.791 **
(0.595)(0.812)(0.257)(0.338)(1.439)(2.095)
Panel B
ln(light)−1.085 **−1.395 *−0.017−0.462−1.280−3.588 **
(0.540)(0.716)(0.236)(0.301)(1.129)(1.596)
ln(light) × share 22:001.592 **2.025 **0.805 ***0.675 *2.642 *6.243 ***
(0.666)(0.891)(0.287)(0.369)(1.549)(2.228)
Panel C
ln(light)−4.281 **−5.660 **−1.2960.384−6.862−3.660
(2.113)(2.824)(0.938)(1.103)(4.513)(5.428)
ln(light) × share 24:004.620 **6.108 **1.410 *1.312 ***8.005 **5.114 *
(2.220)(2.955)(0.777)(0.511)(3.801)(2.764)
Notes: (1) Robust standard errors clustered at the city level are reported in parentheses. (2) All control variables as well as city and year fixed effects are the same as Table 2. (3) * p < 0.10, ** p < 0.05, *** p < 0.01.
Publisher’s Note: MDPI stays neutral with regard to jurisdictional claims in published maps and institutional affiliations.

Notes

1
According to the 2021 China Statistical Yearbook, the share of the tertiary sector in China’s GDP increased from 39.8% in 2000 to 54.5% in 2020.
2
Data source: calculated by the author based on the China Statistical Yearbook.
3
Prefecture-level cities are one of the administrative divisions of China, which are prefecture-level administrative regions under the jurisdiction of provinces and autonomous regions.
4
The season, date, and time of the images may affect the results. For example, if the images are captured in winter seasons, the impact of tree canopy on the light would vary between northern and southern cities. Additionally, the timing of the images may or may not coincide with the hours of nighttime business.

