1. Introduction
As the interaction zone between sea and land or islands and their surroundings, the marine–terrestrial interface (shore zone) provides a fundamental physical environment for sustainability and biodiversity, particularly in conditions of global warming and sea-level rise [
1,
2]. Detailed mapping of coastal morphology and sedimentation is necessary to understand these areas [
3]. As a primary reference for coastal applications, identifying the type of shore zone can assist in evaluating the effects of environmental hazards and provide crucial baseline information on habitat conditions for human activities. Meanwhile, coastal areas are often areas of resource and population concentration as some of the most economically prosperous sites of frequent human activity, in the world. There are many ways to obtain shoreline data. Traditionally, shoreline data acquisition has relied mainly on manual acquisition using GNSS, which is an accurate but low-efficiency method. Unmanned aerial vehicle remote sensing, such as photogrammetry or light detection and ranging (LiDAR), can efficiently capture the spectral and topographic information of coastal areas [
4]. However, these approaches have some limitations in terms of accessibility.
With the development of satellite technology, an increased number of satellite sensor images has made it easier to obtain data for large coastal areas [
5,
6]. Multispectral/hyperspectral satellites and synthetic aperture radar (SAR) satellites have been widely used to acquire observation information of Earth, over large areas [
7]. Multispectral imagery can obtain rich spectral information and indices, which is essential for extracting water, land, and vegetation information [
8]. However, accurate surface elevation cannot be derived from the data and the images are susceptible to clouds or tall features. Although SAR may exhibit the advantage of wider coverage and provide continuous elevation information in some areas, other characteristics, such as low spatial resolution and a single band, may limit its application [
9]. The Ice, Cloud, and Land Elevation Satellite-2 (ICESat-2) carries the Advanced Topographic Laser Altimeter System (ATLAS), which is a spaceborne photon-counting LiDAR. Benefiting from sensitive detectors, ATLAS can obtain detailed and accurate surface elevation data [
10,
11]. Slope and sediment are the main indicators for determining shore zone types, which require detailed spectral and accurate elevation information. In this paper, we use Sentinel-2 multispectral imagery and ICESat-2 LiDAR data.
Recently, machine learning algorithms emerged as more accurate and efficient alternatives to conventional parametric algorithms when faced with large dimensional and complex data spaces, and they have been used for mapping large areas [
12]. However, some machine learning algorithms, such as neural networks, decision trees, and support vector machines, tend to over-fit and require that many parameters are adjusted before they are used [
12,
13,
14]. The new ensemble learning algorithm obtains a strong classifier with a greater generalization ability than a single learner by combining multiple weak learners, which is a good solution to the problem. Bagging and boosting are two common ensemble learning methods [
15,
16,
17]. Bagging methods have no dependencies between learners and can be generated simultaneously. A typical algorithm is a random forest algorithm, based on decision trees. Random forest algorithms solve the bottleneck problem in decision trees and they have a good tolerance for noise and outliers, as well as good scalability for high-dimensional data classification problems. Additionally, random forests can estimate the variable importance by analyzing the increase in prediction error caused by sequence changes because the prediction error is related to the variable importance [
15,
18,
19].
Based on the studies mentioned above, conducting coastal classification using a random forest classifier and features extracted from Sentinel-2 and ICESat-2 data, seems to be a good solution. However, the following issues need to be considered. First, coastal regions are environmentally and dynamically complex. They change rapidly and are subject to tidal, wind, and wave activity over long periods [
2]. Even spectral data from the same area can vary significantly depending on the acquisition time, directly affecting further processing. Google Earth Engine was used to synthesize time-series Sentinel-2 images to reduce the data and smooth out the tidal effects [
20]. Second, appropriate features are necessary for accurate classification. Several attempts have been made to find appropriate features for information extraction using remote sensing data [
19,
21,
22,
23]. Rodriguez– Galiano et al. [
19] used multiseasonal Landsat-5 multispectral data and random forest algorithms for land cover classification. Feng et al. [
24] reported that texture features can improve the accuracy of urban vegetation mapping. Specifically, overall accuracy increased by 9.6% after including texture features, indicating that texture plays a significant role in improving classification accuracy. Xie et al. [
23] employed the ICESat-2 satellite data to extract statistical indicators related to substrate and sediment classification. They successfully exploited the potential of ICESat-2 data in coastal zone classification. Nijland et al. [
22] conducted a similar study using airborne LiDAR data on Calvert Island, Canada. Specifically, Nijland et al. [
22] investigated how rich shore morphological metrics can be derived from airborne LiDAR and evaluated the application of LiDAR to coastal area classification. However, the above studies have some limitations, especially in shore zone areas where features are often characterized by multiple aspects, such as sedimentation type and coastal morphology, which require that multiple data sources are well-represented [
3]. Therefore, an integrated approach to coastal zone classification, using heterogeneous data, is essential.
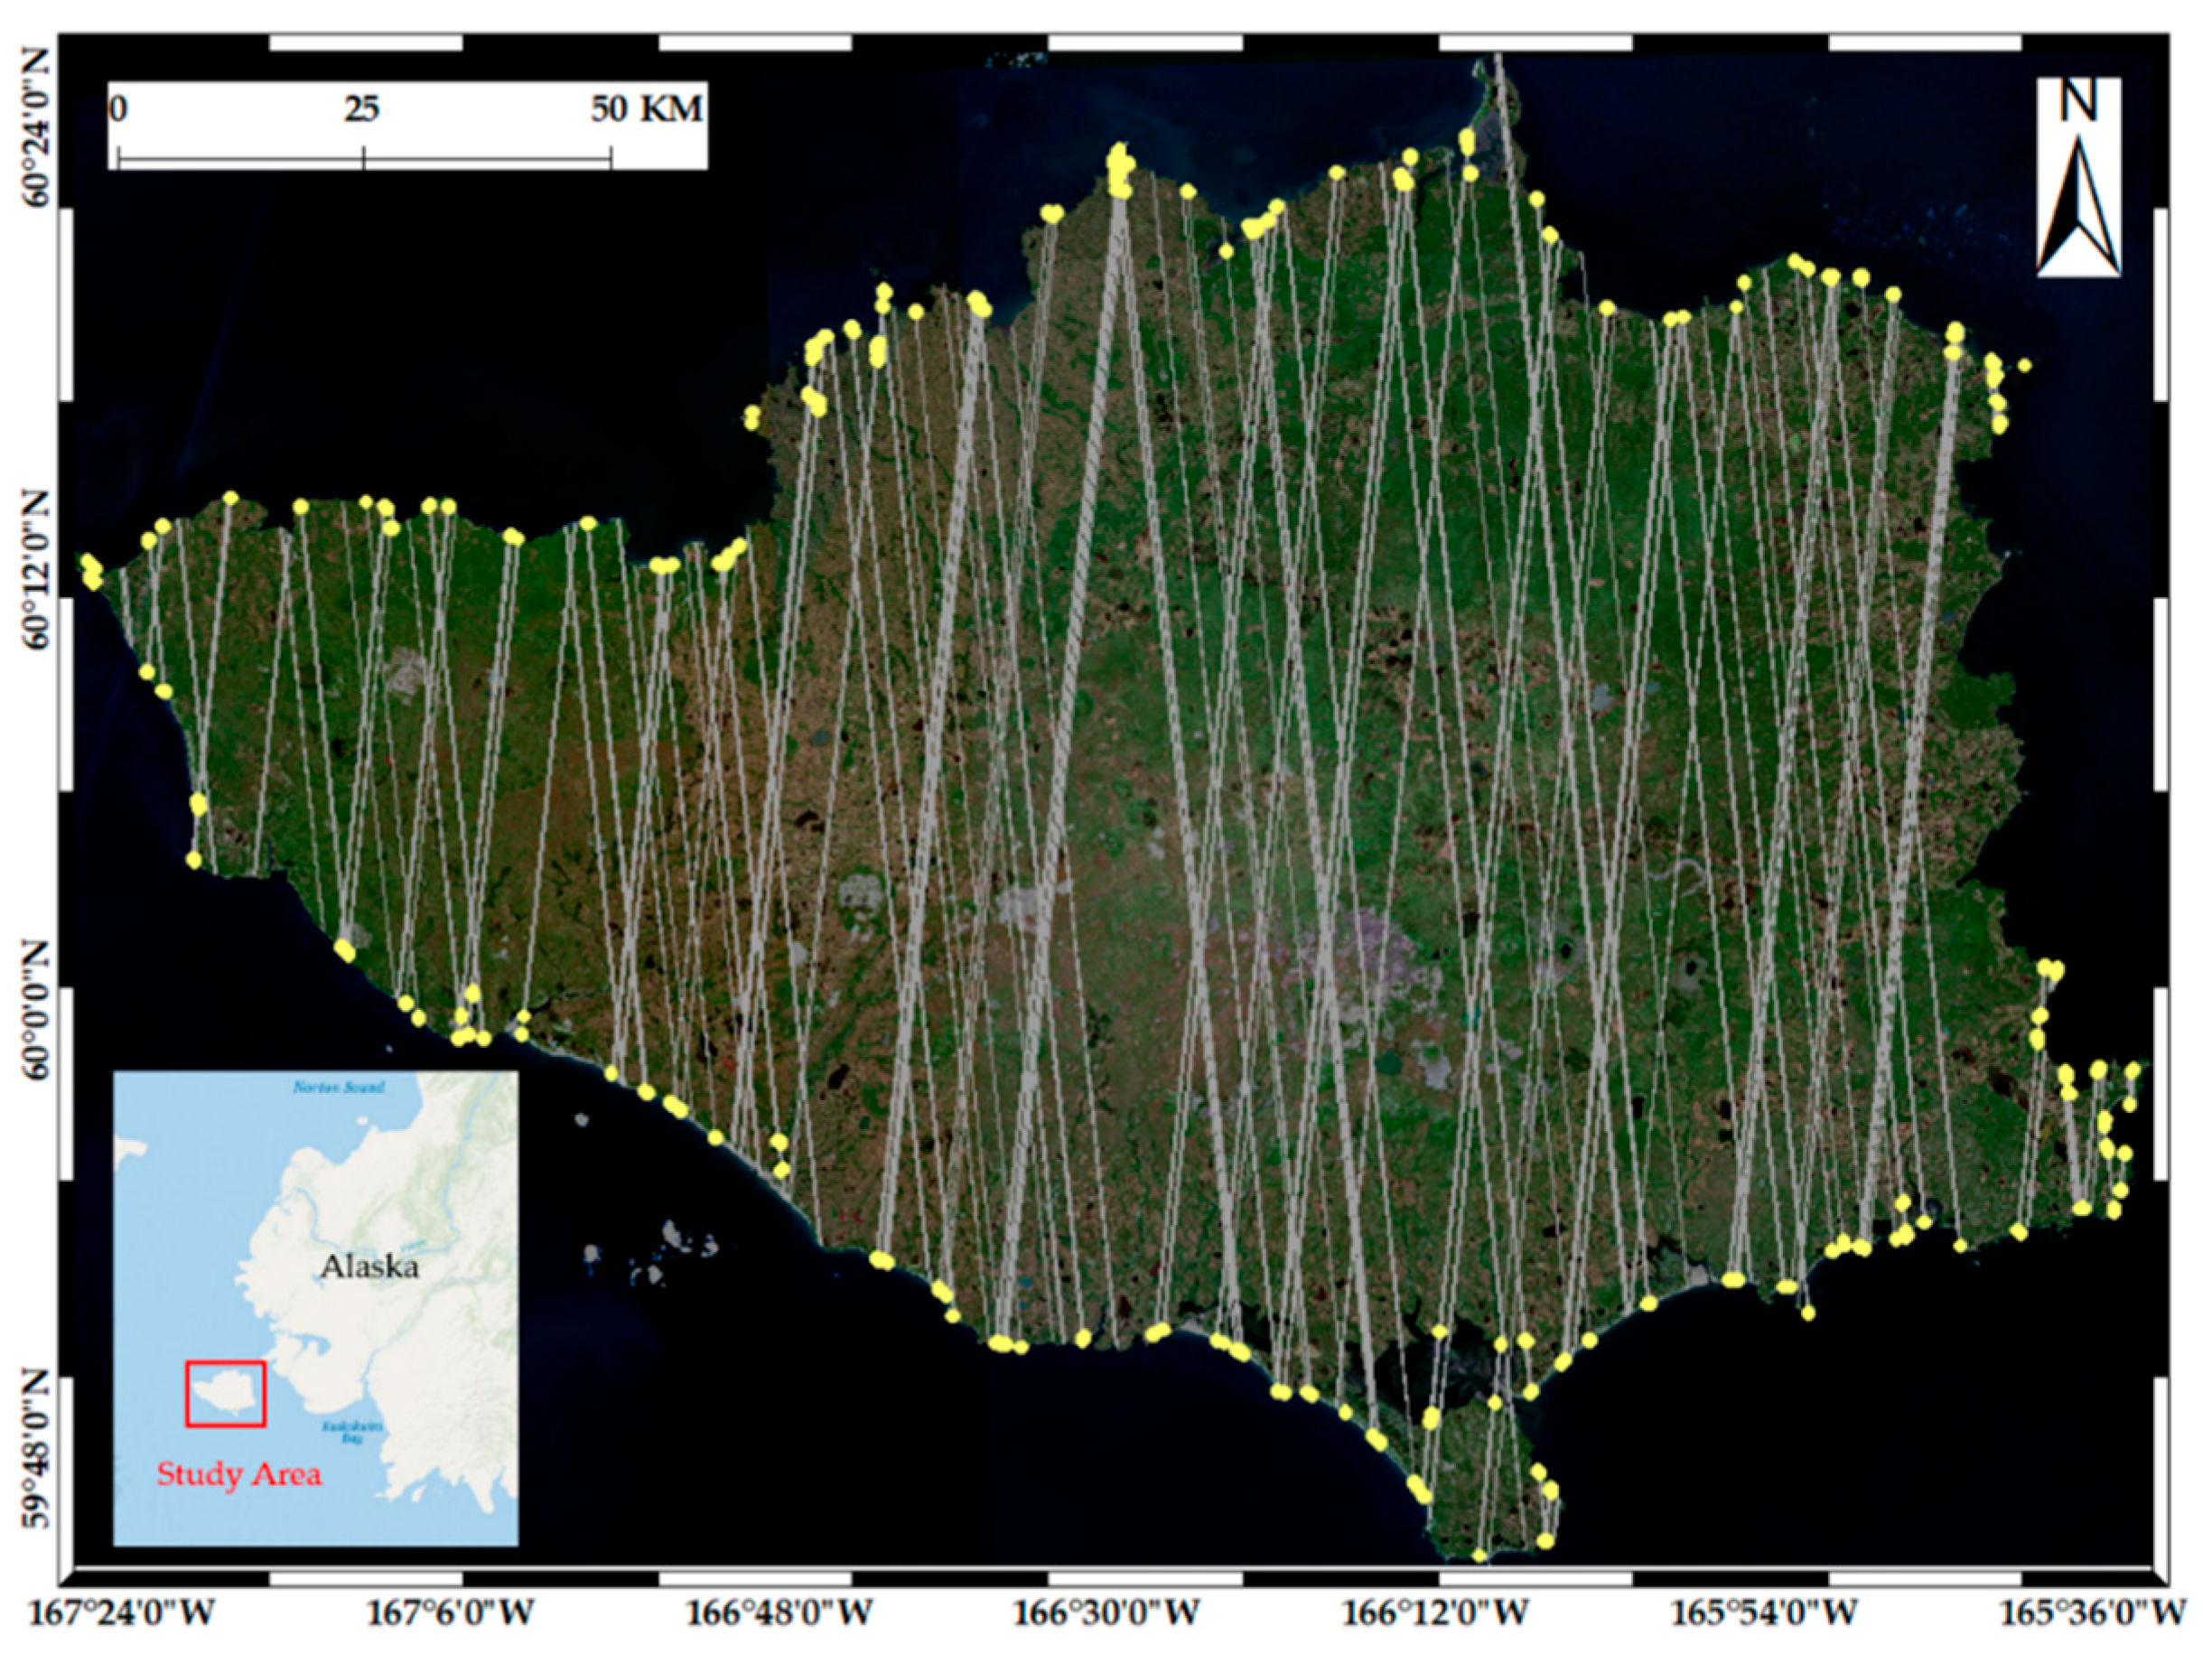
In this study, combining the new ICESat-2 LiDAR datasets and synthetic Sentinel-2 imagery, shore zone types were produced with only satellite remotely sensed data using random forest algorithms. We used statistical indicators derived from ICESat-2 photons and spectral information derived from the multispectral imagery to classify shore zones. First, we synthesized the Sentinel-2 images using the Google Earth Engine to reduce the data and smooth the tidal effects. Second, we proposed statistical characteristics to extract valid information on the shore zone from the raw photons of ICESat-2 data. Third, this method was used to classify a coastal zone of Nunivak Island and to estimate variable importance. Finally, the result performance (accuracy and consistency) was evaluated and compared with the reference data. This method is promising for rapid coastal zone classification due to its wide coverage and low-cost data acquisition.
The content and structure of this paper are organized as follows.
Section 2 presents the study area and materials.
Section 3 presents the relevant methods. The principles of sample selection are introduced. Then, the data processing and calculation methods of variables are shown. Consequently, a control experiment is designed.
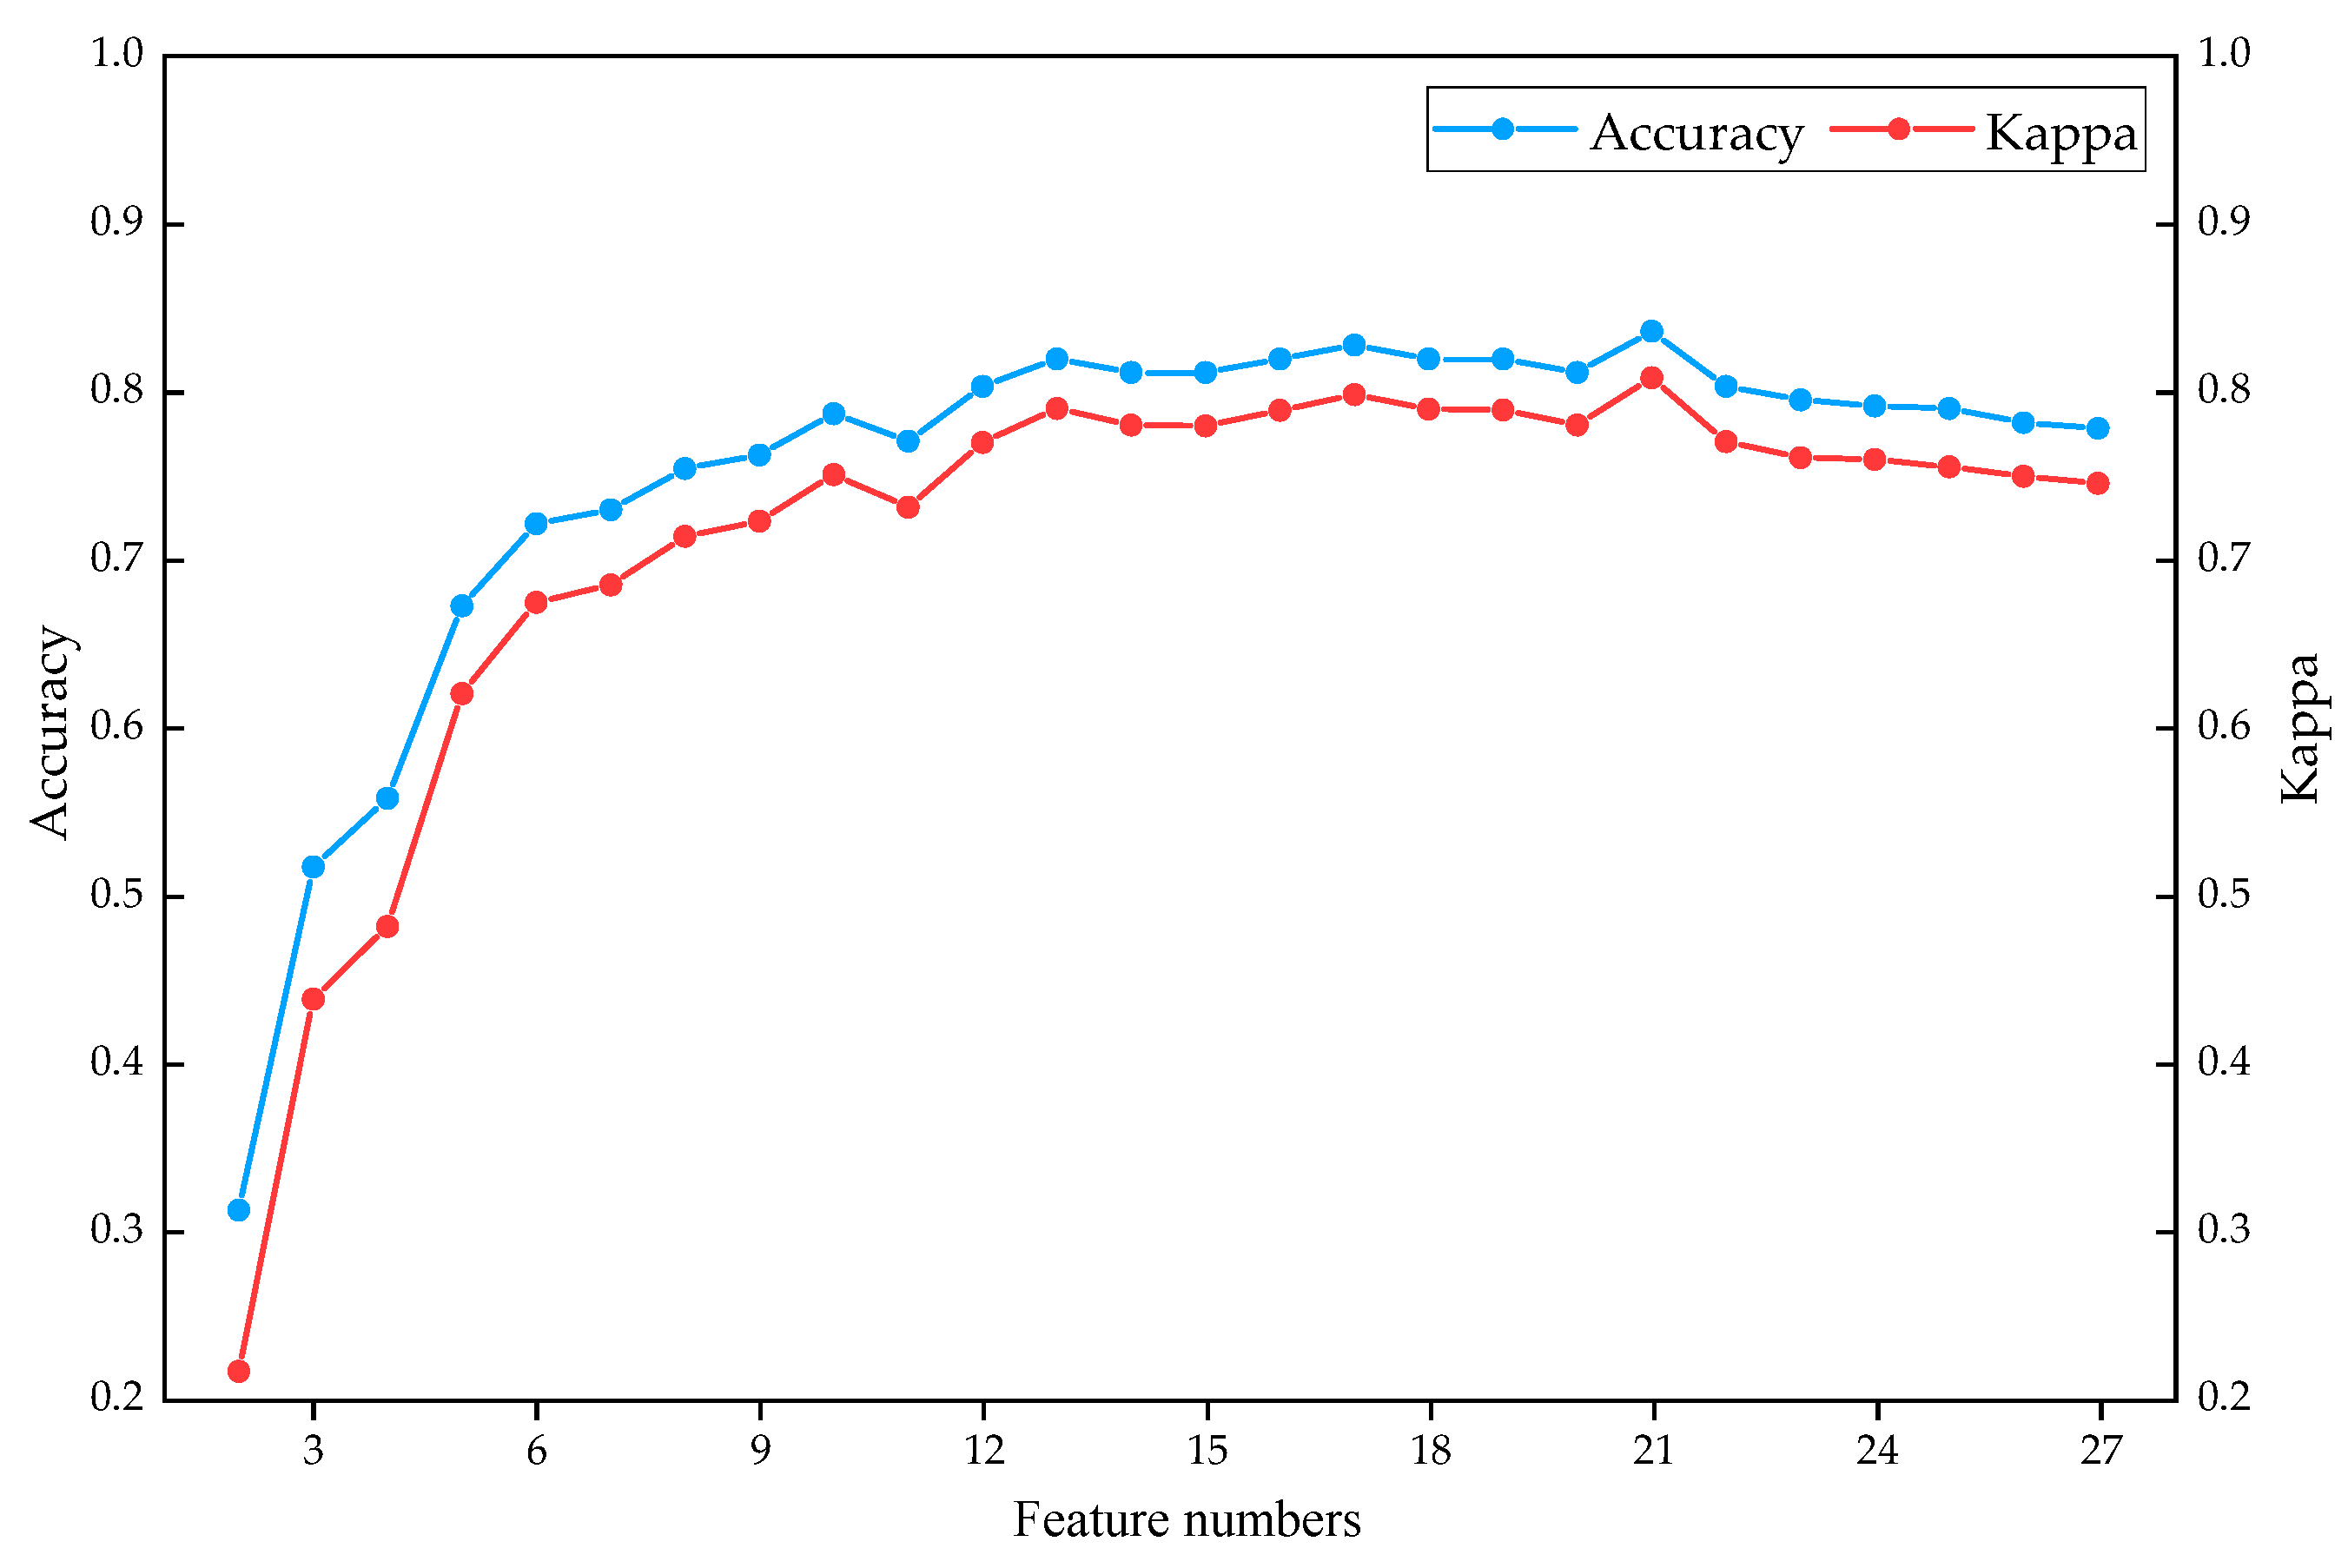
Section 4 focuses on the experimental results, showing the variable importance and the relative performance of different experiments. The discussion is presented in
Section 5, which analyzes the causes of misclassification and the advantages and limitations of the proposed method.


